The Aviation Short Investigation Bulletin covers a range of the ATSB’s short investigations and highlights valuable safety lessons for pilots, operators and safety managers.
Released periodically, the Bulletin provides a summary of the less-complex factual investigation reports conducted by the ATSB. The results, based on information supplied by organisations or individuals involved in the occurrence, detail the facts behind the event, as well as any safety actions undertaken. The Bulletin also highlights important Safety Messages for the broader aviation community, drawing on earlier ATSB investigations and research.
Issue 31 of the Bulletin features 10 safety investigations:
At the request of the Malaysian Government, Australia is leading the search for missing Malaysia Airlines Flight MH370. All the available data indicates the aircraft entered the sea close to a long but narrow arc of the southern Indian Ocean.
The underwater search is a complex operation that will involve a range of vessels, equipment and expertise to cover 60,000 square kilometres of ocean floor—roughly the size of Tasmania.
The intensified underwater search
The Australian Transport Safety Bureau (ATSB) is coordinating the continuous underwater search phase for MH370. This is expected to take up to 12 months to complete a search area of up to 60,000 square kilometres. The aim of the search is to locate the aircraft and any crucial evidence (such as aircraft wreckage and flight recorders) to assist with the Malaysian investigation.
As part of the search, the ATSB will contract experts to localise, positively identify and map the debris field of MH370 which is a Boeing 777 aircraft, using specialist equipment.
The ATSB will use data obtained from a comprehensive bathymetric survey of the search area to identify and prioritise areas of the search zone. The bathymetric survey – currently underway – will essentially provide a map of the search zone, charting the contours, depths and hardness of the ocean floor. (The ATSB factsheet Mapping the ocean floor—bathymetric survey provides greater detail on the survey operations).
Search equipment
The equipment used during the underwater search will be capable of mapping and photographing any aircraft debris and operating at depths of at least 6,000 m. It will likely include:
a towed sonar
an Autonomous Underwater Vehicle with mounted sonar
optical imaging equipment with sufficient resolution to identify the aircraft or a debris field from the aircraft.
The equipment will be deployed from a vessel(s) capable of operating in the search area for up to 12 months.
Contracted services
The ATSB will contract the services of a specialist organisation (preferably a prime contractor), to conduct the underwater search. The contractor will provide the expertise, equipment and vessel(s) to search the 60,000 square kilometre search zone, identified as being the most probable location of the missing aircraft. The vessel(s) being utilised by the prime contractor may also be coordinated, in consultation with the ATSB, with other vessel(s) also undertaking search activities in the search zone on behalf of other countries.
More information
The following ATSB factsheets, available at www.atsb.gov.au/mh370 help explain the steps involved for the underwater search:
The Australian Transport Safety Bureau (ATSB) is leading the underwater search for missing Malaysia Airlines flight MH370. All the available data indicates the aircraft entered the sea close to a long but narrow arc of the southern Indian Ocean.
The search is a complex operation that will involve a range of vessels, equipment and expertise to cover 60,000 square kilometres of ocean floor.
Bathymetric survey
During the first stage of the search, the ATSB is tasking a Chinese PLA-Navy ship to undertake a bathymetric survey of the 60,000 square kilometre search area. A contracted commercial vessel with join the survey in June. The bathymetric survey will provide a map of the underwater search zone, charting the contours, depths and hardness of the ocean floor.
While the ocean depth of the search zone is understood to be between 1000 m and 6000 m, we currently have very limited knowledge of the sea floor terrain facing the underwater search operation. The information we receive from the bathymetric survey will give us crucial data to plan and conduct the intensified underwater search.
How the survey’s done
The operation will involve a ship surveying the ocean floor using multi beam sonar, which is capable of collecting high quality data to water depths of up to 6,000 m.
Multibeam sonar is a common offshore surveying tool that uses multiple sound signals to detect the seafloor. Due to its multiple beams it is able to map a swath of the seabed under the ship, in contrast to a single beam sonar which only maps a point below the ship. Different frequencies are used to map different water depths, with higher frequencies (>100kHz) used for shallow water and low frequencies (<30 kHz) for deep water.
Generally, the multibeam sonar transducer is mounted rigidly to the hull of the survey vessel and its position can be calculated very accurately. Other parts of the multibeam system include auxiliary sensors such as motion-sensing systems and Global Positioning Systems (GPS) to ensure accurate positioning, motion sensing and sound speed measurement system.
A modern multibeam sonar transducer typically uses the Mills Cross telescope array. The sound is transmitted from transducers that are perpendicular to the survey track. Consequently, the sound pulses forms a transmit swath that is wide across-track and narrow along-track. The returning sound pulses, which are mainly recording the impedance contrast and seafloor topography, are received by the receivers which are mounted parallel to the survey track. These return beams are narrow across-track. Unlike the sidescan sonar which commonly produces only acoustic backscatter data (i.e. hardness), the multibeam sonar generates both water depth and seafloor hardness data concurrently.1
How many vessels will be involved in the survey
The Chinese PLA-Navy ship Zhu Kezhen (872) is already in the search area conducting a bathymetric survey of an area provided by the ATSB. A contracted survey vessel will arrive in the search area in early June.
How long it will take
It is expected that the bathymetric survey will take around three months to complete, but this will depend on a number of factors, such as weather conditions, during the survey operations.
The underwater search will begin when we have enough data from the bathymetric survey to start searching. This means that the underwater search will begin while the survey is still being completed.
The ATSB’s website www.atsb.gov.au/mh370 and the Joint Agency Coordination Centre website also provide information about the overall search effort for MH370.
The Aviation Short Investigation Bulletin covers a range of the ATSB’s short investigations and highlights valuable safety lessons for pilots, operators and safety managers.
Released periodically, the Bulletin provides a summary of the less-complex factual investigation reports conducted by the ATSB. The results, based on information supplied by organisations or individuals involved in the occurrence, detail the facts behind the event, as well as any safety actions undertaken. The Bulletin also highlights important Safety Messages for the broader aviation community, drawing on earlier ATSB investigations and research.
Issue 30 of the Bulletin features 12 safety investigations:
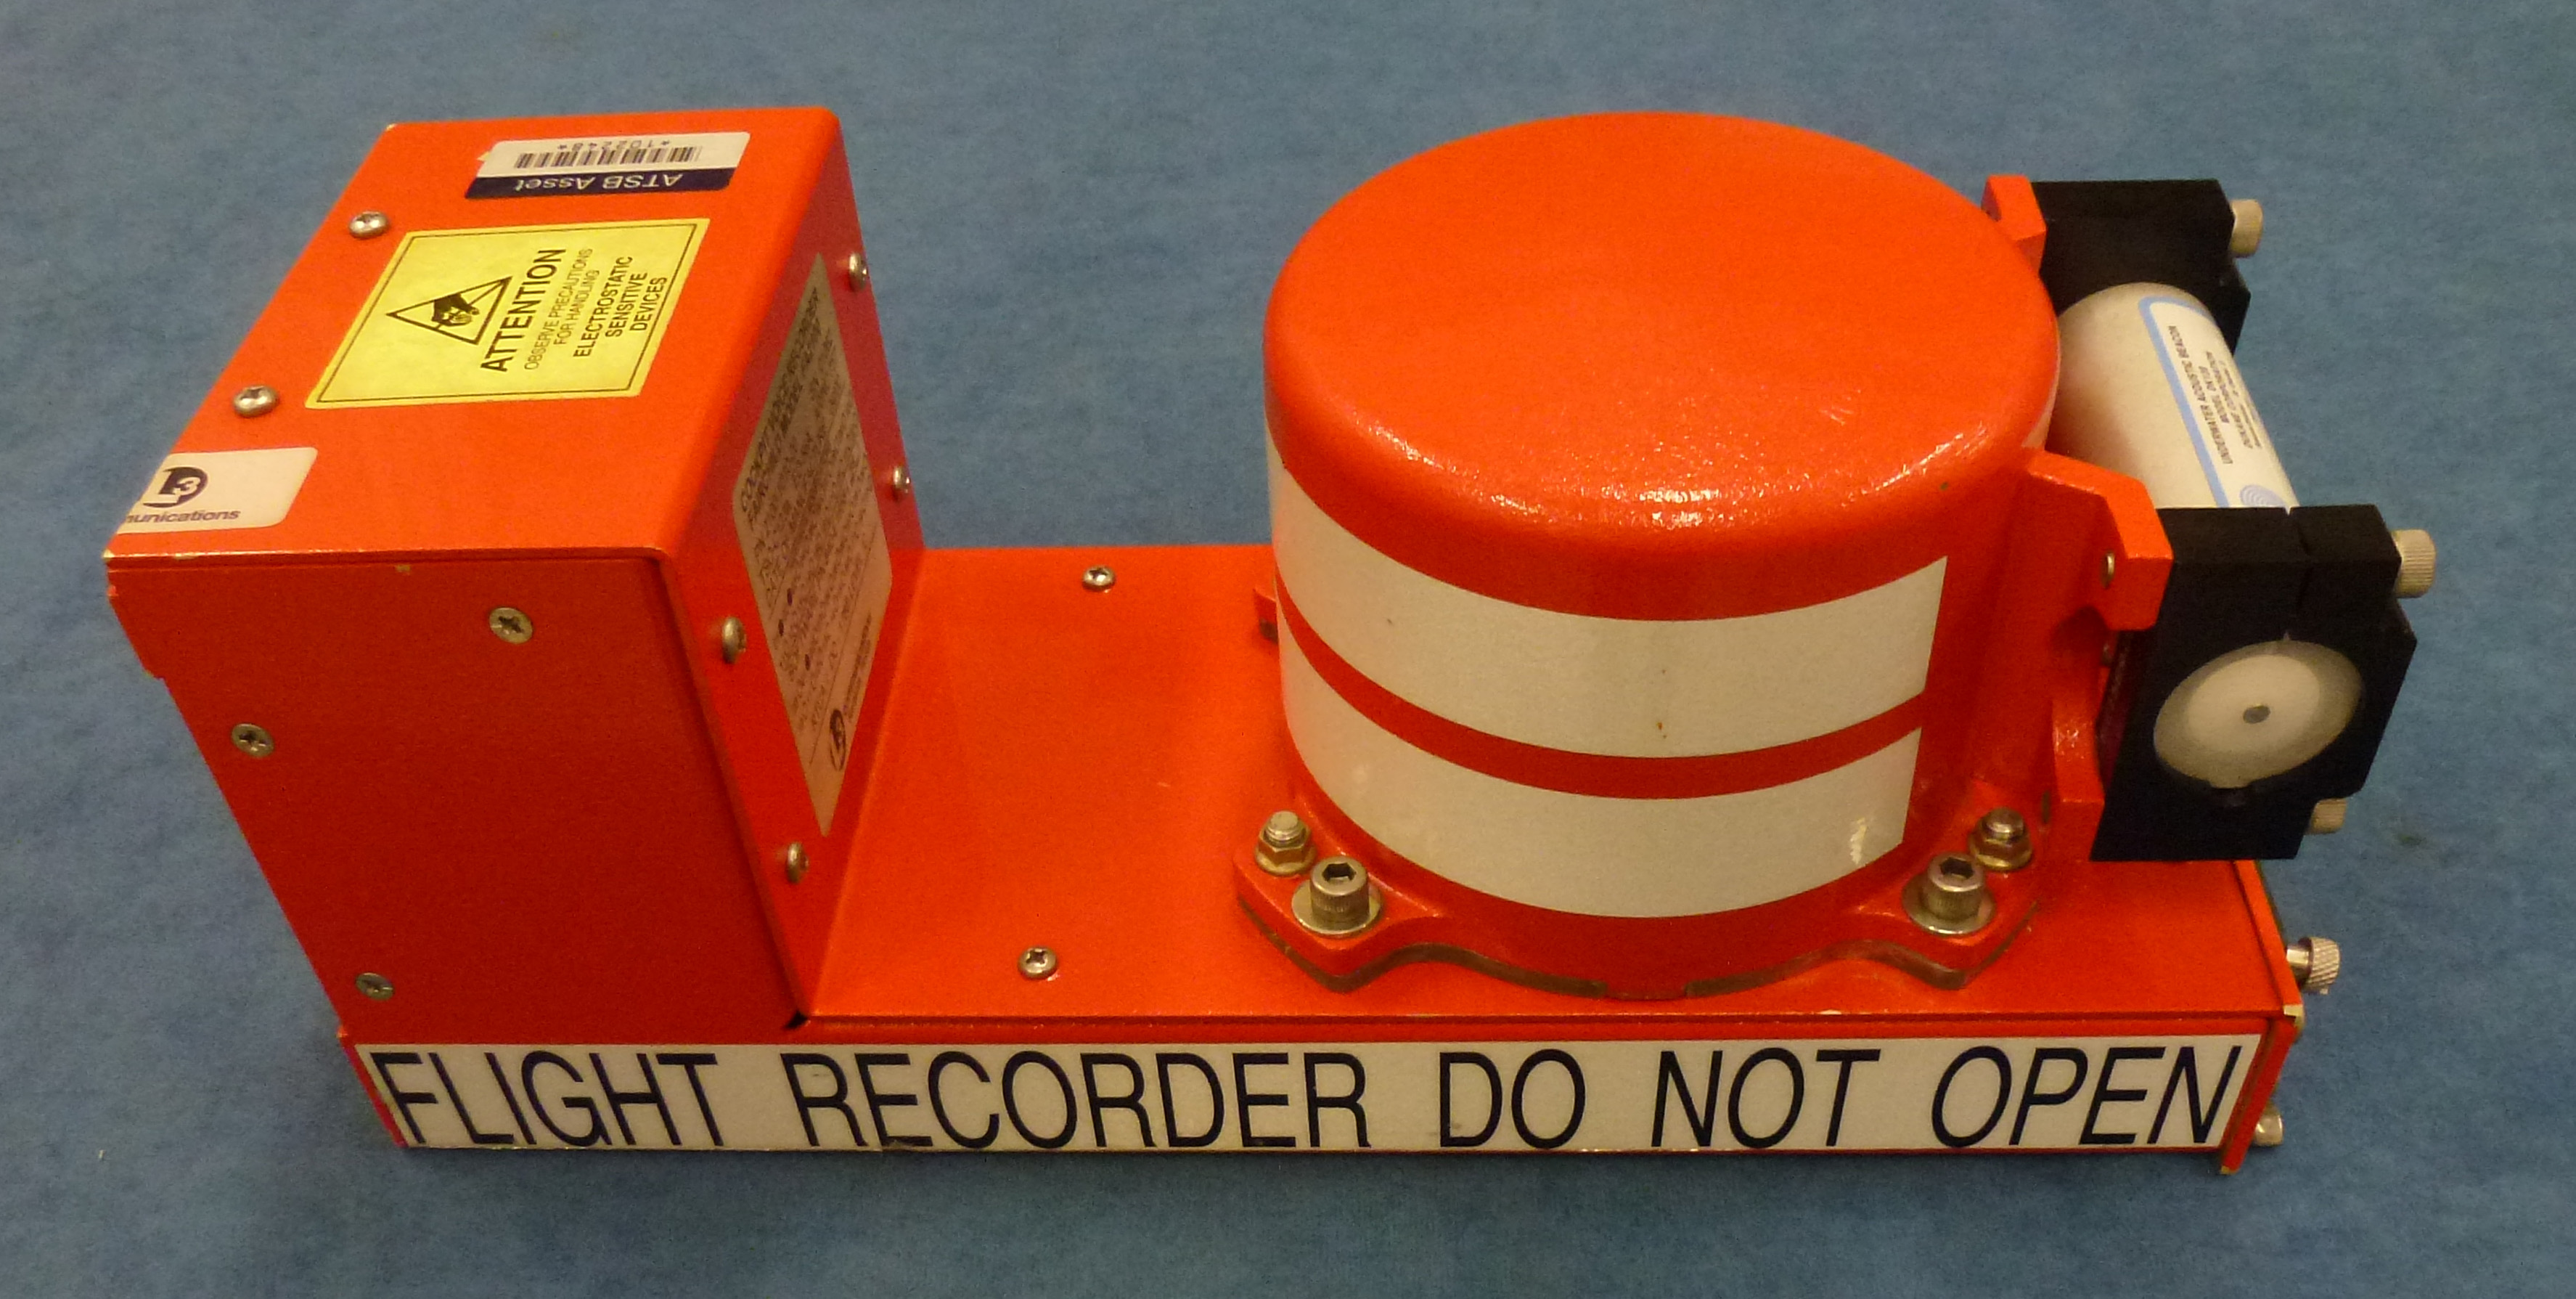
An aircraft’s flight recorders are an invaluable tool for investigators in identifying the factors behind an accident. Recorders usually comprise two individual boxes: the Cockpit Voice Recorder (CVR) and the Flight Data Recorder (FDR). Popularly known as ‘black boxes’, these flight recorders are in fact painted orange to help in their recovery following an accident.
The Cockpit Voice Recorder (CVR)
The CVR would be better named the ‘cockpit audio recorder’ as it provides far more than just the voices of the pilots. In fact, it creates a record of the total audio environment in the cockpit area. This includes crew conversation, radio transmissions, aural alarms, control movements, switch activations, engine noise and airflow noise.
Older CVRs retain the last 30 minutes of an aircraft’s flight. A modern CVR retains the last 2 hours of information. The newest data records over the oldest data (endless-loop principle).
A typical traditional CVR is 16 cm (6.3 in) in height, 12.7 cm (5.0 in) in width and 32 cm (12.6 in) in depth. It weighs 4.5 kg (10 lbs).
Around 80 per cent of aircraft accidents involve human factors, which means that crew performance may have contributed to the events. As a result, the CVR often provides accident investigators with invaluable insights into why an accident occurred.
Cockpit Voice Recorder
The Flight Data Recorder (FDR)
The FDR records flight parameters. The data recorded varies widely, depending upon the age and size of the aircraft. The minimum requirement, however, is to record a basic group of five parameters:
pressure altitude
indicated airspeed
magnetic heading
normal acceleration
microphone keying.
Microphone keying (the time radio transmissions were made by the crew) is recorded to correlate FDR data with CVR information.
This basic requirement has existed since the 1960s. Today, modern jet aircraft far exceed this, and are fitted with FDRs that can record thousands of parameters covering all aspects of the aircraft operation.
The FDR retains the last 25 hours of aircraft operation and, like the CVR, operates on the endless-loop principle. As FDRs have a longer recording duration than CVRs, they are very useful for investigating incidents and accidents.
A typical FDR is 16 cm (6.3 in) in height, 12.7 cm (5.0 in) in width and 50 cm (19.6 in) in depth. It weighs 4.8 kg (10.6 lbs).
The FDR often tells accident investigators what happened during an accident sequence and the events leading up to it.
Flight Data Recorder
Data storage
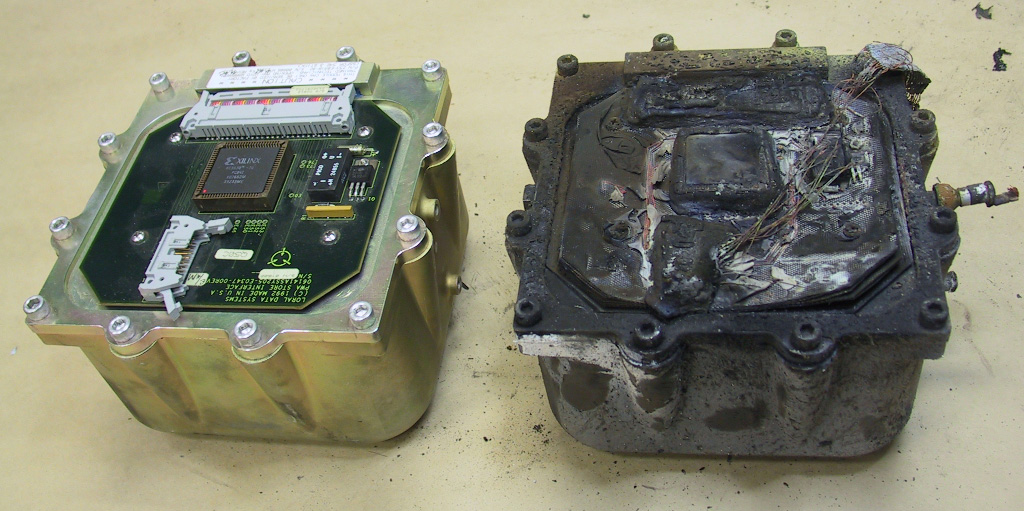
Older CVRs were analogue recorders which used magnetic tape as the recording medium. Modern solid-state CVRs, however, store the digitized audio information in memory chips.
Older FDRs were mostly digital recorders using magnetic tape as the recording medium. As with CVRs, modern solid-state FDRs store the digitized data in memory chips.
Memory chip recording medium (left) and recording medium (right)
Installation
On 10 June 1960, an accident occurred in which 29 people died in a Fokker F27 aircraft landing at Mackay in Queensland. The subsequent board of inquiry was unable to come to any definite conclusions as to what had caused the accident and recommended that all airliners be fitted with flight recorders. The Federal Government implemented this recommendation the following year.
Australia was one of the first countries to introduce this requirement. Today, all aircraft on the Australian register with a maximum take-off weight less than or equal to 5,700 kg, and which are pressurised and turbine-powered by more than one engine are required to carry a cockpit voice recorder (CVR).
All Australian-registered aircraft with a maximum take-off weight greater than 5,700 kg and turbine powered are required to carry both a CVR and FDR.
Flight recorders are normally located near the aircraft’s tail, as experience has shown that this area generally suffers the least damage during an accident.
Crashworthiness
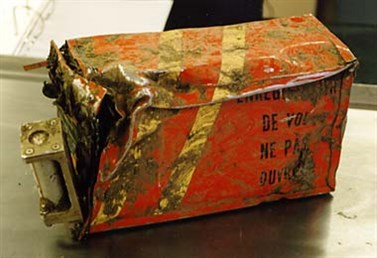
Flight recorders are designed to survive both high-speed impact and post-impact fire. They are, however, not invulnerable and are sometimes destroyed.
The recorder is designed to ensure that data, rather than the recorder itself, survives an accident. The data storage medium (tape or microchips) is mounted inside an impact-resistant and fire-resistant container.
Cockpit voice recorder received by the ATSB showing accident damage
The crashworthiness standards of flight recorders was revised in 2003 by the European Organisation for Civil Aviation Equipment (EUROCAE) committee, an international body on which the ATSB was represented. The recorder’s memory module is now required to withstand:
an impact producing a 3,400-g deceleration for 6.5 milliseconds (equivalent to an impact velocity of 270 knots and a deceleration or crushing distance of 45 cm)
a penetration force produced by a 227 kilograms (500 pounds) weight which is dropped from a height of 3 metres (10 feet)
a static crush force of 22.25 kN (5,000 pounds) applied continuously for 5 minutes
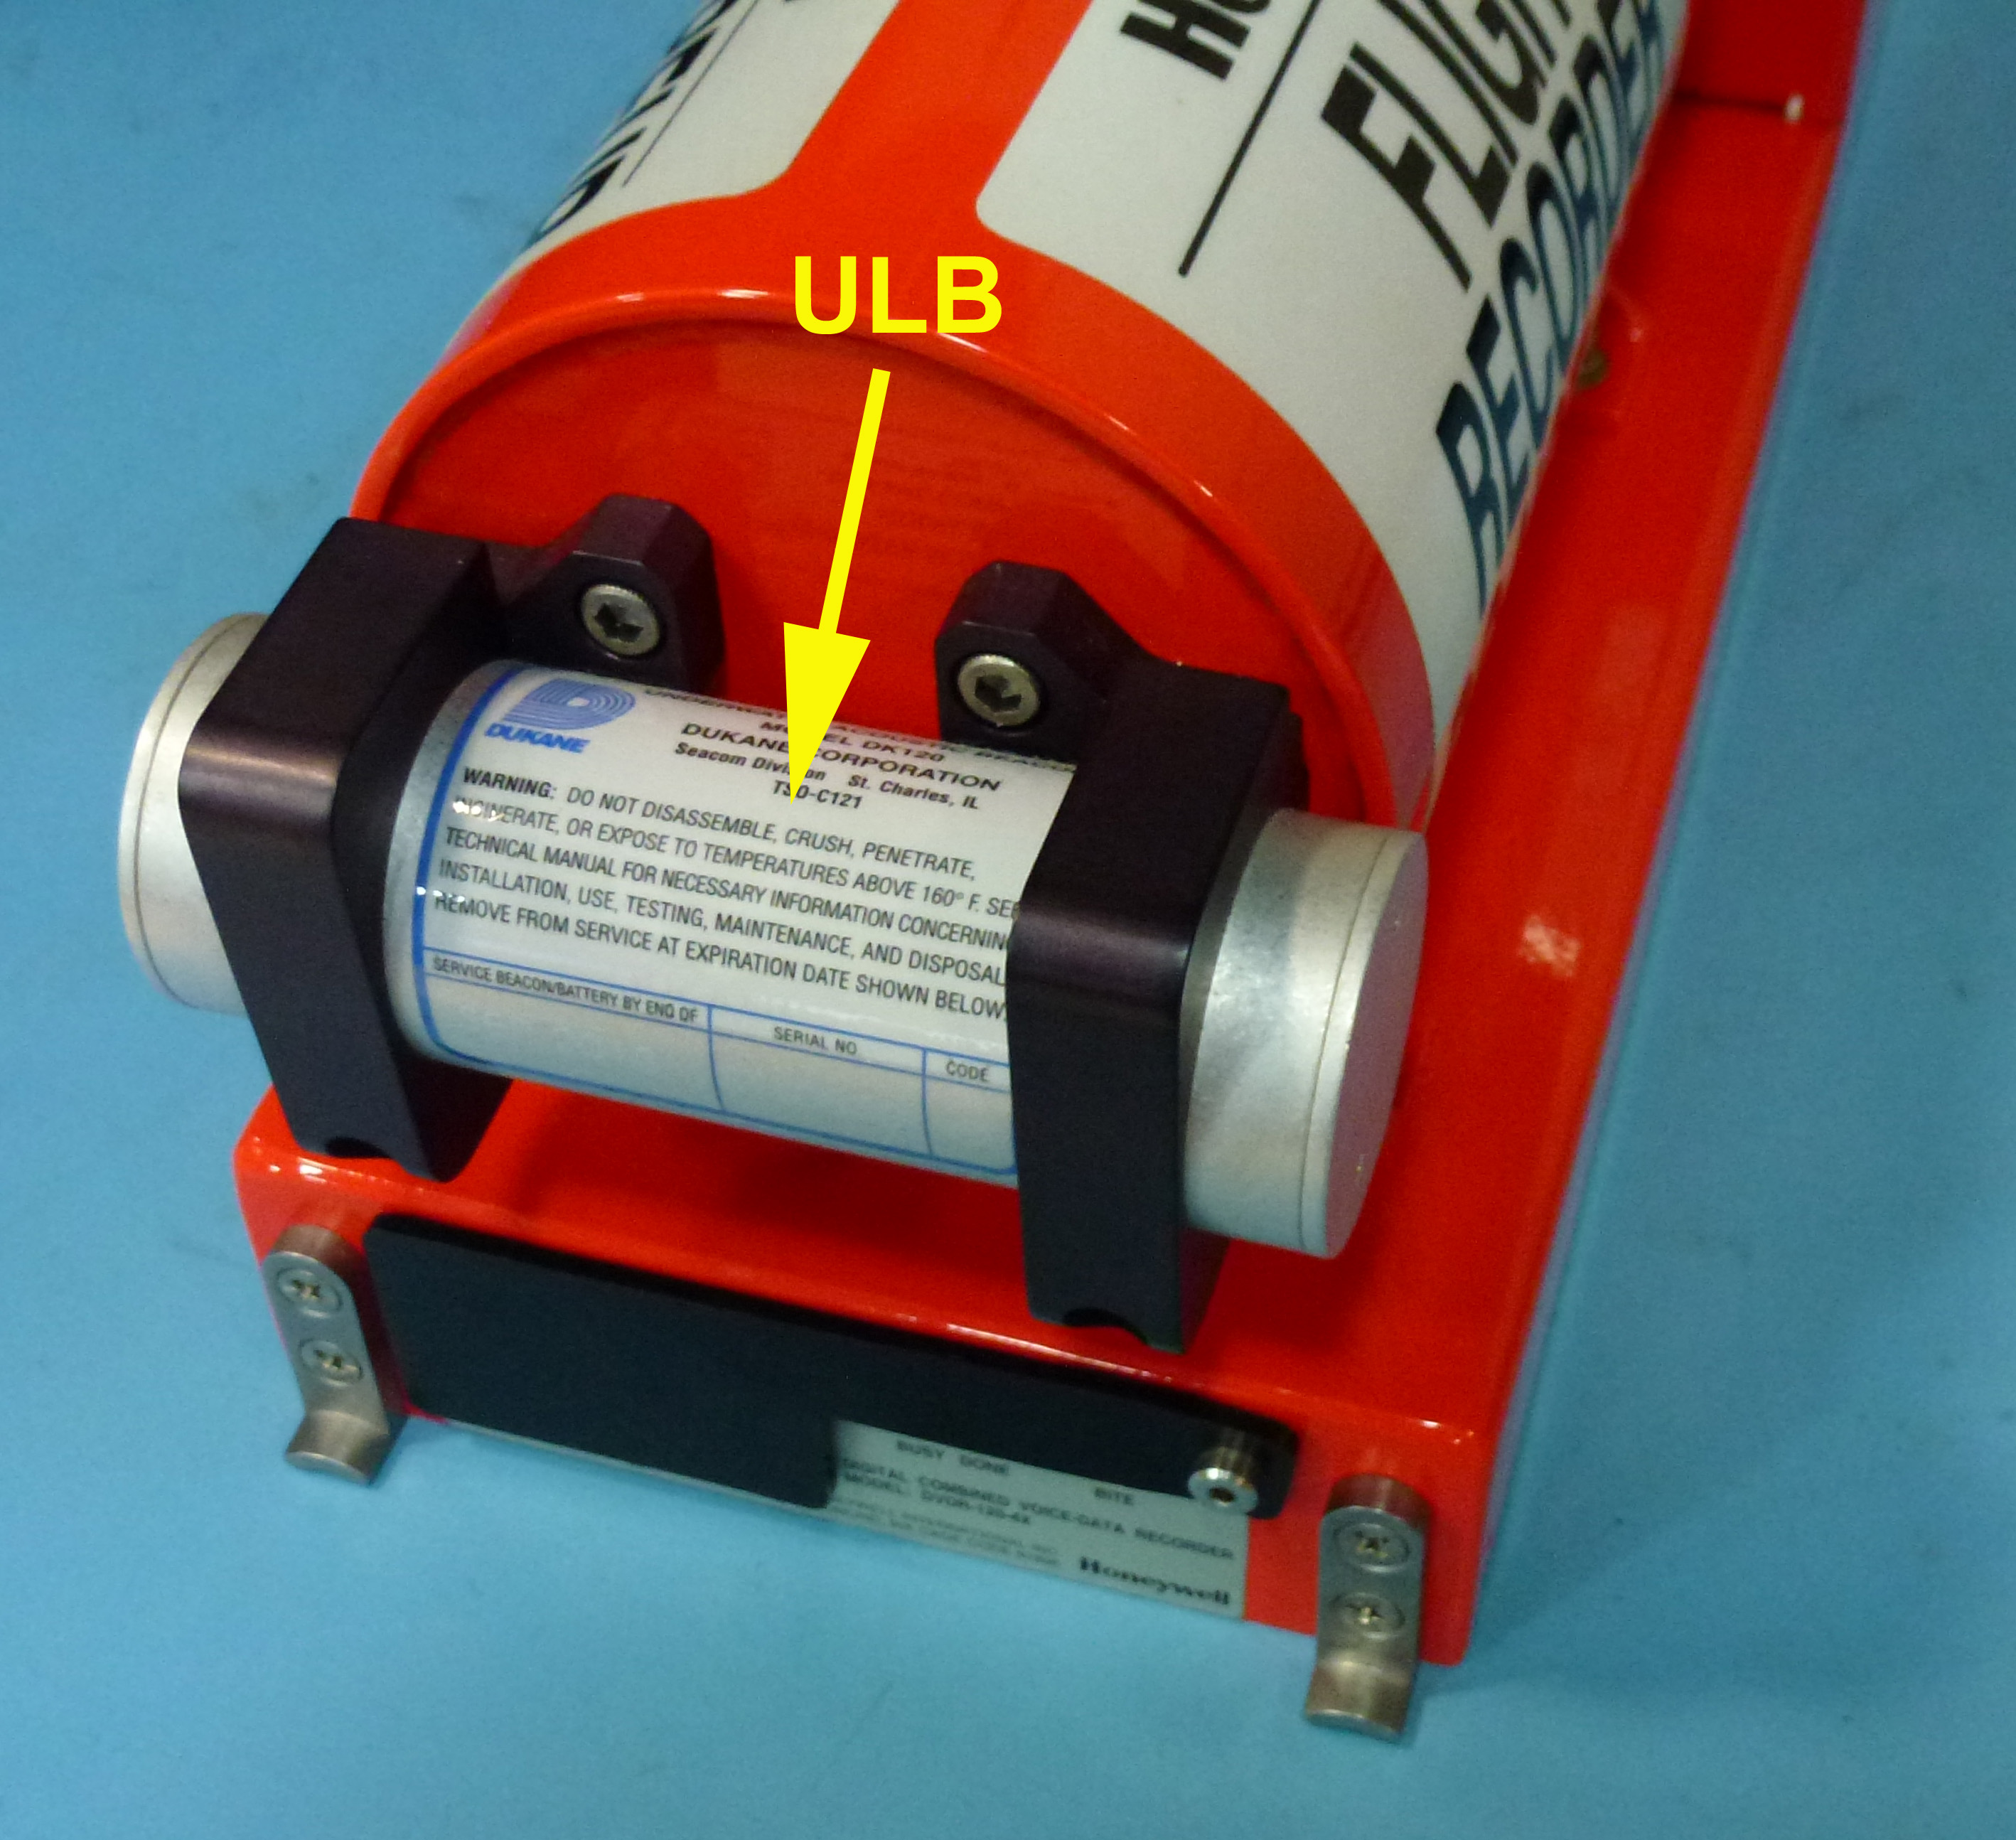
Each recorder is fitted with battery-powered Underwater Location Beacon (ULB) to aid underwater recovery.
When the ULB is immersed in water, it will begin to radiate an acoustic signal which can be received and transformed into an audible signal by a receiver. The ULB is sometimes called a 'pinger' due to the audible signal created by the receiver.
Underwater Location Beacon
The ULB must meet the following requirements:
nominal operating frequency: 37.5 kHz
size (typical): 9.95 cm long by 3.30 cm diameter
operating depth: 0 to 6,096 metres (20,000 feet)
automatic activation by both fresh and salt water
minimum operating life of 30 days. The acoustic output will decrease as the battery voltage decreases. It may be possible to still detect the ULB after 60 or more days but the detection range will be decreased.
The ULB can only be detected by a receiver under the surface of the water. The maximum detection range of a ULB is typically up to 2 to 3 kilometres but is dependent on:
ULB acoustic output level
receiver sensitivity
whether the ULB is buried by debris (e.g. aircraft structure and mud)
the ambient noise level (e.g. sea state, nearby boats, marine animals, gas and oil lines)
water temperature gradients
depth difference between the ULB and the receiver.
ATSB capability and facilities
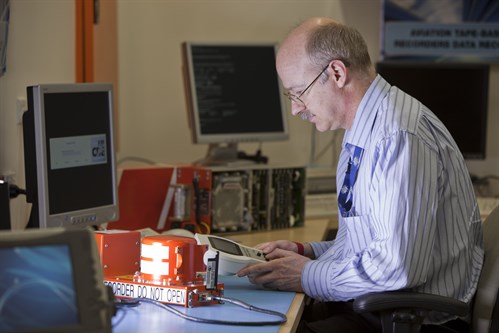
The ATSB’s central office in Canberra includes an audio laboratory and an FDR laboratory. ATSB investigators use these laboratories to perform CVR and FDR readouts for occurrences in Australia and overseas.
Australia is one of a few countries in the Asia-Pacific region to possess these types of labs. The ATSB offers its services and expertise to international investigators. In the past, the ATSB has assisted regional neighbours such as New Zealand, Indonesia, Singapore, Taiwan and Bangladesh with investigation readouts.
The ATSB also uses the labs to certify new recorder-type/aircraft-type combinations.
In addition to its recorder readout capability, the ATSB has advanced computer graphics software which allows data obtained from all available sources to be combined to create a graphical reconstruction or animation of an accident or incident.
These data sources include FDR, CVR, ground-based radar recorders, eye-witness reports, air traffic service communications and wreckage analysis. Videos can also be produced from the computer graphics. Computer graphics are a powerful tool for investigators, being an excellent means of explaining accident scenarios to people unfamiliar with aviation, and also providing a valuable educational tool for pilots and other aviation professionals.
If an accident occurred at night in a remote area or at sea, the flight recorders may be the main, if not only, means of establishing the sequence of events immediately preceding the accident. At the very least, CVR and FDR data can save an investigation team many days or weeks of delay as the team examines the wreckage.
Many accidents have involved aircraft without flight recorders, and despite thorough investigation, the factors underlying these occurrences can remain inconclusive or unknown. As well, accidents leaving very little recoverable aircraft wreckage have, many times, been resolved once the flight recorders were found.
Flight recorders are also useful for cases in which evidence is transitory, e.g. occurrences involving windshear. In such instances, flight recorders will reveal the sudden effects of windshear upon an aircraft’s flight path. The evidence available from flight recording indicates that, prior to flight-parameter recording, the effect of the wind in many aircraft accidents was underestimated.
Flight recorder data recovery
Accident animation
On 22 March 2010, an Embraer S.A. EMB-120ER Brasilia aircraft (EMB-120) crashed moments after take-off at Darwin Airport, Northern Territory. Both pilots died in the accident. The purpose of the flight was to revalidate the command instrument rating of the pilot under check. The aircraft was under the command of a training and checking captain, who occupied the copilot’s seat. The take-off included a simulated engine failure.
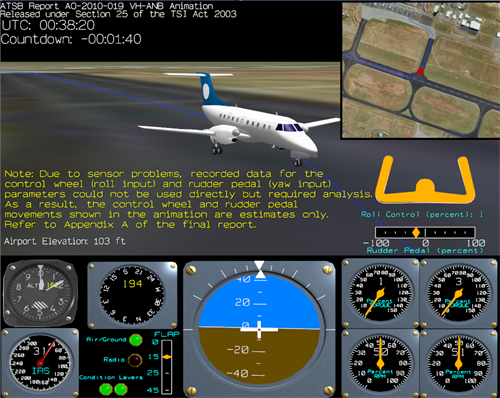
The aircraft was equipped with a CVR and an FDR which provided crucial evidence for the investigation. A computer graphics animation was produced based on the FDR data. The investigation report AO-2010-019 and animation are available at: www.atsb.gov.au
Picture of a computer graphics animation
Different types of recorders
Deployable recorders
Deployable recorders incorporate the functions of the Cockpit Voice Recorder, the Flight Data Recorder and an Emergency Locator Transmitter (ELT) into a package that is automatically deployed (released) from the aircraft at the start of an accident sequence.
The deployable package possesses capabilities that enable it to deploy and rapidly establish a flight trajectory that clears the airframe during the accident sequence. The deployable package is designed to float on water after deployment. After deployment, the deployable package starts transmitting an emergency signal that can be detected by satellite and search aircraft/ships.
Deployable recorders are mainly installed on helicopters operating over water as well as military aircraft. Commercial aeroplanes have not adopted deployable recorders.
Combined recorders
Combined recorders incorporate the functions of the Cockpit Voice Recorder and the Flight Data Recorder in one box. When combined recorders are used on an aeroplane, two combined recorders are required. One is installed near the cockpit and one installed towards the rear of the aircraft. The forward-mounted recorder has the advantage of shorter cable distances between the cockpit area and the recorder, reducing the chance of the wires being breached during an in-flight fire or breakup. Traditional rear mounted recorders maximize impact survivability.
Image recorders
Image recorders record images of all flight crew work areas including instruments and controls. The image recorder supplements existing information recorded by the Cockpit Voice Recorder and the Flight Data Recorder.
A general view of the cockpit area, instrument and control panel displays provides an insight into the cockpit environment, serviceability of displays and instruments, crew activity, and the human/machine interface.
Image recorders have not been widely adopted due to crew privacy issues and they are not installed in commercial airliners.
This report was updated on 23 October 2014 with revised hours flown data used for the calculation of occurrence rates by aircraft type.
Why did we do this research
This study has been undertaken in order to further understanding of the nature and impact of fumes and smoke related occurrences in relation to the safety of aircraft operations in Australia and, in doing so, evaluate associated data availability and suitability. This report also addresses recommendations from a 2011 report commissioned by the Civil Aviation Safety Authority (CASA) by an Expert Panel on Aircraft Air Quality that aviation safety agencies work together to provide a comprehensive study of cabin air contamination incidents.
The study was undertaken in two parts; the first involved an in-depth analysis of aviation safety data sets held by the Australian Transport Safety Bureau (ATSB), CASA and the Department of Defence for the 2008-2012 period. The second part of the study involved a basic risk analysis of smoke/fumes safety events using the bowtie risk model.
What the research found
There were over 1,000 fumes/smoke events reported to both the ATSB and CASA over the 5-year period. From a flight safety perspective, most were found to be minor in consequence. There was a single flight crew incapacitation event and a further 11 minor injury events to crew. In the higher risk occurrences, precautionary defences (most commonly diversions) were found to be effective in avoiding escalation of the event.
The British Aerospace BAe 146 was the aircraft type most commonly involved in fumes/smoke events when taking into account flying activity. The Airbus A380, Boeing 767, Embraer EMB-120 and E-190 were among other aircraft types that also had a higher-than-average rate of fumes/smoke occurrences over the period.
The most common source of fumes/smoke was aircraft systems issues, primarily relating to failure or malfunction of electrical and auxiliary power unit (APU) systems. Equipment and furnishings also featured highly as a source of fumes and smoke. Within this category, air conditioning and galley equipment were the most common sources of fumes/smoke. External sources of fumes/smoke and cargo/baggage related events were relatively rare.
The matching of CASA and ATSB data records provided valuable information on the issue of fumes/smoke which enabled visibility of occurrences from both an engineering and operational perspective. However, many reports of fumes/smoke events contained insufficient detail for coding of the source or affected components.
Safety message
Fume and smoke events are generally appropriately managed by flight and cabin crew resulting in little consequence. Good reporting by aircraft operators, with sufficient detail, to both the ATSB and CASA where relevant will assist ongoing efforts to monitor the risk of fume and smoke events.
The Aviation Short Investigation Bulletin covers a range of the ATSB’s short investigations and highlights valuable safety lessons for pilots, operators and safety managers.
Released periodically, the Bulletin provides a summary of the less-complex factual investigation reports conducted by the ATSB. The results, based on information supplied by organisations or individuals involved in the occurrence, detail the facts behind the event, as well as any safety actions undertaken. The Bulletin also highlights important Safety Messages for the broader aviation community, drawing on earlier ATSB investigations and research.
Issue 28 of the Bulletin features 11 safety investigations:
The Aviation Short Investigation Bulletin covers a range of the ATSB’s short investigations and highlights valuable safety lessons for pilots, operators and safety managers.
Released periodically, the Bulletin provides a summary of the less-complex factual investigation reports conducted by the ATSB. The results, based on information supplied by organisations or individuals involved in the occurrence, detail the facts behind the event, as well as any safety actions undertaken. The Bulletin also highlights important Safety Messages for the broader aviation community, drawing on earlier ATSB investigations and research.
Issue 27 of the Bulletin features 11 safety investigations:
High in the sky, as you are cruising to your destination, the seat belt sign goes on. As you look out the window, there are no clouds for kilometres. What could you possibly run into at this height? Turbulence – a frequently invisible problem for aircraft.
Turbulence is a weather phenomenon responsible for the abrupt sideways and vertical jolts that passengers often experience during flights, and is the leading cause of in-flight injuries to passengers and cabin crew.
Turbulence is caused by the irregular movement of air, and often cannot be seen. When air masses with different speeds, direction or temperatures meet each other – such as a warm or cold front, a thunderstorm, air flowing over or around mountains, or near jet streams – turbulence is likely to occur.
How serious is turbulence?
While turbulence is normal and occurs frequently, it can be dangerous. Turbulence by its nature is unpredictable – occurring without warning, and ranging from a few minor bumps to a major shake-up. Aircraft can handle even severe turbulence, and are designed to flex with the bumps and jolts. Turbulence is usually more severe in the cabin than in the cockpit.
Turbulence is rarely a threat to passenger aircraft or to pilot control of the aircraft.
So why do you need to be prepared for turbulence? While your aircraft is designed to take turbulence, your body is not.
In a typical turbulence incident, 99 per cent of people on board receive no injuries. However, the bumpy ride can cause passengers and cabin crew who are not wearing their seat belts to be thrown around without warning. About 25 in-flight turbulence injuries are reported in Australia each year to the Australian Transport Safety Bureau (ATSB), and many more go unreported. Some of these injuries are serious, and have resulted in broken bones and head injuries.
An ATSB report found that passengers being thrown up and out of their seat during turbulence was the second most common type of head injury on aircraft.
For the five-year period 2009 to 2013, there 677 turbulence occurrences on flights in, to or from Australia that were reported to the ATSB, with 197 minor injuries and 2 serious injuries to passengers and cabin crew. The United States Federal Aviation Administration (FAA) estimates that the cost to the worldwide aviation industry of turbulence injuries is over US$100 million annually, and growing.
If you travel by air, you need to take turbulence seriously.
The Aviation Short Investigation Bulletin covers a range of the ATSB’s short investigations and highlights valuable safety lessons for pilots, operators and safety managers.
Released periodically, the Bulletin provides a summary of the less-complex factual investigation reports conducted by the ATSB. The results, based on information supplied by organisations or individuals involved in the occurrence, detail the facts behind the event, as well as any safety actions undertaken. The Bulletin also highlights important Safety Messages for the broader aviation community, drawing on earlier ATSB investigations and research.
Issue 26 of the Bulletin features 9 safety investigations: