

Overview
On 8 March 2014, a Boeing 777 aircraft, operated as Malaysia Airlines flight 370 (MH370), was lost during a flight from Kuala Lumpur in Malaysia to Beijing in the People’s Republic of China, carrying 12 crew and 227 passengers.
Under Annex 13 to the Convention on International Civil Aviation “Aircraft Accident and Incident Investigation”, Malaysia, as the state of registry and operation of MH370, had investigative responsibility for the missing aircraft. At the request of the Malaysian Government, the Australian Government accepted responsibility for initial search and recovery operations in the southern part of the Indian Ocean on 17 March 2014.
In accordance with paragraphs 5.23 and 5.24 of Annex 13, on 1 April 2014, the ATSB appointed an accredited representative to the investigation, along with a number of advisors (ATSB investigators). These investigators’ work was undertaken as part of an External Investigation (AE-2014-054) under the provisions of the Australian Transport Safety Investigation Act 2003. The ATSB accredited representative and advisors provided support to the Malaysian ICAO Annex 13 Safety Investigation Team for MH370 (MIASIT).
On 31 March 2014, the Malaysian Government accepted the Government of Australia’s offer to lead the search and recovery operation in the southern Indian Ocean in support of the Malaysian accident investigation. On 28 April 2014, the surface search for MH370 coordinated by the Australian Maritime Safety Authority (AMSA) was concluded and the Australian Transport Safety Bureau (ATSB) assumed responsibility for conducting the underwater search for the aircraft.
ATSB assistance and expertise was provided through the accredited representative mechanism of Annex 13, under AE-2014-054.
On 2 July 2018, the MIASIT submitted its investigation report to the Malaysian Ministry of Transport (MOT). It was released on 30 July 2018, at which point the ATSB’s work in support of Malaysia’s Annex 13 investigation was finalised.
The sections on this webpage below detail ATSB reports and updates publicly released as part of AE-2014-054.
Operational search for MH370 final report
Report release date: 03/10/2017
Executive summary
On 8 March 2014, a Boeing 777 aircraft operated as Malaysia Airlines flight 370 (MH370) was lost during a flight from Kuala Lumpur in Malaysia to Beijing in the People’s Republic of China carrying 12 crew and 227 passengers. The search for the missing aircraft commenced on 8 March 2014 and continued for 1,046 days until 17 January 2017 when it was suspended in accordance with a decision made by a tripartite of Governments, being Malaysia, Australia and the People’s Republic of China.
The initial surface search and the subsequent underwater search for the missing aircraft have been the largest searches of their type in aviation history. The 52 days of the surface search involving aircraft and surface vessels covered an area of several million square kilometres. A sub surface search for the aircraft’s underwater locator beacons was also conducted during the surface search.
The underwater search started with a bathymetry survey which continued as required throughout the underwater search and has mapped a total of 710,000 square kilometres of Indian Ocean seafloor, the largest ever single hydrographic survey. The high resolution sonar search covered an area in excess of 120,000 square kilometres, also the largest ever search or survey of its kind. Despite the extraordinary efforts of hundreds of people involved in the search from around the world, the aircraft has not been located.
Regardless of the cause of the loss of MH370, there were no transmissions received from the aircraft after the first 38 minutes of the flight. Systems designed to automatically transmit the aircraft’s position including the transponder and the aircraft communications addressing and reporting system failed to transmit the aircraft’s position after this time period. Subsequent analysis of radar and satellite communication data revealed the aircraft had actually continued to fly for a further seven hours. Its last position was positively fixed at the northern tip of Sumatra by the surveillance systems operating that night, six hours before it ended the flight in the southern Indian Ocean.
The challenge which faced those tasked with the search was to trace the whereabouts of the aircraft using only the very limited data that was available. This data consisted of aircraft performance information and satellite communication metadata initially, and then later during the underwater search, long-term drift studies to trace the origin of MH370 debris which had been adrift for more than a year, and in some cases, more than two years. The types of data, and the scientific methods used for its analysis, were never intended to be used to track an aircraft or pin point its final location.
On 28 April 2014, the surface search for MH370 coordinated by the Australian Maritime Safety Authority (AMSA) was concluded and the Australian Transport Safety Bureau (ATSB) assumed responsibility for conducting the underwater search for the aircraft. The underwater search area was initially defined at 60,000 square kilometres, and was increased in April 2015 when the Tripartite Governments (Malaysia, Australia and the People’s Republic of China) agreed to expand the search area to 120,000 square kilometres. The primary objective of the underwater search was to establish whether or not the debris field of the missing aircraft was in the area of seafloor defined by expert analysis of the aircraft’s flight path and other information. If a debris field was located, the search needed to confirm the debris was MH370 by optical imaging, and then map the debris field to enable planning for a subsequent recovery operation.
Once underwater search operations commenced in October 2014, the MH370 debris field could potentially have been located at any time. A recovery operation would need to have commenced as soon as possible after the debris field was located and the Tripartite governments had agreed on the next steps. The ATSB's role was therefore to also put in place the arrangements and plans necessary for a rapid recovery operation to occur at short notice.
The underwater search applied scientific principles to defining the most probable area to be searched through modelling the aircraft’s flight path and behaviour at the end of the flight. The flight path modelling was based on unique and sophisticated analysis of the metadata associated with the periodic automated satellite communications to and from the aircraft in the final six hours of the flight. The end-of-flight behaviour of the aircraft, when MH370 was considered to have exhausted its fuel, has been analysed and simulated.
In 2015 and 2016, debris from MH370 was found on the shores of Indian Ocean islands and the east African coastline. The debris yielded significant new insights into how and where the aircraft ended its flight. It was established from the debris that the aircraft was not configured for a ditching at the end-of-flight. By studying the drift of the debris and combining these results with the analysis of the satellite communication data and the results of the surface and underwater searches, a specific area of the Indian Ocean was identified which was more likely to be where the aircraft ended the flight.
The understanding of where MH370 may be located is better now than it has ever been. The underwater search has eliminated most of the high probability areas yielded by reconstructing the aircraft’s flight path and the debris drift studies conducted in the past 12 months have identified the most likely area with increasing precision. Re-analysis of satellite imagery taken on 23 March 2014 in an area close to the 7th arc has identified a range of objects which may be MH370 debris. This analysis complements the findings of the First Principles Review and identifies an area of less than 25,000 square kilometres which has the highest likelihood of containing MH370.
The ATSB’s role coordinating the underwater search involved the procurement and management of a range of sophisticated and highly technical services. Management of the underwater search was aimed at ensuring high confidence in the acquisition and analysis of the sonar search data so that areas of the seafloor which had been searched could be eliminated. A comprehensive program was implemented to ensure the quality of the sonar coverage. A thorough sonar data review process was used to ensure areas of potential interest were identified and investigated.
During the early stages of the procurement, careful consideration was given to the methods available for conducting a large scale search of the seafloor. Water depths were known to be up to 6,000 m with unknown currents and unknown seafloor topography. Search operations would also have to be conducted in poor weather conditions and in a very remote area far from any land mass. Planning focused on selecting a safe, efficient and effective method to search the seafloor in an operation with an indeterminate timeframe.
The mapping of the seafloor in the search area revealed a challenging terrain for the underwater search which used underwater vehicles operating close to the seafloor. While the deep tow vehicles selected as the primary search method proved to be very effective, the seafloor terrain necessitated the use of a range of search methods including an autonomous underwater vehicle to complete the sonar coverage.
The underwater search area was located up to 2,800 km west of the coast of Western Australia and the prevailing weather conditions in this area for much of the year are challenging. Crews on the search vessels were working for months at a time in conditions which elevated the operational risks. The ATSB ensured that these risks to the safety of the search vessels and their crews were carefully managed.
At the time the underwater search was suspended in January 2017, more than 120,000 square kilometres of seafloor had been searched and eliminated with a high degree of confidence. In all, 661 areas of interest were identified in the sonar imagery of the seafloor. Of these areas, 82 with the most promise were investigated and eliminated as being related to MH370. Four shipwrecks were identified in the area searched.
The intention of this report is to document the search for MH370, in particular, the underwater search including; where the search was conducted (and why), how the search was conducted, the results of the search and the current analysis which defines an area where any future underwater search should be conducted. The report also includes a safety analysis which is focused on the search rather than on discussing the range of factors which may have led to the loss of the aircraft.
The Government of Malaysia is continuing work on their investigation of the facts and circumstances surrounding the loss of MH370 aircraft consistent with their obligations as a member State of ICAO. The Malaysian investigation is being conducted in accordance with the provisions of ICAO Annex 13, Aircraft Accident and Incident Investigation.
The search, recovery and investigation of the loss of Air France flight AF447, in the South Atlantic Ocean in 2009, and the loss of MH370 have led to some important learnings related to locating missing aircraft on flights over deep ocean areas. Requirements and systems for tracking aircraft have been enhanced and will continue to be enhanced. Steps are being taken to advance other aircraft systems including emergency locator transponders and flight recorder locator beacons.
The ATSB acknowledges the extraordinary efforts of the hundreds of dedicated professionals from many organisations in Australia and around the world who have contributed their time and efforts unsparingly in the search for MH370.
The reasons for the loss of MH370 cannot be established with certainty until the aircraft is found. It is almost inconceivable and certainly societally unacceptable in the modern aviation era with 10 million passengers boarding commercial aircraft every day, for a large commercial aircraft to be missing and for the world not to know with certainty what became of the aircraft and those on board.
The ATSB expresses our deepest sympathies to the families of the passengers and crew on board MH370. We share your profound and prolonged grief, and deeply regret that we have not been able to locate the aircraft, nor those 239 souls on board that remain missing.
| Download the report PDF to read the report in full. See link in sidebar. |
First principles review
Report release date: 20/12/2016
Executive summary
This report documents the proceedings and outcomes of the First Principles Review meeting on the search for missing Malaysia Airlines flight MH370 held in Canberra from 2 to 4 November 2016. Participants consisted of experts in data processing, satellite communications, accident investigation, aircraft performance, flight operations, sonar data, acoustic data and oceanography. The purpose of the meeting was to reassess and validate existing evidence and to identify any new analysis that may assist in identifying the location of the missing aircraft.
Throughout the search, the ATSB has issued several reports updating the definition of the search area based on analysis progressively refined, or when new information has come to light. This document complements those reports and provides a summary of the detailed analysis of the satellite data combined with new evidence derived from the modelling of the drift of debris from the aircraft.
The experts attending the meeting considered:
- The results of the search to date.
- Satellite communication metadata and its analysis including methodology, assumptions, limitations, the probability distributions of possible flight paths, and validation results.
- Results from simulations and the aircraft manufacturer’s analysis of aircraft performance.
- The width of the search area based on what is known about the end of the flight.
- Hydro-acoustic analysis potentially relevant to the search.
- Failure analysis of recovered debris.
- Drift analysis of aircraft debris.
For background information, please refer to the previous ATSB publications available online at www.atsb.gov.au/mh370
The updated independent analysis of the satellite data and the drift analysis consistently identified the most likely impact location of MH370 as being close to the 7th arc[1] (within ~25 NM) and bounded by latitudes of approximately 33°S to 36°S.
There is a high degree of confidence that the previously identified underwater area searched to date does not contain the missing aircraft. Given the elimination of this area, the experts identified an area of approximately 25,000 km² as the area with the highest probability of containing the wreckage of the aircraft. The experts concluded that, if this area were to be searched, prospective areas for locating the aircraft wreckage, based on all the analysis to date, would be exhausted.
------
[1] The 7th arc is an arc of possible aircraft positions, equidistant from Inmarsat’s Indian Ocean Region satellite, where the accident aircraft made the final series of satellite communications transmissions. It is the key datum in the search for MH370 and its derivation is described in previous ATSB search area definition reports.
| Download the report PDF to read the report in full. See link in sidebar. |
Search and debris examination update
Report release date: 02/11/2016
Executive summary
This report provides an update to the MH370 search area definition described in previous ATSB reports. It comprises further analysis of satellite data, additional end of flight simulations, a summary of the analysis of the right outboard wing flap, and preliminary results from the enhanced debris drift modelling.
For background information, please refer to the ATSB publications available online at www.atsb.gov.au/mh370:
- Definition of underwater search areas, 18 August 2014
- Flight Path Analysis Update, 8 October 2014
- Definition of Underwater Search Area Update, 3 December 2015.
The Australian Defence Science and Technology (DST) Group[1] conducted a comprehensive analysis of the Inmarsat satellite communications (SATCOM) data and a model of aircraft dynamics. The output of the DST Group analysis was a probability density function (PDF) defining the probable location of the aircraft’s crossing of the 7th arc.
Details of this analysis and the validation experiments are available in the open source published book here: http://link.springer.com/book/.
Additional analysis of the burst frequency offsets associated with the final satellite communications to and from the aircraft is consistent with the aircraft being in a high and increasing rate of descent at that time. Additionally, the wing flap debris analysis reduced the likelihood of end-of-flight scenarios involving flap deployment.
Preliminary results of the CSIRO’s drift analysis indicated it was unlikely that debris originated from south of the current search area. The northernmost simulated regions were also found to be less likely. Drift analysis work is ongoing and is expected to refine these results.
__________
7th arc burst frequency offset (BFO) analysis
The final satellite communication (Satcom) transmissions between the Inmarsat Ground station and 9M-MRO occurred at 00:19 on the 8th March 2014. These transmissions were the aircraft logging on to the Satcom system, likely after an interruption to the power that supplies the satellite data unit (SDU) – an integral part of the Satcom system.
The Use of Burst Frequency Offsets in the Search for MH370 – Defence Science and Technology (DST) Group paper.
The ground station Satcom logs recorded the burst timing offset (BTO) and the burst frequency offset (BFO) for each received message. A complete explanation of the BTO and BFO is provided in the ATSB publication,
.
The BFO is a function of the Doppler shifts imparted on the communication signal due to the motion of the satellite and the aircraft. The relationship is more complicated than a direct Doppler calculation because the aircraft software contains Doppler compensation that offsets the Doppler shift due to the aircraft motion. Although the aircraft attempts to compensate for its own motion, it does this under the assumption that the communications satellite is in notional geostationary orbit and it does not include the vertical component of the aircraft velocity.
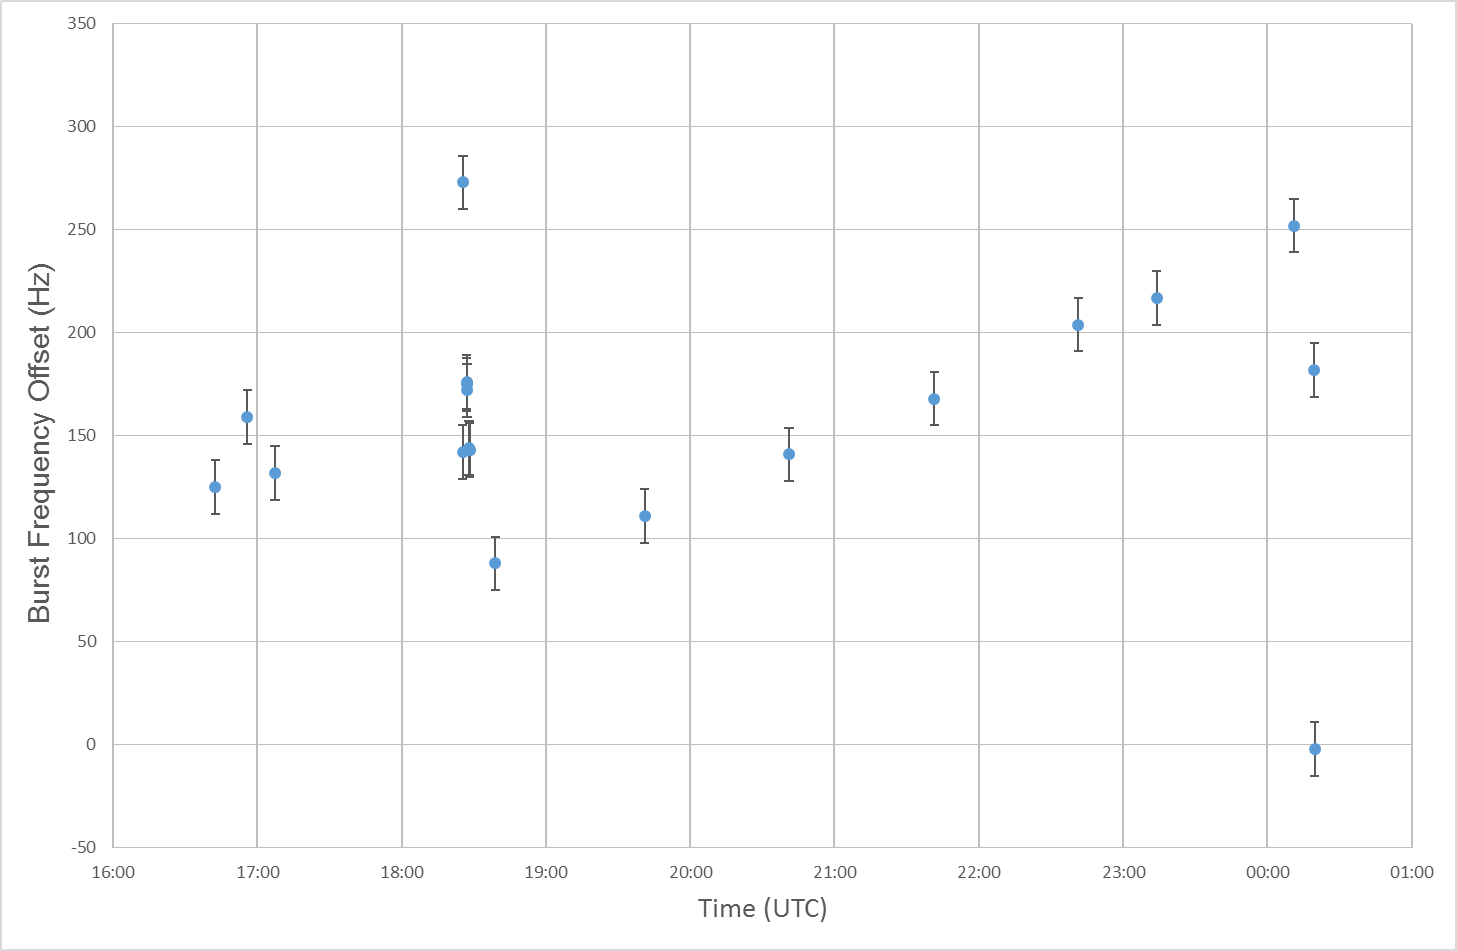
Analysis of the BFO value can provide information about the relative motion between the satellite and the aircraft. Figure 1 shows all the BFO recordings from 9M-MRO. The comprehensive analysis provided by the Defence Science and Technology (DST) Group (Bayesian Methods in the Search for MH370) indicated that the aircraft was likely on a southerly heading at 18:39. From that point until 00:11, all the solutions of the analysis showed a continuing southerly track.
Figure 1: Recorded BFO values throughout the flight
Source: ATSB
This graph illustrates the measured BFO recordings throughout the flight with the appropriate error bars on the measurements. After 18:39 the BFO values follow an approximately linear trend until the final two values at 00:19.
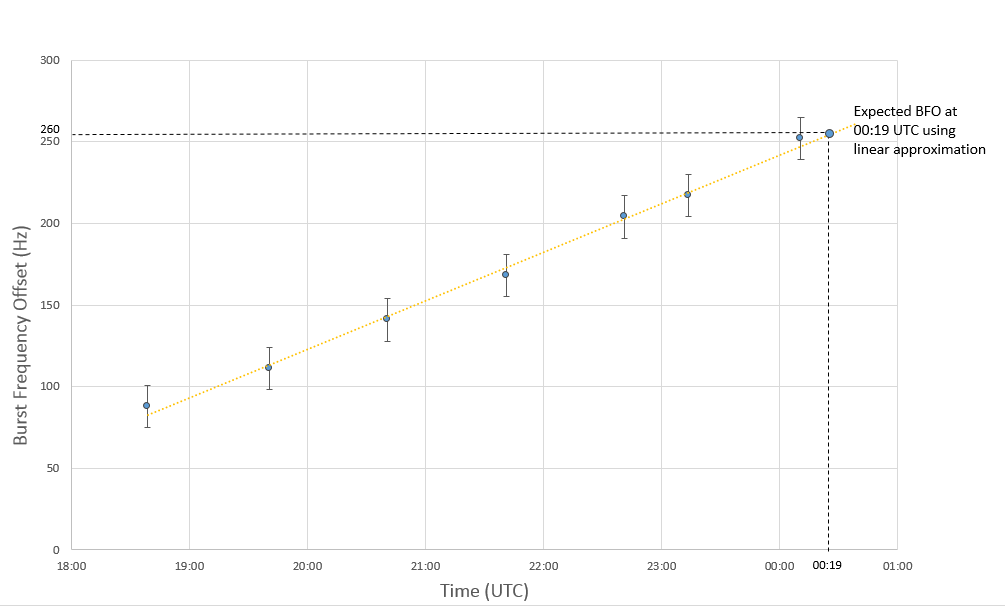
The trend of the BFO values from 18:39 until the 6th arc (00:11) is due to the change in location of the aircraft and can be linearly approximated (Figure 2). If this linear approximation is extrapolated to 00:19, and if neither the Satcom system nor the aircraft flight path were altered after 00:11, a BFO value of approximately 260 Hz would have been expected.
Figure 2: Linear approximation of the BFO values between 18:39 and 00:11
Source: ATSB
This graph illustrates 5 BFO values recorded between 18:39 and 00:11 and the linear approximation of the BFO at 00:19. The first 5 values correspond to the 2nd-6th arcs. During this time the aircraft is likely to be following a relatively constant southerly track. Continuing this linear trend to 00:19, a value of 260Hz would be expected.
The recorded values of the BFO for the two messages at 00:19 were the following:
Table 1: Recorded BFO values at 00:19
| Time | Burst Frequency Offset |
| 00:19:29 | 182 Hz |
| 00:19:37 | -2 Hz |
To explain this difference between the expected BFO value (260 Hz) and the recorded BFO values (Table 1), an examination was undertaken of the elements that contribute to the BFO.
This analysis includes a number of approximations, and the results should be interpreted as an approximate guide on the range of possible descent rates at the time of the last two SATCOM messages that were sent from 9M-MRO. DST Group intend to publish a more detailed version of the analysis in the near future. It should be noted that small refinements in the analysis may result in descent rate calculations that differ slightly from the values published here.
In the analysis it is assumed that there were no major changes to the satellite system between 00:11 and 00:19. Therefore the contributing elements consist of the:
- tolerance or error of the BFO
- direction of travel of the aircraft
- oven-controlled oscillator warm-up drift
- descent rate of the aircraft.
BFO tolerance or error
A statistical analysis of the BFO error from all the 20 previous flights of 9M-MRO identified that the distribution was approximately Gaussian (see DST Group book – link above) with a standard deviation of 4.3 Hz. ±3 standard deviations (12.9 Hz) is a conservative choice for the error.
Direction of flight
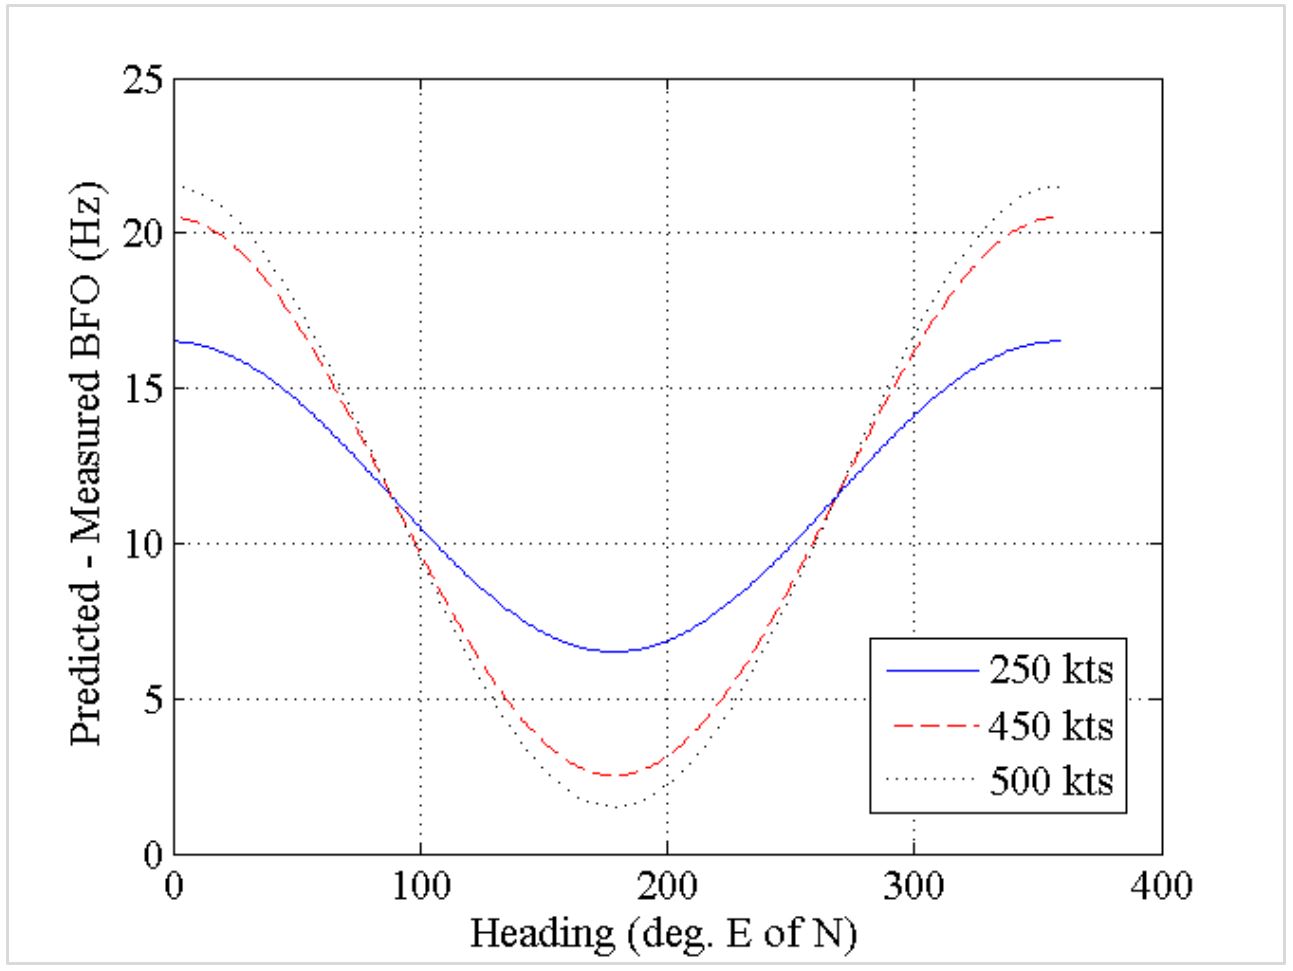
For any given speed, the estimated BFO differences can be plotted against the predicted heading of the aircraft (Figure 3). The maximum variation in the BFO differences based solely on change in direction is approximately 20 Hz.
Figure 3: Variation in estimated BFO differences at 00:19 for given track angles and groundspeed
Source: DST Group
This graph indicates that the lowest BFO differences, and therefore the closest to our measured values, would be attained for any given speed by continuing in a southerly direction.
Oscillator warm-up drift
The oven-controlled crystal oscillator (OCXO) maintains the oscillator in the satellite data unit (SDU) at the design temperature. The performance of the OCXO in maintaining the correct temperature directly affects the transmitted frequency. When power is first applied to the SDU, the transient temperature variation associated with the OCXO warming-up causes a variation in the output frequency. This is referred to as warm-up drift.
To further understand this behaviour, the manufacturer of the SDU performed multiple power-up tests on several SDUs. It was observed that individual SDUs exhibit different warm-up drift characteristics. The differences were the magnitude of the frequency deviation, the time to reach steady state as well as the general shape of the curve.
Variations in the time in which the SDU (and OCXO) was not powered, prior to powering on, affected both the magnitude of the drift and the time taken for the frequency to stabilise, however the characteristic (or general shape of the curve) was not affected.
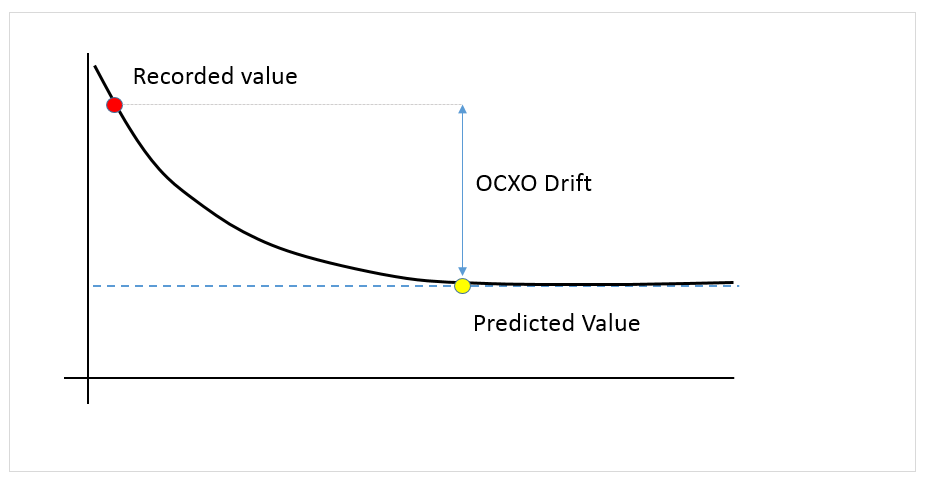
All available information indicated that, after power-up, the SDU in 9M-MRO exhibited a decay characteristic, represented in Figure 4. The values recorded shortly after power up would therefore be greater than the steady state value.
Figure 4: Representation of 9M-MRO SDU decaying warm-up characteristic (not to scale)
Source: ATSB
This graph illustrates the warm-up characteristic of the 9M-MRO SDU. After power is restored to the SDU, the OCXO drift results in BFO value being above the steady state value until the OCXO has stabilised.
The maximum OCXO drift value observed in the previous data of 9M-MRO was around 130 Hz and if the power interruption was sufficiently short, the OCXO drift could be negligible.
Descent rate
The remaining element to explain the difference in the predicted BFO value and the recorded BFO value is the descent rate of the aircraft. Analysis shows that at locations consistent with the search area and at the time of the last transmission, the descent rate affects the BFO value at -1.7 Hz per 100 ft/min.
Results of analysis
Due to the uncertainties associated with the end-of-flight scenario, it is not possible to define a specific descent rate from the recorded BFO values. Instead, using the limits of each contributing element, a range of possible descent rates, consistent with the recorded BFO values can be determined.
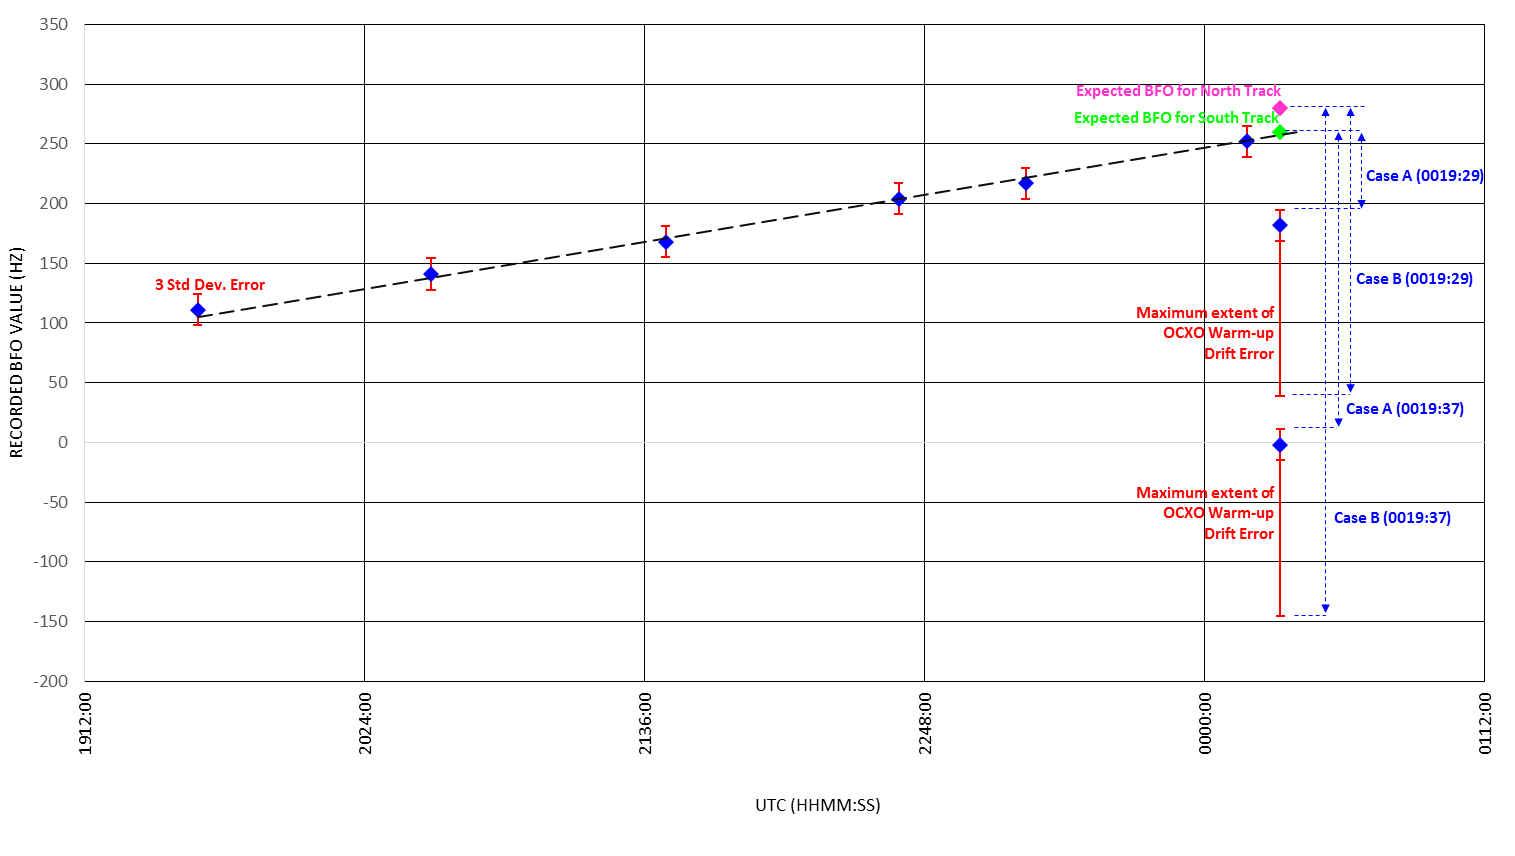
Case A and Case B below represent the boundary cases for the minimum descent rate and the maximum descent rate respectively. For each transmission at 00:19, Case A applies assumptions that reduce the required rate of descent to match the recorded BFO. Case B does the opposite and applies assumptions which increase the required rate of descent.
A. Minimum Descent Rate
- Southerly direction,
- Maximum positive error of measured BFO for 00:19:29 and 00:19:37 (~ 13 Hz),
- No OCXO drift – very short duration power interruption.
B. Maximum Descent Rate
- Northerly direction,
- Maximum negative error on measured BFO at 00:19:29 and 00:19:37 (~ -13 Hz),
- Maximum OCXO drift – 130 Hz (as observed in other power-up logons of 9M-MRO).
Table 2 and Figure 5 following provide the resulting descent rates based on cases above for the log-on request at 00:19:29 and the log-on acknowledge at 00:19:37.
Table 2: Derived descent rate boundary cases
| 00:19:29 log-on request | Case A (minimum) | Case B (maximum) |
| Predicted BFO level flight | 260 Hz | 280 Hz |
| Measured BFO | 182 Hz | 182 Hz |
| Possible error (3 std dev.) | 13 Hz | -13 Hz |
| OCXO Drift | 0 Hz | 130 Hz |
| Derived descent rate | 260- (182+13) = 65 Hz(65 / 1.7) *100 ≈ 3,800 ft/min | 280 - (182 - 13 - 130) = 241 Hz(241 / 1.7) *100 ≈ 14,200 ft/min |
| 00:19:37 log-on ACK | Case A (minimum) | Case B (maximum) |
| Predicted BFO level flight | 260 Hz | 280 Hz |
| Measured BFO | -2 Hz | -2 Hz |
| Possible error (3 std dev.) | 13 Hz | -13 Hz |
| OCXO Drift | 0 Hz | 130 Hz |
| Derived descent rate | 260-(-2+13) = 249 Hz(249 / 1.7) *100 ≈ 14,600 ft/min | 280 - (-2 - 13 - 130) = 425 Hz(425 / 1.7) *100 ≈ 25,000 ft/min |
Figure 5: Association of BFO differences to descent at 00:19
Source: ATSB
End of flight simulations
The ATSB report
outlined the previous simulations that the manufacturer had undertaken to assist in determining the aircraft’s behaviour at the end of the accident flight.
In April 2016, the ATSB defined a range of additional scenarios for the manufacturer to simulate in their engineering simulator. Reasonable values were selected for the aircraft’s speed, fuel, electrical configuration and altitude, along with the turbulence level.
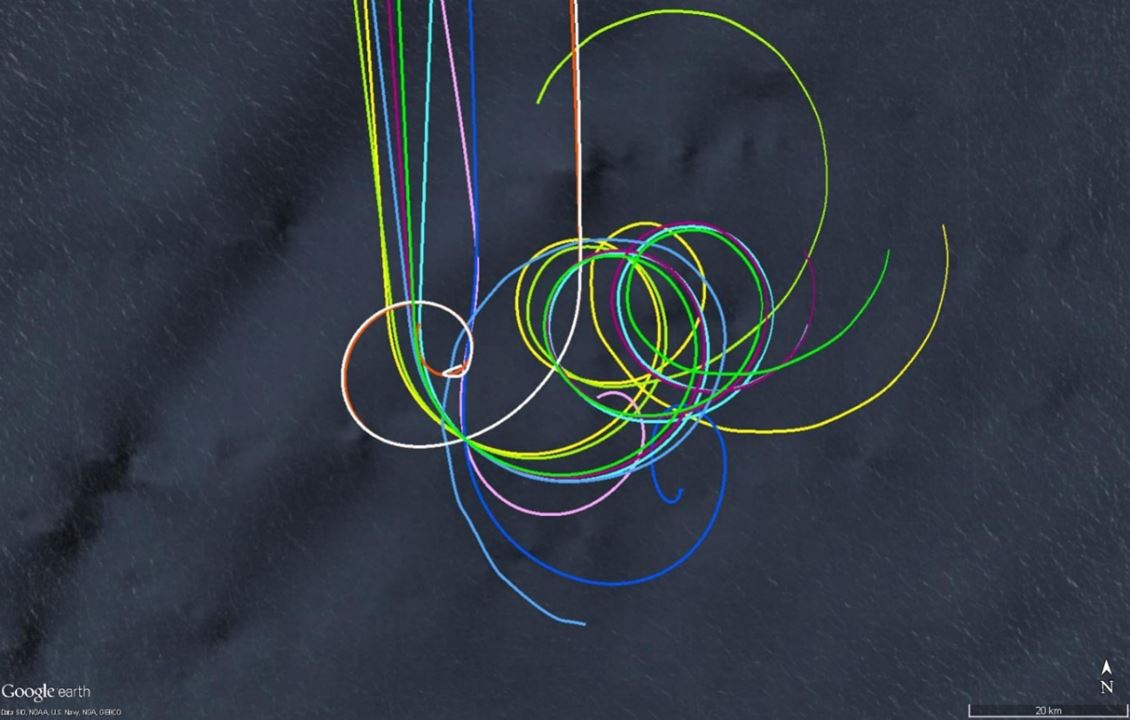
The results of the simulation are presented in Figure 6. The results have all been aligned to the point two minutes after the loss of power from the engines. This is the theorised time at which the 7th arc transmissions would have been sent.
Figure 6: Results from simulated scenarios
Source: ATSB
This figure illustrates the resulting flight paths from the simulations performed by the manufacturer and aligned at a point consistent with when the final BTO transmission may have occurred.
The simulations were completed in the manufacturer’s engineering simulator. The engineering simulator uses the same aerodynamic model as a Level D simulator used by the airlines. The simulator is not a full motion simulator but instead is used when a high level of system fidelity is required. The appropriate firmware and software applicable to the accident aircraft can be loaded.
The results of the simulations were that:
- The aircraft was capable of travelling rearwards (from the direction of travel) approximately 21 NM.
- Simulations that experienced a descent rate consistent with the ranges and timing from the BFO analysis generally impacted the water within 15 NM of the arc.
- In some instances, the aircraft remained airborne approximately 20 minutes after the second engine flameout.
- In an electrical configuration where the loss of engine power from one engine resulted in the loss of autopilot (AP), the aircraft descended in both clockwise and anti-clockwise directions.
- In some simulations, the aircraft exhibited phugoid motion[2] throughout the descent.
- Simulations that exhibited less stable flight resulted in higher descent rates and impact with water closer to the engine flameout location. In some simulations, the aircraft’s motion was outside the simulation database. The manufacturer advised that data beyond this time should be treated with caution.
- Some of the simulated scenarios recorded descent rates that equalled or exceeded values derived from the final SATCOM transmission. Similarly, the increase in descent rates across an 8 second period (as per the two final BFO values) equalled or exceeded those derived from the SATCOM transmissions. Some simulated scenarios also recorded descent rates that were outside the aircraft’s certified flight envelope.
- The results of the scenarios, combined with the possible errors associated with the BTO values indicate that the previously defined search area width of ±40 NM is an appropriate width to encompass all uncontrolled descent scenarios from the simulations.
The simulated scenarios do not represent all possible scenarios, nor do they represent the exact response of the accident aircraft. Rather, they provide an indication as to what response the accident aircraft may have exhibited in a particular scenario. As such, the results are treated with caution, and necessary error margins (or safety factors) should be added to the results.
It was not possible to simulate all likely scenario conditions due to the limitations of the simulator. Specifically, flight simulators are unable to accurately model the dynamics of the aircraft’s fuel tanks. In the simulator, when the fuel tank is empty, zero fuel is available to all systems fed from the tank. However, in a real aircraft, various aircraft attitudes may result in unusable fuel (usually below engine/APU inlets) becoming available to the fuel inlets for the APU/engines. If this resulted in APU start-up, it would re-energise the AC buses and some hydraulic systems. This could affect the trajectory of the aircraft. Similarly, the left and right engines may also briefly restart, affecting the trajectory.
__________
- A long-period oscillation of pitch axis, perpetually hunting about level attitude and trimmed speed.
Drift modelling update
To assist with the underwater search for 9M-MRO, the Commonwealth Scientific and Industrial Research Organisation (CSIRO) undertook an analysis of existing ocean data from the Global Drifter Program[3]. The analysis used the behaviour of drogued and undrogued drifters[4], as well as numerical simulations using ocean models. The purpose of this work was to trace any recovered debris to its likely point of origin. However, a drifter’s geometry and buoyancy is not generally representative of aircraft debris and it was considered that the drift characteristics might also be different. To account for this difference, the CSIRO engaged in field work, studying how aircraft debris moves through the water compared to drifters, with regard to wind and ocean currents. This data was incorporated into numerical simulations in order to predict the drift behaviour of aircraft debris with more confidence.
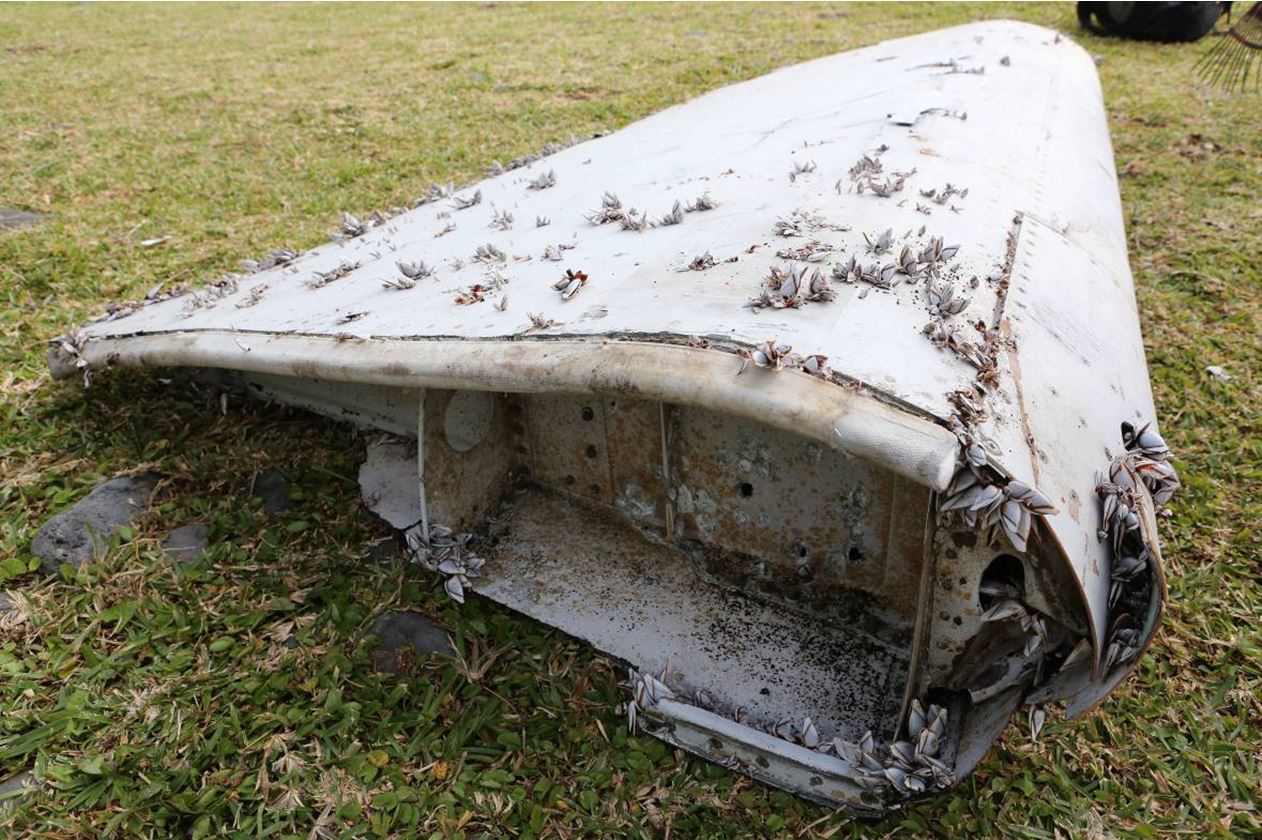
As part of the ongoing field testing, the drift behaviour of replica flaperons and other recovered aircraft parts is being assessed. Replica flaperons were constructed with dimensions and buoyancy approximately equal to that of the recovered flaperon (Figure 7), which was float-tested during the detailed examinations in France. The replica flaperons were deployed into a bay for short term tests during various weather conditions. Longer term tests were then performed in the open ocean. For comparison, undrogued drifters were deployed alongside the flaperons. Drogued drifters were also used, because they move predominantly with the currents, as opposed to wind and waves. Data for currents was then able to be subtracted from the flaperons’ drift data so that wind and wave behaviour could be assessed in isolation.
Figure 7: Flaperon recovered from Reunion Island on 29 July 2015
Source: Bureau d’Enquetes et d’Analyses (BEA)
Field tests demonstrated that the replica flaperons drift similarly to undrogued drifters:
- In low wind conditions, the flaperons move slightly faster than undrogued drifters due to the energy absorbed from waves.
- In higher winds, the energy absorbed from waves was less significant, and the flaperons’ behaviour was analogous to the undrogued drifters’.
The replica flaperons presented their raised trailing edge to the wind, allowing waves to propel them in the wind direction. If waves tipped or turned the flaperons, the wind quickly reoriented them, so the direction of movement remained consistent.
Replicas of two other recovered items of debris drifted at a rate that was practically indistinguishable from undrogued oceanographic drifters in all wind conditions. Therefore, the trajectories of undrogued oceanographic drifters were valid for use in the analysis.
Preliminary results from the updated drift analysis indicated that the current search area was a possible origin for the recovered debris.
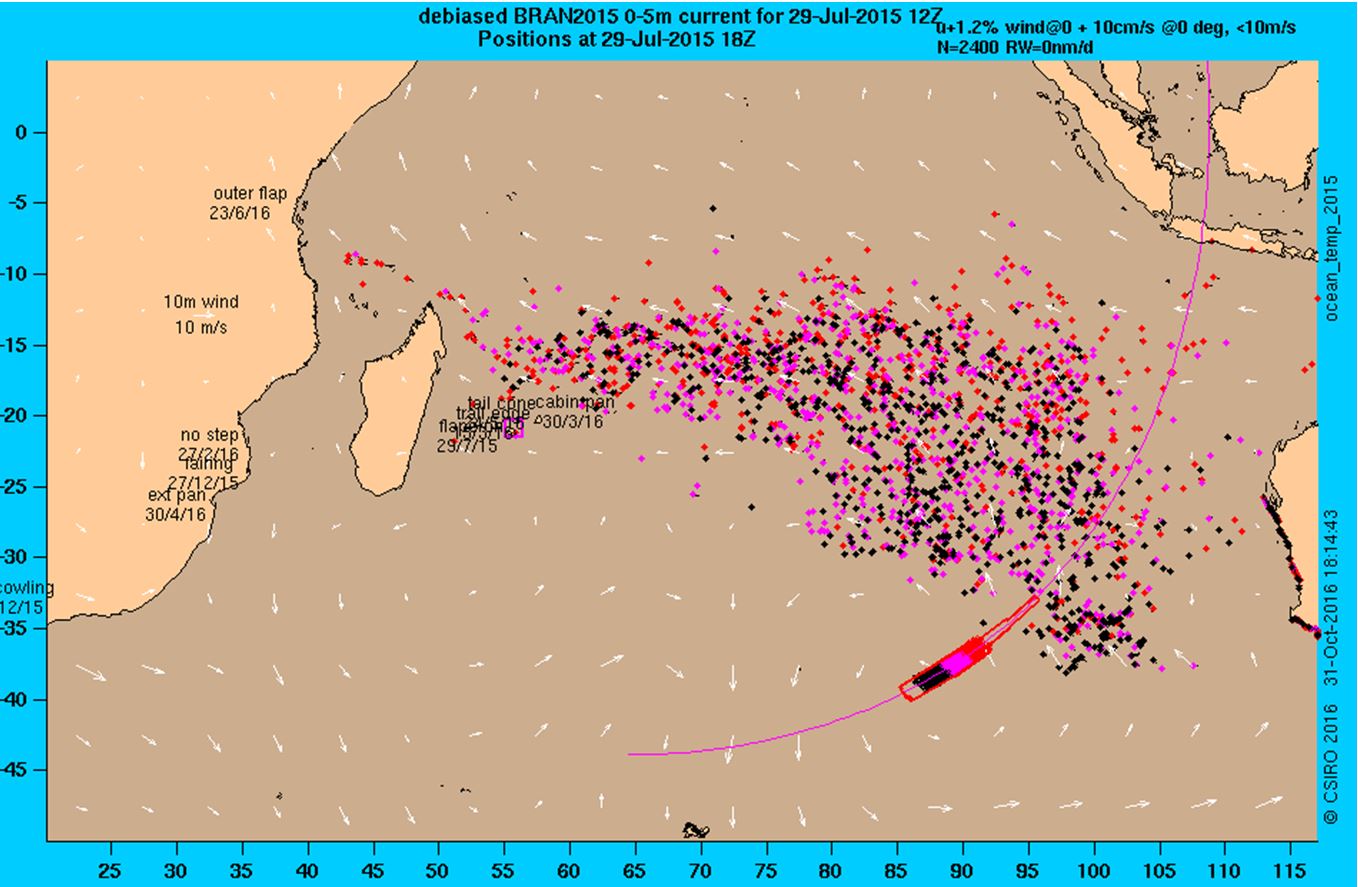
Using the collected field data, a new forward-tracking numerical simulation was performed. Within the simulation, flaperons were deployed on and around the current search area and allowed to drift freely. Results after 500 days of simulated drift are presented in Figure 8. For comparison, Figure 9 shows the results of a simulation where the original undrogued drifter model was used. By comparing the two figures, it can be seen that the flaperons generally moved further west within 500 days due to the extra speed at low winds.
Figure 8: Simulated location of flaperon-type drifters after 500 days
Source: CSIRO
Figure 9: Simulated location of undrogued drifters after 500 days
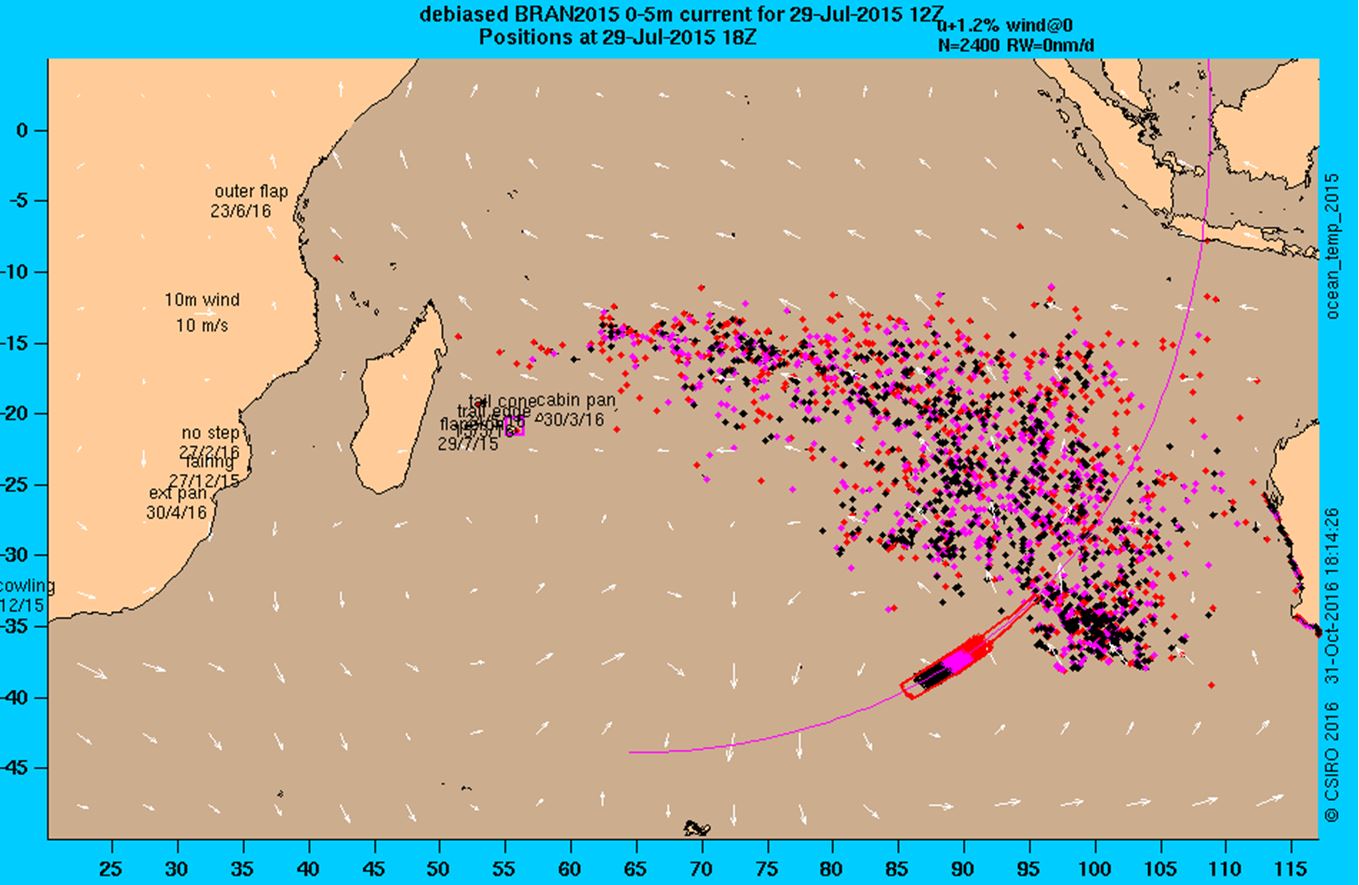
Source: CSIRO
Small errors in the simulation can result in large divergences over time. As such, an examination of the debris behaviour in the first months after the accident was conducted.
Figure 10 illustrates the starting location of the simulated drifters along the 7th arc. After eight months of simulated drift (Figure 11), some initial conclusions can be drawn about the drifter’s path with respect to debris discovered to date. A significant number of drifters arrived on the coast of Western Australia. Similarly, a number of drifters had arrived on the coast of Africa. The colour of each drifter identifies its starting location as marked along the arc.
- Drifters starting in the southern half of the current search area or below (dark blue, green, light blue) can be observed on and around the coast of Western Australia, with many drifting towards Tasmania. No debris has been discovered on the Australian coast. This indicates that a starting location within the current search area, or further north, is more likely.
- A significant number of red drifters have already reached the coast of Madagascar and mainland Africa. This is not consistent with the time at which debris was discovered. The first item of debris was not discovered on Reunion Island until 16 months after the accident. This suggests a reduced likelihood of debris originating from the northernmost areas shown in Figure 10 (red and white coloured regions).
Refinement of the drift analysis is continuing. Flaperon replicas are currently deployed in the open ocean along with drogued and undrogued drifters, and replicas of smaller debris. This is to study the longer-term drift behaviour of the parts in conditions similar to those expected in the Indian Ocean. The long-term tests may provide additional improvement to the simulations and confidence in the backtracking results.
Figure 10: Simulated starting location of undrogued drifters
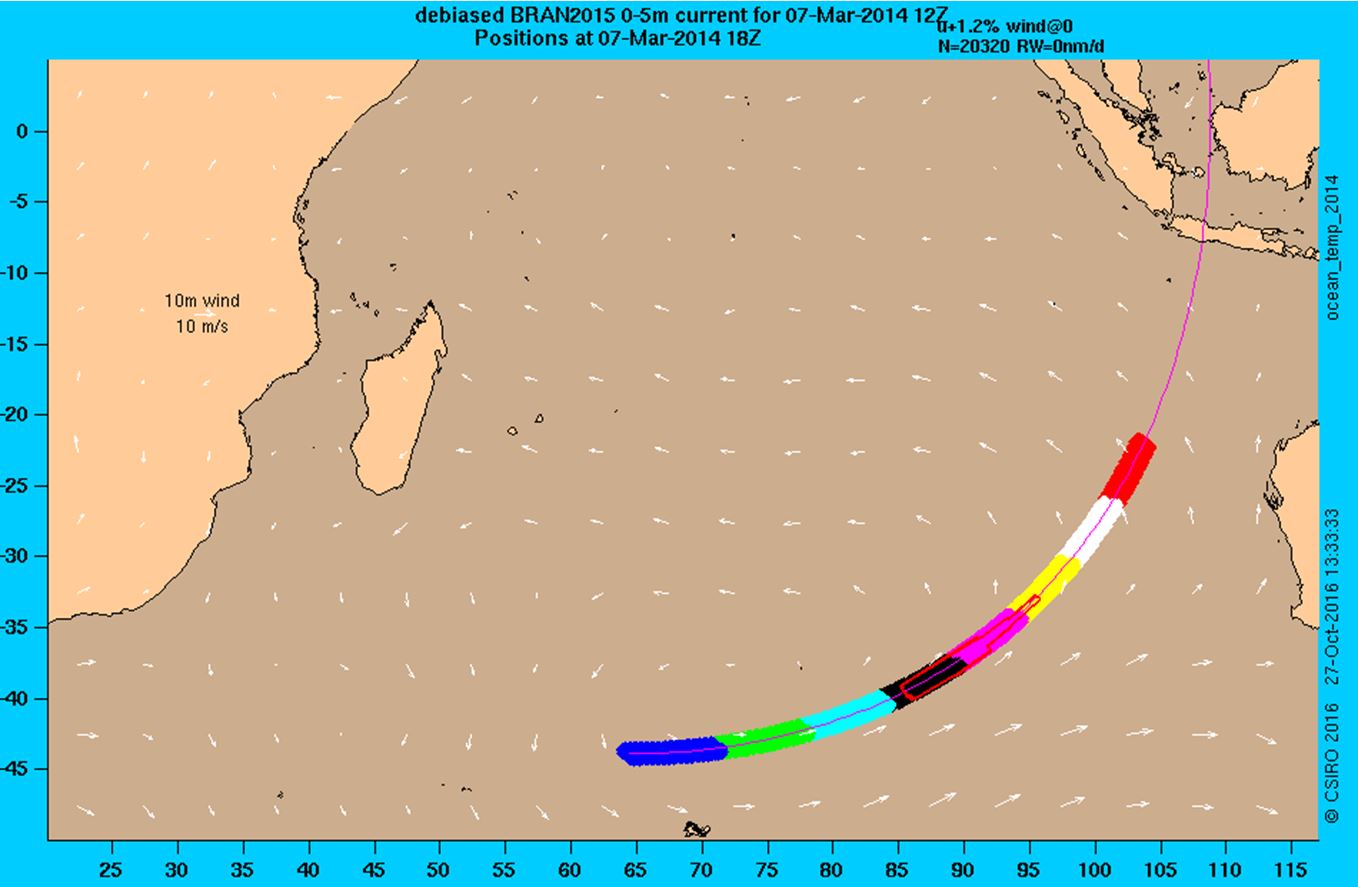
Source: CSIRO
Figure 11: Simulated location of undrogued drifters after 8 months
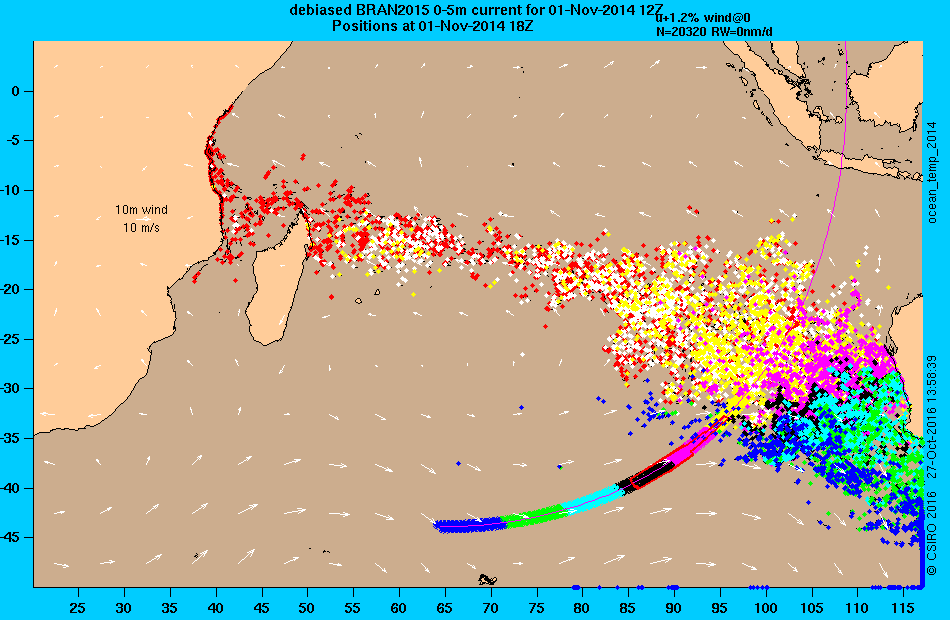
Source: CSIRO
A significant number of drifters from the light blue and green areas have made landfall on the West Australian coast. Similarly, drifters from the red and white areas have begun to make landfall on the African coastline. Neither are consistent with times and/or locations at which MH370 debris was discovered, therefore reducing the likelihood of debris originating from these locations.
Debris summary and analysis
Currently, more than 20 items of debris have been brought to the attention of and are of interest to the investigation team. The items have been located along the east and south coast of Africa, the east coast of Madagascar and the Islands of Mauritius, Reunion and Rodrigues in the Indian Ocean. A list of items recovered was published by the Malaysian investigation team and can be found at www.mh370.gov.my/index.php/en/.
The right flaperon has been examined by the French Judiciary and confirmed to have originated from 9M-MRO. Six further items of debris have previously been examined by the ATSB, comprising a:
- section of the right outboard flap fairing
- panel section from the right horizontal stabiliser
- piece of engine cowling
- closet panel section from the closet adjacent to door R1
- inboard section of the right outboard flap
- trailing edge section of the left outboard flap.
Both flap sections had unique identification numbers that were able to be linked, through manufacturing records, to 9M-MRO. The remaining examined items were confirmed as Boeing 777 parts and had identifying features linking them to a Malaysian Airlines origin, however there were no unique identifiers to link the parts directly to 9M-MRO. The parts were therefore determined to have almost certainly originated from 9M-MRO, given that the likelihood of originating from another source is very remote. The ATSB debris examination reports are available at www.atsb.gov.au/mh370-pages/updates/reports/.
Outboard flap failure analysis
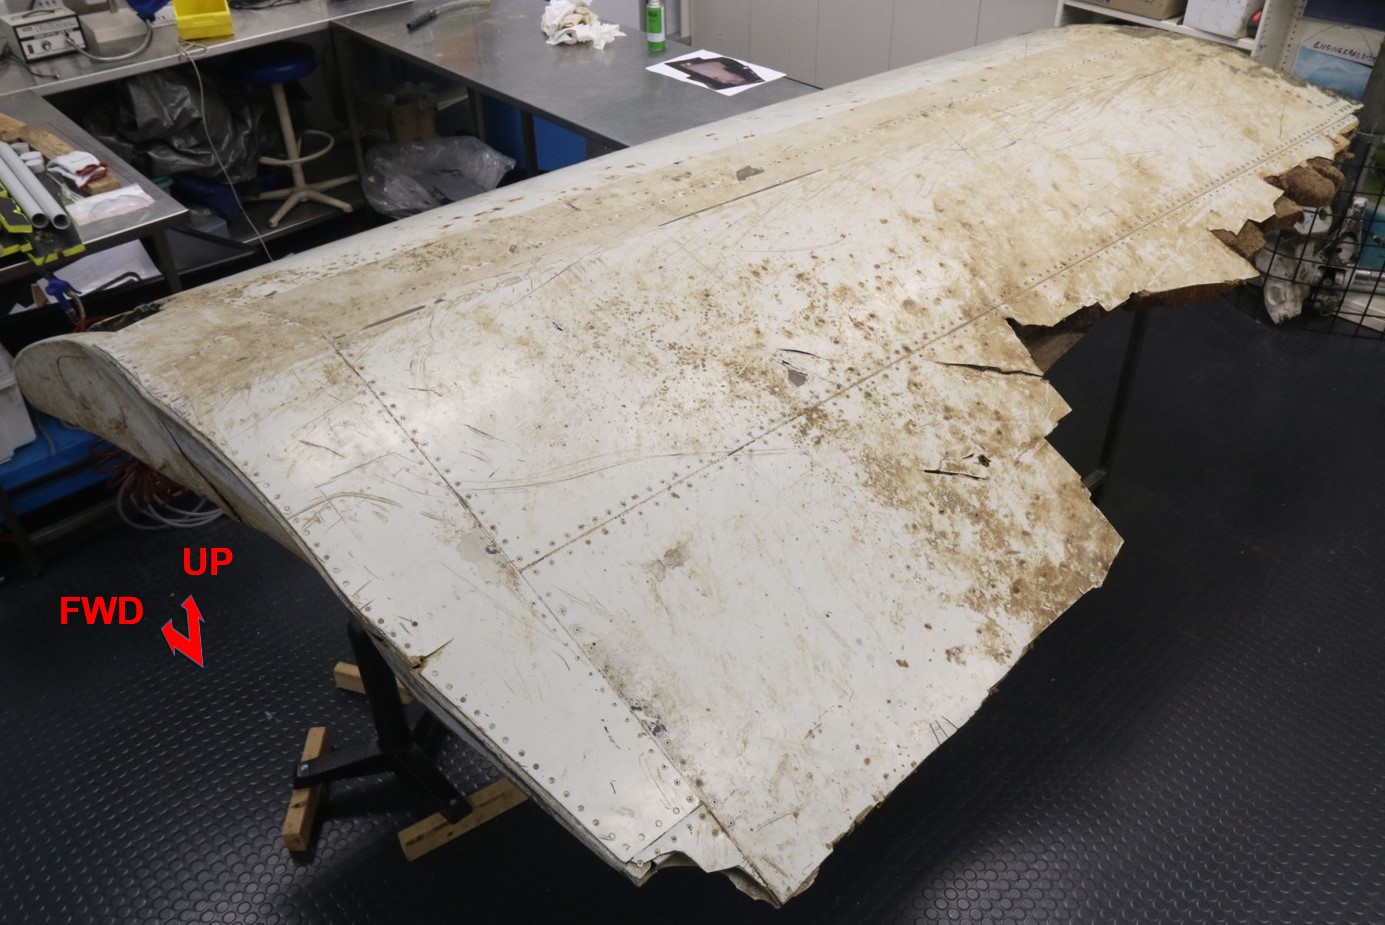
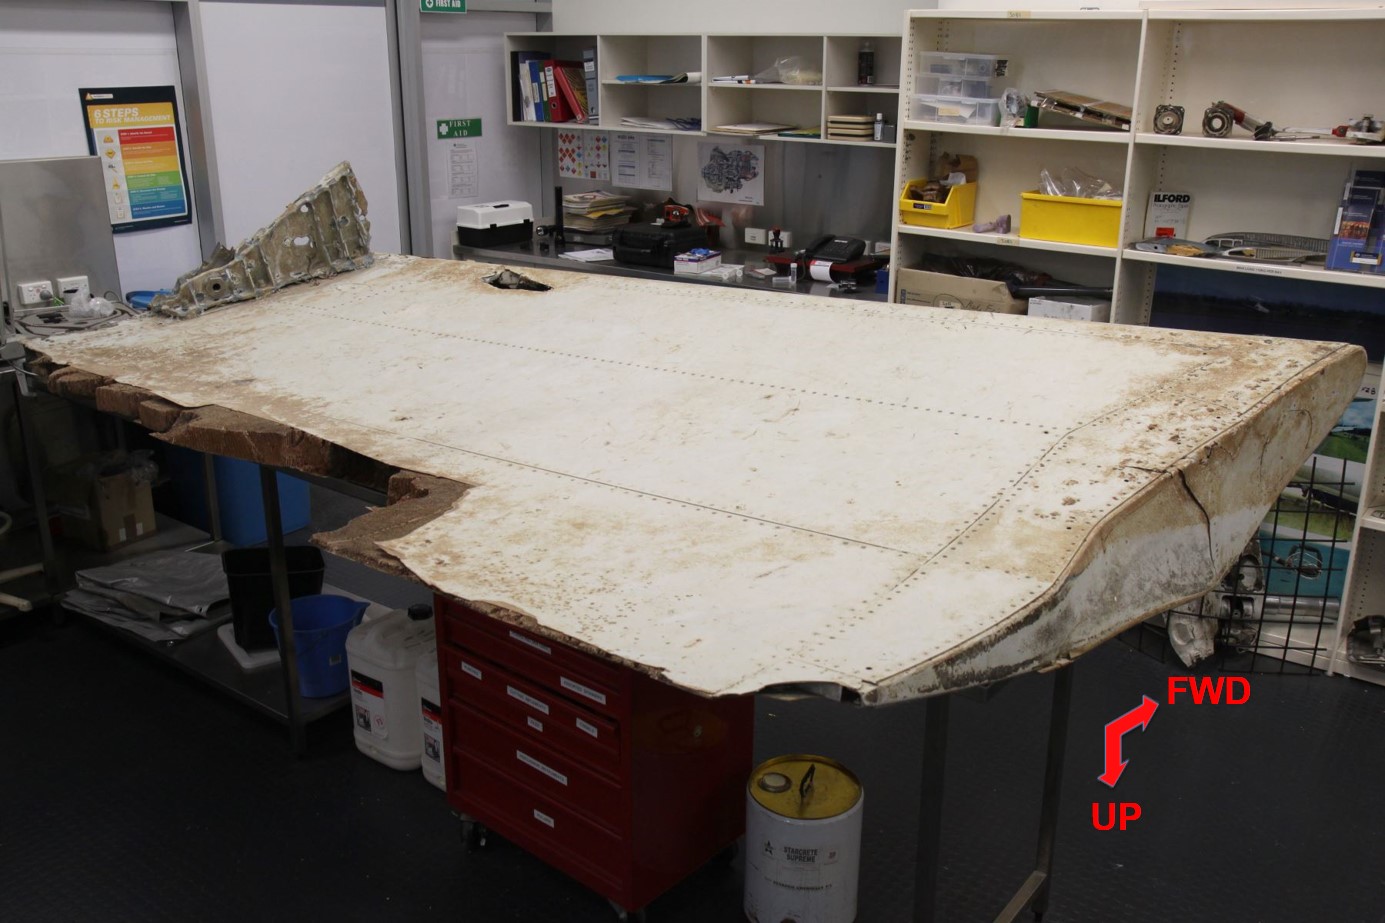
The recovered right, outboard wing flap section (Figures 12, 13 and 14) was examined for any evidence of interaction with mechanisms, supports and surrounding components that may indicate the state of flap operation at the time of fracture and separation from the wing. The purpose of the examination was to inform the end-of-flight scenarios being considered by the search team. The most significant items of evidence in relation to this are documented below.
Figure 12: Location of recovered outboard flap section
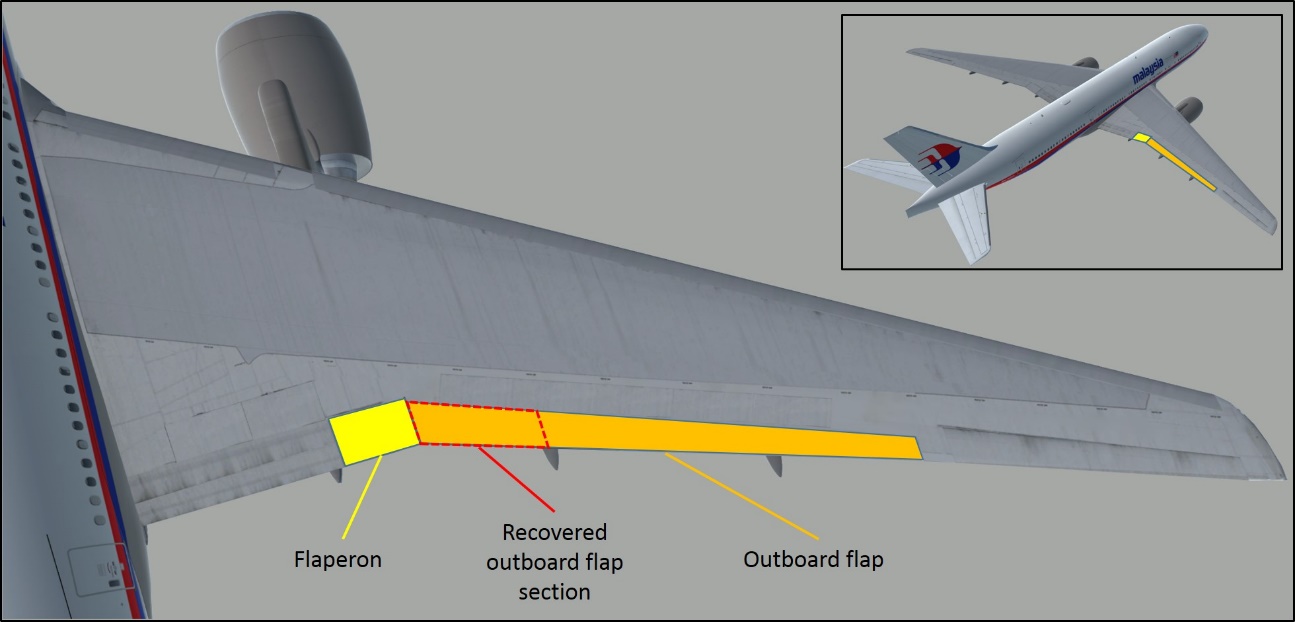
Source: DST Group (Modified by ATSB)
Figure 13: Inboard section of outboard flap
Source: ATSB
Figure 14: Inboard section of outboard flap (inverted)
Source: ATSB
Flap position
The trailing edge outboard wing flaps form part of the aircraft’s high-lift control system and are deployed to alter the shape of the aircraft wing, improving lift at lower aircraft speeds during takeoff, approach and landing. The outboard wing flaps have defined stages of flap deployment between ‘up’ (retracted / cruise position) and 30-units of extension (landing position).
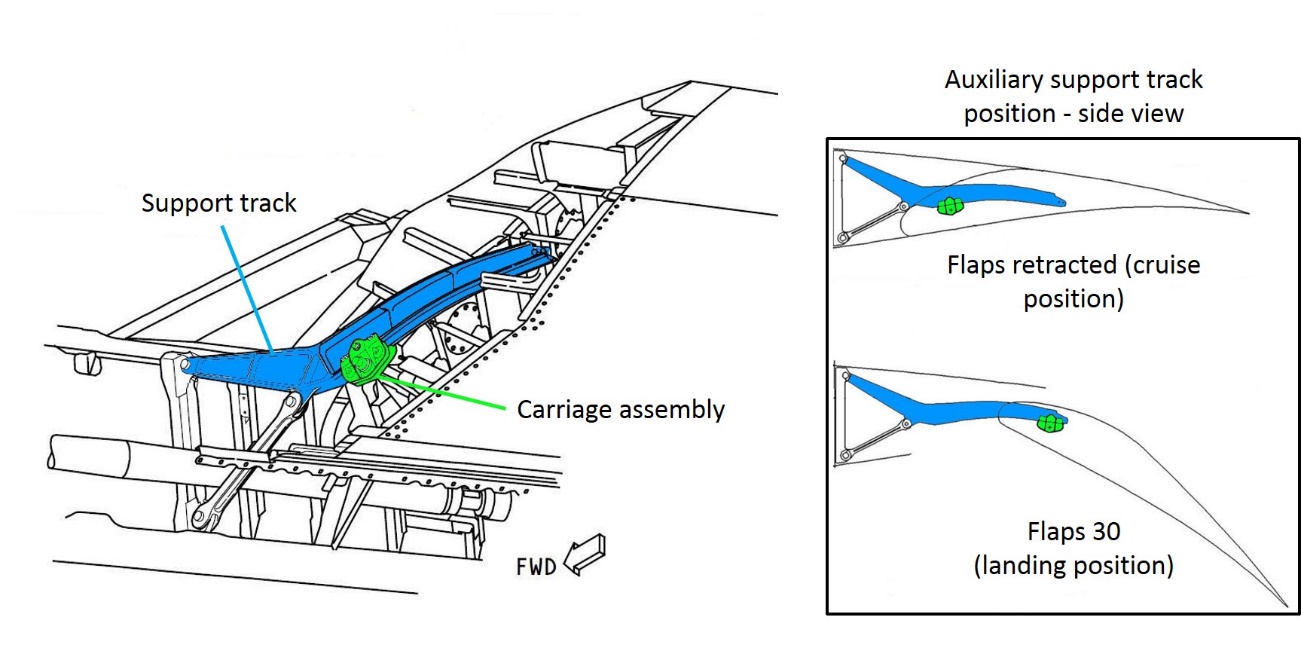
A fibreglass and aluminium seal pan is located at the inboard end of the outboard flap. It houses the inboard auxiliary support, comprising a deflection control track (support track) and carriage assembly. The support track is affixed to the rear of the wing. Using rollers in the carriage assembly, the inboard end of the flap is guided along the support track as the flap moves through its deflection range. The track is fully inserted into the flap in the ‘up’ position and progressively withdrawn from the flap as the flaps are deployed (Figure 15). The inboard auxiliary support track and carriage assembly were not present with the recovered debris.
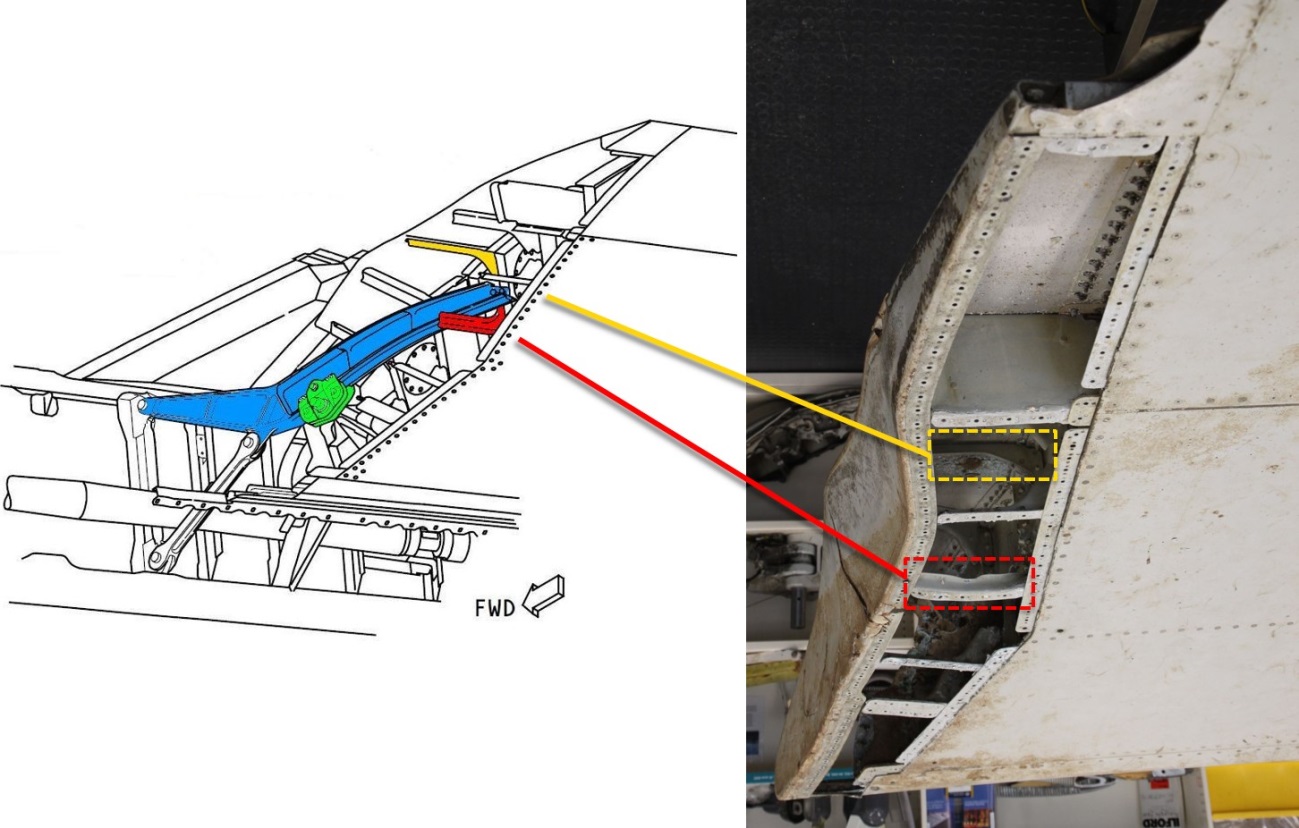
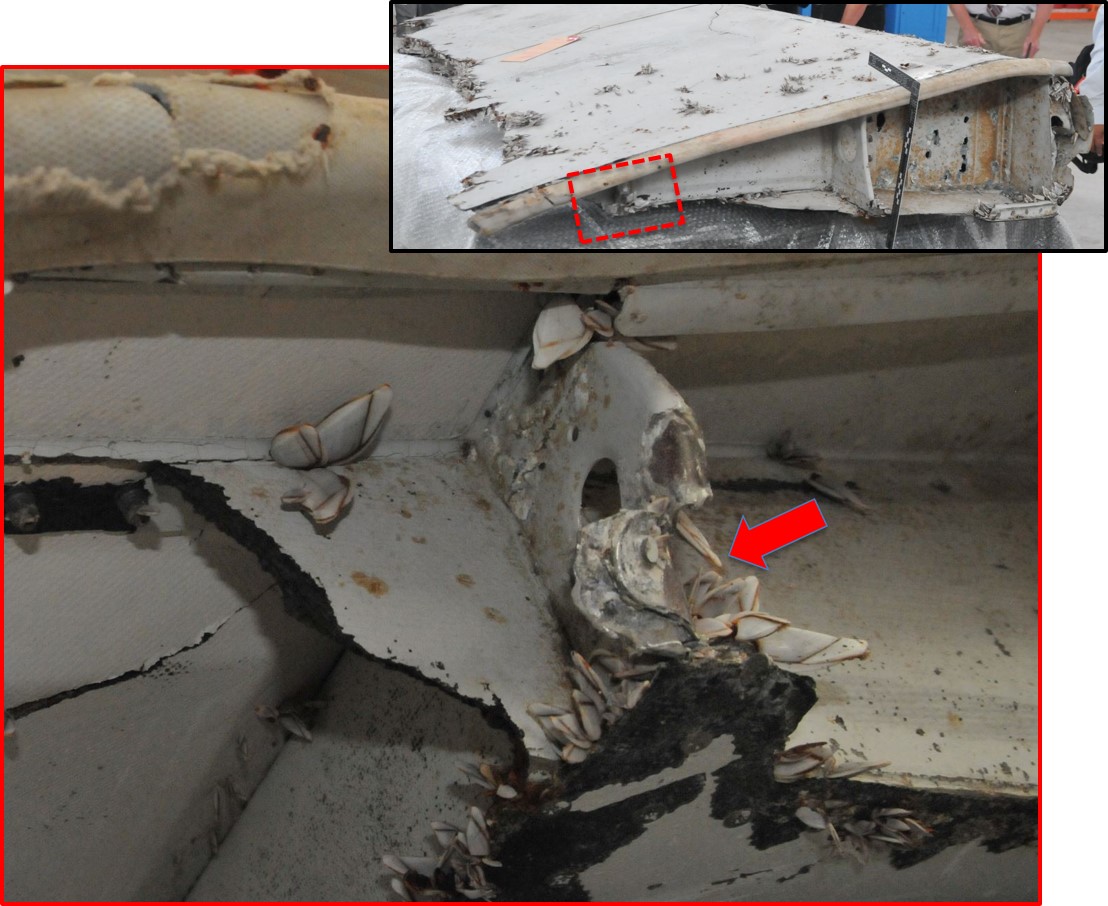
Two adjacent aluminium stiffeners within the inboard seal pan area exhibited impact damage. The damage was significant because it was indicative of impact damage and the only component in the vicinity of the stiffeners, capable of independent movement within the seal pan, was the support track. Measurements of the support track position at the various stages of flap deployment, indicated that the track would have to be fully inserted into the flap in the retracted position to be adjacent to the damaged stiffeners (Figures 16, 17 and 18).
An outwards-fracture of the fibreglass seal pan initiated at a location adjacent to the damaged aluminium stiffeners (Figure 19). The damage was most likely also caused by impact from the support track. That damage provided further evidence of the support track position within the flap seal pan cavity, indicating that the flaps were retracted at the point of fracture and separation from the wing.
Figure 15: Outboard flap, inboard auxiliary support
Source: Boeing (modified by ATSB)
Figure 16: Outboard flap location of damaged stiffeners within the seal pan cavity
Source: Boeing (modified by ATSB) / ATSB
Figure 17: Outboard flap, damaged stiffeners within the seal pan cavity
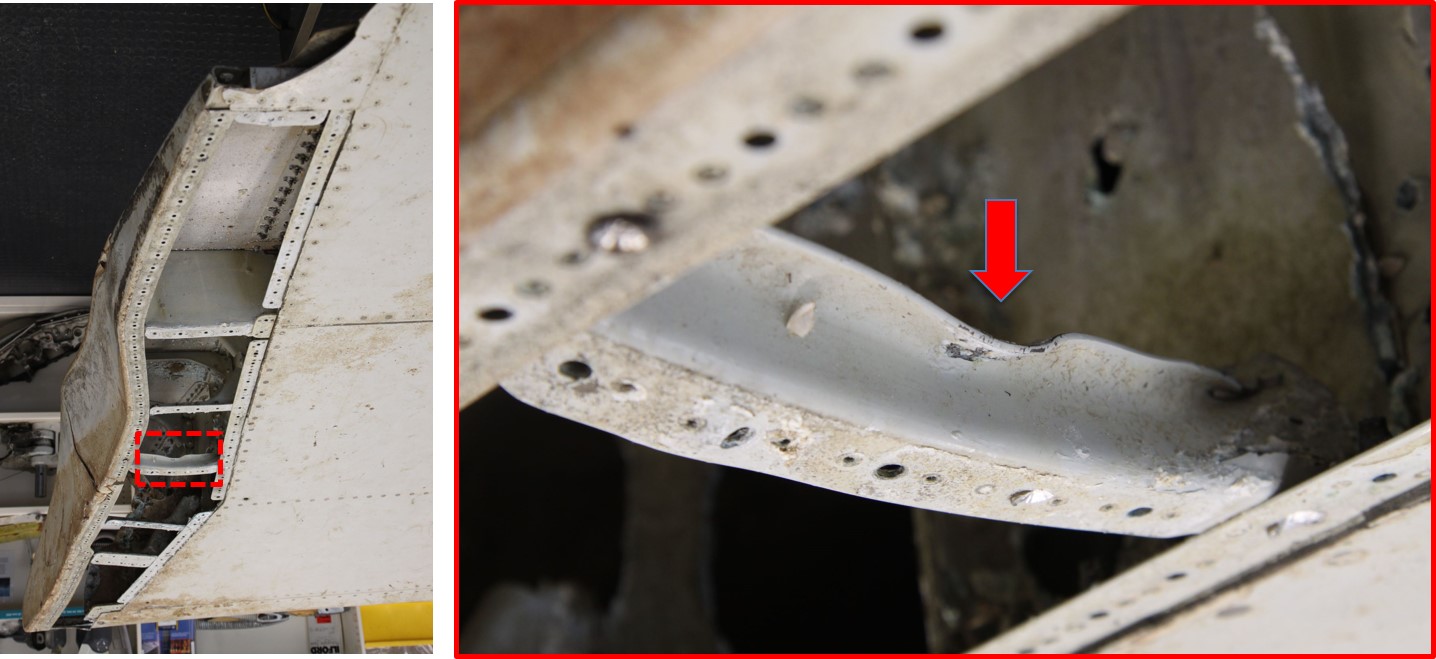
Source: ATSB
Figure 18: Outboard flap, damaged stiffeners within the seal pan cavity
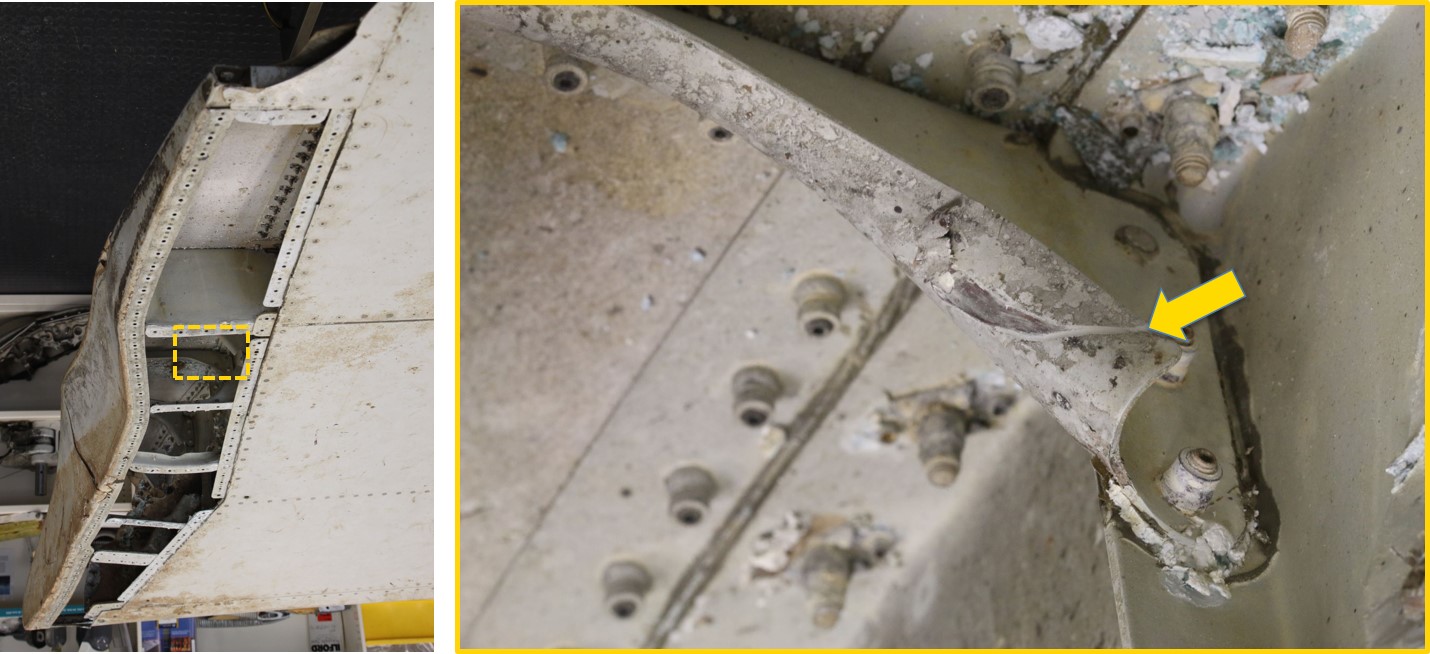
Source: ATSB
Figure 19: Outboard flap, fractured seal pan (forward)
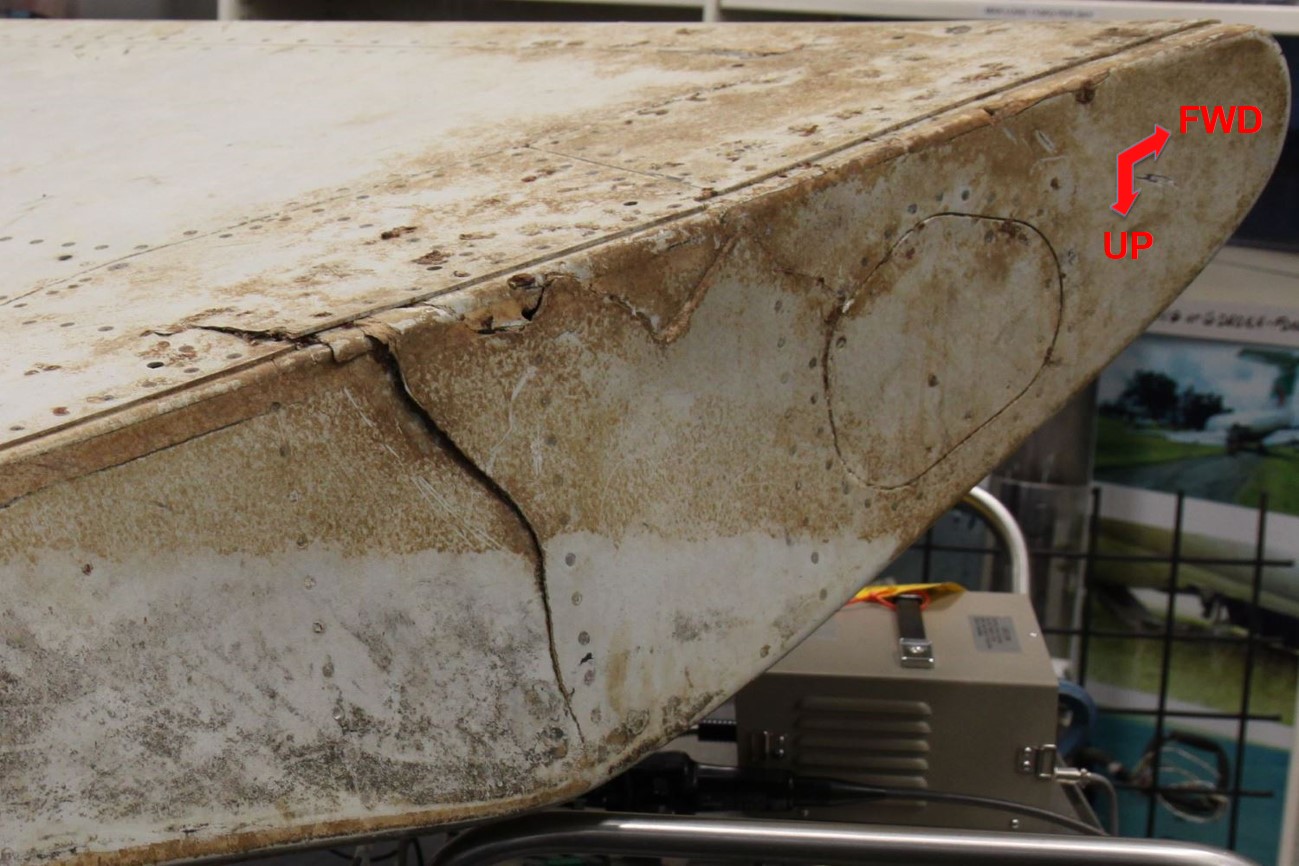
Source: ATSB
Contact damage between the flaperon and outboard flap
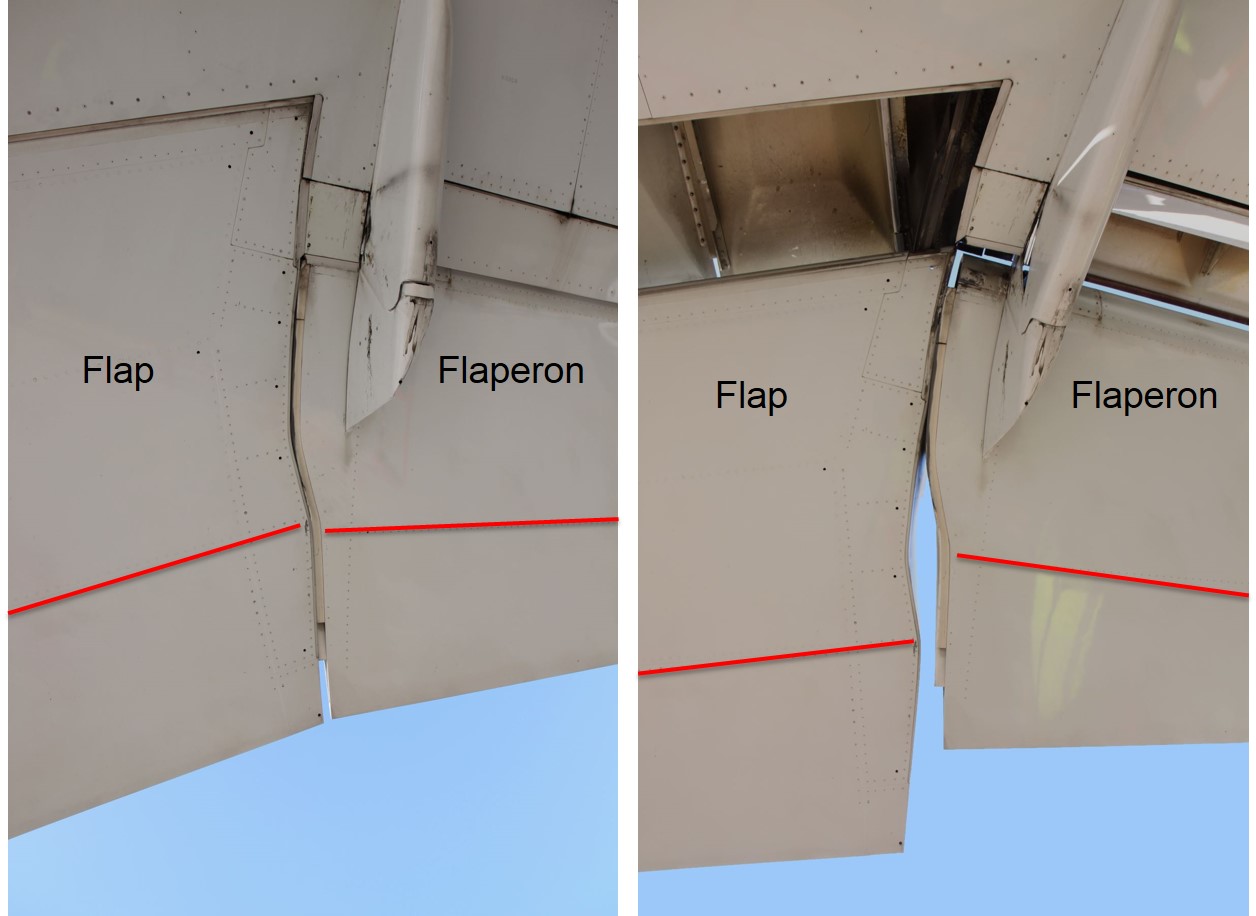
The flap seal pan was also fractured adjacent to the rear spar. The fracture resulted from external impact, puncturing the fibreglass and plastically deforming the supporting aluminium structure within the seal pan cavity (Figure 20). Comparable damage was noted at the outboard, rear spar and surrounding structure of the adjacent flaperon (Figure 21). It was noted that the two areas in question are aligned when the flaps are in the retracted position, with a significant offset existing at other stages of flap extension (Figure 22).
Figure 20: Outboard flap, fractured seal pan (aft)
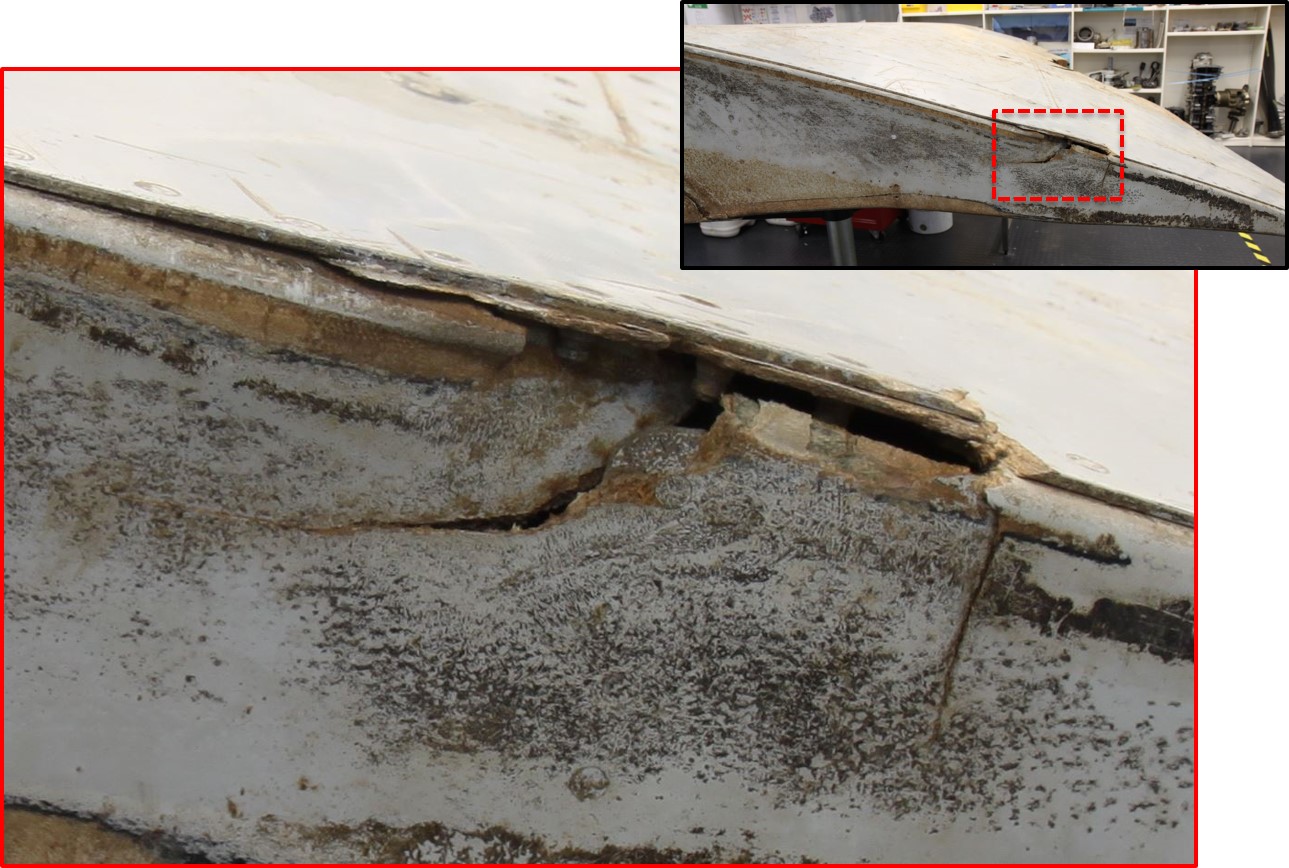
Source: ATSB
Figure 21: Flaperon, outboard side damage
Source: Direction générale de l'armement / Techniques aéronautiques (modified by ATSB)
Figure 22: Flaperon and outboard flap from below, showing relative alignment of rear spar rivet line (highlighted) in the flaps retracted (left) and extended position (right)
Source: ATSB
Analysis
Damage to the internal seal pan components at the inboard end of the outboard flap was possible with the auxiliary support track fully inserted into the flap. That damage was consistent with contact between the support track and flap, with the flap in the retracted position. The possibility of the damage originating from a more complex failure sequence, commencing with the flaps extended, was considered much less likely.
With the flap in the retracted position, alignment of the flap and flaperon rear spar lines, along with the close proximity of the two parts, indicated a probable relationship between two areas of damage around the rear spars of the parts. This was consistent with contact between the two parts during the aircraft breakup sequence, indicating that the flaperon was probably aligned with the flap, at or close to the neutral (faired) position.
Numerous other discrete areas of flap damage were analysed. Some of the damage was consistent with the flaps in the retracted position, while other areas did not provide any useful indication of the likely flap position. It was therefore concluded that:
- The right outboard flap was most likely in the retracted position at the time it separated from the wing.
- The right flaperon was probably at, or close to, the neutral position at the time it separated from the wing.
__________
- Visit www.aoml.noaa.gov/phod/dac/ for further details.
- A drifter is a satellite-tracked buoy which either has a subsurface sea anchor attached (drogued) or not (undrogued).
Acknowledgements
The ATSB would like to acknowledge the following organisations for their input and continued assistance with the analysis:
- Air Accidents Investigation Branch (UK)
- Australian Bureau of Meteorology
- Australian Defence Science and Technology Group
- Boeing
- Commonwealth Scientific and Industrial Research Organisation
- Department of Civil Aviation, Malaysia
- Inmarsat
- Malaysian Airlines Berhad
- Malaysian Ministry of Transport
- National Transportation Safety Board (US)
- Thales.
Those involved have dedicated many hours outside of normal duties to advance the collective understanding of the event. The main focus has always been in finding the aircraft to assist the Malaysian investigation team and to bring closure to the families of the passengers and crew of MH370.
Debris reports
These debris examination reports were released with the concurrence of the Malaysian ICAO Annex 13 Safety Investigation Team for MH370.
Debris report 1
Published: 19 April 2016 (amended 17 August 2017)
Download PDF:
Debris report 2
Published: 12 May 2016 (amended: 24 May 2016 and 17 August 2017)
Download PDF:
Debris report 3
Published: 15 September 2016 (amended 17 August 2017)
Download PDF:
Debris report 4
Published: 22 September 2016
Download PDF:
Debris report 5
Published: 7 October 2016 (amended 17 August 2017)
Download PDF:
Definition of underwater search areas - December 2015
Report release date: 03/12/2015
Executive summary
This report provides an update to the MH370 search area definition, described in previous ATSB reports. For background information, please see the ATSB publications MH370 - Definition of underwater search areas, 18 August 2014 and Flight Path Analysis Update, 8 October 2014 under the tabs on this web page.
Analysis of available data has been ongoing since the search for MH370 commenced. Initial results assisted the search and rescue mission, and later refinements have formed the basis for the underwater search areas.
The Australian Defence Science and Technology (DST) Group conducted a comprehensive analysis of the available data. The analysis used models of the Inmarsat satellite communications (SATCOM) data and a model of aircraft dynamics. Recorded meteorological data (wind and air temperature) were also modelled in the analysis. The SATCOM model was calibrated using SATCOM data and flight data from B777 flights including previous flights of the accident aircraft.
Validation experiments were conducted to ensure that predictions aligned with actual flight data. The output of the DST Group analysis was a probability density function (PDF) defining the probable location of the aircraft’s crossing of the 6th arc. These results were then extrapolated to the 7th arc. The analysis indicated that the majority of solutions only contained one significant turn after the last recorded radar data. DST Group have written a book called
detailing the entire analysis.
Performance analysis by Boeing produced a series of achievable ranges, with time intervals, for different cruise altitudes. It was noted that maintaining a constant altitude of FL350 or higher gave range values that closely matched the region on the arc corresponding to the DST Group analysis results. The DST Group and Boeing results were obtained independently, and it is significant that they were in general agreement.
In contrast to the series of data points that were recorded from the SATCOM system, only the following indirect information was available to assist the ATSB in determining the end-of-flight scenario and therefore determine a search area width:
- probable aircraft systems status
- simulator results
- review of previous accidents
- glide distance.
The original ATSB underwater search area definition report published in August 2014 identified a width of 20 NM behind the arc and 30 NM forward of the arc as the priority search area width. This primary priority width has been adjusted to make it symmetrical about the arc (20 NM on both sides). The ATSB has also defined and prioritised additional search area widths.
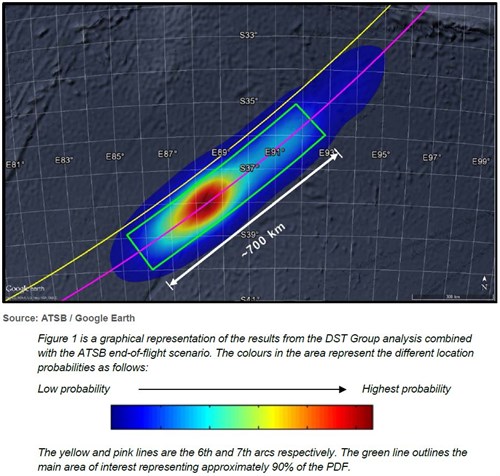
The probability distribution of the location of the aircraft is shown in Figure 1.
Figure 1: Probability distribution of the location of MH370
Ongoing work:
Any further evidence that becomes available, and may be relevant to refining the search area, will be considered.
| Download the final report PDF to read the report in full. See link in sidebar. |
Flight path analysis
Report release date: 08/10/2014
Executive summary
On 8 March 2014, flight MH370, a Boeing 777- 200ER registered 9M-MRO, lost contact with Air Traffic Control during a transition between Malaysian and Vietnamese airspace. An analysis of radar data and subsequent satellite communication (SATCOM) system signalling messages placed the aircraft in the Australian search and rescue zone on an arc in the southern part of the Indian Ocean. This arc was considered to be the location close to where the aircraft’s fuel was exhausted.
Refinements to the analysis of both the satellite and flight data have been continuing since the loss of MH370. The analysis has been undertaken by a team from the UK, US, Australia and Malaysia working both independently and collaboratively. Priority, medium and wide search areas were provided in the ATSB’s MH370 – Definition of Underwater Search Areas (June report).
The latest analyses indicate that the next, underwater, phase of the search should be prioritised further south within the wide search area. Work is continuing with refinements to the analysis of the SATCOM data.
This ongoing work may result in changes to the prioritisation and locale of search activity over the period of the underwater search.
| Download the final report PDF to read the report in full. See link in sidebar. |
Definition of underwater search areas - June 2014
Report release date: 26/06/2014
Executive summary
Published 26 June 2014: On 8 March 2014, flight MH370, a Boeing 777-200ER registered 9M-MRO, lost contact with Air Traffic Control during a transition of airspace between Malaysia and Vietnam. An analysis of radar data and subsequent satellite communication (SATCOM) system signalling messages placed the aircraft in the Australian search and rescue zone on an arc in the southern part of the Indian Ocean. This arc was considered to be the location where the aircraft’s fuel was exhausted.
A surface search of probable impact areas along this arc, coordinated by the Australian Maritime Safety Authority, was carried out from 18 March – 28 April 2014. This search effort was undertaken by an international fleet of aircraft and ships with the search areas over this time progressing generally from an initial southwest location along the arc in a north-easterly direction. The location of the search areas was guided by continuing and innovative analysis by a Joint Investigation Team of the flight and satellite-communications data. This analysis was supplemented by other information provided to ATSB during this period. This included possible underwater locator beacon and hydrophone acoustic detections.
No debris associated with 9M-MRO was identified either from the surface search, acoustic search or from the ocean floor search in the vicinity of the acoustic detections. The ocean floor search was completed on 28 May 2014.
Refinements to the analysis of both the flight and satellite data have been continuous since the loss of MH370. The analysis has been undertaken by an international team of specialists from the UK, US and Australia working both independently and collaboratively. Other information regarding the performance and operation of the aircraft has also been taken into consideration in the analysis.
Using current analyses, the team has been able to reach a consensus in identifying a priority underwater search area for the next phase of the search.
The priority area of approximately 60,000 km2 extends along the arc for 650 km in a northeast direction from Broken Ridge. The width of the priority search area is 93 km. This area was the subject of the surface search from Day 21-26.
Work is continuing with refinements in the analysis of the satellite communications data. Small frequency variations can significantly affect the derived flight path. This ongoing work may result in changes to the prioritisation and locale of search activity.
Updated: 18 August 2014: Following the public release of this report on 26 June 2014, the ATSB received a number of queries about some of the technical details contained in the report. As a result of the queries, the ATSB released an updated version of the report on 18 August 2014 to clarify a number of technical aspects. The changes to the report are detailed in the Addendum on the inside cover.
| Download the report PDF to read the report in full. See link in sidebar. |
Occurrence summary
| Investigation number | AE-2014-054 |
|---|---|
| Occurrence date | 08/03/2014 |
| Location | Southern Indian Ocean |
| State | International |
| Report release date | 03/10/2017 |
| Report status | Final |
| Investigation level | Systemic |
| Investigation type | External Investigation |
| Investigation status | Completed |
| Mode of transport | Aviation |
| Aviation occurrence category | Missing aircraft |
| Highest injury level | Fatal |
Aircraft details
| Model | 777-200ER |
|---|---|
| Registration | 9M-MRO |
| Aircraft operator | Malaysia Airlines |
| Sector | Jet |
| Operation type | Air Transport High Capacity |
| Departure point | Kuala Lumpur, Malaysia |
| Destination | Beijing, China |