Descent below segment minimum safe altitude during a non-precision instrument approach involving Airbus A320, PK-AXY, 17 km west-south-west of Perth Airport, Western Australia, on 19 February 2016

Final report

Report release date: 16/01/2018

Safety summary

What happened

On the evening of 19 February 2016, an Airbus A320 aircraft, registered PK-AXY and operated by PT Indonesia AirAsia was on a scheduled passenger service from Denpasar, Indonesia to Perth, Australia. During cruise, the captain’s flight management and guidance computer (FMGC1) failed. Due to the failure, the flight crew elected to use the first officer’s duplicate systems. For the aircraft’s arrival in Perth there was moderate to severe turbulence forecast below 3,000 ft with reports of windshear. The crew commenced an instrument landing system (ILS) approach to runway 21.

During the approach, the flight crew made a number of flight mode changes and autopilot selections, normal for an ILS approach with all aircraft operating systems available. However, some of those flight modes and autopilot selections relied on data from the failed FMGC1 and the autothrust system commanded increased engine thrust. The crew did not expect this engine response and elected to conduct a go-around. With an increasing crosswind on runway 21, the crew accepted a change of runway, to conduct a non-precision instrument approach to runway 06.

With the time available, the first officer programmed the new approach into his FMGC and conducted the approach briefing. During this period, the captain hand flew the aircraft and manually controlled the thrust. During the approach to runway 06, the crew descended the aircraft earlier than normal, but believed that they were on the correct flight path profile.

While descending, both flight crew became concerned that they could not visually identify the runway, and focused their attention outside the aircraft. At about that time, the approach controller received a “below minimum safe altitude” warning for the aircraft. The controller alerted the crew of their low altitude and instructed them to conduct a go-around. The crew then conducted another approach to runway 06 and landed.

What the ATSB found

The ATSB identified that the flight crew were unsuccessful in resolving the failure of the FMGC and had a limited understanding of how the failure affected the aircraft’s automation during the ILS approach. This resulted in the unexpected increase in engine thrust, which prompted a go-around.

The flight crew had a significant increase in workload due to the unresolved system failures, the conduct of a go-around and subsequent runway change. This, combined with the crew’s unfamiliarity and preparation for the runway 06 instrument approach, meant they did not effectively manage the descent during that approach.

The flight crew’s focus of attention outside the aircraft distracted them during a critical stage of flight. The crew did not detect that they had descended the aircraft below the specified segment minimum safe altitude.

The flight crew commenced their descent for the second runway 06 instrument approach later than normal, initially necessitating an increased rate of descent and at 300 ft the engine thrust reduced briefly to idle.

Safety message

Handling of approach to land is one of the ATSB’s SafetyWatch priorities. Unexpected events during the approach and landing can substantially increase what is often a high workload period. Adherence to standard operating procedures and correctly monitoring the aircraft and approach parameters provides assurance that the instrument approach can be safely completed. A go-around should be immediately carried out if the approach becomes unstable or the landing runway cannot be identified from the minimum descent altitude or missed approach point.


The occurrence

On the evening of 19 February 2016, an Airbus A320 aircraft, registered PK-AXY and operated by PT Indonesia AirAsia was on a scheduled passenger service from Denpasar, Indonesia to Perth, Australia. The aircraft was operated by two flight crew, four cabin crew and carried 96 passengers.

For the flight to Perth, the captain was the pilot flying (PF), with the first officer the pilot monitoring (PM).[1] A late requirement to change aircraft delayed the departure of the flight by 2 hours and the updated arrival time into Perth was estimated to be about 2130 Australian Western Standard Time.[2]

Departure and cruise

On departure from Denpasar Airport, the aircraft climbed to the cruise altitude of FL 370.[3] The flight proceeded normally until the aircraft was just over an hour from Perth when, at approximately 2024, the crew noticed that the captain’s multipurpose control and display unit (MCDU1)[4] had frozen and the captain’s navigation display (ND)[5] had the advisory message MAP NOT AVAIL. In addition, the first officer’s MCDU (MCDU2) displayed the message INDEPENDENT OPERATION, which indicated to the crew that the captain’s flight management and guidance computer (FMGC1)[6] had failed. Figure 1 depicts the location and interaction between the various equipment.

Figure 1: Schematic of A320 cockpit, depicting the location and interaction between various equipment
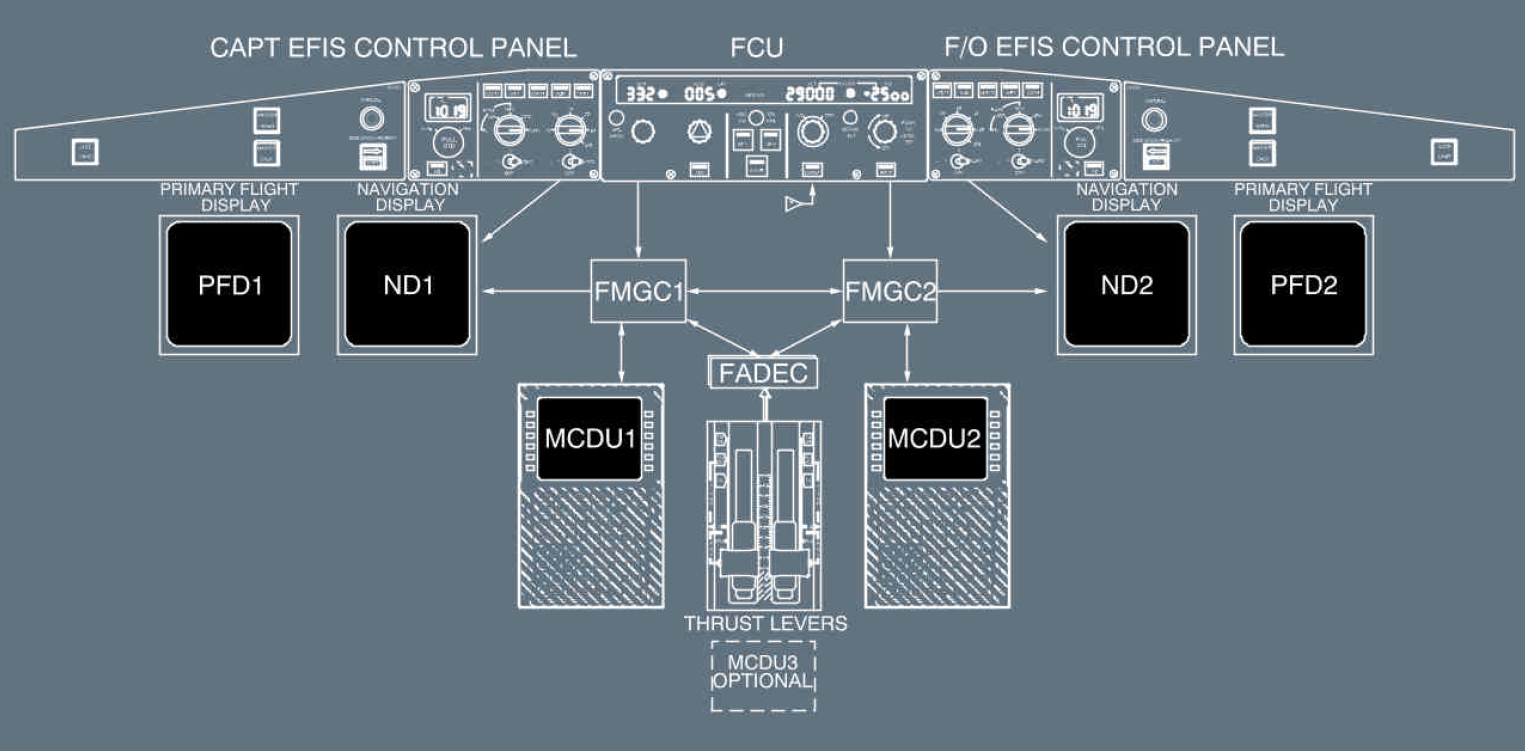
Figure 1: Schematic of A320 cockpit, depicting the location and interaction between various equipment

Source: Airbus Flight Crew Operating Manual

At the time of the FMGC1 failure, flight data indicated the aircraft was flying at a calibrated airspeed of 253 kt. A short time later, the captain recalled disengaging autopilot 1 (AP1)[7] and engaging autopilot 2 (AP2).

The flight crew reported that in an attempt to resolve the issues associated with the frozen MCDU1 screen and apparent FMGC1 failure, they referred to the Quick Reference Handbook (QRH) and the Flight Crew Operating Manual (FCOM) but they determined that there was no specific action for the failures. Instead, as the first officer’s FMGC (FMGC2) appeared to be operating normally, they decided to continue to Perth using his ND and MCDU, because these utilised the functioning FMGC. At 2040, about 15 minutes after the failure occurred, the crew climbed the aircraft to FL 380. The remaining 30 minutes of the cruise was uneventful.

Pre-descent planning and approach

Prior to the descent, the flight crew reviewed and briefed the approach altitude minima, planned arrival route, weather, go-around procedures, as well as conducting other normal pre-descent activities. For the aircraft’s arrival in Perth, moderate to severe turbulence was forecast below 3,000 ft, with visibility greater than 10 km and no significant cloud below 5,000 ft. As the crew had not identified any specific procedure for managing the FMGC failure, and the first officer’s duplicate systems appeared to be operating normally, his MCDU was used to program the arrival procedure and instrument landing system (ILS)[8] approach. The crew briefed that the first officer would take over as PF during the approach, as they believed it was better for the PF to have the functioning ND and MCDU.[9] The crew later reported that they did not identify or conduct further investigation to determine how the FMGC failure may affect continued flight operation or the conduct of the approach.

At about 2115, the flight crew commenced descent into Perth to conduct the JULIM 2A standard instrument arrival[10] and ILS approach to runway 21.[11] As the aircraft descended through 9,000 ft, the captain took over the role of PM while the first officer became PF.

The flight crew selected managed lateral and vertical descent modes[12] with AP2 selected. At about 2140 while descending through 5,000 ft, the crew received the first of three speed restrictions from air traffic control (ATC), which required a change from a managed speed mode to a selected speed mode,[13] to control the aircraft’s speed.

At about 2143, with the approach mode armed, the flight crew engaged AP1 and received a CAB PR LDG ELEV warning.[14] The warning was a result of engaging AP1 with an inoperative FMGC1.[15] This was because with both autopilots engaged, FMGC1 took precedence over FMGC2. The data programmed into FMGC1 at that time did not include the landing and approach data required for the aircraft’s flight management system to determine the cabin’s pressurisation schedule for the descent and landing. To resolve the cabin pressure warning, the crew set the cabin pressure to manual and continued the approach.

ILS approach to runway 21 and go-around

See Figure 2 for a profile view of the runway 21 ILS approach. At about 2144, the aircraft intercepted the localiser and the glideslope for the runway 21 ILS (Appendix A contains the aircraft track overlaid on the approach chart along with the flight data for the approach). At 2144:38, after reducing the aircraft’s selected speed to 160 kt and establishing the aircraft on the ILS, the selected altitude on the flight control unit (FCU)[16] was set to the go-around altitude, consistent with the operator’s standard operating procedure. A short time later, the flight crew elected to select a managed speed mode. This change resulted in the auto flight system attempting to capture the speed target contained in FMGC1 when it failed (which was 253 kt) and the autothrust system commanded an increase in engine thrust.

The flight crew recognised the increasing engine thrust and airspeed but they did not understand why it occurred. The captain told the first officer, ‘make a go-around’[17] and then advised ATC that they were conducting a go-around. From 2144:57, there was a period of 25 seconds where dual sidestick control inputs occurred. During this time, the autopilot automatically disengaged and the captain disconnected the autothrust system.[18] The recorded data indicated that neither the captain nor first officer pressed the priority takeover button[19] during this period. The captain recalled that at about 2,500 ft, at the flap 0 speed, he stated ‘okay, my control’ and took over as PF with the first officer taking the PM responsibilities. Recorded data indicates the captain had sole control of the aircraft at 2145:24, at an altitude of about 2,500 ft.

Figure 2: Profile view of the runway 21 ILS approach with aircraft flight profile (blue). The aircraft was on the ILS profile until the increase in engine thrust and go-around
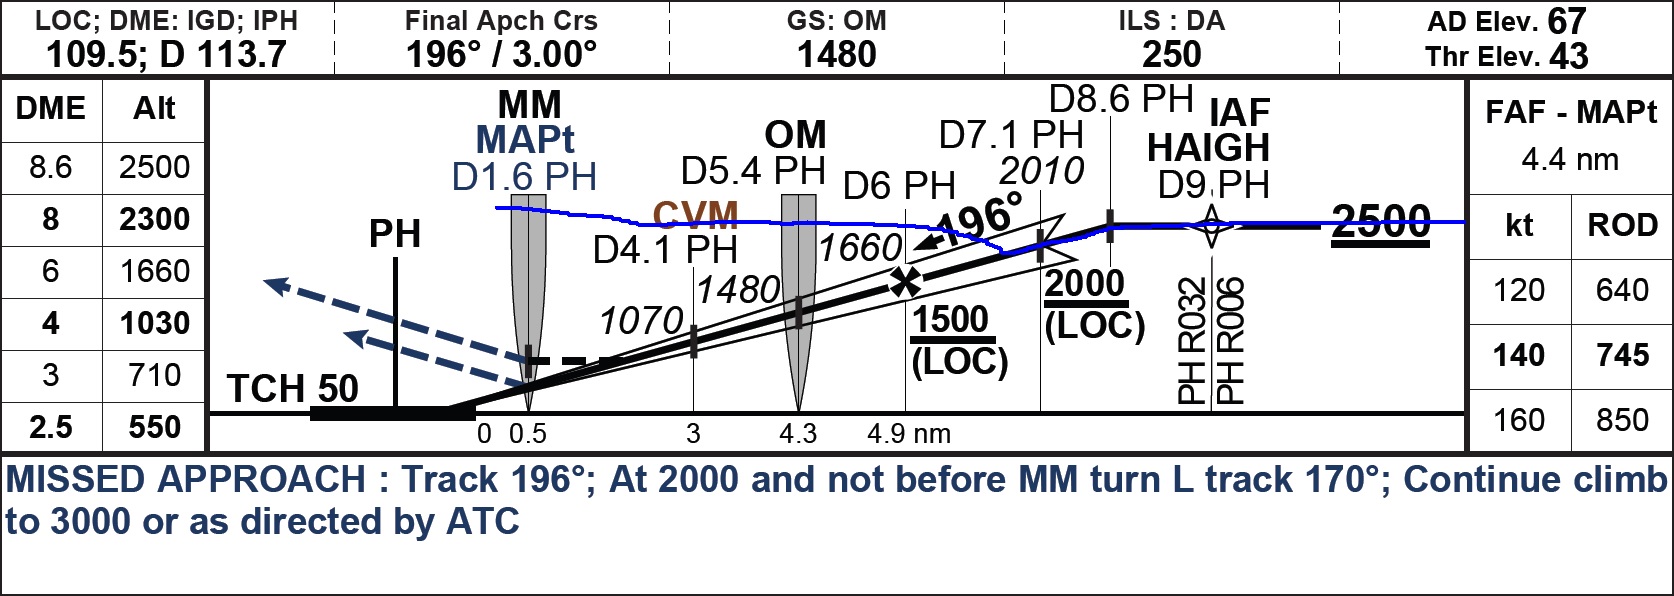
Figure 2: Profile view of the runway 21 ILS approach with aircraft flight profile (blue). The aircraft was on the ILS profile until the increase in engine thrust and go-around

Source: Naviga (modified by the ATSB)

After the go-around and vectoring for the runway 06 VOR approach

After taking control of the aircraft, the captain reconnected the autopilot and autothrust. The recorded flight data indicates that the AP1 was engaged for 12 seconds, with the autothrust engaged and active for 10 seconds. The captain then decided to disconnect the autothrust to manually fly the aircraft, due to his uncertainty over the thrust increase during the previous approach and failure of FMGC1. The recorded data indicates that when the autothrust was disconnected the thrust lever was below the climb detent. This positioning of the thrust lever meant that it was unlikely the flight crew received a thrust lock (further information is provided in the Autothrust system sub-section in the Context).

At 2146, the first officer requested ATC provide radar vectors for another ILS approach to runway 21. ATC provided radar vectoring and issued clearance for the approach. However, about 4 minutes later, ATC advised the flight crew that the crosswind for runway 21 had increased to 22 kt, with gusts to 25 kt. Due to the increased crosswind, ATC offered the crew the option of conducting a VHF Omni Directional Radio Range (VOR)[20] approach and landing on runway 06.[21] At 2152, after confirming the crew’s preference to land on runway 06, ATC vectored them to the final approach track to conduct the VOR approach.[22] The captain considered there was sufficient time to prepare for the approach, so did not perceive a need to enter a holding pattern to complete the briefing. At 2156, ATC informed the crew that a new ATIS was current and that there was moderate to severe turbulence below 3,000 ft.

The first officer later recalled programming FMGC2 for the VOR approach, and briefing the captain for the approach. The first officer also cross-referenced the information in the FMGC with his paper copy of the instrument approach chart. The captain stated that they conducted a short briefing instead of a full briefing because the situation was moving so quickly.

VOR approach to runway 06 and subsequent go-around

At 2200, ATC asked the flight crew twice if they were established on the 248 radial (which was the inbound track for the VOR procedure) and the first officer responded that they were 10 NM from the runway. ATC again asked the crew to confirm they were established, and the first officer replied stating, that they were ‘established on the inbound radial 068’.[23] In response, ATC cleared the crew to conduct a VOR runway 06 approach, with 10 NM to touchdown. Shortly after, the captain recalled the first officer asking, ‘do we descend now captain?’ In response, captain initiated a descent from 2,500 ft when the aircraft was at 9 DME[24] (Figure 3). Soon after, the landing gear was extended and the first officer selected 1,600 ft on the FCU for the next descent altitude limit. However, the operator’s Flight Crew Training Manual (FCTM) required that the go-around altitude be set on the FCU when established on final approach.[25] Coincidentally, 1,600 ft was the corresponding segment minimum safe altitude for the runway 03 VOR approach, whereas the published altitude for that stage of the runway 06 approach was 1,900 ft.

The captain elected to continue manually flying the aircraft using his primary flight display (PFD) and the first officer’s ND, and manually controlling the engine thrust due to the apparent automation failures. The first officer continued to monitor the descent gradient and vertical speed, and later recalled believing that they were on the correct descent profile. However, for most of the descent, the aircraft’s rate of descent exceeded the recommended rate (700 ft/min) that was published on the approach chart for the aircraft’s groundspeed. The maximum recorded rate of descent briefly reached 1,550 ft/min.

As the approach continued, the flight crew became concerned that they could not see the runway, and both crew became focused on locating the runway. The first officer later reported that because of this, he was no longer monitoring the approach segment minimum safe altitude constraint or was aware of the aircraft’s below flight path deviation during the descent. Although the FCU altitude was set to 1,600 ft, the autopilots were not engaged and the aircraft descended through the selected altitude without capturing the target altitude.

To assist in locating the runway, the first officer asked ATC if they were on the ‘left side of the runway or right side of the runway’. At about the same time, the ATC radar displayed a minimum safe altitude warning (MSAW). In response, the approach controller instructed the flight crew to ‘go round, you are low, low altitude alert, go round’. The flight crew acknowledged the alert and immediately conducted a missed approach. The aircraft had descended to an altitude of 1,473 ft, before the climb was initiated, which was about 400 ft below the segment minimum safe altitude (Figure 3). Aircraft track and flight data for the approach is available in Appendix B.

Figure 3: Profile view of first runway 06 VOR approach with aircraft flight profile (blue). The flight profile shows the crew descending the aircraft below the 2,500 ft segment minimum safe altitude and continuing below the 1,900 ft segment minimum safe altitude before conducting a go-around.
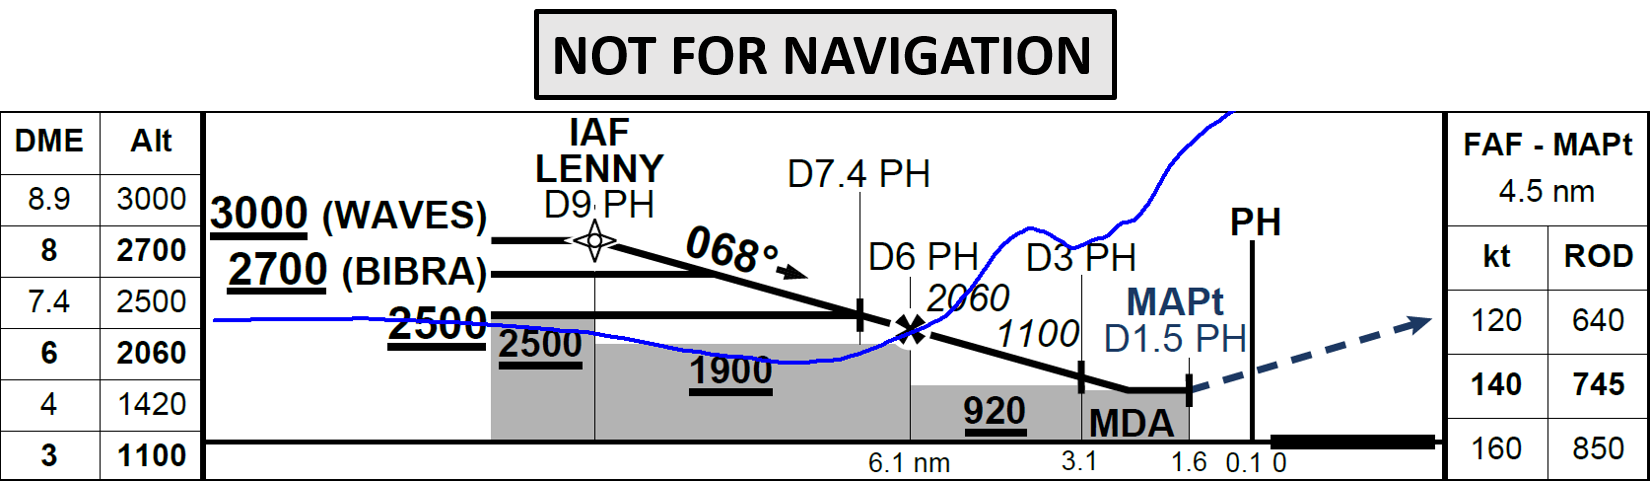
Figure 3: Profile view of first runway 06 VOR approach with aircraft flight profile (blue). The flight profile shows the crew descending the aircraft below the 2,500 ft segment minimum safe altitude and continuing below the 1,900 ft segment minimum safe altitude before conducting a go-around.

Source: Naviga (modified by the ATSB)

Preparation and conduct of the second runway 06 VOR approach

After completing the go around, ATC radar vectored the flight crew for another VOR approach for runway 06. At around 2204, while the aircraft was being radar vectored, the captain requested that the first officer take over as PF so he could review the approach chart.

At about 2208, the flight crew engaged the autothrust. It remained engaged and active for about 4 minutes, before the FCU autothrust pushbutton was pressed at 2212 and the thrust lock became active until the thrust levers were moved from the climb detent.[26] The crew re-engaged the autothrust about a minute later, and it remained active for 25 seconds before being disengaged, again via the FCU autothrust push button and resulting in a second thrust lock. The crew again moved the thrust levers clearing the thrust lock warning. The crew did not re-engage the autothrust for the remainder of the flight.

During the second VOR approach while the first officer was the PF, there were four occasions where the captain made sidestick control inputs. These inputs were between 2 and 3 seconds in duration and the recorded data indicates that they were not sufficiently large to activate the dual input alert. Neither of the flight crew could recall why the dual inputs occurred.

At about 2212, the captain requested ATC turn on the high intensity lighting on runway 06 as they were still having difficulty seeing the runway. ATC responded that there were no high intensity runway lights for that runway. At 2214, when the aircraft was at an altitude of 2,500 ft, inbound on the final approach track of the VOR and at about 8 DME, the captain took over as PF and the first officer resumed the PM role. At about the same time, ATC asked the crew if they had the runway in sight and informed them that the tower had increased the runway lighting intensity. Approaching 6 DME, the flight crew selected the FCU altitude to the minimum descent altitude for the VOR approach, again contrary to the operator’s procedure for conducting a non-precision instrument approach. The captain confirmed to ATC that the runway was in sight, and at about 5 DME, initiated descent from 2,500 ft to land on runway 06 (see Figure 4 for the profile view of their second approach to runway 06).

Due to the late commencement of the descent from 2,500 ft, the aircraft exceeded the recommended rate of descent (700 ft/min) for the aircraft’s groundspeed until 1,100 ft above the height of the runway threshold. In addition, the aircraft’s rate of descent was greater than 1,200 ft/min[27] for a period of 40 seconds, from an altitude of about 2,100 ft to 1,200 ft. In this period, the rate of descent averaged 1,380 ft/min. When the aircraft was 1,000 ft above the height of the runway threshold, the rate of descent was below 700 ft/min. For a period of 22 seconds, from 430 ft to 120 ft above ground level (AGL), the aircraft’s vertical speed exceeded 700 ft/min and increased to a maximum of 1,100 ft/min. As this decent rate was below 1,200 ft/min, it did not require a callout by the first officer. At 300 ft AGL, the engine thrust reduced briefly to idle and at this point, the aircraft did not meet the stabilised approach criteria. Aircraft track and flight data for the approach is available in Appendix C.

Recorded flight data indicated dual sidestick control inputs occurred, one at 300 ft AGL for one second, then three times from 120 ft AGL until landing with durations of 3 to 5 seconds, these inputs would have resulted in a dual control input alert. However, the aircraft landed without further incident.

Figure 4: Profile view of second runway 06 VOR approach with aircraft flight profile (blue)
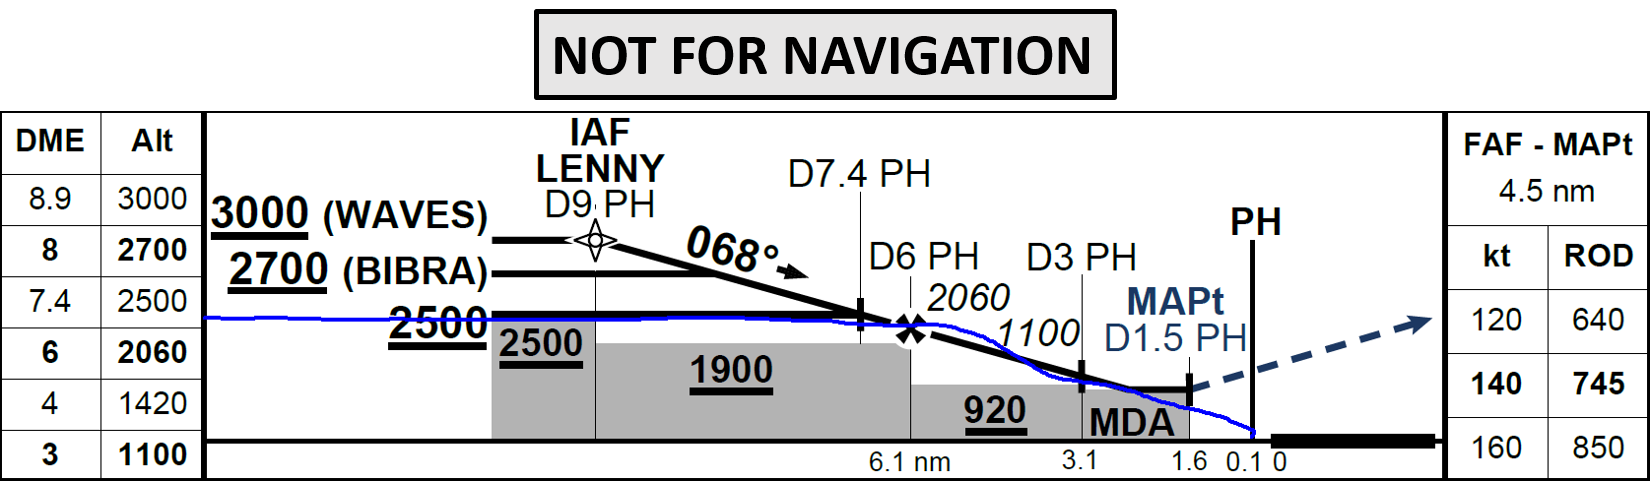
Figure 4: Profile view of second runway 06 VOR approach with aircraft flight profile (blue)

Source: Naviga (modified by the ATSB)

__________

  1. Pilot flying (PF) and Pilot monitoring (PM) are procedurally assigned roles with specifically assigned duties at specific stages of a flight. The PF does most of the flying, except in defined circumstances; such as when planning for the descent, approach and landing. The PM carries out support duties and monitors the PF’s actions and aircraft flight path.
  2. Australian Western Standard Time (AWST) was Coordinated Universal Time (UTC) +8 hours.
  3. At altitudes above 10,000 ft in Australia, an aircraft’s height is measured in hundreds of feet above the standard atmospheric pressure datum of 1013.25 hPa. A height 37,000 ft above that standard pressure datum would be expressed FL 370.
  4. The MCDU is used by the flight crew to enter flight planning into the flight management guidance system and can also display various flight navigation information.
  5. The ND is a flight deck information display that is part of the electronic flight instrument system which displays a selected navigation information to the flight crew.
  6. The FMGC provides aircraft navigation, lateral and vertical guidance and aircraft performance functions along a pre-planned flight route.
  7. AP1 utilises data from FMGC1.
  8. A standard ground aid to landing, comprising two directional radio transmitters: the localizer, which provides direction in the horizontal plane; and the glideslope, for vertical plane direction, usually at an inclination of 3°. This is a type of precision approach procedure, designed for 3D instrument approach operations.
  9. It would have been possible for the captain’s ND to mirror the first officer’s, if their ND range and mode settings were the same.
  10. A designated arrival route that links a significant point along the planned route to a point from which a published instrument approach procedure can be commenced.
  11. Runway 21 was a precision approach runway, equipped with a category I ILS and visual approach aids.
  12. Managed modes: When the aircraft is using managed targets, the Flight Management and Guidance System (FMGS) guides it along lateral and vertical flight paths and speed profiles computed by the Flight Management function (FM) from data in the MCDU. FM manages the guidance targets.
  13. Selected modes: When the flight crew is using selected targets, the FMGS guides the aircraft along lateral and vertical flight paths and speed profiles to meet targets that the flight crew has selected manually on the FCU. The flight crew selects the guidance targets.
  14. This warning indicates that the elevation of the landing airport is not available from the FMGC and consequently, the landing elevation must be manually selected.
  15. With a single autopilot engaged the on-side FMGC is master. With both autopilots engaged, FMGC1 is master.
  16. Flight control unit: Located on the cockpit glareshield and is the short-term interface between the flight crew and the FMGC. It is used to modify flight parameters and engage or disengage the autopilot and autothrust functions. Different guidance modes can be selected to change various targets (speed, heading, track, altitude, flight path angle and vertical speed).
  17. A manoeuvre in which the flight crew discontinues the approach, increases engine thrust and reconfigures the aircraft to climb.
  18. The autothrust was disconnected via the instinctive disconnect pushbutton on the thrust lever.
  19. See further details in REF _Ref458419455 \h \* MERGEFORMAT Handover/takeover procedures section.
  20. A ground-based navigation aid that emits a signal that can be received by appropriately-equipped aircraft and represented as the aircraft’s bearing (called a 'radial') to or from that aid.
  21. Runway 06 was a non-precision approach runway, equipped with visual approach aids and a navigation aid at the airport provided directional guidance to complete a straight-in approach.
  22. This was a non-precision approach procedure, designed for 2D instrument approach operations.
  23. To fly inbound towards the VOR on the 248° radial, the crew needed to select 068° on the omni bearing selector.
  24. Distance Measuring Equipment (DME) is a ground-based transponder station. A signal from an aircraft to the ground station is used to calculate its distance (in nautical miles) from the ground station.
  25. This procedure was stipulated to avoid any unwanted autopilot capture of the selected target altitude.
  26. See REF _Ref499907660 \h \* MERGEFORMAT Types of dual control inputs section for further information on the thrust lock condition and how crew are to respond to it.
  27. During the final approach, the PM was required to call out ‘sink rate’, when the descent rate exceeded 1,200 ft/min.

Context

Personnel information

The captain

The captain was an Indonesian national and held an Indonesian Airline Transport Pilot Licence (ATPL) and had accumulated about 13,500 hours of aeronautical experience. Of these, about 9,250 hours were in command and about 5,200 hours were on the A320. The captain reported flying into Perth 3 to 4 times a month (including a night approach on 13 February 2016), and conducting a VHF Omni Directional Radio Range (VOR) approach on runway 06 previously, although not often. The captain had conducted a VOR approach on 18 February, the day prior to the occurrence and reported that he regularly conducted non-precision VOR approaches into his home port of Denpasar.

The captain’s proficiency check records indicated that during the 6-month period prior to the occurrence he had successfully completed a non‑precision approach during his cyclic simulator training. His training record for September 2015 recorded competency with managing a flight management and guidance computer (FMGC) or instrument failure. The captain had been assessed as meeting the requirements of the International Civil Aviation Organization (ICAO) English language proficiency[28] at a level 4 standard.

The captain held the relevant Indonesian Certificate of Medical, First Class. That certificate required the pilot to wear corrective lenses for vision.

The first officer

The first officer, a Japanese national, held an Indonesian Commercial Pilot (Aeroplane) Licence (CPL) and had accumulated about 4,200 hours of aeronautical experience, with approximately 3,100 hours on the A320. The first officer had flown into Perth previously, but the occurrence flight was the first time he had conducted an approach into Perth at night, and it was his first runway 06 VOR approach. The first officer had conducted a VOR approach on the day prior to the incident and reported that he regularly conducted VOR approaches into Denpasar.

The first officer’s proficiency check records indicated that during the 6-month period prior to the occurrence he had successfully completed a non‑precision approach during his cyclic simulator training, including a non-precision approach and landing. The first officer had been assessed as meeting the requirements of the ICAO English language proficiency at a level 5 standard.

The first officer held the relevant Indonesian Certificate of Medical, First Class. That certificate required the pilot to wear lenses that correct for distance vision and possess glasses that correct for near vision.

Fatigue considerations

The flight crew reported feeling alert during the approaches. The ATSB reviewed their flight and duty times and 72-hour history prior to the occurrence, and found no evidence that they were likely to be affected by fatigue at the time of the incident.

Approach speed

The approach speed (VAPP) was computed for the crew by the flight management guidance computer (FMGC) and was based on the aircraft’s stall speed in the selected landing configuration, plus one third of the headwind component calculated from the airport wind entered by the flight crew into the FMGC.[29]

When operating in managed speed mode and to assist with maintaining the energy state of the aircraft in changing wind conditions, the FMGC also continuously calculated a target speed that took into account the instantaneous wind being experienced by the aircraft. That resulted in the target airspeed displayed to the crew on their primary flight displays increasing with strengthening headwind gusts and decreasing with weakening headwind or tailwind gusts (but not below VAPP). If the wind entered by the crew into the FMGC was the same as the instantaneous wind, then the target speed would be VAPP.

For the non-precision approaches to runway 06, the crew were operating the aircraft without the autopilot, autothrust engaged and consequently, were in selected speed mode, and the target speed displayed to the flight crew was VAPP.

Weather

At the time of the approaches, moderate to severe turbulence was forecast below 3,000 ft and ATC had received reports of windshear below 1,600 ft (see Table 1).

Table 1: Actual weather conditions as reported by successive ATIS reports at around the time of the flight by PK-AXY

Condition/requirementATIS and time issued
 ‘Romeo’ issued at 2132‘Sierra’ issued at 2153‘Tango’ issued at 2155
RunwayRunway 21Runway 06Runway 06
Wind120º M at 16 kt100º M at 16 kt gusting to 28 kt100º M at 16 kt gusting to 28 kt
CrosswindMax 16 ktMax 15 ktMax 15 kt
Cloud and visibilityCAVOK[30]CAVOKCAVOK
Significant weather warning

Moderate to severe turbulence reported below 3,000 ft

B737 reported moderate undershoot and overshoot windshear below 1,600 ft on final approach, runway 21 at 1330

Moderate to severe turbulence reported below 3,000 ft

Windshear warning

Moderate to severe turbulence reported below 3,000 ft

Analysis of the recorded information confirmed that turbulent conditions existed in the vicinity of Perth Airport at the time of the aircraft’s arrival. However, there were no activations of the aircraft’s windshear warning system[31] nor activation of the aircraft’s low-speed flight envelope protection systems.

Airport beacon and runway 06 lighting

The control tower at Perth Airport was equipped with a rotating aerodrome beacon, used to indicate the location of the airport from the air. The beacon alternated between a white and green flashing light, once every 6 seconds.

Runway 06/24 was equipped with high intensity runway lighting, selectable by the tower controller to six stages of intensity. It was also equipped with medium intensity runway lighting, selectable to three stages of intensity. There was no high intensity approach lighting for runway 06 or other lighting[32] to assist pilots identify the runway threshold, and nor was such lighting required. The high intensity runway lighting was selected to stage six (maximum intensity) for the crew’s second approach to runway 06.

Flight management guidance system failure

During the cruise, the flight crew received a red text message on the captain’s blank navigation display (ND) stating MAP NOT AVAIL and the first officer’s multipurpose control and display unit (MCDU2) displayed INDEPENDENT OPERATION. The captain’s ND remained inoperative, with the MAP NOT AVAIL message for the remainder of the flight.

The operator’s Flight Crew Operating Manual (FCOM) indicated that a ND may display a MAP NOT AVAIL message for several reasons:

  • The MODE CHANGE or RANGE CHANGE message has been displayed more than 6 seconds, or
  • The FMGC has failed, or
  • The FMGC has delivered an invalid aircraft position.

The MCDU may display an INDEPENDENT OPERATION message when the FMGCs operate independently of each other. In this case, the flight directors (FD) will also operate independently from one another, with the captain’s FD receiving data from FMGC1. The flight crew had access to the aircraft’s Quick Reference Handbook (QRH) and FCOM during flight. These documents were available for the crew to reference in the event of an aircraft system issue, such as a flight management guidance system (FMGS) failure.

Quick reference handbook

Within the ‘Abnormal and emergency procedures’ section of the QRH, under auto flight there is only one listed procedure, ‘Loss of FMS Data in Descent / Approach (Severe Reset)’. This procedure would not have been relevant at the time of the failure, as it occurred during cruise. However, the computer reset table located in the ‘Miscellaneous procedures’ section was relevant. The crew could not explain why they were unable to locate the relevant information.

The Airbus A320 QRH included a procedure to address one locked or blank MCDU, and another for both MCDUs locked (or blank) or FMGC malfunction. The inflight procedure for one locked/blank MCDU was to ‘Pull the CB [circuit breaker] for the locked or blank MCDU and push it back after 10 s[econds]’. The QRH procedure for both MCDU’s locked / FMGC malfunction was:

Short FMGC Reset: …

In flight:

‐ FD 1(or 2) (OFF)

‐ Pull the CB [circuit breaker] of the affected FMGC

‐ Reset it after 10 s[econds].

Long FMGC Reset: …

In flight:

‐ FD 1(or 2) (OFF)

‐ Pull the CB of the affected FMGC

‐ Reset it after 15 min[utes].

Note: Consider a long FMGC reset only if a short FMGC reset has no effect.

In this instance, the crew recognised that the frozen MCDU1 screen and other system indications suggested a FMGC failure, but conducted neither procedure.

Flight crew operating manual

The FCOM contained a number of different types of FMGS failures and related procedures. These were located in the Procedures section, under ‘Supplementary Procedures’. The table of contents for the supplementary procedures contained a section on auto flight with a subsection related to ‘FMGS Reset and Other Abnormal procedures’. The crew could not explain why they were unable to locate the relevant information.

The failure mode that most closely represented the messages the crew received, related to one flight management system (FMS) failing and latching, but with the FMS continuing to send valid but frozen guidance targets, corresponding to the last valid targets sent before the FMS failed. With this type of failure, the autopilot and FD on the affected side may remain available, and the failed FMGC continues to guide the aircraft using the frozen targets. The FCOM stated that the procedure for this failure is to:

DISREGARD the information coming from the failed side

DO NOT USE the AP [autopilot] on the affected side

- If the AP is engaged on the affected side:

FLY the aircraft back on the intended path

ENGAGE the AP on the operative side, according to the Recommended Practice for

Autopilot Engagement (Refer to FCTM/OP-030 Autopilot/Flight Director)

- If time permits:

PERFORM a long reset of the failed FMGC

Refer to PRO-SUP-22-10 Manual FMGS Reset - Manual Reset of One FMGC

- If the failure affects FMGC1, and if the FMGC1 is still failed and latched before the approach:

DO NOT USE AP1 for the approach

- Before disconnecting AP2:

REVERT to selected speed

DISCONNECT A/THR [autothrust]

Note: It prevents the A/THR from switching to the frozen speed target of the failed FMGC1 when the flight crew disconnects the AP2 for landing.

Dual control inputs on the sidestick

On the A320, each pilot has a sidestick that they can use to manually control the pitch and roll attitude of the aircraft. When the autopilot is engaged, the sidesticks are locked in the neutral position. If a pilot applies a force above a specific threshold, the sidestick becomes free and the autopilot disengages.

The handgrip on the sidestick contains a takeover push button. This button can be used to disconnect the autopilot or takeover from the opposite sidestick.

When the pilots move both sidesticks simultaneously, neither takes priority, and instead the system adds the signals of both sidesticks, with the total limited to the maximum deflection of a single sidestick. If there is a simultaneous deflection of both sidesticks, with a 2º off-neutral deflection, the two green ‘sidestick priority’ lights in the instrument panel’s glareshield illuminate and there will be a ‘dual input’ voice message.

Either pilot can deactivate the other sidestick and take full control by pressing and holding down the priority takeover pushbutton. If the takeover pushbutton is depressed for 40 seconds, the other sidestick is deactivated. It can be reactivated by momentarily pressing the pushbutton of either sidestick.

There was no record of either the captain or the first officer pushing the priority takeover pushbutton during the ILS approach, go-arounds, or during the remainder of the flight.

Handover/takeover procedures

To transfer controls the FCOM stated that the crewmembers must use the following callouts:

‐ To give control: The pilot calls out “YOU HAVE CONTROL”. The other pilot accepts this transfer by calling out “I HAVE CONTROL”, before assuming PF duties.

‐ To take control: The pilot calls out “I HAVE CONTROL”. The other pilot accepts this transfer by calling out “YOU HAVE CONTROL”, before assuming PM duties.

In addition, the Flight Crew Training Manual (FCTM) stated that ‘If the PM (or Instructor) needs to take over, the PM must press the sidestick takeover pushbutton, and announce: “I have control”.’

Types of dual control inputs

Airbus has analysed dual sidestick input events that have been reported to them. In Safety First, The Airbus Safety Magazine (December 2006), Airbus reports that they have found that there are three types of occurrences:

The “Spurious” Dual Stick inputs

Typically due to an inadvertent movement of the stick by the PNF [PM].

For example when grabbing the FCOM or when pressing the R/T [radio].

A spurious dual stick input only marginally affects the aircraft behavior due to only time limited & small inputs.

The “Comfort” Dual Stick inputs

Typically due to short interventions from the PNF [PM] who wants to improve the aircraft’s attitude or trajectory:

These are generally experienced in approach, during a capture (altitude localizer), or in flare, and have minor effects on the aircraft’s altitude/trajectory.

However, as the PF is not aware of the PNF’s [PM] interventions, he may be disturbed and may counteract the PNF’s [PM] inputs.

The “Instinctive” Dual Stick Inputs

Typically due to a “reflex” action on the part of the PNF [PM] on the stick. This instinctive reaction may come about when an unexpected event occurs, like for example an AP disengagement, an overspeed situation or a dangerous maneuver.

Such interventions are more significant in terms of stick deflection and duration. Usually in such situations, both pilots push the stick in the same direction, which may lead to over control, a situation illustrated by the above occurrence.

Autothrust system

Autothrust can be activated when the thrust levers are in the climb detent and the flight crew press the autothrust pushbutton on the flight control unit (FCU). When active the autothrust controls either airspeed or engine thrust as appropriate.

The autothrust will disconnect if the:

  • autothrust fails
  • autothrust pushbutton on the FCU is pressed[33]
  • instinctive disconnect button on the thrust lever is pressed
  • both thrust levers are set to idle.

The thrust lock function is activated when the thrust levers are in the climb detent and either of the flight crew pushes the autothrust pushbutton on the FCU, or the autothrust disconnects due to a failure. When this occurs, the thrust is locked at its level prior to disconnection. Moving the thrust levers out of the climb detent suppresses the thrust lock and associated warnings and gives the crew manual control with the thrust levers.

When the thrust lock function is active:

  • THR LK flashes amber on the flight mode annunciator (FMA)
  • electronic centralised aircraft monitor (ECAM) displays ENG THRUST LOCKED and this message flashes every 5 seconds
  • ECAM displays THR LEVERS …... MOVE
  • A single chime sounds and the master caution light flashes every 5 seconds.

Stabilised approach criteria

The FCOM specified that in visual conditions the approach should be stabilised at 500 ft above ground level (AGL). In order to be stabilised all of the following conditions had to be verified and meet at the stabilisation height:

  • the aircraft is on the correct lateral and vertical flight path
  • the aircraft is in the desired landing configuration
  • the thrust is stabilised, usually above idle, in order to maintain the target approach speed along the desired final approach path
  • there is no excessive flight parameter deviation.

If the aircraft was not stabilised by 500 ft AGL in visual conditions the crew were required to conduct a go-around, unless the flight crew estimated that only small corrections were necessary to rectify minor deviations from stabilised conditions due, amongst others, to external perturbations.

Non-precision instrument approach

The Flight Crew Training Manual (FCTM) indicated that the overall strategy for conducting a non-precision instrument approach was to fly it ‘ILS alike’ with the same mental image or representation and similar procedure. The use of autopilot was recommended for all non-precision approaches as it reduced flight crew workload and facilitated monitoring of the procedure and the aircraft’s flight path. If the flight crew correctly programmed the FMGC, the autopilot and FD would ensure lateral and vertical managed guidance was available to conduct the approach.

Depending on whether the autopilot was being used, the PF either monitored the progress of the approach or provided the manual inputs to manage the aircraft’s lateral and vertical navigation, normally using the guidance targets displayed on the FD. In addition, the FCTM indicated that when conducting a non-precision instrument approach, the PF ‘should expand the instrument scan to include outside visual cues’ as the aircraft approached the minimum descent altitude.

The operator’s FCTM stipulated setting the go-around altitude on the FCU when the aircraft was established on final approach and if in a selected mode, the current aircraft altitude was below the missed approach altitude. The FCTM also prohibited setting the minimum descent altitude as the target altitude on the FCU, which could cause a spurious altitude capture and destabilisation of the approach at a critical stage.

Communication and standard callouts

The FCTM stated that if, for any reason, one parameter deviates from stabilised approach conditions, the PM will make the appropriate callout as follows:

ParameterExceedanceCallout
Indicated airspeedSpeed target +10 kt / -5 kt“SPEED”
Vertical speedDescent rate exceeds 1,200 ft/min“SINK RATE”
Pitch altitude+10º / -2.5º“PITCH”
Bank angle7º“BANK”
ILS OnlyLocaliserExcess deviation½ dot PFD“LOC”
 Glideslope ½ dot PFD“GLIDE”
Non precision approachCross track error greater than 0.1 NM“CROSS TRACK”
 Vertical deviation greater than ½ dot“V/DEV”
 Course greater than 2.5º (VOR)“COURSE”
 Course greater than 5º (Automatic direction finder)“COURSE”
 Altitude distance check“___FT HIGH (LOW)”


Altitude callouts were also to be made by the PM through to landing. Neither the captain nor first officer recollected any callouts being made.

Related occurrences

A search of the ATSB database for similar occurrences in the last 5 years was conducted. The search did not identify any occurrences where a flight crew had difficulty locating Perth Airport or the runways in CAVOK conditions.

The database contained six occurrences where an enhanced ground proximity warning system (EGPWS) glideslope warning had occurred during the runway 06 VOR approach. Of these, four related to the inadvertent selection of the ILS for another runway. There were a further 25 cases of glideslope warnings where the runway was not identified in the occurrence details. There was one record of an EGPWS terrain warning occurring at Perth although the approach involved was not identified. The occurrence details in that case suggested the terrain warning was spurious. There were no occurrences recorded in the ATSB occurrence database where an minimum safe altitude warning was issued by ATC during a runway 06 approach.

ATSB investigation AO-2010-027

On 4 and 29 May 2010, an Airbus A330 aircraft, operated by AirAsia X was involved in two separate occurrences on approach to the Gold Coast, Queensland, where the aircraft were descended below the segment minimum safe altitudes.[34] On both occasions, there was low cloud and reduced visibility on arrival at the Gold Coast. The ATSB found that these events were indicators of a minor safety issue regarding the operator's training of its flight crews, in relation to non-precision approaches.

ATSB investigation AO-2011-086

On 24 July 2011, a Boeing Company 777-3D7 aircraft, operated by Thai Airways, was conducting a runway 34 VOR approach to Melbourne Airport, Victoria.[35] During the approach, the tower controller observed that the aircraft was lower than required and asked the flight crew to check its altitude. The tower controller subsequently instructed the crew to conduct a go-around. However, while the crew did arrest the aircraft’s descent, there was a delay of about 50 seconds before they initiated the go-around and commenced a climb to the required altitude.

The ATSB established that the pilot in command may not have fully understood some aspects of the aircraft’s automated flight control systems and probably experienced ‘automation surprise’ when the aircraft pitched up to capture the VOR approach path. As a result, the remainder of the approach was conducted using the autopilot’s flight level change mode, where the aircraft’s rate of descent may be significantly higher than required. In addition, the flight crew inadvertently selected a lower than stipulated descent altitude, resulting in descent below the specified segment minimum safe altitude for that stage of the approach.

ATSB investigation AO-2011-076

On 30 June 2011, an Airbus A320 aircraft, operated by Tiger Airways Australia conducted a go-around procedure at Avalon Airport, Victoria, after an unsuccessful approach to runway 18.[36] While re-positioning the aircraft for another approach, this time on the reciprocal runway 36, the aircraft descended without further ATC clearance to below the assigned altitude. The flight crew was subsequently cleared for a visual approach; however, the aircraft descended to below the minimum permitted altitude of 2,000 ft, to 1,600 ft. The ATSB investigation found that the flight crew’s understanding of the aircraft’s position during the second approach was probably influenced by the workload associated with the runway change.

ATSB investigation AO-2016-124

On 11 September 2016 an Airbus A330 aircraft, operated by AirAsia X descended below the segment minimum safe altitude, near the Gold Coast Airport, Queensland.[37] The flight crew were cleared to conduct a RNAV-Z (GNSS) instrument approach to runway 14 at Gold Coast Airport in visual meteorological conditions. During the approach, the aircraft was observed to descend below a segment minimum safe altitude. At the time of publication, the ATSB investigation was ongoing.

__________

  1. ICAO has defined six levels of language proficiency, the top three levels (4, 5 and 6) are acceptable for operational flight crew. Level 4 (operational) requires retesting every 3 years, level 5 (extended) requires retesting every 6 years and level 6 (expert) does not require further testing.
  2. The calculation of VAPP by the FMGC was limited to the stall speed plus 5 kt as a minimum and stall speed plus 15 kt as a maximum. The FMGC-calculated value of VAPP can also be modified by the flight crew.
  3. Ceiling and visibility OK, meaning that the visibility, cloud and present weather are better than prescribed conditions. For an aerodrome weather report, those conditions are visibility 10 km or more, no significant cloud below 5,000 ft or cumulonimbus cloud and no other significant weather within 9 km of the aerodrome.
  4. Windshear detection is provided during takeoff and landing. During landing, the system is active from 1,300 ft to 50 ft radio altitude, with wing slat/flap selected.
  5. Such lighting could include runway lead-in lighting, runway threshold identification lights and sequenced flashing lights.
  6. This is not a recommended method of disconnecting the autothrust, as it will result in the engines entering the thrust lock mode.
  7. ATSB AO-2010-027, Operational non-compliances - Airbus A330, 9M-XXB, Gold Coast Airport, Queensland, 4 and 29 May 2010. Available from www.atsb.gov.au.
  8. ATSB AO-2011-086, Operational non-compliance involving Boeing 777, HS-TKD, 15 km south Melbourne Airport, Vic, 24 July 2011. Available from www.atsb.gov.au.
  9. ATSB AO-2011-076, Descent below the minimum permitted altitude, Airbus A320, VH-VNC, 15 km SSE of Avalon Airport, Vic, 30 June 2011. Available from www.atsb.gov.au.
  10. ATSB AO-2016-124, Decent below segment minimum safe altitude involving Airbus A330-343X, 9M-XXI, near Gold Coast Airport, Qld, on 11 September 2016. On completion, a copy of the investigation report will be available from www.atsb.gov.au.

Safety analysis

During the flight, the captain’s flight management guidance computer (FMGC1) failed. The flight crew’s response to this and their utilisation of FMGC1 during the runway 21 instrument landing system (ILS) approach, resulted in an unexpected increase in engine thrust and subsequent go-around. After conducting the go-around, they were required to change runways due to increased crosswind and conduct a VHF Omni Directional Radio Range (VOR) approach onto runway 06. During this VOR approach, air traffic control (ATC) received a minimum safe altitude warning, prompting the controller to alert the crew of their low altitude and instructed them to conduct a go-around. Subsequently, the flight crew made another approach for runway 06 and the aircraft landed safely.

The following analysis discusses the crew’s understanding and management of the FMGC failure, their systems knowledge, and the human performance factors that affected the management of the approaches, which resulted in two go-arounds.

Crew response to the flight management guidance system failure

During the cruise, when the captain identified that his multipurpose control and display unit (MCDU1) had frozen and the navigation display (ND) map became unavailable, the flight crew correctly identified an FMGC1 failure. However, they could not locate any information about how to resolve it in the aircraft’s manuals. Had they found the MCDU and FMGC reset procedures in the Quick Reference Handbook (QRH), the crew may have been able to rectify the failure. This would have provided normal operation of the captain’s navigation display ND and MCDU. With an operational MCDU, the captain would have been able to input the approach and aerodrome data into the FMGC1 and the unexpected increase in engine thrust would not have occurred.

Additional information on the failure mode was available in the Flight Crew Operating Manual (FCOM), but the flight crew did not find this information in that manual. The investigation was unable to determine why the crew did not locate the relevant information. This failure to find and action the QRH and FCOM, meant the aircraft systems remained degraded for the rest of the flight.

Understanding of system interactions and subsequent crew decision making during the runway 21 ILS approach

The flight crew discussed the FMGC1 failure during their first approach briefing and decided to use the first officer’s functioning MCDU (MCDU2) and ND on the descent. Because the crew had not previously found the information in the FCOM relating to the failure, they did not understand how it could affect the interactions between the aircraft systems and hence the conduct of the descent. They were therefore unaware that both autopilots, and in particular autopilot 1 (AP1), should not have been engaged during the instrument approach. The reason for not engaging AP1 was that FMGC1 took primacy over the first officer’s FMGC (FMGC2) when both autopilots were used and the data in FMGC1 had frozen at the time of failure.

When the flight crew engaged AP1 during the first approach, they did not recognise that the subsequent cabin pressure fault was related to the engagement of AP1 and its utilisation of FMGC1 data. Additionally, the crew did not realise that the FMGC1 target speed at the time of failure (253 kt) would be utilised when the speed mode was changed from a selected mode (which had a target speed of 160 kt at the time), to a managed mode after AP1 was engaged.

The issue of flight crew understanding systems interactions is not limited to this occurrence. In response to the increase in incident and accident reports of flight crew experiencing difficulties using flight path management systems, a United States Federal Aviation Administration-led Flight Deck Automation Working Group analysed several data sources to produce findings and recommendations for the use of automation on modern flight decks. The working group found that operators had concerns with the level of flight crew skills required for managing automated system malfunctions and/or failures. The working group was cognisant that it was impossible to train pilots in all possible malfunction situations or failure scenarios. They stated that pilots needed to be prepared to recognise the results of partial and complete system failures and intervene appropriately (PARC/CAST Flight Deck Automation Working Group, 2013).

Crew’s understanding of systems interactions and dual control inputs

In this case, the flight crew’s lack of understanding of how the systems interacted led to inappropriate system selections and resulted in the increase in engine thrust. Although the failure of FMGC1 had not been resolved by the flight crew prior to the aircraft commencing descent, FMGC2, MCDU2, autopilot 2 (AP2) and engine autothrust were all capable of normal operation and could have been used to complete the approach normally.

Although the flight crew elected to conduct a go-around when the engine thrust unexpectedly increased, there was a period of 25 seconds where dual sidestick control inputs occurred, prior to the captain taking over control of the aircraft. These dual control inputs indicate a level of confusion and lack of communication regarding conduct of the go-around and about which pilot was in control of the aircraft. There were other instances of dual control inputs of short duration (less than 5 seconds). While these inputs did not affect the flight, there have been other instances where sustained dual control inputs have had a detrimental effect on the control of the aircraft.

Reaction to automation functionality and decision making

Following the go-around and without understanding the reason for the increase in engine thrust or the effect the FMGC1 failure had on the system, the flight crew briefly re-engaged AP1. Due to doubts about the functionality of the automation, the captain then elected to reduce the level of automation, and manually fly the aircraft. This decision presented as being intuitively derived from patterns of behaviour the captain had used successfully in the past. The decision had the effect of removing the potentially problematic automation, but it also increased the crew’s workload.

Researchers (Klein 2008, Kahneman, 2011) have stated that, in time-constrained environments, individuals can make decisions using intuitive reasoning where the steps are often unconscious and based on pattern recognition. For intuitive or naturalistic decision-making, an experienced individual will identify a problem situation as similar or familiar to a situation they have dealt with before and will extract a plan of action from memory. If time permits, they will confirm their expectations prior to initiating action. If time does not permit, actions will need to be initiated with uncertainty that may result in a poor decision.

Crew workload after the initial go-around

Workload has been defined by Orlady and Orlady (1999) as:

…reflecting the interaction between a specific individual and the demands imposed by a particular task. Workload represents the cost incurred by the human operator in achieving a particular level of performance (p.203).

The available cognitive resources are finite and will vary depending on the experience and training of the individual as well as the level of stress and fatigue experienced. Workload is managed by balancing task demands such that, when workload is low, tasks are added and when workload becomes excessive, tasks are shed (Orlady and Orlady, 1999). Tasks, such as internal and external communication, can be shed in an efficient manner by eliminating low priority tasks or they can be shed inefficiently by abandoning important tasks. The task demands can be influenced by the mental and physical requirements of the task, as well as the time available (Wickens and Hollands, 2000).

Factors increasing crew workload

After the first approach, the flight crew’s workload increased substantially with the following conditions:

  • although the engine autothrust, AP2 and FMGC2 were still operating normally, the crew became uncertain about the automation’s functionality and elected to manually control the engine thrust and fly the aircraft using raw data.
  • the crew had limited experience, outside of simulator sessions, flying approaches manually.
  • the turbulent conditions increased the attention required by the captain to maintain desired heading, pitch attitude and airspeed.
  • the unexpected runway change meant the crew needed to program the approach into the first officer’s MCDU, review the approach and conduct a briefing prior to the approach.
  • the unexpected runway change and reduced timeframes limited the time available for the crew to review the approach charts.
  • the captain’s ND was still in operating in a degraded mode and was not displaying lateral tracking guidance for the VOR approach nor the information from the distance measuring equipment (DME). For that information, the captain needed to refer to the first officer’s ND on the other side of the cockpit instrument panel.
  • the captain’s flight director (FD) was still referencing the frozen FMGC1 and was not providing valid FD attitude guidance targets.
  • while the crew were experienced in flying non-precision VOR approaches, they had limited experience flying the Perth runway 06 VOR approach at night. The first officer reported never having flown the approach before.

Recorded data indicates that there was 8 minutes from making the decision to conduct the VOR approach to when the flight crew confirmed they were established on the approach, at 10 NM. The limited time available to prepare for the approach, combined with the degraded systems, would have further increased their workload.

Effect of increased workload

Workload and time pressure can lead to a reduction in the number of information sources an individual may access, and the frequency or duration of time these sources are checked (Staal, 2004). Amongst other effects, a high workload can result in individuals not understanding the implications of the information they are presented with.

In this occurrence, the captain’s workload was increased due to the decision to hand-fly the aircraft using the first officer’s ND for lateral tracking guidance and distance information during the VOR approaches. This increased workload made it more likely that, in the visual conditions, he would try and continue the approach using external visual reference.

The flight crew’s workload impacted their ability to manage the approaches and was evidenced by the shedding of tasks, such as:

  • reviewing the approach charts,
  • monitoring of the flight profile,
  • descending the aircraft without confirming the aircraft position,
  • neither crew member observing the DME distance,
  • breakdown in the crews’ use of standard operating procedures, such as selecting altitudes other than the missed approach altitude on the flight control unit, while conducting the non-precision instrument final approach.

Had the flight crew elected to hold and prepare prior to conducting the approach, they may have reduced their workload, improved their preparations and conducted a thorough briefing prior to conducting the unfamiliar approach.

Preparation and conduct of the first runway 06 VOR approach

During the first runway 06 VOR approach, the flight crew’s focus of attention was outside the aircraft, attempting to locate the runway. Although the crew were conducting the instrument approach in visual conditions, more attention should have been given to maintaining the aircraft on the prescribed instrument approach flight path profile, until reference was made to the runway landing environment and/or the instrument approach was discontinued. The following content explains how the crew's ability to monitor and maintain the correct flight profile and altitude during the approach was likely hindered. This resulted in the aircraft descending below the specified minimum safe altitude without being detected by the crew.

Crew focus of attention

The captain could not identify the runway and requested assistance from the first officer. Both flight crew then focused on locating the runway, with neither appearing to monitor the aircraft’s flight profile. The crew first became aware of the altitude constraint and that the aircraft had descended below it when advised by ATC. This indicates that both crew were distracted and neither was monitoring the approach at this time. Further indications that the crew was distracted from monitoring the approach included:

  • the captain took the first officer’s question about when to initiate descent as a prompt to descend without confirming the aircraft’s position.
  • the lack of detection that the aircraft was descended early.
  • the first officer thought aircraft was on correct profile because he observed an appropriate initial descent rate.
  • the descent rate increased substantially above that necessary for a 3-degree approach.
  • neither crew member observed the DME distance, after initiation of descent.
  • the first officer could not recall communicating altitude or distance information during the approach.
Crew ability to monitor the approach

Monitoring is an extensive set of behavioural skills that all flight crew are expected to have. This skill set is specified in the aircraft operator’s standard operating procedures and involves the primary roles of monitoring the aircraft’s flight path, communications and the activities of the pilot flying. The UK Civil Aviation Authority (UK CAA) (2013) has defined monitoring as:

The observation and interpretation of the flight path data, configuration status, automation modes, and on-board systems appropriate to the phase of flight. It involves a cognitive comparison against the expected values, modes, and procedures. It also includes observation of the other crew member and timely intervention in the event of deviation. (p.9)

The difficulties that flight crew have with maintaining effective monitoring are thought to be due to not directly controlling the system being monitored. Humans are inherently poor at maintaining vigilance for infrequent events and equipment failures in modern airline operations are rare. Flight crew rarely receive direct feedback on the effectiveness or consistency of their monitoring unlike the feedback they would receive when they may fly an aircraft manually (UK CAA, 2013).

Researchers (Dismukes & Berman, 2010) found that in most instances where flight crew were failing to monitor the aircraft state or position, there were competing concurrent task demands on the crew’s attention. Humans have a limited ability to divide attention amongst tasks and generally, have to switch attention back and forth between tasks. This leaves an individual vulnerable to losing track of the status of one task while being engaged in another.

Other factors affecting awareness of the flight profile

Believing they were on the correct profile, based on the vertical speed the first officer observed early in the descent, combined with the night conditions, and unfamiliarity with the approach reduced the visual cues outside of the cockpit available to the crew regarding the aircraft’s position. The reduced external visual cues along with the crew not utilising the available internal visual cues, such as the course deviation indicator, distance information and multifunction display, led to the crew not understanding where they were on the flight profile or where they were with respect to the runway.

Communication during the approach

The flight crew missed opportunities to identify the early descent, higher than normal rate of descent and descent below the segment minimum safe altitude because they were focused outside the cockpit rather than monitoring their primary flight instruments. The first officer did not provide the captain with the standard altitude and distance callouts, nor with an alert about the rate of descent, which resulted in the aircraft flying below the flight profile. This potentially reduced the captain’s awareness of the deviations from the standard approach and limited his ability to correct it. That communication was particularly important given that the crew had not optimised the aircraft’s remaining systems, with the captain attempting the approach without his ND and FD attitude guidance targets on his primary flight display.

Preparation and conduct of the second runway 06 VOR approach

During the vectoring for the second runway 06 VOR approach, the captain took on the pilot monitoring role. This gave the captain the opportunity to review the approach data and familiarise himself with the required flight profile. The captain returned to the role of pilot flying soon after the initial approach fix and elected to obtain visual contact with the runway prior to initiating the descent. Due to the late descent, the aircraft’s rate of descent was greater than 1,200 ft/min for a period of the approach (although it was stabilised by 1,000 ft).

Due to the captain manually controlling the engine thrust and the turbulence, the engine thrust was briefly at idle at about 300 ft above ground level, which did not meet the stabilised approach criteria and was coincident with an increasing rate of descent. Unstable approaches are known to increase risks in landing, although in this instance the landing was completed without further incident.

Findings

From the evidence available, the following findings are made with respect to the operational event involving an Airbus A320, registered PK-AXY and operated by PT Indonesia AirAsia that occurred 17 km west-south-west of Perth Airport, Western Australia on 19 February 2016. These findings should not be read as apportioning blame or liability to any particular organisation or individual.

Safety issues, or system problems, are highlighted in bold to emphasise their importance. A safety issue is an event or condition that increases safety risk and (a) can reasonably be regarded as having the potential to adversely affect the safety of future operations, and (b) is a characteristic of an organisation or a system, rather than a characteristic of a specific individual, or characteristic of an operating environment at a specific point in time.

Contributing factors

  • The flight crew’s diagnosis of the captain’s failed flight management guidance computer was accurate, but after they did not find the procedure to follow, the failure was not appropriately managed. This resulted in degraded systems capability for the approach.
  • The flight crew had a limited understanding of how the captain’s failed flight management guidance computer would affect the use of the aircraft’s automated systems during the instrument landing system approach. This meant that their decision to engage autopilot 1 resulted in the frozen data stored in the failed guidance computer being utilised by the auto flight system, leading to an unexpected increase in engine thrust and prompted the crew to conduct a missed approach.
  • The unresolved system failures, combined with the conduct of a missed approach procedure and the subsequent runway change increased the flight crew's workload. This likely reduced their ability to analyse the actual extent to which their automation was degraded, and effectively manage the subsequent approaches.
  • During the first runway 06 non-precision approach, the flight crew’s focus of attention was outside the aircraft, attempting to locate the runway. This distraction, along with their unfamiliarity with the approach procedure, inhibited their ability to monitor and maintain the correct flight profile and altitude during the approach. The flight crew did not detect that the aircraft had descended below the segment minimum safe altitude for that stage of the approach.

Other safety factors

  • During the flight, multiple dual control inputs occurred, which in other circumstances have resulted in aircraft responding in an unexpected manner.
  • The aircraft's flight path profile was not adequately monitored or communicated between the flight crew during the non-precision instrument approaches to runway 06. This reduced the captain’s awareness of any deviation from the prescribed approach and limited his ability to correct it.
  • The second runway 06 non-precision instrument approach did not meet the stabilised approach criteria for a short period during the final approach, increasing the safety risk of the landing.

Safety issues and actions

All of the directly involved parties were provided with a draft report and invited to provide submissions. As part of that process, each organisation was asked to communicate what safety actions, if any, they had carried out or were planning to carry out.

Whether or not the ATSB identifies safety issues in the course of an investigation, relevant organisations may proactively initiate safety action in order to reduce their safety risk. The ATSB has been advised of the following proactive safety action in response to this occurrence

As a result of this occurrence, PT Indonesia AirAsia have taken the following proactive safety action:

  • Implemented additional classroom sessions on aircraft line-check into the re-training program.
  • Incorporated the incident as a subject of the SPOT (Special Orientation Training) in the simulator syllabus.

Sources and submissions

Sources of information

The sources of information during the investigation included the:

  • aircraft operator, PT Indonesia AirAsia
  • aircraft flight crew
  • provider of air traffic services, Airservices Australia
  • manufacturer of the aircraft, Airbus.

References

Dismukes, R.K., and Berman, B. (2010). Checklists and monitoring in the cockpit: Why crucial defences sometimes fail. NASA/TM-2010-216396, NASA Ames Research Centre, Moffett Field, CA.

Kahneman, D. (2011). Thinking, fast and slow. Allen Lane: London, UK.

Klein, G. (2008). Naturalistic decision making. Human Factors, Vol 50, No.3, pp.456-460.

Orlady, H.W., and Orlady, L.M. (1999). Human factors in multi-crew flight operations. Ashgate: Aldershot, UK.

PARC/CAST Flight Deck Automation Working Group. (2013). Operational use of flight path management systems. US Federal Aviation Administration.

Staal, M.A. (2004). Stress, cognition, and human performance: A literature review and conceptual framework. NASA/TM-2004-212824, NASA Ames Research Centre, Moffett Field, CA.

UK Civil Aviation Authority. (2013). Monitoring matters: Guidance on the development of pilot monitoring skills. Loss of Control Action Group, CAA Paper 2013/02, West Sussex, UK.

Wickens, C.D., and Hollands, J.G. (2000). Engineering psychology and human performance (Third edition). Prentice Hall: New Jersey, US.

Submissions

Under Part 4, Division 2 (Investigation Reports), Section 26 of the Transport Safety Investigation Act 2003 (the Act), the Australian Transport Safety Bureau (ATSB) may provide a draft report, on a confidential basis, to any person whom the ATSB considers appropriate. Section 26 (1) (a) of the Act allows a person receiving a draft report to make submissions to the ATSB about the draft report.

A draft of this report was provided to PT Indonesia AirAsia, the aircraft flight crew, Airservices Australia, the Civil Aviation Safety Authority, Airbus and the French Bureau d'Enquêtes et d'Analyses pour la sécurité de l'aviation civile.

Submissions were received from PT Indonesia AirAsia, Airservices Australia, the Civil Aviation Safety Authority, Airbus and the French Bureau d'Enquêtes et d'Analyses pour la sécurité de l'aviation civile. The submissions were reviewed and where considered appropriate, the text of the report was amended accordingly.

Appendices

Appendix A – Runway 21 ILS approach, aircraft track and flight data

Figure A1: Runway 21 ILS approach with aircraft track (blue)
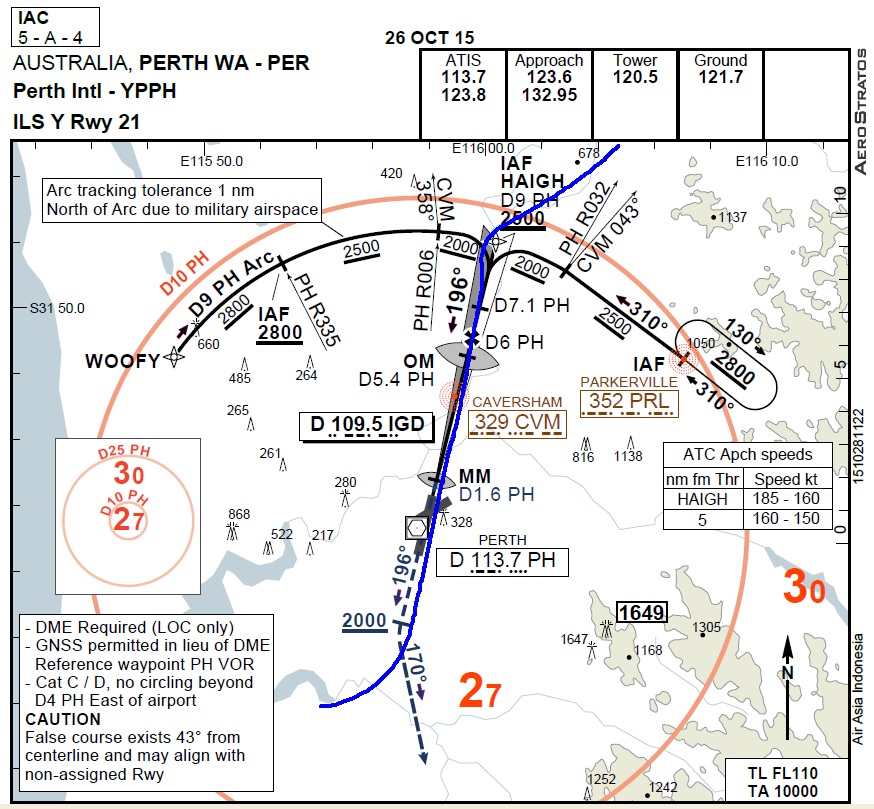
Figure A1: Runway 21 ILS approach with aircraft track (blue)

Source: Naviga (modified by the ATSB)

Figure A2: Flight data showing autopilot and mode selections with a resulting thrust and speed increase during the runway 21 ILS approach. The descent depicted is from 3,000 ft to 2,000 ft.
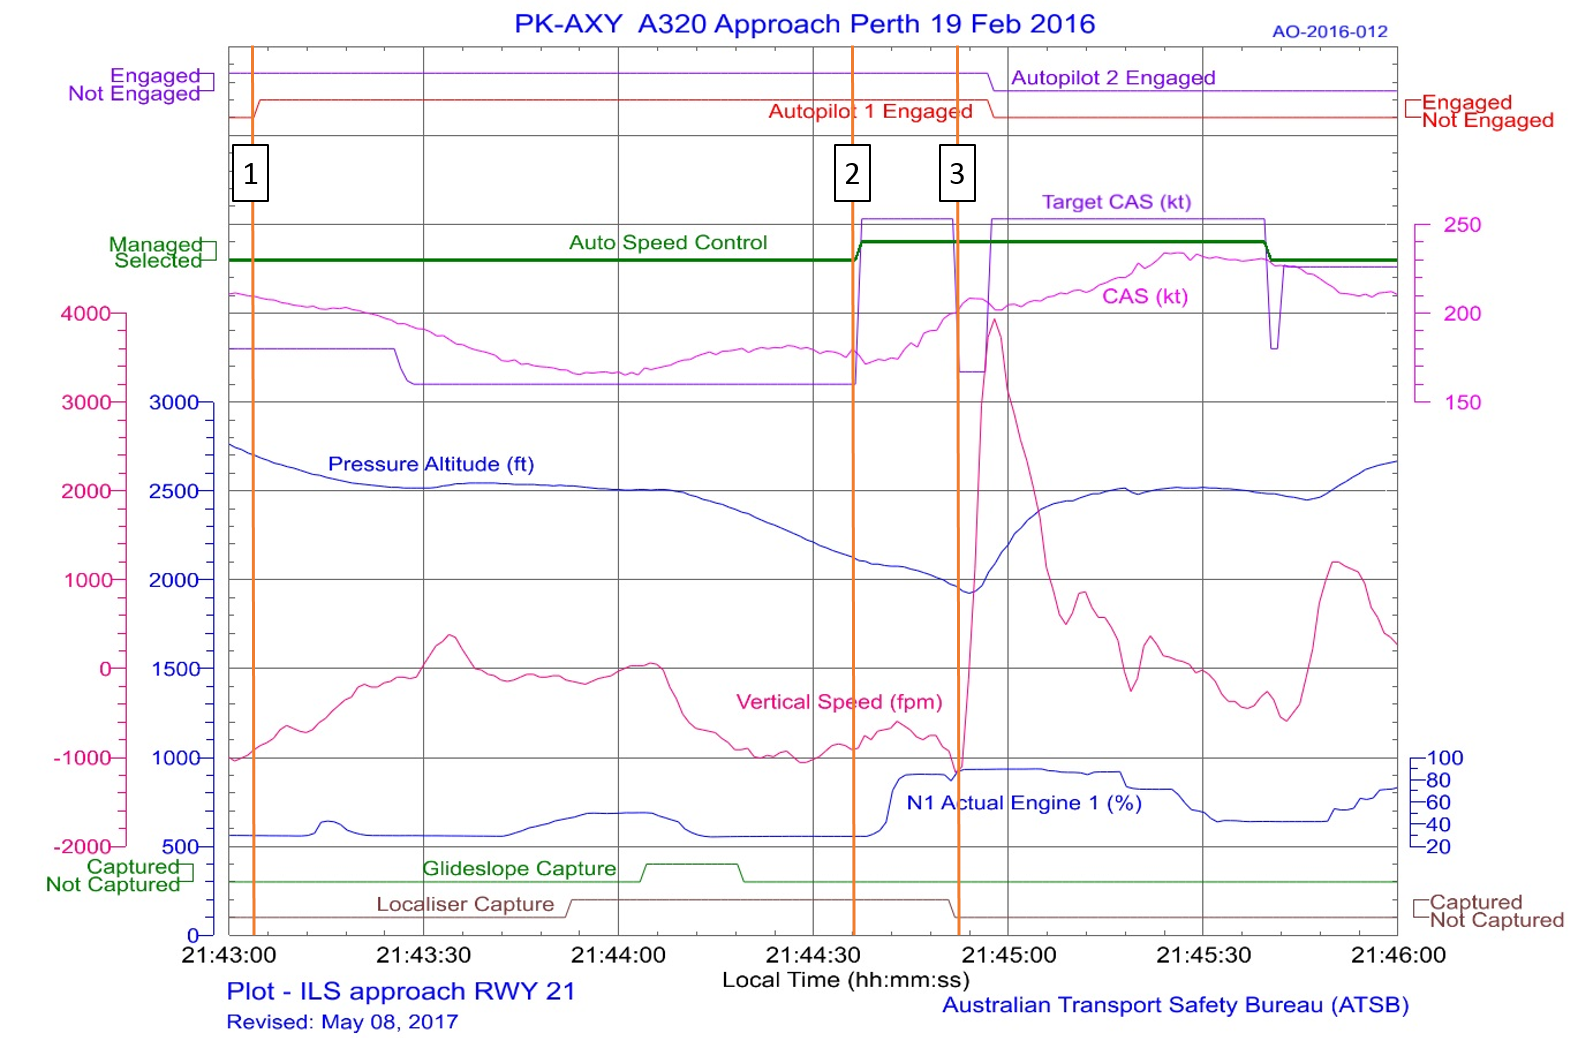
Figure A2: Flight data showing autopilot and mode selections with a resulting thrust and speed increase during the runway 21 ILS approach. The descent depicted is from 3,000 ft to 2,000 ft.

Note:

1. At 2143:04 AP1 was engaged

2. At 2144:37 the auto speed was changed to a managed mode resulting in an increase in the target airspeed (to 253 kt)

3. At 2144:51 the go-around was initiated

Source: ATSB

Appendix B – First runway 06 VOR approach, aircraft track and flight data

Figure B1: First runway 06 VOR approach with aircraft track (blue) and approximate location of go-around (red cross)
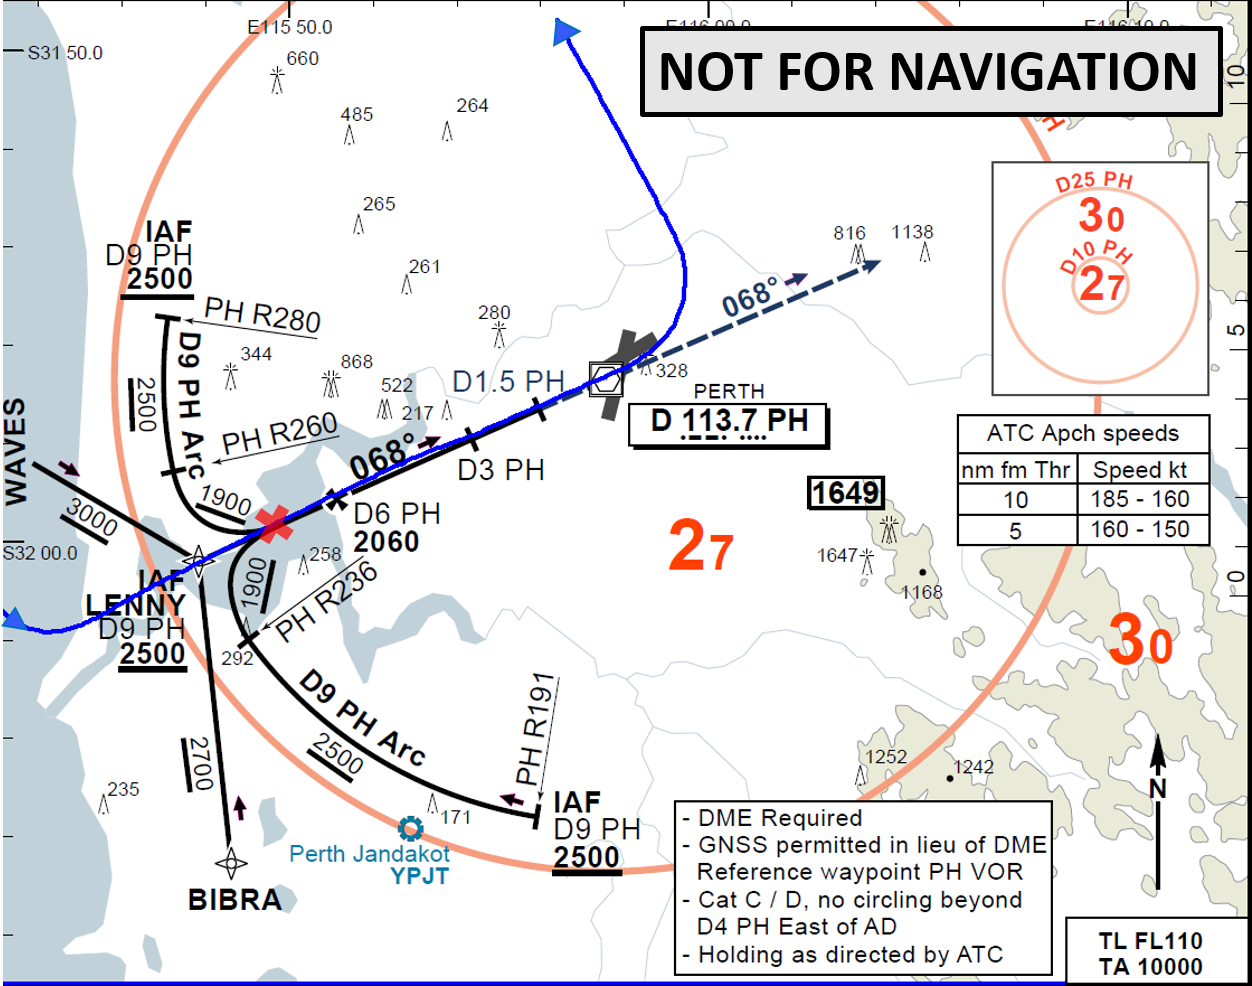
Figure B1: First runway 06 VOR approach with aircraft track (blue) and approximate location of go-around (red cross)

Source: Naviga (modified by the ATSB)

Figure B2: Flight data from first runway 06 VOR approach from 2,500 ft to 1,473 ft
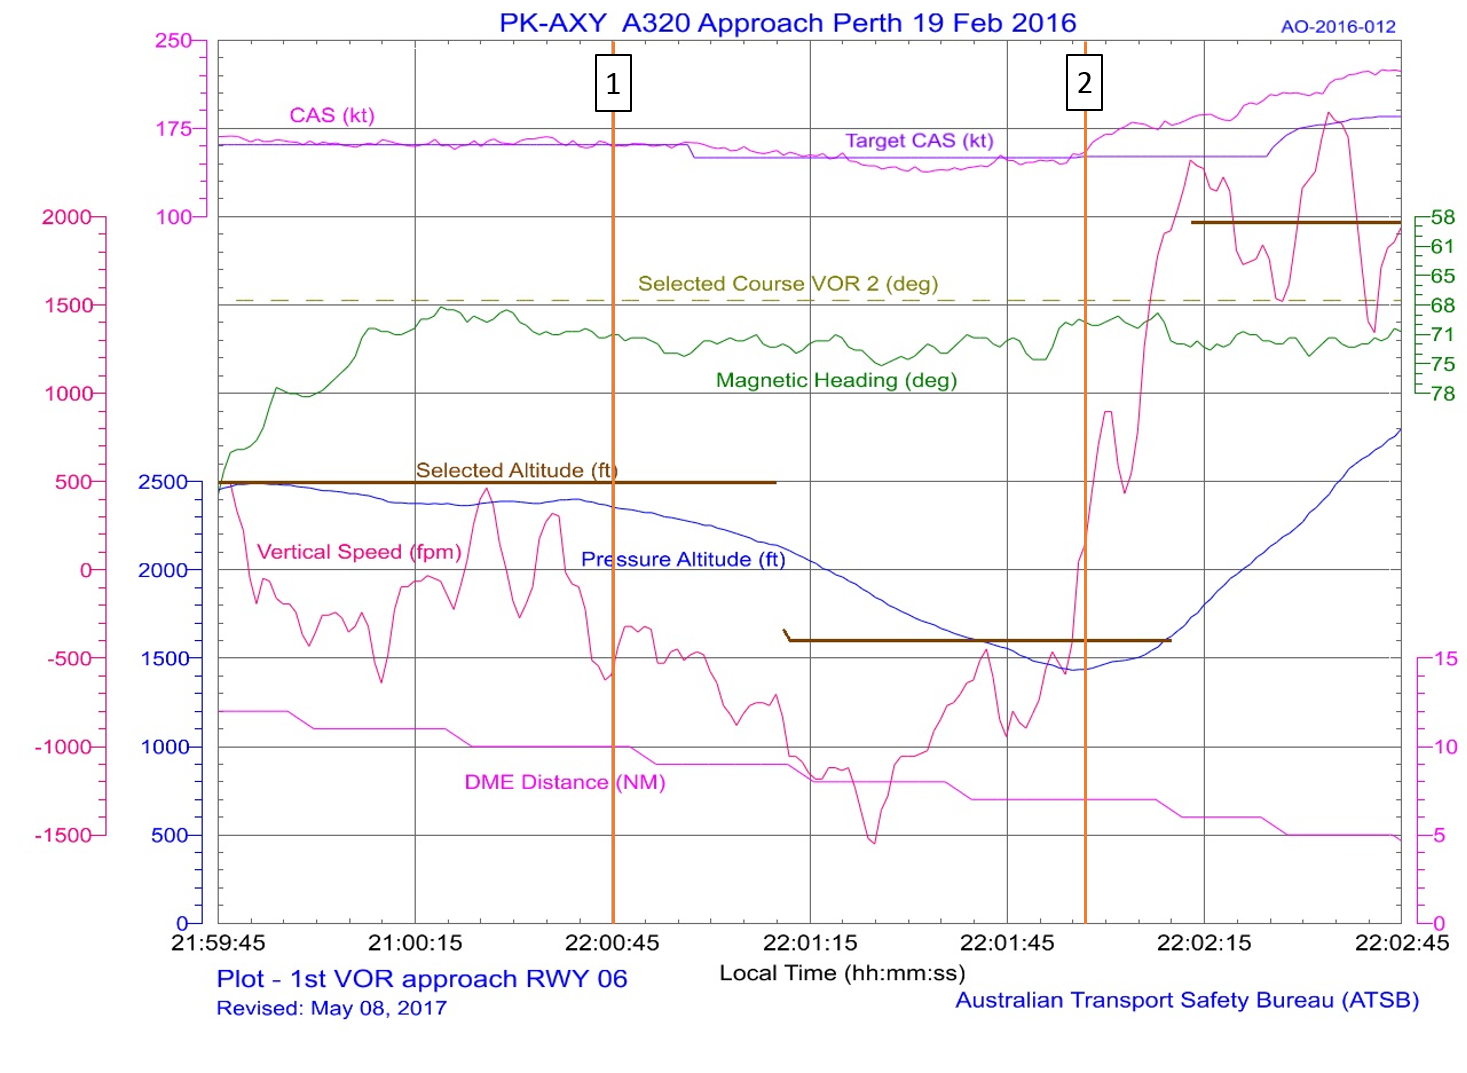
Figure B2: Flight data from first runway 06 VOR approach from 2,500 ft to 1,473 ft

Note:

1. At 2200:45 descent initiated

2. At 2201:57 the go-around was initiated, at an altitude of 1,473 ft

The target CAS is the speed target that would appear on the speed tape of the primary flight display.

Source: ATSB

Appendix C – Second runway 06 VOR approach, aircraft track and flight data

Figure C1: Second runway 06 VOR approach with aircraft track (blue)
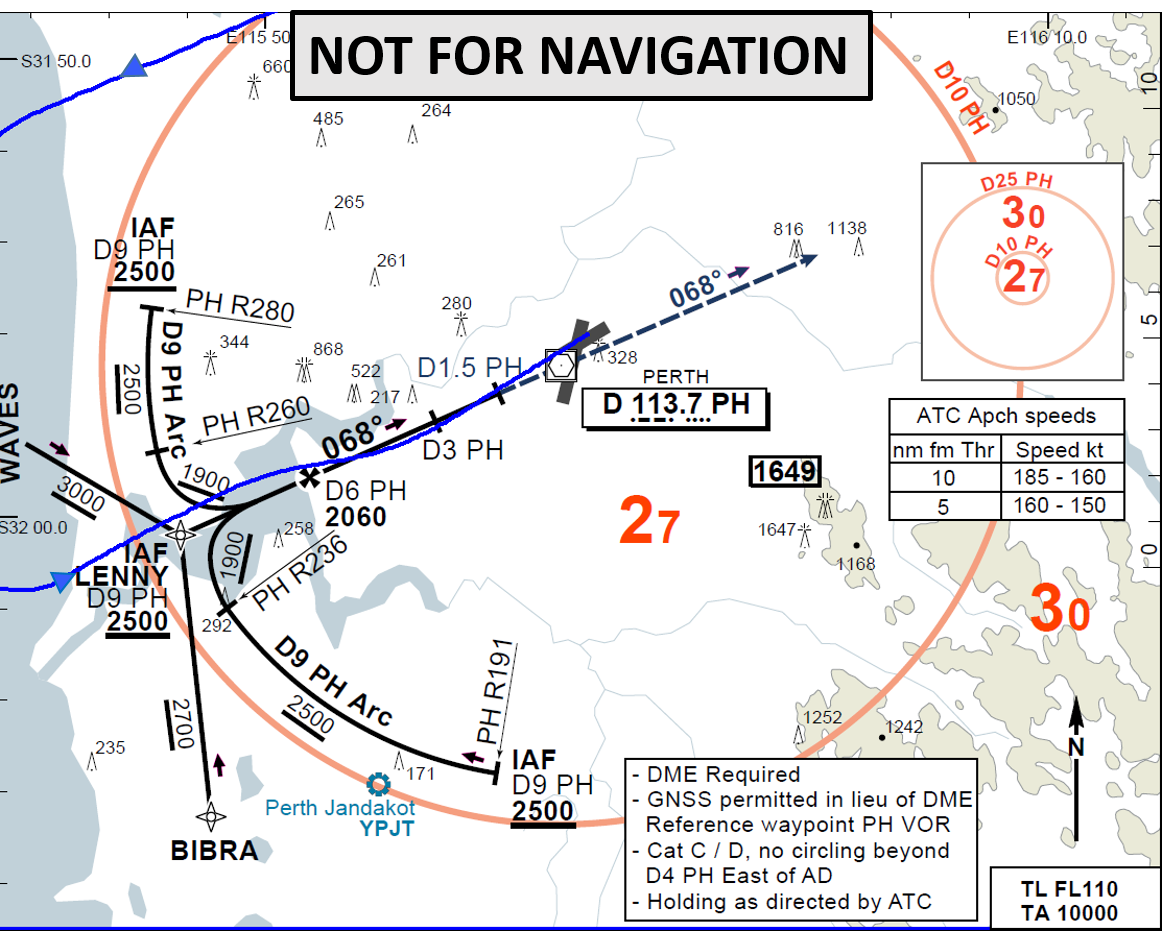
Figure C1: Second runway 06 VOR approach with aircraft track (blue)

Source: Naviga (modified by the ATSB)

Figure C2: Flight data from second runway 06 VOR approach from 2,500 ft to landing
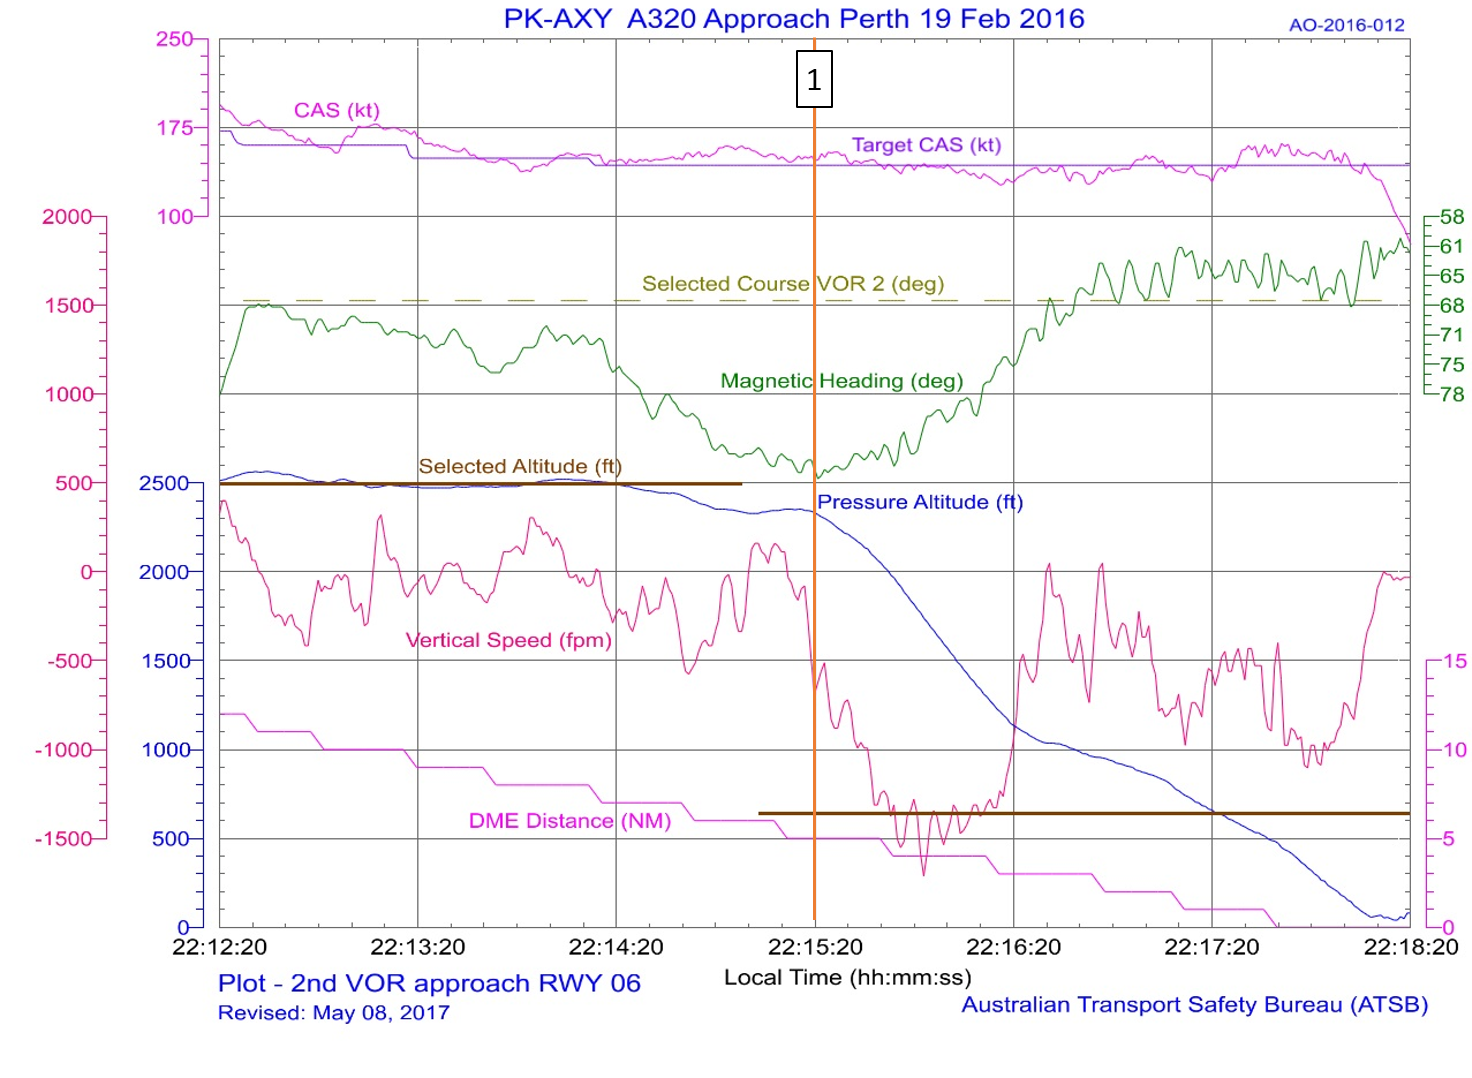
Figure C2: Flight data from second runway 06 VOR approach from 2,500 ft to landing

Note:

1. At 2215:20 descent was initiated, at about 5 DME

Source: ATSB

Purpose of safety investigations

The objective of a safety investigation is to enhance transport safety. This is done through: 

  • identifying safety issues and facilitating safety action to address those issues
  • providing information about occurrences and their associated safety factors to facilitate learning within the transport industry.

It is not a function of the ATSB to apportion blame or provide a means for determining liability. At the same time, an investigation report must include factual material of sufficient weight to support the analysis and findings. At all times the ATSB endeavours to balance the use of material that could imply adverse comment with the need to properly explain what happened, and why, in a fair and unbiased manner. The ATSB does not investigate for the purpose of taking administrative, regulatory or criminal action.

Terminology

An explanation of terminology used in ATSB investigation reports is available here. This includes terms such as occurrence, contributing factor, other factor that increased risk, and safety issue.

Publishing information

Released in accordance with section 25 of the Transport Safety Investigation Act 2003

Published by: Australian Transport Safety Bureau

© Commonwealth of Australia 2018

image_5.png

Ownership of intellectual property rights in this publication

Unless otherwise noted, copyright (and any other intellectual property rights, if any) in this report publication is owned by the Commonwealth of Australia.

Creative Commons licence

With the exception of the Coat of Arms, ATSB logo, and photos and graphics in which a third party holds copyright, this publication is licensed under a Creative Commons Attribution 3.0 Australia licence.

Creative Commons Attribution 3.0 Australia Licence is a standard form licence agreement that allows you to copy, distribute, transmit and adapt this publication provided that you attribute the work.

The ATSB’s preference is that you attribute this publication (and any material sourced from it) using the following wording: Source: Australian Transport Safety Bureau

Copyright in material obtained from other agencies, private individuals or organisations, belongs to those agencies, individuals or organisations. Where you wish to use their material, you will need to contact them directly.

Occurrence summary

Investigation number AO-2016-012
Occurrence date 19/02/2016
Location Near Perth Airport
State Western Australia
Report release date 16/01/2018
Report status Final
Investigation level Systemic
Investigation type Occurrence Investigation
Investigation status Completed
Mode of transport Aviation
Aviation occurrence category Flight below minimum altitude
Occurrence class Serious Incident
Highest injury level None

Aircraft details

Manufacturer Airbus
Model A320
Registration PK-AXY
Serial number 5359
Aircraft operator PT. Indonesia AirAsia
Sector Jet
Operation type Air Transport High Capacity
Departure point Denpasar, Indonesia
Destination Perth, Western Australia
Damage Nil

Incorrect configuration resulting in a collision with terrain involving Cessna R182, VH-PFZ, 58 km south-west of Ingham ALA, Queensland, on 14 February 2016

Final report

Report release date: 27/05/2016

What happened

On 14 February 2016, at about 0945 Eastern Standard Time (EST), the pilot of a Cessna R182 aeroplane, registered VH-PFZ, was returning to a private airstrip near Ingham aircraft landing area (ALA), Queensland. The pilot, who was the only person on board, had just completed a routine one-hour property inspection and decided to complete the flight with some practice touch and go circuits.

The pilot reported that the weather was fine, with minimal wind and a temperature of about 30 °C.

The pilot approached the circuit with the aircraft in the same configuration used for the inspection flight. This was with 20 inches of manifold pressure, the propeller set at 2,000 revolutions per minute (RPM), and the landing gear retracted.

The pilot joined downwind for runway 22 as per their normal procedure, and conducted their downwind checks. However, they inadvertently omitted one of the checks. Although they extended the landing gear, they did not return the pitch control to the HIGH RPM (full fine) position. The pilot continued with the approach, and selected full flap, but again omitted the pre-landing checks on final approach. This oversight left the pitch control lever at about 2,000 RPM.[1]

The pilot described the approach and initial touchdown as a little faster and higher than normal, with the touchdown point about 300 m into the 1,100 m airstrip (Figure 1).The aircraft ballooned slightly. At about 10-15 ft above ground level, the pilot commenced a go-around and applied full throttle, with the propeller remaining at 2,000 RPM. With an airspeed of 64 kt, the pilot assessed there was sufficient airspeed to climb out, so retracted all of the flap and then the landing gear.

Figure 1: Initial touchdown point on runway 22, and VH-PFZ (far end)

Figure 1: Initial touchdown point on runway 22, and VH-PFZ (far end)

Source: Pilot

However, the aircraft began to sink, and the nose dropped. Moments later, the main landing gear struck the ground. This second ‘touchdown’ was about 265 m beyond the first, (about 565 m along the airstrip). The pilot attempted to keep the nose of the aircraft raised. However, the propeller struck the ground and the pilot realised that the nose wheel had retracted, so closed the throttle. The aircraft continued to skid along the runway. The propeller stopped rotating when the aircraft had travelled about another 77 m. The aircraft then continued to slide sideways, and the right main landing gear retracted (Figure 2). The pilot was not injured, but the aircraft sustained substantial damage.

Figure 2: VH-PFZ showing retracted nose wheel and right landing gear, and damaged propeller

Figure 2: VH-PFZ showing retracted nose wheel and right landing gear, and damaged propeller

Source: Pilot

Pilot experience and comments

The pilot had attained almost 4,000 hours of flight experience, 2,800 of which were in VH-PFZ.

The pilot reported that there had been no particular issues affecting the flight on the day, the weather was good, and the inspection flight had been enjoyable. However, the temperature was 30 °C, which increased the density altitude.[2] The pilot could not attribute any particular reason for the checklist oversight.

The pilot reported that during their early flying training, when they had been training for a go-round, they had been instructed to retract all the flap with their right hand, then immediately move their right hand onto the landing gear selector, and retract the landing gear. The pilot commented that ‘the flap travelling up reduced the lift being produced, and the landing gear retracting reduced the drag. These two actions balance out each other.’ The pilot qualified this statement by stating that this technique should only be attempted once a positive rate of climb has been achieved. On this occasion this had not occurred.

The pilot consulted the aircraft’s performance charts post-accident. With the correct propeller (2,400 RPM) and manifold pressure settings, the aircraft delivers the maximum brake horsepower (BHP).[3] For any of the take-off configurations (see POH data below), it is a requirement to have the propeller in the full fine position of 2,400 RPM. The charts do not cater for propeller settings of 2,000 RPM. The pilot reasoned that landing further along the runway than normal may have contributed to a slight rushing of the go-round sequence. It is possible, that this mindset also contributed to retracting the flap and landing gear prior to achieving a positive rate of climb.

The pilot also reported that possibly being too comfortable in the aircraft, and the reliance on its performance, had created an expectation that all would be well.

The pilot summarised that engine RPM was insufficient to produce enough thrust to maintain altitude and climb at the critical point of change in aircraft configuration, while retracting the flap and landing gear.

Cessna R182 Pilot operating handbook (POH)

Information from a generic 1981 Cessna R182 pilot operating handbook stated that the propeller control should be moved to HIGH RPM (full fine) prior to landing.

The Normal Take-off checklist included:

  • Propeller HIGH RPM (2,400 RPM)
  • Climb speed 70 kt indicated airspeed (KIAS) (Flaps 20°)
  • Climb speed 80 KIAS (Flaps UP).
  • Brakes – APPLY momentarily when airborne
  • Landing gear – RETRACT in climb out
  • Wing Flaps – RETRACT

The Short Field Take-off technique included:

  • Propeller HIGH RPM (2,400 RPM)
  • Climb speed – 59 KIAS until all obstacles are cleared.
  • Landing gear – RETRACT after obstacles are cleared
  • Wing Flaps – RETRACT slowly after reaching 70 KIAS.

ATSB comment

The pilot could not recall any particular reason as to why the pre-landing check (propeller control to HIGH RPM (full fine)) was overlooked on two occasions in the circuit.

Although the aircraft could have landed safely in this configuration, attempting to climb with the propeller still at 2,000 RPM created a chain of events from which the pilot did not recover.

The pilot’s decision to retract the flaps all at once, followed immediately by the landing gear, prior to obtaining a positive rate of climb at a low altitude also decreased the aircraft’s performance. The elevation of the airport was 1,100 ft above mean sea level. This, coupled with a warm day of around 30 °C, translated to a higher density altitude,2 resulting in reduced performance.

Safety message

Although the pilot did not recall any distraction which could have led to the omission of the checklist item on both the downwind and final approach checklists, this omission fits a familiar pattern.

Any change of routine or even cognitive thoughts can distract a pilot from an essential checklist item. Research conducted by the ATSB found that distractions, or a change in routine, were an everyday part of flying, and that pilots generally responded quickly and efficiently. The report, Dangerous Distraction: An examination of accidents and incidents involving pilot distraction in Australia between 1997 and 2004 speaks to these issues.

This research commented that pilot distractions in the study did not always occur in response to non-normal tasks. In fact, the research indicated that distraction can occur when pilots are conducting normal routine tasks.

Aviation Short Investigations Bulletin - Issue 47

About this report

Decisions regarding whether to conduct an investigation, and the scope of an investigation, are based on many factors, including the level of safety benefit likely to be obtained from an investigation. For this occurrence, a limited-scope, fact-gathering investigation was conducted in order to produce a short summary report, and allow for greater industry awareness of potential safety issues and possible safety actions.

Publishing information 

Released in accordance with section 25 of the Transport Safety Investigation Act 2003

Published by: Australian Transport Safety Bureau

© Commonwealth of Australia 2016

image_5.png

Ownership of intellectual property rights in this publication

Unless otherwise noted, copyright (and any other intellectual property rights, if any) in this report publication is owned by the Commonwealth of Australia.

Creative Commons licence

With the exception of the Coat of Arms, ATSB logo, and photos and graphics in which a third party holds copyright, this publication is licensed under a Creative Commons Attribution 3.0 Australia licence.

Creative Commons Attribution 3.0 Australia Licence is a standard form licence agreement that allows you to copy, distribute, transmit and adapt this publication provided that you attribute the work.

The ATSB’s preference is that you attribute this publication (and any material sourced from it) using the following wording: Source: Australian Transport Safety Bureau

Copyright in material obtained from other agencies, private individuals or organisations, belongs to those agencies, individuals or organisations. Where you wish to use their material, you will need to contact them directly.

__________

  1. High RPM (full fine) was 2,400 RPM for that aircraft.
  2. An increased density altitude would have increased the power required and decreased the power available.
  3. BHP is the power developed by the engine

Occurrence summary

Investigation number AO-2016-011
Occurrence date 14/02/2016
Location 58 km south-west of Ingham (ALA)
State Queensland
Report release date 27/05/2016
Report status Final
Investigation level Short
Investigation type Occurrence Investigation
Investigation status Completed
Mode of transport Aviation
Aviation occurrence category Collision with terrain
Occurrence class Accident
Highest injury level None

Aircraft details

Manufacturer Cessna Aircraft Company
Model R182
Registration VH-PFZ
Serial number R18201731
Sector Piston
Operation type Private
Departure point Kangaroo Hill, Queensland
Destination Kangaroo Hill, Queensland
Damage Substantial

Wirestrike and collision with terrain involving a Robinson R44, VH-HXY, 90 km north of Hughenden, Queensland, on 14 February 2016

Final report

Report release date: 13/04/2016

What happened

On 14 February 2016, the pilot of a Robinson R44 helicopter, registered VH-HXY, conducted a local private flight from a property about 90 km north of Hughenden, Queensland.

After operating for about 1 hour, the pilot landed near a water trough to check a float. During the approach and landing, the pilot sighted powerlines strung across the trough, and manoeuvred to remain clear of them.

While the helicopter was on the ground, the wind veered from a south-west to a southerly direction, so that to take off into wind, the helicopter would track perpendicular to the powerlines. After completing the pre-take-off checks, the pilot turned his attention to a mob of cattle, to ensure the noise of the helicopter would not send them through a fence.

The helicopter lifted off initially parallel to the powerlines, and the pilot then turned the helicopter to manoeuvre around a tree and climbed to about 20 ft above ground level. The tree momentarily obscured the powerlines and the pilot’s attention was on the cattle.

As the helicopter rounded the tree, at an airspeed of about 50 kt, the skids struck the powerlines. The pilot heard the wires contact the helicopter and it decelerated rapidly. The pilot lowered the collective[1] and pulled back on the cyclic[2] control, but the helicopter rolled forwards over the wires, descended rapidly, and collided with the ground left side down in a nose-down attitude.

The wire was hooked on the helicopter’s right skid, with electrical power still running through it. After the blades stopped turning, the pilot exited the helicopter. The pilot was not injured and the helicopter was destroyed (Figure 1).

Figure 1: Accident site of Robinson R44 helicopter, registered VH-HXY

rid22-picture-5.png

Source: Helicopter owner

Safety message

ATSB research indicates that in 63 per cent of reported wirestrike incidents, pilots were aware of the position of the wire before they struck it. In this instance, the pilot was aware of the powerline however, they were unable to see the wires from the helicopter’s position on the ground due to a tree. The pilot’s attention was then diverted to the cattle and did not maintain awareness of the wires.

The Aerial Agricultural Association of Australia suggests a way to keep focus is to ask yourself:

  • Where is the wire now?
  • What do I do about it?
  • Where am I in the paddock?

For further risk management strategies for agricultural operations, refer to the Aerial Application Pilots Manual.

The ATSB publication Avoidable Accidents No. 2 – Wirestrikes involving known wires: A manageable aerial agricultural hazard, explains strategies to help minimise the risk of striking wires while flying. Pilots are reminded to avoid unnecessary distractions and to refocus when distracted. Distraction, combined with difficulty in seeing wires makes them extremely hard to avoid at the last minute.

Aviation Short Investigations Bulletin - Issue 47

About this report

Decisions regarding whether to conduct an investigation, and the scope of an investigation, are based on many factors, including the level of safety benefit likely to be obtained from an investigation. For this occurrence, a limited-scope, fact-gathering investigation was conducted in order to produce a short summary report, and allow for greater industry awareness of potential safety issues and possible safety actions.

Publishing information 

Released in accordance with section 25 of the Transport Safety Investigation Act 2003

Published by: Australian Transport Safety Bureau

© Commonwealth of Australia 2016

image_5.png

Ownership of intellectual property rights in this publication

Unless otherwise noted, copyright (and any other intellectual property rights, if any) in this report publication is owned by the Commonwealth of Australia.

Creative Commons licence

With the exception of the Coat of Arms, ATSB logo, and photos and graphics in which a third party holds copyright, this publication is licensed under a Creative Commons Attribution 3.0 Australia licence.

Creative Commons Attribution 3.0 Australia Licence is a standard form licence agreement that allows you to copy, distribute, transmit and adapt this publication provided that you attribute the work.

The ATSB’s preference is that you attribute this publication (and any material sourced from it) using the following wording: Source: Australian Transport Safety Bureau

Copyright in material obtained from other agencies, private individuals or organisations, belongs to those agencies, individuals or organisations. Where you wish to use their material, you will need to contact them directly.

__________

  1. A primary helicopter flight control that simultaneously affects the pitch of all blades of a lifting rotor. Collective input is the main control for vertical velocity.
  2. A primary helicopter flight control that is similar to an aircraft control column. Cyclic input tilts the main rotor disc varying the attitude of the helicopter and hence the lateral direction.

Occurrence summary

Investigation number AO-2016-010
Occurrence date 14/02/2016
Location Near Hughenden
State Queensland
Report release date 13/04/2016
Report status Final
Investigation level Short
Investigation type Occurrence Investigation
Investigation status Completed
Mode of transport Aviation
Aviation occurrence category Wirestrike
Occurrence class Accident
Highest injury level None

Aircraft details

Manufacturer Robinson Helicopter Co
Model R44
Registration VH-HXY
Serial number 0350
Sector Helicopter
Operation type Private
Departure point Boonacarbaroo Station, Queensland
Damage Destroyed

Wheels up landing involving Nanchang CJ-6, VH-ALO, Barwon Heads Airport, Victoria, on 6 February 2016

Final report

Report release date: 27/05/2016

What happened

On 6 February 2016, at about 1250 Eastern Daylight Time (EDT), the pilot of a Nanchang CJ-6 aircraft, registered VH-ALO (ALO), was completing the first in a series of formation ‘combat’ joy flights booked for that day. The ‘combat’ flight, which consisted of a pilot and passenger on board each of two Nanchang aircraft (ALO and Number 2), had departed Barwon Heads airport, Victoria, about twenty-five minutes earlier. The pilot of ALO acted as the leader aircraft (or ‘Number 1’)[1] for the formation flight.

At the chosen ‘break-point’[2] on upwind, Number 2 positioned ahead of ALO in the circuit. The two Nanchang aircraft remained in this single-file sequence behind a Pipistrel aircraft, which had joined the circuit on the downwind leg for runway 36. The Pipistrel aircraft landed, then rolled through to the end of the runway in order to exit; Number 2 followed suit. As ALO touched down, third in a close landing sequence, the pilot realised that they had not completed the pre-landing checks, and the landing gear had not been extended. The aircraft slid along the sealed runway, coming to a stop just off the centreline (Figure 1). The pilot and passenger were not injured, and were able to safely egress. The aircraft sustained damage to the propeller, engine and the underside of the fuselage.

Figure 1: Nanchang VH-ALO, on runway 36 after a wheels up landing

rid24-ao-2016-009-accident-photo.jpg

Source: Pilot

Events leading to the wheels up landing

As the formation joined upwind, the pilot from a parachute aircraft operating at the airport, broadcast that tandem parachutists (student and instructor) had been dropped, and that this parachute aircraft was now conducting a second pass to drop the final student(s).

Figure 2: Barwon Heads airport showing relative positions of the formation, Pipistrel and the drop zone

rid25-ao-2016-009-draft-airport-diagram.jpg

Source: En Route Supplement Australia entry for Barwon Heads; annotated by the ATSB

To avoid any issues for the novice parachute jumpers, and to prevent Number 2 from flying too close to the drop zone in the preferred echelon right,[3] ‘dead side’[4] of the circuit join, the pilot in ALO made the decision that the formation would remain in the echelon left configuration and join over the top of runway 36. At the break point, Number 2 would move ahead, and both aircraft would conduct an early turn onto crosswind. This would keep both Nanchang aircraft well clear of the remaining parachute jumpers approaching the drop zone (Figure 2).

However, while the formation was still on upwind, the pilot of a smaller Pipistrel aircraft broadcast their intention to join the downwind leg for runway 36 (Figure 2), further delaying the Nanchang’s turn onto crosswind. To maintain a reasonable separation from the Pipistrel, the two Nanchang pilots conducted a much wider crosswind leg, and resultant circuit, than normal.

The pilot in ALO continued to check for the remaining parachute jumpers, while broadcasting and responding to pertinent radio reports on behalf of the formation; and also managing the ‘slowing down’ of the formation. Once the Pipistrel has passed abeam the formation’s position, and because the runway at Barwon Heads is too narrow to allow a formation landing, the pilot in ALO instructed the pilot in Number 2 to ‘break’. The landing order became the Pipistrel, followed by Number 2 and then ALO.

The Pipistrel touched down, and took some time to roll through to the only available exit taxiway at the end of runway 36. The pilot in Number 2 requested the pilot in the Pipistrel to expedite the exit, as they wanted to land, but could not land until the Pipistrel was clear of the runway. The pilot in ALO reported keeping a close eye on proceedings in front of their aircraft. This included sideslipping the aircraft to maintain a clear view of the runway movements as the Nanchang has limited vision over the nose at slow airspeeds.

Once Number 2 had landed and cleared the runway, the pilot in ALO reported flaring the aircraft in preparation for landing. It was not until the pilot heard the noise of the aircraft scraping the runway that they realised that the landing gear had not been extended.

Pilot experience and comment

The pilot had around 2,950 flying hours, with about 1,800 of these on Nanchang aircraft.

  • The pilot reported that although feeling relatively fresh on the day, due to other demands, the previous week had been personally ‘full on’ and somewhat draining. This may have had played a small part in the oversight of the downwind and pre-landing checklists.
  • With the combination of the parachute activities, the slower aircraft in the circuit, and the less than optimal echelon left formation configuration, the pilot in ALO reported their attention moved from their own aircraft into the Number 2 aircraft. Still maintaining the duties of Number 1 of the formation, but in the unusual ‘behind’ position, they had checked that Number 2’s landing gear had been extended, and kept a close watch on the spacing of the three aircraft.
  • The pilot reported the Nanchang is always a challenge to slow down until the landing gear is extended. The landing gear can be extended once the airspeed had reduced to 108 knots (usually during the downwind checks). The extension provides sufficient aerodynamic drag to reduce the airspeed closer to the desired approach speed.
  • The pilot reported that it was more common for these combat flights to operate from Moorabbin Airport, where the wider runways allowed a formation landing.
  • These events and conditions, combined with no landing gear warning system being fitted to these early military training aircraft, allowed the pilot’s attention to remain distracted and the landing gear was not selected down.

Safety message

The combination of factors distracting the pilot’s attention during the approach and landing led to the downwind and pre-landing checklists being overlooked. The lack of any landing gear warning system fitted to the aircraft, which would have alerted the pilot to the incorrect configuration, left no protection between the distraction and the final action.

According to an Interruptions / distractions briefing note by the Flight Safety Foundation, interruptions and distractions usually result from the following factors:

  • flight crew-ATC, flight deck or flight crew-cabin crew communication
  • head down work, and
  • response to an abnormal condition or unexpected situation.

Further information is available at:

Flight Safety Foundation Approach-and-landing accident reduction Briefing note 2-4, Interruptions / distractions.

Research conducted by the ATSB identified 325 occurrences between 1997 and 2004, which involved distractions. Of these, 54 occurred during the landing phase of flight.

ATSB (2006). Dangerous Distraction: An examination of accidents and incidents involving pilot distraction in Australia between 1997 and 2004. (Research and Analysis report B2004/0324).

Aviation Short Investigations Bulletin - Issue 48

About this report

Decisions regarding whether to conduct an investigation, and the scope of an investigation, are based on many factors, including the level of safety benefit likely to be obtained from an investigation. For this occurrence, a limited-scope, fact-gathering investigation was conducted in order to produce a short summary report, and allow for greater industry awareness of potential safety issues and possible safety actions.

Publishing information 

Released in accordance with section 25 of the Transport Safety Investigation Act 2003

Published by: Australian Transport Safety Bureau

© Commonwealth of Australia 2016

image_5.png

Ownership of intellectual property rights in this publication

Unless otherwise noted, copyright (and any other intellectual property rights, if any) in this report publication is owned by the Commonwealth of Australia.

Creative Commons licence

With the exception of the Coat of Arms, ATSB logo, and photos and graphics in which a third party holds copyright, this publication is licensed under a Creative Commons Attribution 3.0 Australia licence.

Creative Commons Attribution 3.0 Australia Licence is a standard form licence agreement that allows you to copy, distribute, transmit and adapt this publication provided that you attribute the work.

The ATSB’s preference is that you attribute this publication (and any material sourced from it) using the following wording: Source: Australian Transport Safety Bureau

Copyright in material obtained from other agencies, private individuals or organisations, belongs to those agencies, individuals or organisations. Where you wish to use their material, you will need to contact them directly.

__________

  1. In an echelon formation, number 1 (ALO in this instance) is the lead aircraft, and makes the decisions for the formation and also makes and responds to all radio communication for the formation; each individual pilot is still responsible for their own aircraft’s safety.
  2. The position in the circuit, where the pilot in the lead aircraft (ALO) in the formation determines that the formation will manoeuvre into single file, usually with Number 1 in the lead.
  3. An echelon formation is where the aircraft (usually military) are arranged diagonally. In a left echelon, each station (in this case Number 2) was stationed behind and to the left of the lead aircraft) ALO (adapted from Wikipedia definition).
  4. The non-active side of the circuit.

Occurrence summary

Investigation number AO-2016-009
Occurrence date 06/02/2016
Location Barwon Heads Airport
State Victoria
Report release date 27/05/2016
Report status Final
Investigation level Short
Investigation type Occurrence Investigation
Investigation status Completed
Mode of transport Aviation
Aviation occurrence category Wheels up landing
Occurrence class Accident
Highest injury level None

Aircraft details

Manufacturer Nanchang Aircraft
Model CJ-6
Registration VH-ALO
Serial number 4532002
Sector Piston
Operation type Private
Departure point Barwon Heads, Victoria
Destination Barwon Heads, Victoria
Damage Substantial

Wirestrike involving a Kavanagh G-450 balloon, VH-RUW, Mareeba, Queensland, on 7 February 2016

Final report

Report release date: 27/05/2016

What happened

On 7 February 2016, the pilot of a Kavanagh G-450 balloon, registered VH-RUW, conducted a 30-minute scenic flight from Mareeba, Queensland with 18 passengers on board.

Shortly before 0627 Eastern Standard Time (EST), the balloon approached the target landing area. The pilot referred to his iPad, which showed the location of the balloon and a set of powerlines strung across the paddock. The balloon was then about 30 ft above ground level, travelling at a ground speed of 7 kt, with a descent rate of 50 ft per minute. The pilot confirmed that all the passengers were in the correct landing position.

The pilot sighted two power poles either side of the landing area, but was unable to see the wires. The pilot estimated where the wires would be based on the crossbars on the poles, and assessed that the balloon had sufficient height to pass over the powerlines. The pilot then sighted the powerlines, about half a metre ahead of and below the basket. The pilot applied all four burners to try to climb and avoid the powerlines, but the left side of the basket contacted one wire, breaking it. The pilot heard a loud fizzing noise and immediately realised they had struck a powerline.

The pilot checked that the passengers were all ok and still in the landing position, and checked that there was no evidence of fire. Due to the amount of heat in the balloon, the balloon was climbing. The pilot then conducted a normal controlled descent and landing into a paddock about 500 m beyond the original planned landing site. The balloon landed without further incident and no one was injured. The wicker basket sustained scorching (Figure 1) and a stainless steel cable fixed to the underside of the basket sustained arc damage.

Figure 1: Scorch marks on wicker basket

Figure 1: Scorch marks on wicker basket

Source: Balloon operator

Landing site

The balloon operator and the pilot had used the paddock on many occasions for both launching and landing.

The balloon’s track crossed the powerlines at an angle (Figure 2). As the balloon approached the wires, the pilot lost sight of the pole to the left and used the pole on the right to gauge their height. However, the left pole was situated on a hill and higher than the right pole, and the wires sloped upwards from the right pole to the left. The pilot’s assessment of sufficient height was based on the lower pole; consequently, the left side of the basket struck the wires to the high side.

The powerlines were difficult to see as the area was heavily vegetated. The sun was to the right of the balloon and did not affect the pilot’s vision of the wires.

Figure 2: Balloon track and location of powerlines

Figure 2: Balloon track and location of powerlines

Source: Balloon operator

Powerlines and markings

The balloon operator used the following strategies to improve powerline awareness:

  • The operator had developed an iPad application which pilots used in-flight as an early powerline warning system, which showed all of the powerlines on a google earth map, and the balloon’s current location. The energy company provided updates to the location of the powerlines at six monthly intervals.
  • The operator maintained a map of powerlines identified by the company pilots to be of low visibility. These were highlighted on the application to draw pilots’ attention.
  • Company pilots were required to visit the site of identified low-visibility powerlines to familiarise themselves with the location of the lines.
  • In addition, ground personnel were expected to identify from the ground any powerlines in the balloon’s flight path, which may pose a risk to the balloon on approach to land, and to confirm that the pilot was aware of the lines and their location.
  • The balloon operator had designated the powerlines at the site to be low-visibility, and had paid the energy provider to fit white marker flags with a reflective green centre to the wires to increase the pilot’s ability to see the lines (or flags). Despite being clearly visible from the ground, the pilot was unable to see the flags. This may have been due to the effect of the wind deflecting the flags at an angle, and possibly their colour.

Pilot comments

Two other balloons had already landed in the paddock. The pilot elected to fly on rather than conduct an emergency descent after the wirestrike, because a high rate of descent from that height carried a risk of injury to the pilot and passengers, and to avoid a collision with the balloons that had landed ahead.

Safety action

Balloon operator

As a result of this occurrence, the balloon operator has advised the ATSB that they are taking the following safety actions:

Review of powerline markings

The operator is investigating the installation of more visible three-dimensional powerline markings such as balls.

Communication to company pilots

The operator will circulate a copy of their investigation report and findings to all company pilots. Pilots are reminded to consider the possibility of sloping powerlines and apply an appropriate clearance margin when overflying them.

Safety message

The ATSB research report, Wirestrikes involving known wires: A manageable aerial agriculture hazard, explains a number of strategies to assist pilots manage the risk of wirestrikes. These include:

  • ensure you are fit to fly
  • prioritise safety
  • conduct thorough pre-flight planning
  • avoid unnecessary distractions
  • don’t rely on your ability to react in time to avoid a wire
  • have a systematic approach to safely managing wires.

The Australian Ballooning Federation produced safety advisory notice pilot circular number 18 in 2012, detailing strategies to avoid wirestrikes.

Aviation Short Investigations Bulletin - Issue 48

About this report

Decisions regarding whether to conduct an investigation, and the scope of an investigation, are based on many factors, including the level of safety benefit likely to be obtained from an investigation. For this occurrence, a limited-scope, fact-gathering investigation was conducted in order to produce a short summary report, and allow for greater industry awareness of potential safety issues and possible safety actions.

Publishing information 

Released in accordance with section 25 of the Transport Safety Investigation Act 2003

Published by: Australian Transport Safety Bureau

© Commonwealth of Australia 2016

image_5.png

Ownership of intellectual property rights in this publication

Unless otherwise noted, copyright (and any other intellectual property rights, if any) in this report publication is owned by the Commonwealth of Australia.

Creative Commons licence

With the exception of the Coat of Arms, ATSB logo, and photos and graphics in which a third party holds copyright, this publication is licensed under a Creative Commons Attribution 3.0 Australia licence.

Creative Commons Attribution 3.0 Australia Licence is a standard form licence agreement that allows you to copy, distribute, transmit and adapt this publication provided that you attribute the work.

The ATSB’s preference is that you attribute this publication (and any material sourced from it) using the following wording: Source: Australian Transport Safety Bureau

Copyright in material obtained from other agencies, private individuals or organisations, belongs to those agencies, individuals or organisations. Where you wish to use their material, you will need to contact them directly.

Aviation Short Investigation Bulletin - AB-2016-044

Occurrence summary

Investigation number AO-2016-008
Occurrence date 07/02/2016
Location Near Mareeba Aerodrome (Byrnes Rd)
State Queensland
Report release date 27/05/2016
Report status Final
Investigation level Short
Investigation type Occurrence Investigation
Investigation status Completed
Mode of transport Aviation
Aviation occurrence category Wirestrike
Occurrence class Serious Incident
Highest injury level None

Aircraft details

Manufacturer Kavanagh Balloons
Model G-450
Registration VH-RUW
Serial number G450-401
Sector Balloon
Operation type Ballooning
Destination Mareeba, Queensland
Damage Minor

Derailment of MTM train TD1064, near Rushall Station in Fitzroy North, Melbourne, Victoria, on 6 February 2016

Final report

Report release date: 16/05/2018

Safety summary

What happened

At about 1650 on 6 February 2016, metropolitan passenger train TD1064 was travelling towards Melbourne between Merri and Rushall Railway Stations when it derailed one bogie on a small-radius curve. There was one minor injury reported.

The derailed car was foul of the adjacent track and there was the potential for more serious consequences had a train from the opposite direction been passing at the time.

What the ATSB found

The ATSB found that the leading right-hand wheel of the second car climbed the outside rail of the small-radius curve. The main factors contributing to the derailment were the high coefficient of friction between wheel and rail and the geometry of a rail joint. The train was being operated within the speed limit for this curve and the manner of its operation did not contribute to the derailment.

It was found that the train’s wheel flanges and the rail’s gauge-face had low levels of lubrication. The performance of rail lubricators on the metropolitan network had diminished prior to the derailment, leading to a deficiency in lubrication on the network. This was probably the result of a decline in lubricator maintenance. Rail lubricator maintenance was being transferred from contractors to Metro Trains Melbourne (MTM) staff and this transition was not adequately managed.

The derailment at this point on the curve was triggered by a lateral angular discontinuity at a mechanical rail joint, resulting in a localised increase in the wheel-to-rail lateral force. The network’s track geometry standard did not preclude the presence of such a discontinuity.

While not mandated by MTM, a check rail on this small-radius curve (installed adjacent to the inner rail) would have provided an additional defence against flange-climb and derailment. A network standard to potentially address derailment risk at higher-risk locations was under consideration at the time of this derailment.

A number of other safety factors were identified that were not directly causal to this incident. They included the ineffective locating of some rail lubricators within the network, a high tolerance on allowable track geometry deviations at this and similar low-speed mainline locations, and a failure to address a wide-gauge defect on this curve.

What's been done as a result

MTM have undertaken a range of actions including the wide-spread installation of new electronic lubricators and significant changes to the management of track condition and faults. These actions, when taken in concert, are expected to reduce the risk of derailment on small-radius curves.

Safety message

The potential for flange-climb derailment on small-radius curves is sensitive to track condition and lubrication between wheel and rail gauge-face. It is therefore important to maintain lubrication across the network and address reductions in performance flagged by unusual wheel wear or evidence of metal loss at the wheel-rail interface.


Occurrence

The Melbourne metropolitan rail network and its passenger rolling stock are operated by Metro Trains Melbourne (MTM)[1].

On 5 February 2016, the wheels on this six-car trainset were subject to scheduled machining. This returned the wheels to the ‘as-new’ wheel profile and the train was returned to normal service the next day.

On 6 February 2016, this trainset operated scheduled services from Craigieburn to Flinders Street Station, then Flinders Street Station (via the City Loop) to South Morang. From there, the train ran to Southern Cross then returned to South Morang where it formed the 1630 South Morang-to-Flinders Street service TD1064.

Service TD1064 departed South Morang as scheduled. At about 1650, when travelling between Merri and Rushall Railway Stations (Figure 1), the leading bogie of the second car derailed. The train derailed on a small-radius curve travelling at a speed of about 20 km/h.

Figure 1: The derailment location within the Melbourne suburb of North Fitzroy.

Figure 1: The derailment location within the Melbourne suburb of North Fitzroy. The immediate area of the derailment location is shown enlarged.
Source: Google Maps, annotated by the Chief Investigator Transport Safety (Vic)

The immediate area of the derailment location is shown enlarged.Source: Google Maps, annotated by the Chief Investigator Transport Safety (Vic)

The train quickly came to a stop with the leading-end of the second car foul of the adjacent line (Figure 2). The driver was initially unsuccessful in attempts to contact Metrol[2] via the train radio system[3]. The driver subsequently established contact using a company-issued mobile phone about six minutes after the derailment. It was then about another minute before any approaching rail traffic could be halted.

Figure 2: View of the derailed leading-end bogie of the second car

Figure 2: View of the derailed leading-end bogie of the second car. The leading-end of the second car derailed, and is shown sitting foul of the clearance of the opposite (adjacent) running line.
Source: Chief Investigator, Transport Safety (Vic)

The leading-end of the second car derailed, and is shown sitting foul of the clearance of the opposite (adjacent) running line. Source: Chief Investigator, Transport Safety (Vic)

There was one reported passenger injury and minor track and train damage. The double-track location was returned to service in time for the morning peak period the following day.

On 11 February 2016, five days after the derailment of TD1064, a track regulator derailed on the same curve, a short distance from the first derailment. Following this second derailment, there were further track works undertaken on the Rushall curve.

__________

  1. MTM is a consortium of Hong Kong’s MTR Corporation (formerly Mass Transit Railway), Australia’s John Holland Group and UGL Rail, a division of UGL (formerly United Group Limited).
  2. Metropolitan Train Control Centre. The control centre for all rail traffic in the Melbourne metropolitan region.
  3. The GSM-R digital train radio system for the Melbourne metropolitan rail network that was brought into operation in 2014

Context

Location

The train was negotiating a 118 m radius-curve, the most severe mainline curve on the MTM network. Known as the ‘Rushall curve’, it was located in North Fitzroy about seven rail km from the Melbourne CBD. The curve had a permanent speed restriction in the Up[4] direction of 30 km/h.

This small-radius curve existed as a remnant of a triangular junction that originally connected the (then) Epping Line to the Royal Park-to-Northcote Loop (also known as the Inner Circle Line). The connection was severed in 1965 and the Royal Park-to-Northcote Loop was subsequently closed. The curve that formed the junction’s eastern leg remained as a portion of the main line between Merri and Rushall Stations (Figure 3).

Figure 3: Derailment location on the 118 m Rushall curve

Figure 3: Derailment location on the 118 m Rushall curve. The red dotted lines indicate the layout of the closed sections of the original junction. 
Source: Google Earth, annotated by the Chief Investigator, Transport Safety (Vic)

The red dotted lines indicate the layout of the closed sections of the original junction. Source: Google Earth, annotated by the Chief Investigator, Transport Safety (Vic)

Track construction and condition

Travelling towards Melbourne, the Rushall curve was on a 1-in-70 downgrade. It was constructed using wooden sleepers supporting typically 13.7 m lengths of rail joined by mechanical (fishplated) joints in a staggered[5] pattern. Around the point-of-derailment (PoD), rails were on double-shoulder base plates generally attached by plate screws. Rails were mostly secured using resilient fasteners with some use of dog-spikes.

The most recent MTM engineering inspection[6] of the curve was on 2 March 2015 at which time the track was reported as being fit-for-purpose for one year.

Examination of the track following this derailment found evidence of pumping[7] and angular misalignment at mechanical joints. The gauge-face of the outside rail (high leg) had sustained noticeable side wear.

Track geometry

Network tolerances

MTM engineering specification (track)[8] included fault bands for key geometric parameters including track gauge, cant, twist, rail lateral alignment (line) and vertical variation (top) (Figure 4). The fault bands were the same for tangent and curved track.

Figure 4: MTM track geometry maintenance tolerances.

Figure 4: MTM track geometry maintenance tolerances. The condition tolerances for the Rushall curve were those pertaining to a track speed of 40 km/h (outlined in red).
Source: Metro Trains Melbourne, annotated by Chief Investigator, Transport Safety (Vic)

The condition tolerances for the Rushall curve were those pertaining to a track speed of 40 km/h (outlined in red). Source: Metro Trains Melbourne, annotated by Chief Investigator, Transport Safety (Vic)

The engineering specification stated that:

  • An ‘A’ fault was to be removed or corrected so that it fell into the ‘B’ fault band, or better. It was permitted to apply a speed restriction to move an ‘A’ fault to the ‘B’ band.
  • ‘B’ faults were to be considered when assessing trends and when planning track maintenance, and did not require immediate corrective action.

The Jolimont – South Morang line, that included the Rushall curve, was classified as Track Class 3 (100 km/h) and the geometry tolerances for this class and speed applied for the majority of this line. However, the engineering specification stated that for locations where the line speed was less than the Track Class speed, the fault parameters corresponding to the line speed for that location should be applied. On that basis, for the Rushall curve, the 40 km/h fault limits applied (outlined in red in Figure 4).

Track geometry recording car pre-derailment

The track geometry of the derailment curve was measured using the IEV100 track recording vehicle on 1 December 2015, about two months before the derailment. This identified three ‘A’ faults within the curve based on the 100 km/h line speed (Figure 5). When re-assessed against the requirements for 40 km/h track, only the two wide-gauge faults (at 7.577 km and 7.516 km) remained as ‘A’ faults. Neither of these faults was near the Point-of-Flange-Climb (PoFC) at about 7.554 km.

Figure 5: ‘A’ faults identified within the Rushall curve by the IEV100 recording vehicle

Location of peak (km)Parameter

Magnitude recorded

(mm)

Class 3 (100 km/h) ‘A’ fault threshold

(mm)

Class 5 (40 km/h) ‘A’ fault threshold

(mm)

7.577Wide gauge342026
7.537Twist (short)302541
7.516Wide gauge332026

Source: MTM track geometry recording 1 December 2015

Post-derailment geometry measurements

Following the derailment, the track geometry through the location was measured over a distance of 90 m from the estimated PoFC back towards Merri station. The geometry was measured using a KRAB[9] track recording trolley that reflects the track’s geometry in an unloaded state. This unloaded measurement would typically be an underestimate of track irregularity compared to the geometry during the passage of a train or the track recording vehicle.

At the estimated PoFC, measured geometry was below the 100 km/h and 40 km/h ‘B’ fault limits for all parameters except gauge. At the PoFC the gauge was about 16 mm wide. This is at the lower limit of the 40 km/h ‘B’ fault band and so would not be considered a critical defect.

Larger irregularities were found away from the PoFC. A static wide-gauge of 29 mm was measured by the KRAB at 7.572 km and was probably the same fault (of 34 mm) identified at 7.577 km by the IEV100 on 1 December 2015, prior to the derailment.[10]

Rail wear

Measurement of the 90 m of track approaching and including the PoFC showed that rail wear was comfortably within the specified limits for top and side wear, and percentage of head loss.

The inner face of the outside rail at the derailment location displayed a generally worn profile consistent with its situation within a small-radius curve. The gauge-face angle was within the network’s permitted maximum of 26 degrees (to the vertical). The measured angle of the gauge-face at the estimated PoFC was about 17 degrees and the highest measured gauge-face angle within the curve was 23 degrees (about 75 m prior to the PoFC).

Rail gauge-face surface condition

The coefficient of friction at the wheel/rail interface can have a significant impact on the risk of flange-climb derailment. The higher the friction between the contact surfaces, the greater the potential for a wheel to climb the gauge-face of the rail.

The gauge-face of the outer rail was clean and dry, with no visual evidence of either lubricant or contaminants and with a roughened surface (Figure 6).

Figure 6: Gauge-face at estimated point-of-flange-climb

Figure 6: Gauge-face at estimated point-of-flange-climb. Source: Chief Investigator, Transport Safety (Vic)

Source: Chief Investigator, Transport Safety (Vic)

Below the worn gauge-face there were steel filings (snow) on the rail foot and ballast (Figure 7).

Figure 7: Metal filings deposited on the track ballast

Figure 7: Metal filings deposited on the track ballast. Source: Chief Investigator, Transport Safety (Vic)

Source: Chief Investigator, Transport Safety (Vic)

The presence of both the rough gauge-face surface and metal filings below the rail were indicative of high friction and wear conditions and hence indicated a probable deficiency of lubrication between gauge-face and wheel-flange.

The train

Configuration

Train TD1064 comprised two 3-car Alstom X’Trapolis sets (9M-1305T-10M and 1M-1301T-2M) coupled as a 6-car train. The sets were based at the Craigieburn depot and their maintenance was up-to-date.

Post-derailment vehicle inspections

Inspections were conducted on the lead bogie and suspension of car 1305T. Tests and inspections included assessment of bogie frame, suspension and traction components and connections with the leading car. No defects or deviations from specification were identified.

There were witness marks indicating impact between the bogie and the bump stops that limit bogie rotation. Similar marks were found on other X’Trapolis vehicles suggesting that this contact was not uncommon within the fleet. MTM analysis indicated that a static clearance of about 25 mm should have existed at the bump stops when travelling on a 118 m curve.

Wheels

Recent machining

On 5 February 2016, the wheels on both car-sets were subject to a scheduled machining on the underfloor wheel lathe at the Epping Workshops. The wheels were returned to the MP2[11] wheel profile that represents the standard wheel profile for the X’Trapolis fleet. Following the machining, the total distance run to derailment was 79 km.

Post-derailment wheel inspections

Inspection identified circumferential machining grooves from recent machining. On the tread running surfaces, these grooves had been removed and burnished by rolling contact. The burnished regions were consistent with abrasion of the wheel treads from normal tracking of the wheelsets. There were no material defects detected on any wheels during visual inspection.[12]

All wheel flanges on both sides of the train exhibited a localised band of coarse scoring. This scoring was more pronounced on the wheels on the right-hand side of the leading three-car set (in the direction of travel between Merri and Rushall stations), and therefore on those wheels that had been running on the outside of the derailment curve. The scoring damage in the area of the ‘throat’ (the tread-to-flange radius) was consistent with adhesive wear, and indicated the wheel flanges had been bearing against the rail head. These wheels were dry and did not exhibit any signs of track lubricant.

The wear condition of the first wheel to derail was consistent with other wheels on the right-hand side of the train. The wheel exhibited a band of scoring about 10 mm wide, located within the radius and onto the flange (Figure 8). The location of the wear, like other wheels on the right-hand side of the leading three-car set, indicated that the flange had been riding high on the rail head during curving prior to the derailment.

Figure 8: Views of the leading right-hand wheel of car 1305T showing observed wear

Figure 8: Views of the leading right-hand wheel of car 1305T showing observed wear.
The left-hand photograph shows a general view of the wheel’s condition. The right-hand photograph shows the heavy scoring within the throat (the tread-to-flange radius) and extending to mid-flange. The machining marks can also be seen to the outside of the scoring. This wheel was the first to derail and also exhibited ballast abrasion markings at the outer edge of its tread.
Source: ALS Industrial

The left-hand photograph shows a general view of the wheel’s condition. The right-hand photograph shows the heavy scoring within the throat (the tread-to-flange radius) and extending to mid-flange. The machining marks can also be seen to the outside of the scoring. This wheel was the first to derail and also exhibited ballast abrasion markings at the outer edge of its tread.Source: ALS Industrial

Fleet-wide wheel deterioration

MTM rolling stock division began identifying dry and rough flanges on its fleet in December 2015. The extent of the dry wheel flange issue across the MTM suburban fleet then increased during January 2016 and coincided with increasing wheel wear rates on the V/Line[13] VLocity fleet.[14]

Train driver

The driver had been a Melbourne electric train driver for 11 years. He commenced duty at Epping at 1540, a little more than an hour prior to the incident. The operation of the train was consistent with MTM’s requirements, including speed through the derailment curve. The driver underwent a Preliminary Breath Test at Flinders Street station, returning a negative result.

Simulation of train TD1064 passage through Rushall curve

Site evidence indicated that the derailment had occurred as a result of a wheel climbing the outside rail. A computer simulation was conducted of the transit of train TD1064 through the Rushall curve[15] to identify features that might have contributed to or influenced this flange-climb tendency.

A flange-climb derailment is the climbing of a wheel up the rail gauge-face, then onto, along and over the top of the rail. The simulation used Nadal’s[16] single wheel L/V limit criterion to evaluate the potential for flange climb where L is the lateral force of wheel-on-rail, and V is the vertical force of wheel-on-rail (Figure 9). The Nadal equation is widely used by the railway industry.

Figure 9: Nadal criterion for flange-climb derailment

Figure 9: Nadal criterion for flange-climb derailment. The equation defines the L/V ratio at and above which flange-climb is expected to occur for contact conditions defined by coefficient of friction and flange angle.
Source: Nadal equation

The equation defines the L/V ratio at and above which flange-climb is expected to occur for contact conditions defined by coefficient of friction and flange angle.Source: Nadal equation

The Nadal equation relates the L/V ratio to the physical conditions at the wheel-rail contact. Flange-climb is likely when the L/V ratio equals or exceeds the right-hand side of the equation that is composed of the coefficient of friction between rail and wheel (µ) and the wheel flange angle (α). The required L/V ratio for flange-climb reduces, and therefore the potential for flange-climb increases, as:

  • wheel-to-rail friction increases
  • wheel flange angle (to the horizontal) decreases

The L/V ratio that occurs at the wheel-rail contact point is an outcome of the dynamic response of the train to the track geometry. The potential for flange climb increases as L/V increases and therefore as:

  • the lateral force (L) increases
  • the vertical force (V) decreases, such as during wheel unloading.

Rail lubrication

Lubrication can be used to reduce friction levels between rail gauge-face and wheel flange. MTM used mechanical rail lubricators (known colloquially as ‘grease pots’) to dispense grease to the rail gauge-face at certain locations. The rail lubricator intended to service the outside rail of the Rushall curve (travelling towards Melbourne) was located about 20 m past Merri Railway Station and about 330 m before the Rushall curve (Figure 10).

Figure 10: Location of the rail lubricator, identified as point A

Figure 10: Location of the rail lubricator, identified as point A.
The train was travelling from Merri toward Rushall. Point A represents the position of the rail lubricator on the Up (Melbourne-bound) track, and point B depicts the start of the 118 m curve (the target curve for lubrication) in red. The yellow dotted line represents tangent track and the yellow solid line is the intervening curve. The distance from A to B (orange) was about 330 m.
Source: Google Earth, annotated by the Chief Investigator,

The train was travelling from Merri toward Rushall. Point A represents the position of the rail lubricator on the Up (Melbourne-bound) track, and point B depicts the start of the 118 m curve (the target curve for lubrication) in red. The yellow dotted line represents tangent track and the yellow solid line is the intervening curve. The distance from A to B (orange) was about 330 m.Source: Google Earth, annotated by the Chief Investigator, Transport Safety (Vic)

The lubricator ahead of the Rushall curve was typical of that used on the Melbourne Metropolitan network (Figure 11). A spring-loaded piston within the lubricator reservoir pressurises the grease. When two lubricator plunger pins (integral to the manifold block) are actuated by a passing wheel tread, grease is pumped from the manifold block to a dispensing ‘wiper’ blade attached to the gauge-face of the rail. From here grease is picked up by wheel flanges (assuming effective flange contact with the rail head) and distributed along the gauge–face.

Figure 11: The rail lubricator servicing the outside rail of the Rushall curve

Figure 11: The rail lubricator servicing the outside rail of the Rushall curve. Source: Chief Investigator, Transport Safety (Vic)

Source: Chief Investigator, Transport Safety (Vic)

Lubricant

MTM uses ROCOL Curve Grease in its rail lubricators. It is lithium dioxide-based, and contains solid graphite dispersed in highly-refined mineral oil to provide low friction and a high load-carrying capacity. It works by depositing a ‘boundary lubricant’ on the rail gauge-face (a thin film that remains effective under extreme pressures) and has a working temperature range from -10 ºC to 150 ºC.

The product has been in use since 1998 and the manufacturer has supplied MTM since 2010 – the amount supplied to MTM having increased over the previous two years. The manufacturer advised that in the past five years there have been no changes to the product’s composition (formulation) and no changes to the composition of its material components or their specifications. The product is also supplied to New South Wales (NSW) railways.

The supplier does not provide technical guidance to the customer on dosage rates or on the optimum location of rail lubricators. The manufacturer advised that the presence of metallic fines (snow) below the rail would indicate a lack of lubrication.

Rail lubricator maintenance

Rail lubricators were subject to scheduled servicing during a process known as a Pit Cleaning Occupation (PCO). In this process, the immediate environment around and between station platforms was serviced and maintained.

Through 2015, rail lubricators were maintained by Sunstone Resources Pty Ltd[17] under contract from MTM. These arrangements changed towards the end of 2015 and MTM advised that it ceased using Sunstone for lubricator maintenance in December 2015.

Around this time, one individual from the Sunstone lubricator maintenance team joined MTM. He and an existing MTM employee were tasked with training other MTM track maintenance staff in lubricator maintenance. MTM advised that it had been difficult to organise safeworking arrangements for access to the track during this transition period and that lubrication activities were subsequently fully re-established in February 2016.

Records for rail lubricator maintenance on the South Morang line from July 2015 to February 2016 (Figure 12) indicated that monthly inspection and maintenance had been conducted through to December 2015, and that no further maintenance had then occurred until after the derailment.

Figure 12: Recorded lubricator maintenance on the Rushall curve lubricator

DatePiston movement (cm)ATSB notes
18/7/1524 
15/8/1522 
12/9/1525 
11/10/1519 
14/11/1510Reduced quality of record
12/12/1518Reduced quality of record
12/2/1615Following derailment

This table displays the dates of lubricator maintenance on the Rushall curve lubricator. The piston position is an indication of the amount of grease remaining in the pot. A piston position of 30 cm indicated that the lubricator ‘pot’ was nearing empty.Source: Metro Trains Melbourne

The lubricator inspection records provided no detail on the extent of any refill and whether the piston movement measurement was taken before or after refill. Other entries on these records, around inspection activities undertaken and lubricator settings, were identical across all records.

Inspection frequency

The relevant MTM work instruction[18] specified the steps associated with lubricator maintenance, the tools required and management accountabilities. This instruction stated that the asset manager was responsible for determining the type and frequency of lubrication inspection in order to ensure a safe and efficient track infrastructure.

MTM advised that the maintenance plan required that lubricators be inspected every three months. This differed from the monthly interval specified up until 2012 and was reportedly the result of a risk assessment process. Irrespective of this reduced frequency of planned inspection, records indicate that the Sunstone maintenance team were inspecting lubricators on a monthly cycle.

Related occurrences

On 11 February 2016, five days after the derailment, a track regulator[19] travelling towards Melbourne derailed on the Rushall curve at a subsequent mechanical joint on the Up track. The flange-climb was again just beyond a rail joint in the outside rail (Figure 13). The derailment had occurred despite hand-greasing of the rail gauge-face following the first derailment.

Figure 13: The Point-of-Flange-Climb and track of the wheel flange across the rail head

Figure 13: The Point-of-Flange-Climb and track of the wheel flange across the rail head. The photograph is annotated to show the direction of train travel (yellow arrow) and the flange track along and across the rail head (red line). Note that the point of flange-climb commenced immediately after the rail joint. Source: Chief Investigator, Transport Safety (Vic)

The photograph is annotated to show the direction of train travel (yellow arrow) and the flange track along and across the rail head (red line). Note that the point of flange-climb commenced immediately after the rail joint.Source: Chief Investigator, Transport Safety (Vic)

__________

  1. Towards Melbourne
  2. When rail joints on the Up and Down rails are not opposite (adjacent to) each other, but are positioned alternately.
  3. Referred to as Curve Close Inspection in MTM procedures, and entails a thorough walking inspection by track engineers.
  4. The dynamic vertical action of the track structure that occurs during the passing of a train. Where the track structure spans an area of degraded subgrade (e.g. with deficient drainage), this action can force fine ballast particles, soil, and water to the surface, fouling the ballast and reducing its load-bearing qualities.
  5. MTM Engineering Specification Track, MTSP 030100-01 Track Geometry Maintenance Tolerances, Version 1, September 2012
  6. Named after its Czech manufacturer.
  7. The IEV100 recording of 34 mm was measured under load and was higher than the static measurement of 29 mm.
  8. The MP2 wheel profile was developed in the 1980s for the Comeng Disc-braked fleet, and has subsequently been applied to the wheels of all bogies with minimal axle-steering capacity.
  9. ALS Industrial Material Evaluation Report 030362-1-1, 2016
  10. V/Line operates Victorian regional rail services. Its trains also operate on the Melbourne metropolitan network
  11. Institute of Railway Technology VLocity Wheel Wear Investigation for V/Line Pty Ltd, Report No. Monash/RT/2016/1144, 1 April 2016
  12. Dynamic simulation of wheel-to-rail contact was conducted by the Institute of Railway Technology, Department of Mechanical Engineering, Monash University. The simulation used Universal Mechanism (UM) software developed by the Laboratory of Computational Mechanics in Russia.
  13. Nadal, M.J., Locomotives à Vapeur; (Collection: Encyclopédie Scientifique, - Bibliothèque de Mécanique Appliquée et Génie, 1908).
  14. Founded in 2013 with shareholders MTR (Hong Kong), John Holland Group and UGL Limited. Sunstone Resources has subsequently ceased operation.
  15. MTMI 033100-04, L2-TRK-MAI-005 Track Maintenance Instruction, Rail Lubricator – Examination and Servicing, Version 1, effective 14 June 2013.
  16. Maintenance vehicle used to distribute and profile track ballast.

Safety analysis

The derailment

Train TD1064 was travelling towards Melbourne when it derailed on the tightest curve on the metropolitan mainline network. The train was being operated within the speed limit for this curve and its manner of operation did not contribute to the derailment.

Site observations identified that the train derailed as a result of flange-climb by the leading right-hand wheel of the second car.

Wheel-rail coefficient of friction and lubrication

Coefficient of friction

At the point of flange-climb, the rail gauge-face surface indicated high-friction wheel-to-rail contact. Metal filings from this contact were also observed at the base of the rail. Based on measurements from across the network, expert opinion[20] was that the coefficient of friction between the gauge-face and wheel flange was probably around 0.45 at the derailment location.

The coefficient of friction between the wheel and rail has a significant influence on the risk of flange-climb derailment. Simulations applying flange-climb criterion to this curving scenario showed that the potential for flange-climb increased significantly with increasing friction (Figure 14).

Figure 14: Simulation results for the derailed car (1305T) for a range of friction conditions

Figure 14: Simulation results for the derailed car (1305T) for a range of friction conditions. The diagram shows the estimated Nadal index through the Rushall curve for a range of wheel-rail coefficients of friction. The higher the coefficient of friction, the greater the likelihood of flange-climb derailment.
Source: Institute of Railway Technology (Monash University)

The diagram shows the estimated Nadal index through the Rushall curve for a range of wheel-rail coefficients of friction. The higher the coefficient of friction, the greater the likelihood of flange-climb derailment. Source: Institute of Railway Technology (Monash University)

Relationship between lubrication and coefficient of friction

The relationship between the coefficient of friction and lubricant film thickness is well-established. The higher the lubricant film thickness, the lower the coefficient of friction between wheel flange and rail. For example, a friction coefficient of 0.15 is considered to represent a well-lubricated contact condition, whereas around 0.45 would represent an unlubricated interface.

In the case of small-radius curves, effective lubrication is critical. In this instance, there were clear signs of abrasive metal-to-metal contact indicating that lubrication between rail and wheel was inadequate.

Network lubrication

Metro Trains Melbourne (MTM) rolling stock division identified an increasing rate of dry and rough wheel flanges from December through to this derailment. This increased presence of dry flanges in the MTM fleet was almost certainly the result of a deterioration in rail lubrication across the network. The dry summer conditions may have also added to a reduction in lubrication performance.

MTM advised that previous periods of dry and rough flanges in 1987, 2006 and 2012 were identified as likely being the result of issues with the filling and servicing of rail lubricators. The most recent period of dry flanges was also likely to be associated with lubricator inspection and maintenance.

Rail lubricator maintenance

The arrangements for maintaining lubricators were changed towards the end of 2015 when MTM ceased using its affiliated contract company. There was then no further inspection of lubricators on the South Morang line until after the derailment in February 2016.

MTM advised that their maintenance plan required that lubricators be inspected every three months, although up to December 2015, lubricator inspection was reportedly on a monthly cycle. MTM track managers were aware of the specified maintenance cycle of three months and this may have influenced them in taking several months to establish an effective lubricator maintenance regime.

Fleet rolling stock wheel condition indicated that the degree and standard of network rail lubrication had started declining in December 2015 and had further deteriorated through January and early February 2016. The most probable reason for this deterioration was a reduction in the effectiveness of rail lubrication across the network. This probably resulted from inadequate lubricator maintenance during the transition from contracted to internal maintenance.

MTM was aware of the fleet-wide deterioration in wheel condition, but the response was inadequate to prevent this derailment.

Location of lubricators

MTM managed flange-to-rail lubrication using fixed rail lubricators. Guidance on the placement of rail lubricators was provided in an MTM procedure[21], and included the advice that lubricators:

  • should not be positioned at or near small-radius curves[22] (defined as being with radii less than 300 m)
  • should not be positioned at locations where there was no or minimal wheel flange contact (such as on tangent track)
  • should not be co-located (adjacently on each rail), but rather each lubricator should be located at the entrance to the curve it was intended to service
  • should be located at the beginning of a moderate-radius feeder curve ahead of the more severe target curve.

Specialist advice provided to MTM’s predecessors was that track lubricators should be located at the lead-in to the target curve. Two reports (prepared in 2000[23] and 2007[24]) provided information about the effective siting of rail lubricators. Many of the lubricators examined during these studies were located on sections of tangent track distant from the curves being serviced. Advice was provided that such positioning was not suitable for efficient lubrication. In addition, the practice of co-locating lubricators (for each rail) was identified as ineffective and undesirable.

MTM’s procedure (June 2013) for locating rail lubricators reflected the advice provided within these specialist’s reports. However, a recent MTM audit found that 43 per cent of lubricators were in fact located on tangent track. This would have resulted in an inefficient use of lubricant and the potential for lubricator performance to be less effective than desired.

The lubricator that was provided to service the gauge-face of the outside rail of the left-hand Rushall curve (Up track) was located on tangent track in advance of an intervening right-hand curve. This would have led to less-effective pick-up of lubricant, and where pick-up did occur, too much of that lubricant being deposited directly back onto the track (Figure 15).

Figure 15: Rail lubricator for the Rushall curve Up track and grease plume

Figure 15: Rail lubricator for the Rushall curve Up track and grease plume. This image shows the rail lubricator for the Rushall curve, located on tangent track. The grease plume indicates that much of the lubricant has been flung off the wheel and deposited on the track. Note that the right-hand curve in the distance is an intervening (opposite) curve, and is not the one intended to be served by this lubricator. The left-hand Rushall curve is further in the distance and not shown on this photograph.
Sourc

This image shows the rail lubricator for the Rushall curve, located on tangent track. The grease plume indicates that much of the lubricant has been flung off the wheel and deposited on the track. Note that the right-hand curve in the distance is an intervening (opposite) curve, and is not the one intended to be served by this lubricator. The left-hand Rushall curve is further in the distance and not shown on this photograph.Source: Chief Investigator Transport Safety (Vic)

Wheel-to-rail contact

Wheel surface condition

Compared to a typical worn wheel, the recently-machined wheels of train TD1064 had roughened flanges. There was heavy scoring of the throat, and some remaining circumferential machining grooves towards the flange tip (Figure 16). The scored and grooved area was within the band that would contact the rail gauge-face, and it is probable that this roughened surface contributed to an increased coefficient of friction between wheel and rail.

Figure 16: Comparison between derailed wheel (left) and normally worn wheel (right)

Figure 16: Comparison between derailed wheel (left) and normally worn wheel (right). This image depicts the difference between the surface condition of the derailment wheel (left) and a typical worn wheel (right). The derailment wheel shows heavy scoring within the throat (the tread-to-flange radius) and residual machining grooves, compared to the relatively smooth finish on the normally-worn wheel.
Source: Chief Investigator, Transport Safety (Vic)

This image depicts the difference between the surface condition of the derailment wheel (left) and a typical worn wheel (right). The derailment wheel shows heavy scoring within the throat (the tread-to-flange radius) and residual machining grooves, compared to the relatively smooth finish on the normally-worn wheel.Source: Chief Investigator, Transport Safety (Vic)

It is probable that there was insufficient lubrication on those parts of the network traversed prior to the derailment, leading to the wheels suffering excessive abrasive wear and scoring. The roughened surface and machining grooves increased the likelihood of a flange-climb event. Application of lubricant to the wheel flange after machining of the wheels, and/or an improved surface finish, can reduce friction and reduce the risk of flange-climb by a newly-profiled wheel set.[25]

Wheel profiles

The current MP2 wheel profile has been in service on the Melbourne network for more than 20 years, with no known reported issues. The MP2 wheel flange angle of 70 degrees (to the horizontal) provides good protection against flange-climb, particularly when combined with effective rail lubrication in sharp curves. As the MP2 wheels wear, the flange angle increases to around 72 degrees, which improves protection against flange climb (Figure 17).

Figure 17: L-on-V ratio for flange climb, for a range of flange angles (FA)

Figure 17: L-on-V ratio for flange climb, for a range of flange angles (FA). Source: Institute of Railway Technology (Monash University)

The figure shows the effect of flange angle on the relationship between the L/V ratio required for flange climb and contact coefficient of friction. The MP2 wheel profile in a new or newly-machined condition represents the worst case in terms of flange-climb risk, with a flange angle of 70°. As this profile wears, the flange angle increases to an average of around 72° (matching the typical gauge-face profile), with an upper level of around 73°, and the potential for flange-climb reduces.Source: Institute of Railway Technology (Monash University)

The wheels of derailed car 1305T had been re-machined to the MP2 wheel profile the day before the derailment and had only run over a distance of 79 km. Although the MP2 profile provided good protection against flange-climb, the flange angle of the newly-machined wheels increased the risk of flange-climb compared to wheels that were in a worn condition.

Wheel-to-rail contact

Measured profiles of the outside rail in the derailment curve generally matched closely with the worn MP2 wheel profile. The gauge-face angle was generally around 18 degrees (to the vertical) which was consistent with the flange angle of 72 degrees (to the horizontal) of worn wheels. The angle of the gauge-face was also well within the network limit of 26 degrees.

An overlay of wheel and rail profiles (Figure 18) showed no significant abnormality and rail contact conditions were generally consistent with expectations. Comparison between this overlay and a worn wheel-to-rail overlay found that the newly-machined wheel rode slightly higher on the rail.

Figure 18: Wheel - rail profile overlay for the right-hand wheels of the derailed bogie

Figure 18: Wheel - rail profile overlay for the right-hand wheels of the derailed bogie. Source: Institute of Railway Technology (Monash University)

Source: Institute of Railway Technology (Monash University)

Angular discontinuity at rail joint

The mechanical rail joint located just prior to the estimated Point-of-Flange-Climb (PoFC) had created a lateral angular discontinuity (kink) in the line of the rail (Figure 19).

Figure 19: The outside rail and the lateral angular discontinuity at the mechanical joint

Figure 19: The outside rail and the lateral angular discontinuity at the mechanical joint. The photograph is annotated to show the direction of train travel (yellow arrow) and the flange track along and across the rail head (red line). Note that the point of flange-climb commenced immediately after the rail joint.
Source: Chief Investigator, Transport Safety (Vic)

The two images depict the angular change in the line of rail at the mechanical rail joint (indicated by yellow arrows) that was about 0.6 m ahead of the first detectable point of flange climb. The train’s direction of travel is shown by the red arrows.Source: Chief Investigator, Transport Safety (Vic)

The angular discontinuity at the mechanical joint would have had the effect of increasing the wheel-to-rail angle-of-attack to the rail and causing a peak in the wheel-to-rail lateral force. This peak is also evidenced by the peak in rail head side-wear at this location (Figure 20).

Figure 20: Top and side-wear for the outside rail of the derailment curve

Figure 20: Top and side-wear for the outside rail of the derailment curve. Source: Institute of Railway Technology (Monash University)

This figure shows the sharp increase in side-wear at the estimated PoFC, just beyond the mechanical joint. The sharp increase in side-wear correlates with the angular discontinuity at the mechanical rail joint.Source: Institute of Railway Technology (Monash University)

It is therefore probable that in the context of poor lubrication and existing track geometry, the angular discontinuity at the mechanical joint was sufficient to initiate flange-climb at this particular point on the curve. A second derailment a few days later involving a track machine, was also the result of flange-climb by its leading right-hand wheel just beyond a subsequent mechanical joint.

Identification and management of joint misalignment

The network’s track geometry standard did not include any specific requirement to directly assess a localised angular discontinuity at a mechanical joint. The measurement and monitoring of rail line is specified within the network maintenance standards (Figure 21).

Figure 21: The MTM network line variation standard for 110 km/h and 40 km/h speeds

 Class 3 (100 km/h)Class 5 (40 km/h)
A Fault30 mm50 mm
B Fault20 mm37 mm

The table shows the fault criteria for 100 km/h track, as applied to the corridor, and 40 km/h track, as applied to the Rushall curve.Source: Extracted from MTM maintenance specifications

The track geometry recorded after the derailment showed several peaks (positive) and troughs (negative) in rail line deviation (Figure 22). In the area of the derailment, all peaks and troughs were below the 40 km/h ‘B’ Fault criteria. The series of peaks leading to the PoFC are consistent with the joint spacing.

Figure 22: Track ‘line’ through the Rushall curve measured following the derailment

Figure 22: Track ‘line’ through the Rushall curve measured following the derailment. Source: Institute of Railway Technology (Monash University)

Source: Institute of Railway Technology (Monash University)

In December, prior to the derailment, the IEV100 track recording vehicle had also detected variations in the line of both rails within the Rushall curve. There were two recorded deviations in each rail, although neither at the Point-of-Derailment. Again however, all line faults were below the threshold for a ‘B’ fault applied to 40 km/h track and so did not require maintenance action.

In the context of the prevailing high friction wheel-rail conditions, the general track condition and geometry and the re-profiled wheels, the geometry at the mechanical joint was sufficient to result in flange-climb at that location.

Noting that track ‘line’ was within the applied network track geometry maintenance tolerances, there was no other system in place to identify that the degraded state of geometry at a mechanical joint may be such as to promote a flange-climb event.

Influence of other track geometry on potential for flange-climb

In simulation studies using a coefficient of friction of 0.5, the criterion for flange-climb was exceeded at four locations within the Rushall curve (Figure 23). The derailment of train TD1064 did not occur at any of these points, but rather a smaller peak in Nadal Index that, when combined with the effects of the mechanical rail joint, produced the conditions for flange climb.[26] Nevertheless, the potential for flange-climb existed at several locations through the curve and partial climbing at these locations was possible. For the three days prior to the derailment, the car-set’s logger recorded numerous acceleration transients at various locations through the Rushall curve, suggesting unusual tracking behaviour.

Figure 23: Results of the simulation (the Nadal index) for a coefficient of friction of 0.5

Figure 23: Results of the simulation (the Nadal index) for a coefficient of friction of 0.5. Source: Institute of Railway Technology (Monash University)

The simulation showed that the Nadal index of 1, that is the threshold for derailment, was potentially exceeded at four locations. The greatest exceedance is circled on the figure. The PoFC was at a smaller peak with an index of about 0.75 (identified by the blue arrow). This data resolution and modelling used in the simulation did not account for the localised effect of the joint.Source: Institute of Railway Technology (Monash University)

The maximum Nadal Index calculated by simulation occurred at a point at which a number of track geometric features combined to make the train susceptible to flange-climb, in particular a peak in track twist (Figure 24).

Figure 24: Measured track short twist through the Rushall curve

Figure 24: Measured track short twist through the Rushall curve. Source: Institute of Railway Technology (Monash University)


The short twist (3.5 m chord) in track geometry (circled) coincided with the maximum Nadal Index circled in Figure 23. This figure is plotted in the opposite direction to Figure 24.Source: Institute of Railway Technology (Monash University)

The peak in Nadal Index occurred where there was an in-phase[27] lateral alignment variation towards the inside of the curve and out-of-phase[28] variations in left and right rail ‘top’, leading to the track twist.The combined effect of a change in lateral alignment towards the inside of the curve and the partial wheel unloading associated with the twist increased the L-to-V ratio to a critical level, increasing the likelihood of flange-climb.

Tolerances within track geometry standards

At the simulated point of highest risk of flange-climb, track geometry, including top, line, twist and gauge, was compliant with the network’s 40 km/h limit that was applied to the Rushall curve (Figure 25). However, in the prevailing high-friction conditions, a combination of these compliant geometric irregularities, particularly twist and line, resulted in a high chance of flange-climb.

Figure 25: Geometric parameters at the maximum L/V

 Measured parameter at the Maximum L/V Class 3 (100 km/h)Class 5 (40 km/h)
Line28 mmA Fault30 mm50 mm
  B Fault20 mm37 mm
Top< 20 mmA Fault28 mm42 mm
  B Fault22 mm32 mm
Short Twist33 mmA Fault25 mm41 mm
  B Fault18 mm33 mm

Source: Chief Investigator, Transport Safety (Vic)

The current network tolerances on track geometry for low-speed curves did not prevent the potential for flange-climb reaching these critical levels, suggesting that the current track geometry limits were inadequate for small-radius mainline curves where flange-climb risk is at its highest.

Influence of cant excess at lower train speeds

At the PoFC, the track cant of 77 mm was close to the design level and well within the network’s tolerances. However, the train’s low speed of 20 km/h meant that the cant at the PoFC was in excess of the equilibrium cant[29] of about 40 mm for that train speed. This excess cant condition would have increased the leading wheel angle-of-attack and propensity for flange climb.

Management of wide gauge

Gauge-widening of small-radius curves was a standard, documented, MTM practice[30] in which track maintenance staff were trained. The network standard specified that for curves of 120 m radius and less (as was the Rushall curve), the track gauge may be widened by up to 12 mm.

Post-derailment measurement identified that track gauge through the curve was variable and often exceeded the specified widening of up to 12 mm (Figure 26).

Figure 26: Track gauge through Rushall curve measured after derailment

Figure 26: Track gauge through Rushall curve measured after derailment. Source: Institute of Railway Technology (Monash University)

This diagram shows numerous exceedances of the wide gauge ‘B’ limit and one ‘A’ limit exceedance within the Rushall curve.Source: Institute of Railway Technology (Monash University)

The post-incident track measurement also identified a wide-gauge ‘A’ fault[31] although the fault was not at the PoFC, and so did not contribute to the derailment.

Records indicate that the wide-gauge ‘A’ fault had been present since early 2015, and had not been corrected. The history of this fault can be tracked over time (Figure 27).

Figure 27: History of wide gauge “A’ fault

DateWide Gauge

Recorded km[32]

__________

  1. The small variations in recorded km position are considered within tolerance across the different recording systems.
Comment
1/3/1533 mm7.571

Work order TR005087

No evidence of close-out.

1/12/1534 mm7.577Recorded by IEV100
7/12/15  

‘A’ fault closed-out on Ellipse[33]

__________

  1. Ellipse is an asset management and resource planning application used by MTM.
11/2/1629 mm7.572KRAB post-incident (static)

Source: MTM maintenance records

In terms of flange-climb, the effect of wide gauge is related to an increase in wheel angle-of-attack.

In this instance the wide gauge of over 30 mm was excessive, and this ‘A’ fault was permitted to exist for an extended period, contrary to network standards. The fault was closed-out on the asset management system even though it had not been rectified.

Risk mitigation for small-radius curves

MTM infrastructure standards had no special requirements for the management of derailment risk on small-radius curves. Following risk assessments in 2013[34], the potential need for further derailment protection at high risk locations was flagged. The development of an associated network standard was still under consideration at the time of the Rushall derailment.

Use of Check Rails to mitigate risk of flange climb

One possible method of derailment protection on small-radius curves is a check rail. A check rail (laid closely parallel to and inside the running rail) can be installed on severely-curved track to reduce the risk of derailment and to limit rail head and gauge-face wear. This extra rail comes into contact with the back of the wheel flange and can be used on sharp curves (and other locations) as a check against the opposite wheel of the wheelset climbing the high rail[35]. This restriction to lateral displacement also serves to distribute the lateral force on the wheelset, relieving some of the force on the outside flange (Figure 28).

Figure 28: Use of a check rail in a curve

Figure 28: Use of a check rail in a curve. This illustration demonstrates how a check rail interacts with the back face of the inside wheel flange.
Source: Chief Investigator, Transport Safety (Vic)

This illustration demonstrates how a check rail interacts with the back face of the inside wheel flange.Source: Chief Investigator, Transport Safety (Vic)

Check rails have long been a common global track engineering feature, although their use in Australia has diminished. Check rails were previously used on the Melbourne metropolitan rail network until their general use was discontinued at some point during the 1960s. Check rails had previously been installed on the Up and Down Rushall curves (Figure 29).

Figure 29: Historical use of check rails on Rushall curve c1965.

Figure 29: Historical use of check rails on Rushall curve c1965. The red arrows show check rails on both Up and Down tracks. The left-hand track in this image is the derailment curve.
Source: Bob Wilson, annotated by the Chief Investigator Transport Safety (Vic)

The red arrows show check rails on both Up and Down tracks. The left-hand track in this image is the derailment curve.Source: Bob Wilson, annotated by the Chief Investigator Transport Safety (Vic)

The use of check rails is mandated in several overseas jurisdictions, but not in Australia. Other Australian jurisdictions advised as follows:

  • In NSW, check rails now exist on only a few lines of Tourist & Heritage status. Apart from these operations, NSW country and metro lines have no curvature below 150 m radius and no longer use check rails
  • In South Australia, the Adelaide Metro (a broad-gauge network) has no curvature more severe than 200 m radius and does not use check rails for curve derailment prevention. They advised, however, that they do make use of check rails for derailment prevention in locations where critical buildings or structures are in extremely close proximity to the track and considered to be vulnerable

Information from sampled international jurisdictions was that:

  • In the United Kingdom, check rails are required on passenger lines with curves having a horizontal radius of 200 m or less[36]
  • Irish Rail[37] also required check rails for curves having a radius of 200 m or less.[38] Its infrastructure standards also warn of the possible requirement for check rails where curve radius is more than 200 m but occurs on a hazardous embankment (from a derailment point of view), and where it carries heavy traffic likely to cause severe rail side wear
  • In the United States of America, four transit operators use what is termed a restraining rail for small-radius curves. The radius below which the restraining rail is mandated varies between operators and ranges between 152 m and 305 m[39].

Delay in reporting derailment

Prompt reporting of incidents to the control centre is important to allow emergency response and also to prevent possible further incidents or injuries. In this case the train derailed and one carriage was foul of the adjacent Down passenger line.

The driver was initially unsuccessful in trying to contact Metrol via the train radio, and subsequently made contact by using a company-issued mobile phone. This led to a significant delay of about 7 minutes between the derailment and the halting of traffic through the location.

The Digital Train Radio System (DTRS) has several levels of call with escalating priority and treatment by Metrol. The DTRS log showed that in this instance the driver initially made three lower-priority Train Controller Calls (TCC). A TCC is placed in a queue for the train controller for that track group to respond when able. The driver’s recollection was that he pushed the Train Emergency Call (TEC) button, the level 2 priority call that should be used in an emergency but where there is no immediate danger, however, the system did not recognise or register this call. Post-incident testing of the DTRS by MTM found that once a TCC call was queued, the system would not override it with a TEC call. The system required that the lower-priority call first be cancelled by the driver prior to initiating a higher-priority call.

There is also a Rail Emergency Call (REC) feature on the DTRS that is the highest-priority call. REC calls go to Metrol and to other trains on the same line, to enable those train drivers to take immediate action. It should be used when an emergency could physically affect other trains, such as in the event of a derailment where an adjacent running line is or may be fouled. As this derailed train was lying foul of the other track, an REC call would have been appropriate.

__________

  1. Friction measurements undertaken by the Institute of Railway Technology (Monash University) elsewhere in the Victorian rail network have found that for rough, dry surfaces (such as those observed at the Rushall derailment site), gauge-face friction levels of around 0.45 could be expected.
  2. MTPR 033100-04 L2-TRK-PRO-031 Track Procedure Rail Lubrication, Version 1. Effective 14 June 2013.
  3. Due to the potential for inefficient and often excessive lubrication and contamination of the running surface.
  4. Rail Services Australia Technical Report (December 2000).
  5. Marich Consulting Technical Note on track lubrication (November 2007).
  6. Transportation Research Board (2005) Flange Climb Derailment Criteria and Wheel/Rail Profile Management and Maintenance Guidelines for Transit Operations, The National Academies Press pp25.
  7. The data resolution and modelling used in the simulation were such that the localised effects of the mechanical joint were not modelled.
  8. Both rails having a lateral alignment variation occurring roughly at the same point.
  9. Meaning one rail is peaking while the other is in a trough.
  10. The cant at which the centrifugal force developed during the movement of a train on a curved track at a particular speed is balanced by the cant provided.
  11. MTPR 033000-08 MTM WELDED TRACK MANAGEMENT MANUAL, v2, Chapter 8, clause 1.13.
  12. For the 40 km/h curve, the ‘A’ fault band for wide gauge was 26 mm and above.
  13. The small variations in recorded km position are considered within tolerance across the different recording systems.
  14. Ellipse is an asset management and resource planning application used by MTM.
  15. MTM Project Engineering Support, Regional Rail Link, Derailment Containment: RRL Derailment on High Risk Locations (Draft, v1, advised by MTM as being current).
  16. Australasian Railway Association Glossary for National Code of Practice and Dictionary of Railway Terminology.
  17. UK Railway Group Standard GC/RT5021 December 2011.
  18. Otherwise known as Iarnród Éireann, Irish Rail is the operator of the national Broad-Gauge railway network of Ireland (Republic of Ireland and jointly with Northern Ireland Railways).
  19. Irish Rail standards I-PWY-1154: Horizontal Curvature Design, Issue 1.0, 7/1106, and I-PWY-1106: Track Construction Standards, Issue 1.0, 13/09/2005.
  20. Transportation Research Board (2005) Flange Climb Derailment Criteria and Wheel/Rail Profile Management and Maintenance Guidelines for Transit Operations, The National Academies Press pp 37.

Findings

From the evidence available, the following findings are made with respect to the derailment of train TD1064 near Rushall Station on 6 February 2016. These findings should not be read as apportioning blame or liability to any particular organisation or individual.

Safety issues, or system problems, are highlighted in bold to emphasise their importance. A safety issue is an event or condition that increases safety risk and (a) can reasonably be regarded as having the potential to adversely affect the safety of future operations, and (b) is a characteristic of an organisation or a system, rather than a characteristic of a specific individual, or characteristic of an operating environment at a specific point in time.

Contributing factors

  • There was insufficient lubrication between wheel flanges and the outside rail of the 118 m small-radius curve (Up track) between Merri and Rushall Railway Stations.
  • The performance of rail lubricators on the network had diminished in the months leading up to the derailment.
  • The maintenance of rail lubricators had become less effective in the months leading up to the derailment. This work was being transferred from contractors to internal Metro Trains Melbourne (MTM ) staff and the transition was not adequately managed. [Safety Issue]
  • The flanges of the train’s recently-machined wheels had machining grooves and had been roughened through a lack of network lubrication, resulting in a higher contact surface coefficient of friction. This increased the probability of flange-climb compared to a typical wheel worn on a well-lubricated network.
  • Recent machining of the train’s wheels had returned them to the ‘as-new’ wheel profile that had a lower flange angle (to the horizontal) than a typical worn wheel. This increased the probability of flange-climb.
  • A lateral angular discontinuity at a mechanical joint in the outside rail resulted in a localised peak in the wheel-to-rail lateral force and probably an increased wheel/rail angle-of-attack. This initiated the flange-climb at this particular point on the curve.
  • The network’s track geometry standard did not include any specific requirement to limit a localised lateral angular discontinuity in rail line at a mechanical joint. [Safety issue]

Other factors that increased risk

  • The positioning of the rail lubricators at this and several other locations on the network was not consistent with MTM guidelines and probably reduced their effectiveness. [Safety issue]
  • The network’s track geometry standards were probably unsuitable for small-radius Broad-Gauge curves. A combination of track geometry irregularities had increased the probability of flange-climb at several locations on the small-radius Rushall curve. [Safety issue]
  • Track geometry through the Rushall curve was not managed in accordance with MTM network standards. A wide-gauge ‘A’ fault was not rectified in the field despite being closed-out on the asset management system. [Safety Issue]
  • There was no network standard that directly dealt with increased derailment risk on small-radius curves. [Safety Issue]
  • The Digital Train Radio System did not allow a Train Emergency Call to override an initial lower-priority call. [Safety Issue]

Safety issues and actions

The safety issues identified during this investigation are listed in the Findings and Safety issues and actions sections of this report. The Australian Transport Safety Bureau (ATSB) expects that all safety issues identified by the investigation should be addressed by the relevant organisation(s). In addressing those issues, the ATSB prefers to encourage relevant organisation(s) to proactively initiate safety action, rather than to issue formal safety recommendations or safety advisory notices.

Depending on the level of risk of the safety issue, the extent of corrective action taken by the relevant organisation, or the desirability of directing a broad safety message to rail industry, the ATSB may issue safety recommendations or safety advisory notices as part of the final report.

Rail lubricator maintenance

Safety issue number: RO-2016-002-SI-01

Safety issue description: The maintenance of rail lubricators had become less effective in the months leading up to the derailment. This work was being transferred from contractors to internal Metro Trains Melbourne (MTM) staff and the transition was not adequately managed.

Standard for angular discontinuity at mechanical joints

Safety issue number: RO-2016-002-SI-02

Safety issue description: The network’s track geometry standard did not include any specific requirement to limit a localised lateral angular discontinuity in rail line at a mechanical joint.

Location of rail lubricators

Safety issue number: RO-2016-002-SI-03

Safety issue description: The positioning of the rail lubricators at this and several other locations on the network was not consistent with MTM guidelines and probably reduced their effectiveness.

Track geometry standards

Safety issue number: RO-2016-002-SI-04

Safety issue description: The network’s track geometry standards were probably unsuitable for small-radius Broad-Gauge curves. A combination of track geometry irregularities had increased the probability of flange-climb at several locations on the small-radius Rushall curve.

Management of wide gauge defect

Safety issue number: RO-2016-002-SI-05

Safety issue description: Track geometry through the Rushall curve was not managed in accordance with MTM network standards. A wide-gauge ‘A’ fault was not rectified in the field despite being closed-out on the asset management system.

Standard for derailment risk on small-radius curves

Safety issue number: RO-2016-002-SI-06

Safety issue description: There was no network standard that directly dealt with increased derailment risk on small-radius curves.

Train radio functionality

Safety issue number: RO-2016-002-SI-07

Safety issue description:  The functionality of the Digital Train Radio System (DTRS) did not allow an emergency call to override an initial lower-priority call.

Sources and submissions

Sources of information

The sources of information during the investigation included:

  • Metro Trains Melbourne (train operator)
  • Monash Institute of Rail Technology (consultant)
  • ITW Polymers & Fluids (lubricant supplier).

References

Iwnicki S (2006), Handbook of Railway Vehicle Dynamics, CRC Press, pp 221

Submissions

Under Part 4, Division 2 (Investigation Reports), Section 26 of the Transport Safety Investigation Act 2003 (the Act), the Australian Transport Safety Bureau (ATSB) may provide a draft report, on a confidential basis, to any person whom the ATSB considers appropriate. Section 26 (1) (a) of the Act allows a person receiving a draft report to make submissions to the ATSB about the draft report.

A draft of this report was provided to:

  • Metro Trains Melbourne
  • Office of The National Rail Safety Regulator.

Extracts of this draft report were provided to:

  • Institute of Rail Technology (Monash University)
  • ITW Polymers & Fluids.

Submissions were received from Metro Trains Melbourne, Monash University and ITW Polymer. The submissions were reviewed and where considered appropriate, the text of the report was amended accordingly.

Purpose of safety investigations

The objective of a safety investigation is to enhance transport safety. This is done through:

  • identifying safety issues and facilitating safety action to address those issues
  • providing information about occurrences and their associated safety factors to facilitate learning within the transport industry.

It is not a function of the ATSB to apportion blame or provide a means for determining liability. At the same time, an investigation report must include factual material of sufficient weight to support the analysis and findings. At all times the ATSB endeavours to balance the use of material that could imply adverse comment with the need to properly explain what happened, and why, in a fair and unbiased manner. The ATSB does not investigate for the purpose of taking administrative, regulatory or criminal action.

Terminology

An explanation of terminology used in ATSB investigation reports is available here. This includes terms such as occurrence, contributing factor, other factor that increased risk, and safety issue.

Publishing information 

Released in accordance with section 25 of the Transport Safety Investigation Act 2003

Published by: Australian Transport Safety Bureau

© Commonwealth of Australia 2018

image_5.png

Ownership of intellectual property rights in this publication

Unless otherwise noted, copyright (and any other intellectual property rights, if any) in this report publication is owned by the Commonwealth of Australia.

Creative Commons licence

With the exception of the Coat of Arms, ATSB logo, and photos and graphics in which a third party holds copyright, this publication is licensed under a Creative Commons Attribution 3.0 Australia licence.

Creative Commons Attribution 3.0 Australia Licence is a standard form licence agreement that allows you to copy, distribute, transmit and adapt this publication provided that you attribute the work.

The ATSB’s preference is that you attribute this publication (and any material sourced from it) using the following wording: Source: Australian Transport Safety Bureau

Copyright in material obtained from other agencies, private individuals or organisations, belongs to those agencies, individuals or organisations. Where you wish to use their material, you will need to contact them directly.

Occurrence summary

Investigation number RO-2016-002
Occurrence date 06/02/2016
Location Near Rushall Railway Station, Fitzroy North
State Victoria
Report release date 16/05/2018
Report status Final
Investigation level Systemic
Investigation type Occurrence Investigation
Investigation status Completed
Mode of transport Rail
Rail occurrence category Derailment
Occurrence class Incident
Highest injury level Minor

Train details

Train operator Metro Trains Melbourne
Train number TD1064
Type of operation Passenger
Departure point South Morang, Victoria
Destination Melbourne (Flinders St), Victoria
Train damage Minor

Accident to Auster J5/F aircraft VH-AFK near Jenolan Caves NSW on 16 October 1954

Summary

This accident was investigated by the late R. W. Adsett, then Senior Examiner of Airmen, New South Wales Region, and his report appears at Enclosure 6B. The following is a summary of the evidence.

Auster J5/F VH-AFK , owned and operated by C. M. Hazelton, trading as Hazel ton Air Taxi and Charter Service, Toogong, New South Wales, departed Bankstown Aerodrome, New South Wales, at 1517 hours on the 16th October, 1954, for Toogong, 124 miles on a bearing of 287°T from Bankstown and directly across the Great Dividing Range. The aircraft was being flown solo by the owner on a private flight and, as the pilot did not hold an instrument rating and the aircraft was not equipped for instrument flight, it was to be conducted under the visual flight rules. The forecast weather throughout the route was "8/8th cloud, base 300-400 feet above terrain about highlands and base at times 100 feet or less in rain on western part of the route.

Accident site map for VH-AFK

Occurrence summary

Investigation number VH-AFK 1954
Occurrence date 16/10/1954
Location near Jenolan Caves
Report status Final
Investigation type Occurrence Investigation
Investigation status Completed
Mode of transport Aviation
Occurrence class Accident
Highest injury level None

Derailment of freight train WG713, Denman, New South Wales, on 19 January 2016

Final report

Report release date: 25/03/2019

Safety summary

What happened

On 19 January 2016, at approximately 0400 Australian Eastern Daylight Time (AEDT), an empty Pacific National coal train derailed in a section between the Ogilvie and Rosemount Road level crossings at Denman, New South Wales. The lead bogie of the 64th wagon behind the locomotives operated in a derailed state for a period of time before re-railing at the Rosemount Road level crossing.

The train crew were unaware of the incident until they were notified by the Australian Rail Track Corporation’s (ARTC) network controller, after a signal electrician advised of track damage at that location. The train stopped at Bylong Loop approximately 71 km away from the derailment site.

What the ATSB found

The derailment occurred near a long twist track defect in an area with other known track geometry defects that had been identified a week before. The defective area was managed with Temporary Speed Restrictions (TSRs) until it could be repaired. It was found that the area deteriorated at a faster rate than anticipated, leading to the derailment. The known long twist defect was measured after the derailment and found to be out of ARTC’s acceptable tolerance limits within its Civil Code of Practice (COP).

The ATSB found the track was damaged between the point of derailment up to the Rosemount Rd level crossing. The track damage and marks exhibited on the steel road plate of the level crossing were consistent with that of a train derailing and re-railing.

What has been done as a result

Since the incident, ARTC has:

  • Instigated a recurring weekly “Unscheduled Asset Examination” to inspect the track formation at the incident location until permanent repairs could be completed.
  • Repaired and reconditioned the formation in the area in July 2017.
  • Reviewed its track/civil engineering standards and guidance documentation.

Safety message

Maintenance inspection and categorisation of defects must take into account that defects may deteriorate faster than expected. Factors that can contribute to rapid deterioration should be considered when developing maintenance responses.


The occurrence

Train WG713 with a crew of two was travelling within New South Wales (NSW) from Kooragang Coal Terminal, Newcastle to Wilpinjong Colliery, near Mudgee. As WG713 approached Denman, the train was slowed to comply with a 20 km/h Temporary Speed Restriction (TSR) in force across an area (314.450 km to 314.600 km) with known track geometry defects.

Figure 1: Incident location, Denman, NSW

Figure 1: Incident location, Denman, NSW. Source: ATSB

Source: ATSB

At 314.540 km, the left-hand wheels (in the direction of travel) of the lead bogie of the 64th wagon behind the locomotives mounted the rail. The right-hand wheels likely followed the profile of a long twist[1] defect approximately 30 m before the Point of Mount (POM) which resulted in the left-hand wheels losing vertical load (unloading). This wheel unloading allowed the left-hand wheel flanges to rise onto the Down rail[2] (outside rail) head. The left-hand wheels then tracked across the railhead of the Down rail for 10 m before dropping off the rail at 314.550 km (see Figure 1).

As a consequence of this, the right-hand wheels in the direction of travel also dropped off the Up rail (inside rail), into the four foot (area between the two rails). All wheels of the lead bogie then ran in a derailed state for approximately 690 m towards the Rosemount Road level crossing (see Figure 6). The wheels then struck the steel road plate of the level crossing (see Figure 2). This lifted the wheels up above railhead height and all four wheels re-railed. This was likely assisted by the longitudinal tensile draft forces in the train as the locomotives applied power to pull the train up the grade.

As the wheels ran in a derailed state, they impacted the track fastenings and the foot of the rail. A number of rail welded joints, sleepers and fasteners were damaged by the derailed wheels on both rails. The Up rail at 315.056 km suffered a full cross-section break at an alumninothermic weld joint (see Figure 3). The rail break subsequently broke the track circuit which triggered a signal failure to occur. At 0400 the Network Control Officer (NCO) located at the Australian Rail Track Corporation’s (ARTC) Network Control Centre North (NCCN) was alerted to the problem after the train had cleared the section. The train crew were unaware that the train had derailed and continued onto their destination.

Figure 2: Wheel strike marks on Rosemount Road level crossing road plate

Figure 2: Wheel strike marks on Rosemount Road level crossing road plate. Source: ATSB

Source: ATSB

Figure 3: Broken Up rail at 315.056 due to weld being struck by WG713’s derailed wheel

Figure 3: Broken Up rail at 315.056 due to weld being struck by WG713’s derailed wheel. Source: ATSB

Source: ATSB

Post-occurrence

The NCO responded to the signal failure by calling the crew of WG713 at 0403. The crew reported they had cleared the section and they were not aware of any problems. The NCO then called a signal electrician to investigate the problem at 0406.The signal electrician arrived at the location and called the NCO at 0501 to obtain a Controlled Signal Block[3] (CSB) to inspect the area.

A crew member of WG713 called the NCO at 0503 requesting they be routed into Bylong Loop to restart a locomotive that had shut down in Cox’s Gap No.1 Tunnel. This tunnel was located at 367.000 km, which was 53 km away from Denman and 18 km away from Bylong.

The signal electrician called the NCO at 0510 and reported track damage at the location. The signal electrician advised that track repairs were going to be necessary and that WG713 should be stopped due to potentially dragging equipment on the train. The NCO then contacted WG713 and informed the train crew there was track damage at Denman. The NCO requested the crew to inspect their train when they stopped at Bylong Loop.

The signal electrician called the NCO at 0519 and reported a broken rail at the location which had most likely caused the failed track circuit. At this time, train WG713 was still travelling towards Bylong Loop. A crew member of WG713 called the NCO at 0527 and advised they had arrived at Bylong Loop and one crew member was preparing to inspect the train.

At 0532, the crew of WG713 contacted the NCO and advised that they had inspected WG713 and identified no issues with the train.

At 0550, the NCO contacted train UL264 which was travelling in the Up direction and had passed WG713. At this time, UL264 was approaching Yarrawa Loop located just before Denman. The NCO warned the train driver there was track damage ahead at Denman and requested that UL264 proceed into Yarrawa loop with caution and stop. At this time, the NCO was of the opinion that WG713 may have derailed at Denman and asked the train driver of UL264 to report any damage they observed.

At 0555, the NCO contacted train AT712, another train which was travelling in the Up direction and was approaching Murumbo (see Figure 5). The NCO requested that the train driver proceed into Murumbo loop and stop due to track damage at Denman.

The derailed wagon was taken to Pacific National’s One Spot facility in Kooragang and inspected and tested. A twist test[4] was conducted by Pacific National staff in accordance with its standards.

__________

  1. Long Twist: Variation in cross level (height difference between two rails) measured over 14 metres.
  2. The Up rail in NSW is the left-hand rail when facing Sydney; similarly, the Down rail is the right-hand rail when facing Sydney.
  3. A Controlled Signal Block (CSB) is a form of track worksite protection where the Network Control Officer (NCO) sets controlled signals on either side of a section to stop. This excludes rail traffic from both directions from entering a section of track.
  4. A twist test is to assess a unit of rolling stock’s capability to negotiate a specific curve radius and superelevation.

Context

Incident location

The incident occurred on the Ulan Line as the train passed through Denman in NSW, part of the the Australian Rail Track Corporation (ARTC) network in the Hunter Region.

Figure 4: Incident location map

Figure 4: Incident location map. Source: Geoscience Australia, modified by the ATSB

Source: Geoscience Australia, modified by the ATSB

The area was controlled through Centralised Traffic Control (CTC) and there were lineside signals to regulate the passage of rail traffic. Track circuits associated with the signals allowed the NCO to see the location of trains in that area.

Figure 5: Track diagram, Muswellbrook to Ulan Coal

figure5_ro2016001_.png

Source: ARTC (Annotated by the ATSB)

Rail infrastructure information

The track at the incident location was a Class-1C single bi-directional line with 60 kg/m head hardened rail. The sleeper type was heavy-duty concrete, clipped together with pandrol e-clip resilient fastenings. The track bed formation consisted of firm to stiff silty clay, underlain by stiff sandy clay.

The track between 314.400 km and 314.450 km had an average falling gradient of 1:382 in the Down direction[5]; the track then began to climb at an average gradient of 1:63 between 314.450 km and 315.000 km. A culvert and open drain was located at 314.450 km, approximately five metres from the Ogilvie Rd level crossing in the Down direction (see Figure 6). The gradient of the Up side cess adjacent to the track was relatively flat from the Point of Mount (POM) to the culvert. The POM was within a 600 m radius right-hand curve just after a transition where superelevation was at its maximum (see Figure 6).

A wayside monitoring station was located approximately 75 m before the POM in the Up direction (see Figure 6). It measured bearing temperature, train speed and axles passed.

Train information

Train WG713 was an empty coal train operated by Pacific National. It consisted of three 90-class locomotives and 92 coal wagons. The total mass of the train was 2099.2 tonnes (not including locomotives). The total length of train was 1510.32 m.

The wagons of WG713 were coal hoppers, a mix of RHFH, RHCH and NHYC types. The lead bogie of the 64th wagon (RHCH 7293A) behind the locomotives in the consist derailed.

The condition and maintenance history of the incident wagon was examined. RHCH 7293A had been maintained at the required frequency and there were no outstanding defects. Post incident testing of the rolling stock did not reveal any significant defects that may have contributed to the derailment.

Site observations post-incident

ATSB investigators examined the incident site on 19 January 2016. The ATSB completed measurements and identified a number of twist defects with the largest being a 77 mm Emergency 1[6] long twist between 314.500 km and 314.550 km. Top[7] loss in the Up rail was also observed at the incident location.

It was further observed that the derailed wheels had damaged a number of concrete sleepers, track fastenings and rail welds. Upon examining the damage at the site, it was evident that at least two wheel sets had derailed.

The steel crossing plate of the Rosemount Road level crossing, 690 m away from the derailment location, displayed damage consistent with rail wheels striking and running over the crossing (see Figure 2). The wheel strike marks indicate a direction of travel back onto the rail track and no damage was evident after the level crossing. This indicated that a combination of the tensile draft longitudinal forces and the wheel striking the road crossing plate elevated the wheel flange sufficiently to assist re-railing the train.

Upon inspection of the wagons of train WG713, the ATSB identified wheel damage on the leading bogie of the 64th wagon. The wheel damage observed was consistent with damage typically found as a result of a wheel having operated in a derailed state for a period of time (see Figure 7).

ATSB investigators inspected the train which traversed the affected location before WG713 and no evidence of damage on that train was found.

Figure 6: Incident location aerial view

Figure 6: Incident location aerial view. Source: Six Maps, Annotated by the ATSB

Source: Six Maps, Annotated by the ATSB

Figure 7: Wheel damage (all four wheels displayed similar damage)

Figure 7: Wheel damage (all four wheels displayed similar damage). Source: ATSB

Source: ATSB

__________

  1. In NSW, Up direction: Towards Sydney, Down direction: Away from Sydney.
  2. Emergency 1: The most severe defect classification as per ARTC’s COP. An Emergency 1 defect is required to be inspected prior to the next train passing and/or repaired before the next train.
  3. Top: Top is the vertical alignment measured for each rail. Top loss refers to a loss of vertical alignment for a length of rail and a top defect refers to top loss which passes a certain threshold within ARTC’s Code of Practice.

Safety analysis

The investigation determined the derailment likely occurred because of a known long twist defect in an area with other known twist defects. The long twist defect had deteriorated at a faster rate than anticipated to a point where it exceeded the tolerance limits specified within the Australian Rail Track Corporation’s (ARTC) Civil Code of Practice (COP). The long twist defect’s increased rate of deterioration was likely due to the known problematic formation in the area.

This section examines the factors which likely contributed to the track deteriorating leading up to the derailment. It also examines the actions taken to manage risk on the network after the train derailed.

Defect identification and prioritisation

ARTC’s COP, specifically Civil Technical Maintenance Plan (TMP) ETE-00-03, requires the routine inspection of its railway infrastructure for track geometry defects. The methods of routine inspection within this plan included, but were not limited, to the use of hi-rail vehicles, track geometry recording car and walking inspections. Track and civil defects could also be identified from reviewing train driver reports, in which case, the affected area would be inspected and verified by maintenance personnel.

Defects identified were then entered into ARTC’s defect management system ‘Ellipse’. The defects were then managed in accordance with the COP.

Track and civil defects were repaired based on the risk they presented and were prioritised. The priority of a defect was determined by considering the size of the defect and the track speed. The classification of priority within ARTC’s COP ranged from ‘Emergency 1’ (E1) which was the highest and ‘Priority 3’ (N) which was the lowest priority. The repair of a defect could be delayed (priority reduced) by the application of a suitable Temporary Speed Restriction (TSR) in accordance with ‘Table 5.5 – Section 5’ of the COP. It must be noted that in some cases, a TSR may not be an effective risk control and a more stringent maintenance response should be considered. This is dependent on the nature of a defect and the track’s characteristics which may contribute to further deterioration. The following was stipulated in ARTC’s COP:

The responses defined in Table 5.5 are based on isolated geometric defects. A more stringent response than that mandated by the geometry alone may be necessary if deterioration of the infrastructure both at the defect and on adjoining track is in evidence.

Track maintenance history

On 20 May 2015, ARTC identified a P3 long twist defect at 314.550 km through a routine hi-rail inspection. Subsequently, on 27 May 2015, a track formation failure was recorded in the vicinity of the defect. As a result of this, a geotechnical inspection was scheduled and the track was tamped[8] on 17 June 2015.

The geotechnical inspection was completed on 21 July 2015 by an ARTC geotechnical engineer. The inspection identified a weakened formation which was heaving towards the Up cess[9] (see Figure 10). As an outcome, the geotechnical engineer recommended the track formation be reconditioned. This work was scheduled to be completed in the 2017/2018 Annual Maintenance Plan (AMP).

As a temporary solution to address the formation problem, the geotechnical engineer recommended the installation of a shear key[10] at the most affected area ‘314.510 – 314.535’. Its purpose was to improve drainage and strengthen the formation. This was installed on 21 August 2015.

On 12 September 2015, a routine track geometry recording car inspection identified a P1 long twist defect and top loss in both rails in the vicinity of the shear key at 314.523 km (see Figure 8). The track was again tamped and the defects were repaired on 7 October 2015.

On 12 January 2016, the driver of loaded coal train UL112 reported “rough riding” at approximately 314.500 km. Train UL112 was travelling at 50 km/h (35 km/h below the maximum allowable speed). The driver recommended a TSR of 40 km/h through the area. The track was assessed by ARTC and a P2 top defect was entered into their defect management system (Ellipse). A 40 km/h TSR was then imposed extending from 314.450 km to 314.600 km.

On 14 January 2016, a scheduled track geometry recording car inspection through the area identified the following (see Figure 9):

  • Top loss on both the Up and Down rail between 314.450 km – 314.550 km
  • An Emergency 1 short twist defect at 314.544 km
  • Two Emergency 1 long twist defects at 314.504 km and 314.546 km
  • A Priority 1 short twist defect at 314.499 km
  • A Priority 1 long twist defect at 314.513 km.

In response to the defects identified by the track geometry car, the 40 km/h TSR was reduced further to 20 km/h. The application of the 20 km/h TSR was in accordance with Section 5 - Table 5.5 of ARTC’s COP and hence reduced the defective area’s repair priority. The area was scheduled to be tamped (realigned) on 20 January 2016 to repair the identified defects.

On 15 January 2016, the crew of loaded coal train, UL234, called network control and reported that their train had experienced substantial lean as it passed through the affected area at 20 km/h. ARTC responded to this by inspecting the track and observed an empty coal train pass through the area at 20 km/h. ARTC maintenance personnel did not record any issues and certified the track for the existing 20 km/h speed restriction.

On 19 January 2016, the defective area had deteriorated to a point where the 64th wagon of train WG713 likely could not negotiate the defective area and derailed then re-railed at the Rosemount Rd level crossing (see Figure 6).

Figure 8: Track geometry recording car’s graph 12 September 2015

Figure 8: Track geometry recording car’s graph 12 September 2015. Source: ARTC (Annotated by the ATSB)

Source: ARTC (Annotated by the ATSB)

Figure 9: Track geometry recording car’s graph 14 January 2016

Figure 9: Track geometry recording car’s graph 14 January 2016.  Source: ARTC (Annotated by the ATSB)

Source: ARTC (Annotated by the ATSB)

Track infrastructure and maintenance analysis

Track formation

The track at the incident location was built on a low height fill embankment which levelled out in the Up direction. The formation comprised of sandy gravelly clay (fill) which was overlying a firm to stiff clay subgrade[11]. The track was built many years ago and ARTC data suggests that the capping layer[12] was built with a grade towards the Up cess so that rainfall onto the track would be directed to the Up side cess drain. This grade would have assisted in directing water away from the formation and reduced the likelihood of formation problems as a result of water ingress. The capping layer would have also protected the track from the migration of fines from the formation which could lead to ballast fouling which could affect drainage and stability.

The ARTC geotechnical inspection following the formation failure in May 2015 identified:

  • Variable ballast and capping layer depths
  • Perched water at the ballast level
  • Ballast fouling, likely due to fines migrating up from the formation
  • Softened subgrade due to water penetration
  • Cess heave on the Up-side of the track.

ARTC determined that the formation failure was due to a ballast pocket which had developed due to cumulative plastic strain[13]. It is likely that this was caused over time because of cyclic loading from normal train operations.

The ballast pocket would have prohibited water from draining away from the track as intended which likely contributed to the formation becoming saturated. This likely provided an environment for localised formation displacement under train loading (cumulative shear failure). As a consequence of this, it is likely that the formation displaced to a point where it was observed as heaving towards the Up cess which was identified by ARTC maintenance personnel on 20 May 2015 (see Figure 10).

Track geometry defects are typically associated with ballast pockets. The track geometry can be temporarily repaired by track tamping to keep the line operational, however the defects will continue to reappear overtime until the underlying formation problem is rectified.

As a result of the geotechnical inspection completed by ARTC, the following was recommended by the geotechnical engineer:

A long-term solution to recondition the area by removing track panels, replacing the soft formation and restablishing the capping layer/ballast depths

A short-term solution by installing a shear key which would remove the softened formation adjacent to the track and replace it with a stronger backfill.

As mentioned in the previous section, a shear key was installed in August 2015 as a temporary solution to the formation problem and track reconditioning was included into the 2017/2018 AMP.

Figure 10: Image depicting a ballast pocket caused by cumulative shear failure

Figure 10: Image depicting a ballast pocket caused by cumulative shear failure. Source: ARTC (Annotated by the ATSB)

Source: ARTC, annotated by the ATSB

Track drainage

Water entering the formation likely comprised of overland flows from slightly elevated terrain (up slopes) from the north and northwest. The incident location was also within a ‘sag point’. A sag point is the low point between two uphill gradients. Sag points are known to be more susceptible to water pooling than other locations due to the capture of water between the adjacent descending gradients.

A cess drain was observed on the Up-side of the track. The cess drain was likely designed to direct water to an open drain adjacent to the Up-side culvert at 314.450 km. The culvert was likely designed to direct water from the Up side open drain to a connected open drain on the Down side. The culvert consisted of three 600-mm reinforced concrete pipes laid under the track from the Up side to the Down side. The Down-side open drain likely directed water away from the track (see Figure 11).

The ATSB observed that the Up-side cess drain was shallow and had a relatively flat gradient. Vegetation was also observed in both the Up and Down open drains, as well as the Up-side cess drain. The ATSB determined that the vegetation in the Up-side cess drain, its level gradient and shallow depth likely restricted drainage in rainy periods from the up slopes.

The Bureau of Meteorology (BOM) recorded 49.4 mm of rainfall at the Muswellbrook Lindisfarne metereological station over two days, on 14 and 15 January 2016, four days before the derailment. The recorded rainfall was approximately 10 km away from Denman. This rainfall combined with the track’s less than effective drainage and existing ballast pocket, likely contributed to further water entering the formation before the derailment. This may have increased the track’s susceptibility to displace and deteriorate at a faster rate under train loading.

Figure 11: Drainage at incident location, orange arrows showing the expected flow of water

Figure 11: Drainage at incident location, orange arrows showing the expected flow of water. Source: Google Earth, annotated by the ATSB

Source: Google Earth, annotated by the ATSB

Shear key

The geotechnical engineer recommended that a shear key be installed between 314.510 km and 314.535 km to strengthen the formation which had experienced the failure. The scope of work was to include; digging a trench by excavating soft formation adjacent to the Up side of the track and backfilling the trench with an aggregate material. The geotechnical engineer recommended the following specifications for the shear key:

The shear key be 25 m long extending from 314.510 km to 314.535 km (area of heave)

The width be at least 1.2 times the depth excavated

The backfill be angular, clean, free-draining material with a wet strength of 100 kN

The backfill material have an aggregate size between 100 mm and 250 mm (large aggregate gabion rock)

Deepening of the cess in front of the shear key (Up-side cess)

Including one 300-mm-wide cross-drain on the country end of the shear key at a depth of at least 200 mm below the ballast pocket.

Extending the cross-drain to the Down rail at a grade of 1 in 20 sloping down to the deepened Up-side cess drain.

ARTC advised that the shear key was installed on 21 August 2015 and was 25 m long, 1.2 m deep and 1.2 m wide. The backfill material used was clean, angular gabion rock of an aggregate size between 100 and 250 mm and no geo-fabric was used (see Figure 12).

Figure 12: Shear key construction at Denman

Figure 12: Shear key construction at Denman. Source: ARTC

Source: ARTC

The ATSB found that the actual shear key width was 20% less than the recommended width specified by the geotechnical engineer. This meant that the shear strength of the shear key would have been lower than what was specified by the geotechnical engineer. It was also identified that a cross-drain was not installed as per the geotechnical engineer’s recommendation.

The absence of the specified cross-drain would have contributed to unwanted water entering the shear key and formation adjacent to the track. This likely assisted further displacement of the formation under train loading after its installation.

The use of large aggregate gabion rock as a backfill material likely introduced voids between the rock particles adjacent to the track. The absence of a geo-fabric and these voids likely provided a pathway for sludge (soft formation and water) to move into the voids. Without the shear key having any drainage capability, the water was likely trapped and contributed to degrade the track formation over time.

The ATSB determined that removing soft formation adjacent to the ballast pocket and replacing it with a non-cohesive, higher strength backfill likely improved the formations shear strength immediately after installation. However, without the specified drainage, combined with the large aggregate size of the backfill without a geo-fabric, likely contributed to continued formation displacement over time.

The ATSB found that, three weeks after the installation of the shear key, a P1 long twist defect was identified in the vicinity at 314.523 km. This was probably due to soft fill and water moving into the backfill voids causing the track to settle and twist.

The ATSB also found that the shear key’s location was incorrectly recorded at 314.600 km – 314.630 km. The incorrect record of the shear keys location may have contributed to unreliable monitoring of its performance after being installed.

Impact of applied temporary speed restrictions

Speed restrictions are typically applied to reduce the dynamic impacts exerted by trains on existing track defects. These impacts can worsen a track defect and may increase the likelihood of a derailment. Although speed restrictions are applied to protect defects by reducing these dynamic impacts, reducing train speeds in some circumstances can further degrade a defect and/or increase risk of derailment. This is dependent on the nature of the defect and the track characteristics.

A train negotiating through a curve at speed experiences centrifugal force[14]. To prevent a train from becoming unstable as a result of this force, superelevation is designed into a curve. Superelevation is a difference in height between two rails, with the higher rail being the outer rail. This height difference assists in balancing the effect of centrifugal and gravitational forces exerted on the track.

Centrifugal force is a function of train speed, mass and a curve’s radius. A higher anticipated centrifugal force will require a higher superelevation design to mitigate its effects. Reducing the speed of a train on superelevated track can therefore transfer a greater proportion of the train’s mass onto the low rail and overload it. This can also reduce the force applied onto the higher rail increasing the risk of high-rail wheel climb.

A transition is designed between tangent and curved track. This is a gradual uniform change in superelevation and curvature. A transition prevents a train from becoming unstable due to a sudden change in direction. The superelevation within a transition increases to a maximum as it approaches a curve and reduces as it approaches a straight section of track.

The derailment occurred approximately five metres after the transition (highest superelevation in the curve) for a 600 m radius curve in an area with a known problematic formation (see Figure 6). The normal line speed at the incident location was 85 km/h for freight trains and 110 km/h for passenger trains. A TSR of 40 km/h was imposed on 12 January 2016 due to an identified top defect and two days later, the track geometery recording car identified five twist defects in the area. This deterioration was likely a result of the track settling due to a displaced formation.

As a response to the identified defects, ARTC reduced the speed at the location further to 20 km/h. The 20 km/h speed restriction reduced the defect priorities and hence extended their repair times as per ARTC’s COP. 132 trains passed over the defective area between the time that the 20 km/h TSR was imposed before the derailment.

Considering the frequency of trains through the area, high axle loads (loaded coal trains) and that the track was superelevated, the 20 km/h TSR likely exposed the low rail (Up rail) to an unintended increase in cyclic load. This loading condition on the Up side combined with the weakened formation, probably contributed to further degradation of the already existing twist defects.

One day after the application of the 20 km/h TSR, a loaded coal train reported “substantial lean” while passing through the affected area. This should have indicated that the TSR may not have been an appropriate maintenance response for the location considering it was superelevated and had a weakened formation.

As a response to the driver’s report, maintenance personnel inspected the track and observed an empty coal train pass over the affected area. Maintenance personnel reported no problems and certified the track for the existing 20 km/h TSR in place. It is likely that the empty coal train observed to pass over the defective area would not have provided a reflection of the track condition under fully loaded conditions. The loaded coal train wheels would have likely depressed the low rail more than the unloaded coal train.

The largest defect recorded at the incident location after WG713 derailed on 19 January 2016 was a 77-mm-long twist defect (high superelevation). The defect’s size was outside the tolerance limit within ARTC’s COP for any speed and was determined to be the likely contributing factor to the derailment.

Incident management

Train WG713 had travelled for approximately 70 minutes between the time the NCO was alerted to a signal failure and the time the signal electrician confirmed track damage. The signal electrician formed the opinion that the track damage was as a result of train WG713 dragging equipment.

The NCO was in contact with the two trains travelling in the opposite direction to WG713, however did not request the train crews to report on the track condition between Denman and Wilpinjong. Track damage between Denman and Wilpinjong may have increased the two trains’ operating risk if WG713 was indeed dragging equipment.

With the exception of the above, the ATSB determined that the affected area was adequately protected and train movements in approach to Denman were adequately managed after the derailment.

TSR procedure compliance

ARTC’s TSR procedure requires a Speed Restriction Notification Form PP163F-01 be completed by the local maintenance depot. This form was required to be sent to train control to allow the track speed database to be updated. The track speed database provides all NCOs with TSR information so that they can communicate accurate data to rolling stock operators. Without this database being updated correctly, train drivers would rely on speed boards for speed limit information only.

This form was completed on 13 January 2016 for the 40 km/h TSR imposed on 12 January. However, it was not updated for the 20 km/h TSR imposed on 14 January. This meant that while the correct speed (20 km/h) was displayed on track, the higher (40 km/h) TSR was still recorded on the track speed database.

The wayside monitor located approximately 75 m from the POM recorded the speeds of all passing trains. It was found that train WG713 complied with the 20 km/h TSR. This was also verified by examining the locomotive’s on-board data loggers.

Of the 132 trains passing the location, 11 exceeded the 20 km/h TSR with six of the exceedances being over 40 km/h. Three of these trains exceeded 60 km/h with the highest recorded speed being 65 km/h on 18 January.

It was evident that speed boards alone were not reliable in managing the application of the TSRs. An updated database would have provided additional information to NCOs and train drivers for the required speed for that section.

The train speed exceedances likely exposed the track to dynamic forces which may have contributed to the defective area deteriorating at a faster rate and increased the risk of a derailment at a higher speed.

Train management

Train WG713’s speed was managed appropriately on approach to and through the TSR. Due to the uphill grade, locomotive power was applied continuously after the initial speed reduction for the TSR. The power applied likely induced tensile draft forces which assisted in re-railing the derailed wagon at the level crossing. It was found that the driver’s actions did not contribute to the incident and that the uphill grade ahead of the Rosemount Rd level crossing likely mitigated the consequence of the derailment.

Incident wagon

The incident wagon, RHCH 7293A was transported to Pacific National’s One Spot maintenance facility at Newcastle for inspection and testing. A twist test was conducted on the incident wagon and no defects were recorded. The ATSB concluded that it is likely that the wagon did not contribute to the derailment.

__________

  1. Tamping is the process by which the rails are lifted by a track machine called a tamper and ballast is packed underneath the reails to restore track alignment.
  2. The cess is the area along either side of a railway track; the Up cess is the area alongside the UP rail and the Down cess is the area alongside the Down rail.
  3. A shear key is an earth-retaining structure which in this case was a trench adjacent to the track filled with gabion rock (see Figure 12).
  4. Subgrade: The native soil which forms part of the track formation
  5. Capping layer: A well-compacted layer of fine aggregate material (sand or gravel) which sits above the formation. It prevents water from penetrating the formation and prevents the migrations of fines up into the ballast.
  6. Plastic Strain: Strain induced by load which causes irreversible deformation of the formation
  7. Centrifugal force: A force which acts on a body which is moving in a circular path and is directed away from the centre around which the body is moving.

Findings

From the evidence available, the following findings are made with respect to the derailment of empty coal train WG713 at Denman NSW on 19 January 2016. These findings should not be read as apportioning blame or liability to any particular organisation or individual.

Safety issues, or system problems are highlighted in bold to emphasise their importance. A safety issue is an event or condition that increases safety risk and (a) can reasonably be regarded as having the potential to adversely affect the safety of future operations, and (b) is a characteristic of an organisation or a system, rather than a characteristic of a specific individual, or characteristic of an operating environment at a specific point in time.

Contributing factors

The investigation determined that the following factors likely contributed to the derailment:

  • A known long twist defect in an area with other known twist defects which deteriorated at a faster rate than anticipated.
  • The deterioration rate in the area was due to a known degraded formation between 314.450 km and 314.550 km.
  • The location did not have adequate surface drainage which likely contributed to formation degradation over time. [Safety Issue]
  • The shear key was not installed in accordance with the geotechnical engineer’s specification with respect to the following: a) It did not include a cross-drain b) Its actual width was less than the specified width. [Safety Issue]
  • A more stringent maintenance response than that for an isolated track geometry defect was not considered or implemented in accordance with ARTC’s COP. A more stringent maintenance response should have been considered given the degraded formation and the track’s rapid deterioration between 12-14 January 2016, two days prior to the derailment. [Safety Issue]
  • The application of a 20 km/h TSR on superelevated track likely distributed train loads onto the lower rail which exposed it to an unintended increase in cyclic load. This loading condition likely contributed to deteriorating the already existing twist defects.

Other factors that increased risk

  • The actual location of the shear key was incorrectly recorded. This may have contributed to unreliable monitoring of its performance.
  • 49.4 mm of rainfall during the four days before the derailment likely softened the formation and may have made it prone to further displacement.

Safety issues and actions

Depending on the level of risk of the safety issue, the extent of corrective action taken by the relevant organisation, or the desirability of directing a broad safety message to the rail industry, the ATSB may issue safety recommendations or safety advisory notices as part of the final report

Surface drainage in areas with degraded formations

Safety issue number: RO-2016-001-SI-02

Safety issue description: The location did not have adequate surface drainage which likely contributed to formation degradation over time.

Shear key installation

Safety issue: RO-2016-001-SI-01

Safety issue description: The shear key was not installed in accordance with the geotechnical engineer’s specification with respect to the following:

a) It did not include a cross-drain.

b) Its width was less than the specified width.

Maintenance response to recurring track defects in areas with a degraded formation

Safety issue: RO-2016-001-SI-03

Safety issue description: A more stringent maintenance response than that for an isolated track geometry defect was not considered or implemented in accordance with ARTC’s COP. A more stringent maintenance response should have been considered given the degraded formation and the track’s rapid deterioration between 12-14 January 2016, two days prior to the derailment.

Additional safety action

Whether or not the ATSB identifies safety issues in the course of an investigation, relevant organisations may proactively initiate safety action in order to reduce their safety risk.

Sources and submissions

Sources of information

The sources of information during the investigation included:

  • The Australian Rail Track Corporation Ltd.
  • Pacific National Pty Ltd.

Purpose of safety investigations

The objective of a safety investigation is to enhance transport safety. This is done through:

  • identifying safety issues and facilitating safety action to address those issues
  • providing information about occurrences and their associated safety factors to facilitate learning within the transport industry.

It is not a function of the ATSB to apportion blame or provide a means for determining liability. At the same time, an investigation report must include factual material of sufficient weight to support the analysis and findings. At all times the ATSB endeavours to balance the use of material that could imply adverse comment with the need to properly explain what happened, and why, in a fair and unbiased manner. The ATSB does not investigate for the purpose of taking administrative, regulatory or criminal action.

Terminology

An explanation of terminology used in ATSB investigation reports is available here. This includes terms such as occurrence, contributing factor, other factor that increased risk, and safety issue.

Publishing information 

Released in accordance with section 25 of the Transport Safety Investigation Act 2003

Published by: Australian Transport Safety Bureau

© Commonwealth of Australia 2019

image_5.png

Ownership of intellectual property rights in this publication

Unless otherwise noted, copyright (and any other intellectual property rights, if any) in this report publication is owned by the Commonwealth of Australia.

Creative Commons licence

With the exception of the Coat of Arms, ATSB logo, and photos and graphics in which a third party holds copyright, this publication is licensed under a Creative Commons Attribution 3.0 Australia licence.

Creative Commons Attribution 3.0 Australia Licence is a standard form licence agreement that allows you to copy, distribute, transmit and adapt this publication provided that you attribute the work.

The ATSB’s preference is that you attribute this publication (and any material sourced from it) using the following wording: Source: Australian Transport Safety Bureau

Copyright in material obtained from other agencies, private individuals or organisations, belongs to those agencies, individuals or organisations. Where you wish to use their material, you will need to contact them directly.

Occurrence summary

Investigation number RO-2016-001
Occurrence date 19/01/2016
Location Denman
State New South Wales
Report release date 25/03/2019
Report status Final
Investigation level Systemic
Investigation type Occurrence Investigation
Investigation status Completed
Mode of transport Rail
Rail occurrence category Derailment
Occurrence class Incident
Highest injury level None

Train details

Train operator Pacific National
Train number WG713
Type of operation Bulk coal freight
Departure point Kooragang Coal Terminal, Newcastle, New South Wales
Destination Wilpinjong Mine, New South Wales
Train damage Minor

Collision with terrain involving Robinson R22, VH-NCL, at Newman Airport, Western Australia, on 6 November 2015

Final report

Report release date: 28/01/2016

What happened

On 6 November 2015, the pilot of a Robinson R22 helicopter, registered VH-NCL, prepared to conduct a private flight with one passenger on board, from Newman Airport in Western Australia.

At about 0830 Western Standard Time (WST), the helicopter lifted off to about 10 ft above ground level, and the pilot commenced hover-taxiing. As the helicopter started to move forwards, it encountered a gust of wind from behind and sank rapidly. The helicopter landed heavily, then bounced and rotated rapidly to the right. During the accident sequence, the main rotor blade severed the tail, and the helicopter sustained substantial damage (Figure 1). The pilot and passenger were not injured.

Figure 1: Accident site showing damage to VH-NCL

rId21 Picture 5

Source: Airservices Australia - Aviation Rescue Fire Fighting

Loss of tail rotor effectiveness

Loss of tail rotor effectiveness (LTE) causes a yaw to the right in helicopters with a counter-clockwise rotating main rotor. When operating at airspeeds below 30 kt, a tailwind may result in an uncommanded turn, if the tail rotor is unable to provide adequate thrust to maintain directional control. To reduce the onset of LTE, the United States Federal Aviation Administration (FAA) Helicopter Flying Handbook, advises pilots to:

Avoid tailwinds below an airspeed of 30 knots. If loss of translational lift occurs, it results in an increased power demand and additional anti-torque pressures.

To recover from LTE:

If the rotation cannot be stopped and ground contact is imminent, an autorotation may be the best course of action. Maintain full left pedal until the rotation stops, then adjust to maintain heading.

Aviation Short Investigations Bulletin Issue 46

About this report

Decisions regarding whether to conduct an investigation, and the scope of an investigation, are based on many factors, including the level of safety benefit likely to be obtained from an investigation. For this occurrence, a limited-scope, fact-gathering investigation was conducted in order to produce a short summary report, and allow for greater industry awareness of potential safety issues and possible safety actions.

Publishing information 

Released in accordance with section 25 of the Transport Safety Investigation Act 2003

Published by: Australian Transport Safety Bureau

© Commonwealth of Australia 2016

image_5.png

Ownership of intellectual property rights in this publication

Unless otherwise noted, copyright (and any other intellectual property rights, if any) in this report publication is owned by the Commonwealth of Australia.

Creative Commons licence

With the exception of the Coat of Arms, ATSB logo, and photos and graphics in which a third party holds copyright, this publication is licensed under a Creative Commons Attribution 3.0 Australia licence.

Creative Commons Attribution 3.0 Australia Licence is a standard form licence agreement that allows you to copy, distribute, transmit and adapt this publication provided that you attribute the work.

The ATSB’s preference is that you attribute this publication (and any material sourced from it) using the following wording: Source: Australian Transport Safety Bureau

Copyright in material obtained from other agencies, private individuals or organisations, belongs to those agencies, individuals or organisations. Where you wish to use their material, you will need to contact them directly.


Occurrence summary

Investigation number AO-2015-128
Occurrence date 06/11/2015
Location Newman Airport
State Western Australia
Report release date 28/01/2016
Report status Final
Investigation level Short
Investigation type Occurrence Investigation
Investigation status Completed
Mode of transport Aviation
Aviation occurrence category Collision with terrain
Occurrence class Accident
Highest injury level Minor

Aircraft details

Manufacturer Robinson Helicopter Co
Model R22 Beta
Registration VH-NCL
Serial number 4430
Sector Helicopter
Operation type Private
Departure point Newman, Western Australia
Damage Substantial

Collision with terrain involving Cessna 208 Caravan, VH-WTY, 11 km north-east of Hamilton Island Airport, Queensland, on 28 January 2016

Final report

Report release date: 25/06/2020

Safety summary

What happened

On 28 January 2016, the pilot of a Cessna Aircraft Company C208 Caravan amphibian aircraft, registered VH-WTY, was flying 10 passengers on a charter flight over the Great Barrier Reef, Queensland. Before returning to Hamilton Island, the flight was scheduled to stop for about 90 minutes at Chance Bay, Whitsunday Island, about 11 km north-east of Hamilton Island Airport. During the attempted water landing, the aircraft bounced twice on the water’s surface. The pilot then initiated a go-around and the aircraft bounced a third time. While attempting to climb out of the bay, the aircraft clipped trees and collided with terrain. The pilot and all passengers safely exited the aircraft with minor injuries. The aircraft was destroyed.

What the ATSB found

The ATSB found that the aircraft was flown beyond the aircraft landing area northern boundary before the first bounce off the water. This, combined with the delay in initiating a go-around, reduced the options and margins available for a safe outcome.

The engine operating limitations contained in the float operations pilot operating handbook supplement were also not consistent with other publications and may have influenced the power level applied by the pilot during the go‑around.

What's been done as a result

The float manufacturer-published pilot operating handbook supplement was amended with respect to engine operating limits.The operator advised they have taken action to enhance or update existing procedures and checklists for their float plane operations.

Safety message

Charter seaplane operations present unique challenges, particularly in relation to the water landing environment. Variable sea conditions and the possibility of sharing the landing area with marine vessels and people mean that every landing has the potential to be markedly different.

A go-around is a normal procedure and a safe option whenever landing conditions are not satisfactory. However, it is important to consider aircraft performance and local conditions when planning an escape route, including conducting ‘mental rehearsals’ of standard procedures. In addition, making an early decision to conduct a go-around significantly reduces the associated risk.

VH-WTY at Chance Bay earlier on 28 January 2016

VH-WTY at Chance Bay earlier on 28 January 2016


The occurrence

On 28 January 2016 the pilot of a Cessna Aircraft Company Caravan 208 amphibian aircraft, registered VH-WTY (WTY) was conducting a series of charter flights in the Whitsunday region of Queensland.

The pilot was conducting his third flight of the day when the aircraft departed Hamilton Island Airport at about 1415 Eastern Standard Time[1] with 10 passengers on board. The tour included a scenic flight over the Great Barrier Reef for about 50 minutes before heading to Chance Bay, on the south-east tip of Whitsunday Island, about 11 km north east of Hamilton Island Airport (Figure 1). Following a water landing at Chance Bay, the group was to spend 90 minutes at the beach before a short flight back to Hamilton Island. The tour was originally planned to include a landing at Whitehaven Beach, however wind conditions at the time required the water landing be altered to Chance Bay.

Figure 1: Google Earth overview showing Whitsunday Island location

Figure 1: Google Earth overview showing Whitsunday Island location    Source: Google Earth, modified by the ATSB

Source: Google Earth, modified by the ATSB

Radar surveillance data showed WTY approach Whitsunday Island from the north and conduct an orbit about 2 km north of Whitehaven Beach at about 1510, before heading toward Whitehaven Beach. WTY flew over the southern end of Whitehaven Beach and the strip of land that separates it from Chance Bay. At about 1515, after crossing Chance Bay beach in a southerly direction, WTY descended below radar surveillance for the remainder of the flight.

The pilot advised that he flew WTY over the western end of Chance Bay’s main beach in order to conduct a visual pre-landing check of the bay. The pilot noted the positions of various vessels moored in the bay to determine the best taxi path to the beach. During this fly-over, the pilot also noted the sea state and observed evidence of wind gusts on the water surface. The pilot then initiated a right downwind turn toward the landing area. The approach was from the south with the intent to land in the most suitable location within the designated landing area and then taxi to the beach.

The pilot reported setting up for landing at about 50 ft above the water and then delayed the landing in order to fly through an observed wind gust. Passenger video footage indicated that, during the subsequent landing, WTY bounced three times on the surface of the water (Figure 2). After the second bounce, with WTY getting closer to the beach and terrain, the pilot increased engine power and initiated a go‑around. The third bounce, which occurred almost immediately after the second, was the most pronounced and resulted in the aircraft rebounding about 30 to 50 ft above the water. While increasing power, the pilot perceived that the torque was indicating red, suggesting an over-torque for the selected propeller configuration. Noticing that the climb performance was less than expected with the flaps at 30˚, the pilot stopped increasing power and reduced the flap to 20˚.

As the aircraft climbed straight ahead towards a saddle, climb performance was still below the pilot’s expectations and he assessed that WTY would not clear the terrain. In response, the pilot turned right to avoid the surrounding rising terrain.[2] WTY clipped trees during this turn, before colliding with terrain and coming to rest in dense scrub about 150 m from the eastern end of the main beach, near the top of the ridge. The pilot promptly advised the passengers to exit and move away from the aircraft. Some of the 11 people on board suffered minor injuries but all were able to quickly leave the aircraft. There was no post-impact fire.

Figure 2: Aircraft track toward Chance Bay main beach, showing approximate bounce locations and VH-WTY final position

Figure 2: Aircraft track toward Chance Bay main beach, showing approximate bounce locations and VH-WTY final position    Source – Basemap – State of Queensland, modified by ATSB

Source – Basemap – State of Queensland, modified by ATSB

The aircraft’s fixed emergency beacon self-activated during the collision with terrain and was detected by the Australian Maritime Safety Authority (AMSA), resulting in a search and rescue response being initiated by the Joint Rescue Coordination Centre (JRCC) Australia. The pilot reported also activating his personal locator beacon, however this was not detected by AMSA. In addition, the pilot used the company satellite phone to advise the operator of the occurrence and current status of all on board. At about the same time, several witnesses who were located in Chance Bay made their way to the aircraft before assisting everyone down to the beach. A tourist boat was utilised to transfer the pilot and passengers to Hamilton Island, arriving at about 1600. From there, one passenger was transferred by helicopter to Mackay for further treatment.

__________

  1. Eastern Standard Time (EST): Coordinated Universal Time (UTC) + 10 hours.
  2. The terrain rose to about 30 m at the saddle and about 50 m at the ridge to the east of the bay. More detail in the section titled Chance Bay.

Context

Pilot information

The pilot commenced flying in November 2008, was issued a Private Pilot Licence (Aeroplane) in July 2010 and a Commercial Pilot Licence (Aeroplane) in June 2012. The commercial licence was endorsed with a class rating for single-engine aircraft and design feature endorsements for floatplane,[3] manual propeller pitch control, retractable undercarriage and gas turbine engine. The pilot held a class 1 aviation medical certificate with no restrictions, and also held a valid boat driver’s licence to allow operation as pilot‑in-command of floatplanes, when operated on the water. The pilot commenced flying with the operator in May 2014.

To be a charter pilot on single-pilot, single-engine floatplane aircraft (Beaver and C208 Caravan as operated by the operator), under day VFR operations, the company required a pilot to have the following minimum qualifications and experience:

  • Commercial Pilot Licence(Aeroplane)
  • type or class endorsement
  • minimum of 50 hours on type or equivalent type
  • minimum of 250 water landings.

The pilot had accrued about 1,350 hours of total flying experience, which included 483 water landings across several aircraft types, including the company‑operated Cessna Aircraft Company C208 Caravan (C208 Caravan), and de Havilland Canada DHC‑2 (Beaver). The pilot also flew the company land‑based GippsAero GA8 Airvan.

Table 1 shows the total number of water landings conducted by the pilot in WTY at Whitehaven Beach and Chance Bay, and Table 2 shows the number of water landings conducted by the pilot, in WTY in the last 90 days. In total on the C208 Caravan, the pilot had accrued about 230 hours and 165 water landings.

The pilot advised he had conducted one go-around during line operations. This was carried out about 18 months previously, in the Beaver at Whitehaven Beach. In addition, all of the pilot’s training flights into Chance Bay had been conducted in the Beaver.

Table 1: Pilot-conducted water landings in VH-WTY for Whitehaven Beach and Chance Bay

 Whitehaven BeachChance Bay
Dual (ICUS)340
Solo11714
Total15114

Table 2: Water landings by pilot in VH-WTY in last 90 days. Figures in brackets show water landings conducted in other aircraft types

 November 2015December 2015January 2016Total
Whitehaven Beach18 (2)29 (6)20 (4)67 (12)
Chance Bay51511
Reef / other9 (1)9 (8)9 (8)27 (17)

The pilot had conducted five water landings at Chance Bay during January 2016, all in WTY. This included two landings on 24 January 2016, and one at about 1205 on 28 January 2016, prior to the occurrence landing at about 1515.

The pilot's training records also show a ‘line check proficiency report’, conducted on 13 November 2015, which included water landings at Hardy Reef and Whitehaven Beach. The report identified that this line check was conducted with a ‘light load’. The comments section of the report included the following:

after splash-n-go at Hardy, slow to feed in full PWR once airborne, speeds ok, just need to get the power in faster with heavier loads in confined spaces.

The pilot passed the proficiency check and there was no record of any further training, or dual flights, being conducted.

In summary, at the time of the occurrence, the pilot was suitability qualified and authorised to operate the C208 Caravan in Chance Bay. Drug and post-incident alcohol testing did not identify any substance that could have impaired the pilot’s performance.

Sleep and work history

On the day of the occurrence the pilot woke up at about 0530, and arrived at work at 0645. He undertook three flights totalling 3.3 hours of flying. The occurrence took place at 1515, therefore meaning he had been at work for about 7.5 hours, and awake for about 8.5 hours. The pilot flew for approximately 5 hours the previous day and had two days off prior to that.

The pilot reported that he usually obtained about 8 hours of sleep per night and that he was healthy and not overly-tired at the time of the occurrence. There was no evidence that the pilot was experiencing a level of fatigue known to affect performance at the time of the accident.

Operator information

The operator had been the sole general aviation service provider for the privately owned Hamilton Island Resort since June 2010. They operated a fleet of 16 aircraft, which included light helicopters and fixed-wing aircraft. Hamilton Island was the main operating base for charter flights and tours to Hayman Island, Whitsunday Island and the Great Barrier Reef. The Civil Aviation Safety Authority (CASA) issued an air operator’s certificate (AOC) that permitted charter flights and specified aerial work applications.

Civil Aviation Regulation (CAR) 215 Operations manual required an operator to provide an operations manual for the use and guidance of operations personnel. The operator’s operations manual was prepared in accordance with CASA guidelines, was reportedly available to all personnel, and was last updated in 2011. In July 2017, the operator submitted to CASA, and had accepted, a revised operations manual which included a description of a safety management system (SMS) that was to be implemented. There is currently no requirement for a SMS for this type of operation. However, CASA encouraged all operators to develop and maintain an SMS.

Aircraft information

General

VH-WTY (WTY) was an unpressurised, single-engine, high wing, turboprop amphibian aircraft that could accommodate up to 14 people, operated by a minimum crew of one. WTY was manufactured in the United States in 2010 and was powered by one Pratt & Whitney Canada (PWC) PT6A‑114A turboprop engine. The aircraft had Wipaire Inc. (Wipaire) floats fitted on 1 June 2011. WTY was first registered in Australia on 18 July 2011. At the time of the accident, WTY had accumulated about 1,510 hours’ time in service.

A periodic inspection was completed on 27 November 2015 and WTY was issued with a maintenance release that was valid for 12 months or 100 hours. At the time of the accident the maintenance release was current and no defects or endorsements were recorded. The aircraft log book identified that no significant items of maintenance had been carried out since the last periodic inspection. The pilot reported that they had no concerns with aircraft serviceability at the time of the accident and review of the engine data log[4] identified no anomalies.

Engine operating limits

The engine operating limits were published in the Cessna Caravan model 208 G1000 pilot’s operating handbook (POH) and the Wipaire POH supplement[5] for amphibian floatplane operations. The engine was operation-limited by factors including torque, temperature or gas generator revolutions per minute (RPM), as well as propeller RPM, and was determined by whichever limit was reached first. With respect to torque, the maximum was advised to be 1,865 ft-lb. A torque of 1,970 ft-lb was permitted as long as the propeller RPM was set to ensure the maximum-rated 675 shaft horsepower was not exceeded. The Cessna POH torque indications description stated that ‘the redline varies from 1865 to 1970 ft-lb depending on prop RPM’.

Transient limitations for engine parameters including torque, gas generator RPM and propeller RPM are available for periods requiring increased engine performance. Table 3 shows the published transient torque available and its time limitation.

Table 3: Maximum transient torque available and associated time limitations

Manufacturer publicationMaximum torque (ft-lb)Time limitation (seconds)
PWC Maintenance Manual2,40020
Cessna Caravan POH2,40020
Wipaire POH supplement2,2002

While increasing power during the initial stages of the go-around, the pilot recalled that the indicated torque was at the ‘second red line’, which he advised was about 1,970 ft-lb and an over-torque for the propeller condition. A review of the engine data log indicated a recorded maximum torque value of 1,882 ft-lb.

Several Caravan pilots were asked about their understanding of available transient power and all quoted 2,200 ft-lb or 2,400 ft-lb for the time limit of 2 seconds. The occurrence pilot advised that he was aware of the availability of transient torque but could not recall the specific figures. It was reported that while the availability of transient power may have been mentioned during training, it is generally not demonstrated due to increased risk of engine damage. The operator has since included a copy of the flight manual engine limitation section in the daily engine trend record folders in the aircraft, and also in a quick reference guide that included other performance and operational guidance from the flight crew operating manual. The purpose was to serve as memory prompts for pilots on documents frequently handled by them.

The ATSB advised Wipaire of the apparent discrepancy with their POH supplement engine limitations section regarding the transient torque and time available limit. A revised Wipaire POH supplement, with a transient torque of 2,400 ft-lb for 20 seconds, was issued on 22 December 2016, which was in line with the engine manufacturer’s limits. See the section titled Safety issues and actions.

Weight and balance

The occurrence flight was one of several standard tours offered by the operator. Therefore, a typical payload was available for each tour. The available payload considered aircraft basic weight and standard fuel burn for each leg, among other details. The operator advised that passengers reported their weight at the time of booking and this figure was recorded on the flight manifest. A computer program was utilised by the operator to determine the aircraft’s position in the weight and balance envelope for each flight. A review of the operator-supplied data indicated that WTY was within weight and balance limitations at the time of the collision with terrain.

Chance Bay

Chance Bay is located at the south-east point of Whitsunday Island (Figure 1) and is separated from Whitehaven Beach by a strip of land about 1,400 m wide. Whitsunday Craig is about 350 m elevation and is about 2.5 km to the west of the bay. The terrain falls away from Whitsunday Craig over a distance of 1-1.6 km and consists of undulating hills with rock formations near the water surface.

Chance Bay is characterised by surrounding terrain, being semi-circular in shape (Figure 3). The height of the terrain surrounding the bay is generally from about 35 to 80 m. The ridge line (marked in red) varies from about 60 m elevation in the west to about 50 m at the eastern end of the island. The lowest point (saddle) in this ridge line is about 30 m elevation and is located about 280 m inland from the main beach.

Figure 3: Chance Bay overview showing local features and elevations

Figure 3: Chance Bay overview showing local features and elevations    Source: Google Earth, modified by the ATSB

Source: Google Earth, modified by the ATSB

For most of the year the Whitsunday area experiences south-easterly winds and Whitehaven Beach is the preferred tour destination for operators. It was reported that for about 20 per cent of the year, the winds shifted to be predominantly from the north, which produced conditions that are unsuitable for floatplane operations at Whitehaven Beach. During these periods, Chance Bay was the alternative landing area for local operators. Chance Bay was also identified as a preferred marine vessel anchorage in northerly winds.

Aeroplane landing areas

Civil Aviation Regulation 92 (CAR 92) defined the requirements for use of aerodromes, including those which are authorised and registered. Other places, if suitable, may be used for the purposes of the landing and taking-off of aircraft. In all cases, CAR 92 identified the responsibilities of both the pilot in command and the operator and required:

…and, having regard to all the circumstances of the proposed landing or take-off (including the prevailing weather conditions), the aircraft can land at, or take-off from, the place in safety.

CASA also published the Civil Aviation Advisory Publication (CAAP) 92-1 (1) Guidelines for aeroplane landing areas[6] to set out factors that may be used to determine the suitability of a place for the landing and taking-off of aeroplanes.

Chance Bay and Whitehaven Beach were identified as ‘regular aircraft landing areas’ that had been defined in accordance with Schedule 7 of the Great Barrier Reef Marine Park Authority (GBRMPA) – Plan of Management 2008. The operator maintained a company register of its authorised aeroplane landing areas (ALA) for floatplanes, which were approved for use by the chief pilot. Whitehaven Beach and Chance Bay were included in this register and were identified as meeting the ‘minimum standard for a landing area…as specified in CAAP 92-1(1)’. Each operator‑registered ALA consisted of an area map showing the ALA boundary and a written guide detailing operational and other information unique to that ALA.

The ALA was the preferred landing area for each location. However, the operator advised that it was possible to occasionally land outside the ALA. This allowed aircraft to land further from the beach, before the ALA, when location conditions and/or proximity of other vessels required it.

CAAP 92-1(1) provided guidance on various aspects of water alighting areas in terms of water channel width, depth and length. No specific dimensions were provided for the length of a water landing area, however the CAAP indicated that the length of the water channel was to be equal to or greater than that specified in the aeroplane’s flight manual. If the distances in the flight manual were un-factored, with allowance for degradation in aeroplane performance due to the prevailing conditions, then 15 per cent was to be applied to the distance. The CAAP included guidance for the calculation of approach and take-off area obstruction splays, however the supplied diagram only applied to floatplanes up to 2,000 kg maximum take-off weight. Both floatplane types operated by the company were above that weight.

The company operations manual specified that aircraft landing areas and water alighting areas were to comply with the CAAP. In addition, the company operations manual gave consideration to degradation in aircraft performance, in that any take-off distance was to be increased by a factor of 15 per cent and landing distance increased by 43 per cent. When these factors were applied to the C208 Caravan aircraft flight manual data, for operations on float landing gear, the take-off distance required was 1,256 m and the landing distance 926 m.

Operator’s aircraft landing area details

The operator’s ALA register included a map showing details for Chance Bay (refer to Appendix A), which was a marine chart showing bathymetric data for the water areas. Topographical information included 100 m contours and a spot height at the eastern end of Whitehaven Beach. The northern ALA boundary was about 950 m from the beach and the southern boundary, depending on the approach flown, was between 1,500 m and 2,300 m from the beach.

The operator’s published guide for Chance Bay ALA included, in part, the following points:

…

Operations will not take place without prior approval from chief pilot when winds exceed 20 kts[7]

Strong[8] northerly winds will produce severe turbulence and down drafts.

…

Chance Bay can be very difficult to work out of. Ensure you fly over the area before landing. Always observe the ALA limits. Ensure you always allow yourself an escape route…Note: Very important to set up an undershoot approach and plan escape route at this location.

A number of pilots who were interviewed by the ATSB all described the approach into Chance Bay as being a ‘dead end landing’ due to the terrain surrounding the cove. Therefore, the importance of setting up an undershoot approach[9] and to plan an escape route for the location was also reinforced. Further, any decision to go‑around was to be made early.

The operator advised their preferred departure or go-around route was a right turn over water, through the approximately 130 m clearance between the south-eastern most tip of Whitsunday Island and the northern tip of Moon Island (Figure 4). The terrain on either side of this route is less than 20 m above mean sea level. Flying straight ahead, over the saddle, was not the preferred departure path, but it was an option shown to company pilots. If a go-around was initiated early, the right turn departure was the safest option and allowed a water landing in the event of a precautionary or emergency situation. The pilot reported utilising either departure track, as dictated by the conditions at that time. Refer to Appendix B for the Chance Bay ALA containing hand written notes and annotations that were in addition to the company register.

Figure 4: Typical approach path at Chance Bay showing preferred and optional departure and/or go-around path. Also noted is the location of the ALA boundary and the pilot defined decision point.

Figure 4: Typical approach path at Chance Bay showing preferred and optional departure and/or go-around path. Also noted is the location of the ALA boundary and the pilot defined decision point.    Source: Google Earth, modified by the ATSB

Source: Google Earth, modified by the ATSB

The pilot had nominated a decision point (aiming point) for his operations into Chance Bay (refer Figure 4 and Appendix B). This point was devised in conjunction with the company senior floatplane pilot as a line between easily identifiable topographical features, being a point of land below Whitsunday Craig and the southern tip of Moon Island, about 1,500 m from the beach. The pilot described the decision point as, ‘if you’re not happy with what you see in front of you, if you’re not stabilised, you go‑around’.

From the decision point onward, the pilot could not use the preferred departure path to conduct a go‑around (‘preferred departure / go-around’ identified in Figure 4). However, the option to conduct a straight ahead go-around remained, or a turning departure over the terrain to the right of the bay, if initiated early enough to ensure terrain clearance.

A calculation of the climb performance of the C208 Caravan in the go-around configuration revealed that the aircraft was capable of climbing at 800 ft per minute when a straight ahead go‑around was conducted. That climb rate was dependent upon the aircraft being established in the correct configuration.[10] The point at which the aircraft could no longer theoretically out-climb the terrain was almost coincident with the shoreline. Therefore, in practical terms, to provide an adequate margin above terrain, an aircraft conducting a straight ahead go‑around would have to be established in the climb configuration before that point.

In summary, the ALA, as defined in the operations manual, was appropriate for conducting operations in the Caravan, when adhering to the ALA boundaries, nominated decision point and escape routes. Company guidance indicated that operations could be conducted outside of the ALA when operationally required, however the operator’s preference was to land further away from the beach and undertake a longer taxi into the bay, rather than landing between the ALA and the beach.

Guidance material from international regulators

When landing at an airport, the pilot can expect the runway surface will be flat and free of obstacles. In contrast, the United States Federal Aviation Administration (FAA) published a Seaplane, Skiplane, and Float/Ski equipped Helicopter Operations Handbook (2004),[11] which stated that water landings have no defined runway and are subject to wind and sea state affecting the landing surface. It is also common for floatplane pilots to share their landing areas with marine vessels and people.

The Civil Aviation Authority of New Zealand[12] published the Takeoff and Landing Performance booklet, which detailed factors that affect aircraft performance and included the following advice:

  • plan to clear obstacles on the climbout path by at least 50 ft
  • always nominate a decision point where you will discontinue the approach if things are not going as expected
  • even after having worked out your aircraft's take-off or landing performance, it is prudent to add a contingency to allow for other factors that you may have overlooked.

The United Kingdom Civil Aviation Authority (UKCAA)[13] published the Civil Aviation Publication (CAP) 793 Safe operating practices at unlicenced aerodromes. This CAP highlighted the importance of the pilot being ‘well aware of the performance characteristics of their aircraft and the aerodrome dimensions’ and that their ‘operating practices should be appropriate and proportionate to the activity’. In addition, the UKCAA published a Safety Sense Leaflet series which included guidance for strip flying and aeroplane performance. These leaflets included recommendations to:

  • use maps to determine accurate elevations
  • check the strip is long enough and add a 30 per cent margin for safety
  • remember that aeroplane performance figures are obtained using a new aeroplane, flown by an expert pilot under specific conditions
  • be clear about your go / no go decision process
  • consider surrounding terrain—if there are hills nearby, check that you will have a rate or angle of climb sufficient to out-climb terrain. Even a moderate wind may cause significant down draughts.

In combination, the guidance material recommended that a pilot should examine their intended landing area thoroughly before landing. This allows the pilot to choose the best landing area and plan a safe, conservative path for a go-around should the landing need to be aborted. The landing area should also include a predetermined ‘aiming point’ to assist with the decision to commit to land or initiate a go-around. In this case, the ALAs published in the company register defined the boundary only.

Recorded engine and video data

Data was recovered from the on-board digital data acquisition system, which received information directly from a Garmin G1000.[14] This system recorded a number of different engine operating parameters along with airspeed, altitude and temperature. The data was extracted and validated by the engine manufacturer.

The propeller speed and gas generator (engine) speed data was analysed in conjunction with video footage from several of the passengers. From this data it was possible to plot the flight path in relation to the landing area and bounce locations (Figure 2).

The data from the engine logger correlated with the video evidence and indicated that the established approach path aimed for an initial touchdown beyond the northern boundary of the ALA, leading to the pilot overflying the ALA before the aircraft touched down. Airspeed data showed that the aircraft was operating close to the stall speed when the go‑around commenced, and that the airspeed did not significantly increase, or reach the airspeed for the optimal go‑around climb configuration, before the aircraft impacted terrain.

Operational information

Go-around

Whenever landing conditions are not satisfactory, a go-around should be initiated.[15] The pilot can then bring the aircraft around for another landing or continue to an alternate site. A go-around is also known as a balked landing and can be initiated either before or after an aircraft has touched the water (in this case). A go‑around is considered a normal procedure and, although it is not often required, with appropriate training, planning and preparation it should not result in increased risk.

The company operations manual required that pilots adhere to the manufacturer’s POH, any associated supplements and the CASA-approved company checklists for normal and emergency procedures. The aircraft checklists included the abbreviated normal procedures published in booklet form and a control wheel flip card, and were required to be carried on every flight. In addition, the operations manual required pilots to demonstrate proficiency in recall of the checklists at no less than 12-month intervals.

The operations manual procedures for take-off stated ‘all water take-offs shall be with 20˚ flap set’. The manual recommended initial climb speeds were 80 kt for flaps 20°, 85 kt for flaps 10° and 95 kt for flaps retracted. The procedures for a balked landing were contained within the normal procedures and operations sections of the manual. It outlined that the aircraft needed to achieve an indicated airspeed of 81 kt in the climb out.

Consistent with the Wipaire POH supplement, the operator’s procedure for a baulked landing commenced with flaps 30 (as configured for landing) and throttle advanced to take-off power. The following step in the checklist was to retract the flaps to 20 degrees to achieve the maximum rate of climb.

Meteorological information

Hamilton Island area

Hamilton Island is part of the Whitsunday Islands archipelago and is located approximately 900 km north of Brisbane. The weather is classified as subtropical with year-round warm temperatures averaging 23˚C in winter and 30˚C in summer. The wet season occurs typically December to February with humid days, averaging around 75 per cent, which are often broken by tropical showers.

Weather conditions and wind velocity

The Bureau of Meteorology (BoM) forecast for the area indicated the presence of variable north-westerly winds, up to 5,000 ft, of about 10 kt. Information from the radiosonde trace from Townsville and the marine forecast indicated that the surface winds were about 10 kt from the north-north-east. BoM observations at Hamilton Island between 1500 and 1530 indicated a wind of about 14 kt from the north-west.

The BoM advised there are local effects at Hamilton Island Airport which can affect velocity in the synoptic situation that was present on the day. The BoM advised that the wind direction at Chance Bay at the time of the occurrence was likely to have been about 10 kt from the north‑west. In addition, BoM indicated that it was unlikely that turbulence due to the nearby terrain would have been present at Chance Bay due to the wind strength in the lowest part of the atmosphere. However, light turbulence could not be excluded.

Witnesses positioned on marine vessels in Chance Bay reported north-west variable winds of about 10 kt, gusting to 15 kt. They described the sea surface as ‘smooth’.

The pilot reported observing, during the pre-landing flyover, evidence of ‘bullets’ coming from the north-west on the surface of the water within Chance Bay. Bullets were described by several pilots as a phenomena associated with wind gusts contacting the water surface and creating visually darker patches. Riley (2009) indicated that these phenomena result from a combination of terrain and atmospheric conditions, including:

  • winds, of 15 kt or greater, predominantly blowing from the south-east over water then encountering the terrain of the Whitsunday Islands and being forced aloft
  • an inversion between about 500 to 2,000 m in a stable atmosphere.

The combination of the inversion and stability of the atmosphere compresses the airflow and increases its velocity. The stability of the atmosphere forces the air to descend on the leeward side of the terrain. When the increased velocity air encounters the sea surface it forms the bullets, which poses problems to mariners and to aircraft operating on the water.

The BoM report indicated that, while there was an inversion layer present at approximately 1,500 m, the 10 kt wind velocity was below that expected for the formation of bullets. Additionally, according to the Beaufort wind scale, for whitecaps to appear the wind must be 11-16 kt. FAA H‑8083-23 Seaplane Operations Handbook indicated that ‘when the wind increases to a velocity of 12 knots, waves will no longer maintain smooth curves. The waves will break at their crest and create foam – whitecaps’.

Several pilots with experience operating in Chance Bay advised that the area can be affected by turbulence and/or down drafts.[16] This turbulence most likely resulted from Whitsunday Craig being in the path of west to north‑westerly winds and the airflow ‘wrapping around’ the southern coast of the island. In addition, it was reported the turbulent air became more pronounced as you proceeded further into the bay. The pilots advised that these conditions reduced the approach and departure options and necessitated the adjustment of procedures to suit different aircraft performance.

In summary, while accurate weather observations for Chance Bay were not available, witness videos showed some areas of possible wind gusts, with the appearance of darker patches of water on the surface. In these patches, no lifting of water and almost no whitecaps are seen, indicating wind at or below 12 kt. Wind direction on the day was consistent with possible turbulence, the severity being dependent on the wind velocity. The pilot reported the conditions on this flight were similar to those of earlier in the day, with perhaps a slight increase in wind velocity. The pilot also advised that he had previously conducted operations in Chance Bay in windier conditions.

Wind gusts and aircraft handling

Several floatplane pilots (including a flight instructor) advised of the importance of flying through a wind gust and landing the aircraft on the water when in smoother air. It was also reported that a pilot should avoid rushing to land before a wind gust.

The accident pilot described his understanding of the standard procedure when encountering a gust, which included:

  • reducing power by a small amount to counter the increased lift associated with entering the wind gust, then
  • increasing the power to control aircraft descent resulting from the reduced lift when exiting the wind gust.

This procedure is the correct technique for flying the DHC-2 Beaver aircraft. However, a flight instructor indicated that the use of power to counter the effects of winds gusts on landing in the C208 Caravan was not appropriate due to the increased mass of the aircraft, and had advised the pilot of this during initial C208 Caravan training, when this incorrect technique had been observed. It was reported that best practice for flying through a gust in a Caravan is through manipulation of the flight controls rather than increasing or decreasing power, which has a slower response time.

The pilot indicated that he elected to delay the landing, in order to fly through the wind gust, and used the alternating power technique previously mentioned. After exiting the first gust, the pilot observed a second wind gust, and delayed the landing further, using the same alternating power technique.

The recorded engine data was inconsistent with the pilot’s report of altering engine power as he flew through wind gusts. It was not possible to determine the level of influence of the reported wind gusts had on the aircraft bounces, or if general aircraft handling technique contributed in this instance.

Site and wreckage

The ATSB did not attend the accident site but did interview the pilot, the operator, several witnesses, passengers and accident site visitors. In addition, the ATSB reviewed supplied images and video footage. Video footage from the flight and information from the pilot did not indicate any issues with aircraft operation prior to the collision with terrain. However, video footage and engine data were consistent with the engine not having been fully shut down before the pilot exited the aircraft.

WTY collided with trees and then the terrain, part-way up the ridge about 150 m from the eastern end of Chance Bay main beach. WTY was located at an elevation of about 40 m and the height of the ridge was about 50 m. The aircraft came to rest upright and in dense foliage (Figure 5). WTY was described as being oriented facing back toward the bay, which was consistent with the aircraft being in a right turn and the flight path being disrupted during the collision with terrain. The pilot reported there was no evidence of fuel leak and there was no pre- or post‑impact fire.

The float landing gear (pontoons) had splayed outwards and upwards until they were aligned with the fuselage, which, together with the nature of the foliage, may have provided some cushioning effect to the fuselage during the impact with terrain. Both wings remained attached to the fuselage, but the impact sequence had forced the wings rearwards. As a result, the flaps and the trailing edge of both wing root ends had entered the cabin, however there were no reports of passenger injuries associated with this. The position of the flaps was consistent with being fully-extended (30˚), which corresponded with an image of the flight control pedestal showing the flap selector lever near to ‘full’.

It was reported that the pilot’s door (forward left) was utilised for evacuation, as exit via the rear cabin left passenger door was hindered by foliage. One passenger also reported a drop of a few feet, from the pontoon to the ground, due to the aircraft position on top of foliage. Egress to the ground was via the pontoon and then all persons on board assembled a short distance from the aircraft before the group walked to Chance Bay main beach.

Figure 5: VH-WTY wreckage, located in dense foliage

Figure 5: VH-WTY wreckage, located in dense foliage    Source: Gordon Simmons

Source: Gordon Simmons

Survivability

Civil Aviation Order (CAO) 20.11 defined the requirements for emergency and life-saving equipment and passenger control in emergencies. The below paragraphs review the CAO requirements relevant to this operation and the overall emergency response.

Forced landing preparation

Pre-impact actions have the potential to reduce the severity of a collision with terrain. The operator’s published pre-impact actions included, but were not limited to:

  • activating the emergency locator transmitter (ELT)[17]
  • briefing passengers, including their requirement to adopt the brace position
  • configuring the aircraft and engine, including turning off fuel selector and battery master switch, among other actions
  • transmitting a mayday call giving position and intentions.

The pilot reported that the requirement for a forced landing was not considered during the go‑around attempt.

Briefing

The operator advised that passengers were shown a generic briefing video on the bus, while being transferred to the airport. If passengers made their own way to the airport, then a briefing video was shown to them upon their arrival.

The pilot provided a safety briefing to the passengers at the aircraft, just prior to departure from Hamilton Island. This briefing was specific to the aircraft type.

Seatbelts

The aircraft was fitted with lap-sash seatbelts in the passenger seats and five-point harnesses in the pilot and co-pilot seats. The pilot explained the seat belt operation to the passengers, and the requirement to keep them fastened for the duration of the flight, prior to boarding the aircraft. Additionally, the pilot reported visually checking the passengers’ seat belts prior to departure from Hamilton Island. Video footage of several passengers, from just prior to take-off, showed their seatbelts were fastened. In addition, audio from the footage included the pilot advising them to keep seatbelts fastened.

While flying over Chance Bay and setting up for landing, the pilot reminded the passengers to make sure their seatbelts were fastened for landing. Some of the passengers interviewed also recalled the pilot advising them to check their seatbelts prior to the landing at Chance Bay.

The United States’ National Transportation Safety Board (NTSB) published safety report SR 85-01 General aviation crashworthiness project: Phase 2 - Impact Severity and Potential Injury Prevention in General Aviation Accidents. In terms of the potential benefits of shoulder harnesses (specifically, some form of upper body restraint), the safety report commented on the extent of any injuries in case of an accident, as follows:

There were five survivable accidents in which shoulder harnesses were worn by only one of two front‑seat occupants. A comparison was made of the relative injuries of each occupant. It was found in each case that injury severity was less for the occupant who wore the shoulder harness.

For example, in one accident each of two occupants sustained serious injuries, but the pilot, wearing a shoulder harness, sustained a broken leg and a slight concussion while the passenger without a shoulder harness sustained severe head injuries. The differences in the injuries in these comparisons were related to head and upper body injuries. Those persons who wore shoulder harnesses had markedly fewer head injuries.

The NTSB research also showed that if an aircraft occupant wore a shoulder harness, they increased their chances of survival by 20 per cent. Further, the chance of serious injury was decreased by 32 per cent. The FAA published Advisory Circular (AC) 21-34 Shoulder Harness – Safety Belt Installations in 1993. This AC described the various forms of shoulder harnesses and detailed the safety benefits of correct installation and use. Pilot and passenger survivability on WTY was likely enhanced through correct utilisation of the available seat belts.

Pilot emergency training

The pilot had completed the flight crew emergency procedures training within the previous 12 months, as was required by CAO 20.11. This CAO did not require training and demonstration of aircraft-related procedures such as emergencies and shut down process.

Life jackets

Each passenger was provided with a pouch-style life jacket prior to the flight departing Hamilton Island, as required by the regulations. The pilot provided a safety brief and demonstration on how to wear and use the passenger life jackets. The pilot wore his own vest‑style life jacket, which also contained the pilot’s PLB in a pouch.

Safety equipment

The aircraft was fitted with a fixed ELT, which self-activated during the collision with terrain. In addition, the operator required that each pilot equip themselves with a personal locator beacon (PLB) that was suitable for overwater operations. The pilot reported activating his PLB once everyone had evacuated the aircraft.

There was also a satellite phone on board the aircraft due to the occasional requirement for extended offshore operations. The pilot used this phone to contact the operator and advise of the accident.

Emergency response

The Australian Maritime Safety Authority (AMSA), reported that the aircraft’s ELT beacon was detected at about 1519 and a search and rescue phase was initiated by Australia’s Joint Rescue Coordination Centre (JRCC). In addition, the ELT beacon was detected by several aircraft flying in the area and they advised air traffic control, who subsequently passed the information on to the JRCC at about 1528. The JRCC monitored and coordinated the search and rescue phase. The pilot’s PLB was not detected by the AMSA.

As the ELT was registered, the JRCC’s first attempt to contact the operator was at 1526. It was reported that the operator was initially unsure of the JRCC’s report of ELT activation as the flight following of WTY had been cancelled. At about 1528, the operator advised the JRCC they had dispatched one of their helicopters to Chance Bay. At 1543, the operator advised the JRCC that the pilot had contacted them via the satellite phone.

Several vessels were moored in Chance Bay and those on board who witnessed the accident contacted the local volunteer marine rescue (VMR) via marine radio. The VMR Mackay log indicated they received the first notification at about 1515 and subsequently advised VMR Whitsunday. VMR Mackay monitored the situation until advised that all persons on board the aircraft had arrived at Hamilton Island at about 1616.

Related occurrences

A review of the ATSB occurrence database from 1969 to February 2016 identified only one other aviation occurrence in Chance Bay. This, and other similar occurrences are detailed below.

Operational and decision making occurrences
ATSB investigation 200204857

The pilot of a de Havilland Beaver floatplane registered VH-BVA was conducting a charter positioning flight from Hamilton Island Marina to Chance Bay, Whitsunday Island. He had landed at Chance Bay seven times in the previous two days. Weather conditions recorded at the Hamilton Island automatic weather station indicated a 7 - 10 knot wind from the north‑west. Witnesses in Chance Bay said that the surface wind in the bay was 2 - 5 knots and the water surface was smooth, but not glass. The pilot said that he commenced a straight-in approach to Chance Bay but elected to go‑around due to the increased number of vessels moored in the bay since the previous flight. During the subsequent landing the left wing of the aircraft collided with the rear mast of an anchored ketch resulting in substantial damage to both. There were no injuries to the pilot or the three occupants of the ketch.

The investigation found that the technique employed by the pilot to achieve the intended touchdown was not appropriate for floatplane operations. In response, the operator revised the floatplane operations section of their operations manual. In addition, an experienced floatplane pilot provided a report to the operator regarding company floatplane operations. Recommendations from that report included:

  • additional theoretical and practical training and checking for company floatplane pilots
  • development of a company-specific pilot training guide; and
  • review and amendment as required of the company floatplane authorised landing area guide
ATSB investigation 199802830

On Sunday, 26 July 1998, at about 1324 local time, a Cessna A185E floatplane, VH-HTS, crashed onto a ridge forming the southern shore of Calabash Bay NSW. The accident occurred during a go-around manoeuvre following an unsuccessful landing approach to the Berowra water alighting area. All on board suffered fatal injuries and the aircraft was destroyed.

The investigation found that the circumstances of the accident were consistent with uncontrolled flight into terrain. The decision by the pilot to carry out a go-around into a confined area surrounded by steep-sided terrain was the culminating factor in a combination of local factors, organisational deficiencies and inadequate safety defences. Local factors included a lack of formal procedures to provide safe methods of operation, and commercial pressures. Organisational deficiencies were also identified, concerning the management and conduct of charter operations carried out by that company.

__________

  1. A seaplane is a fixed-wing aircraft that can operate from the water and is identified by two categories: floatplanes, having pontoons or floats as landing gear, and flying boats, where the main source of buoyancy is the fuselage. Amphibian aircraft are capable of routinely operating from land or water. All three terms are often interchanged.
  2. The aircraft was fitted with an Aircraft Data Acquisition System – digital, which monitored and recorded certain engine and airframe data parameters.
  3. The information contained in the POH supplement ‘supplements or supersedes the basic manual in those areas listed’.
  4. Released July 1992 and current at the time of the occurrence.
  5. The operator authorised the pilot to operate in Chance Bay in ‘20-25 kt’ in the Beaver on 19 November 2014 and in the C208 Caravan on 2 September 2015.
  6. The ALA Guide did not clarify the velocity of ‘strong winds’. The Beaufort Wind Scale identified strong as 22-27 kt.
  7. An undershoot approach by an aircraft is one, which if continued to the surface would result in the aircraft landing before the desired touchdown point. Several seaplane pilots described an undershoot approach, in this context, as that which will result in the aircraft descending to just above the water surface and maintaining this position. When nearing the aiming point the pilot can then gently land the aircraft at the first available area of suitable water.
  8. That configuration was: takeoff power, 1,900 propeller RPM, inertial separator normal, climb speed of 79 knots and flaps 30°.
  9. FAA publications can be accessed via www.faa.gov
  10. CAA NZ publications can be accessed via www.caa.govt.nz
  11. UK CAA publications can be accessed via www.caa.co.uk
  12. The Garmin G1000 is an integrated flight instrument system typically composed of two display units, one serving as a primary flight display, and one as a multi-function display. Manufactured by Garmin, it serves as a replacement for most conventional flight instruments and avionics.
  13. ATSB SafetyWatch Handling approach to land details the benefits of standard procedures to reduce workload during critical phases of flight and the importance of an early decision to go around. This can be viewed via www.atsb.gov.au
  14. Downdrafts are described as a bulk downward movement of air such as commonly found on the lee side of a mountain.
  15. Emergency locator transmitter (ELT): a radio beacon that transmits an emergency signal that may include the position of a crashed aircraft, activated either manually or in the crash.

Safety analysis

The pilot of VH-WTY was conducting a tourist flight in the Whitsunday area with 10 passengers on board, that included landing in Chance Bay. During a go‑around that followed an aborted approach to the water landing site, the aircraft collided with terrain.

The pilot was appropriately qualified to conduct the flight and there was no evidence that an aircraft‑related issue contributed to the occurrence. This analysis will examine the operational aspects associated with the attempted landing and decision to go‑around, which preceded the collision with terrain.

Development of the accident

Terrain surrounding the Chance Bay water landing area poses two significant operational landing hazards:

  • significant mechanical turbulence/downdrafts in adverse wind conditions
  • go‑around options reduce to zero the further an aircraft approaches in to the bay.

Both of these hazards were identified in the operator’s aircraft landing area (ALA) guidance, with specific emphasis on the need to operate within the ALA limits and maintain an escape route.

On this occasion, the pilot delayed touching down on the water until he assessed that he was past a wind gust. While that decision was motivated by a desire to avoid unsuitable landing conditions, it resulted in the aircraft first touching down beyond the ALA and significantly closer to the terrain surrounding Chance Bay than recommended. That situation was further aggravated by two further bounced water contacts as the approach was continued towards the beach, before the go‑around was initiated.

Continuation beyond the nominated decision point removed the preferred option to abort the landing and turn right to depart Chance Bay over water. However, despite progressing further into the bay, the option to conduct a missed approach straight-ahead over the saddle remained.

A straight-ahead departure from the go‑around point was within the documented performance capabilities of the Caravan in the optimal configuration, however the pilot assessed that the aircraft was not climbing as expected and would not clear the terrain. This resulted in the decision to turn away from the saddle, exposing the aircraft to higher terrain to the east of the beach. The turn also positioned the aircraft downwind, which also adversely affected the climb profile. These factors combined to result in the accident.

The pilot had recent familiarity with Chance Bay, having flown there 11 times in the past 90 days in WTY, including on the morning of the accident. The pilot had also been shown and had used, the straight-ahead departure over the saddle toward Whitehaven Beach. However, the pilot had not conducted a go‑around in any aircraft at Chance Bay during line operations, nor conducted a go‑around in the Caravan with a loaded aircraft weight.

This may have influenced his knowledge and judgement around the expected performance of the aircraft, including not using the available transient power or the correct go‑around airspeed, and the distance required to safely conduct a go‑around. Despite this, flying well beyond the decision point and persisting with conditions that were not conducive for a safe landing meant that the decision to conduct a go‑around was made late in the approach. The late decision reduced the options and margins available for a safe outcome and ultimately led to the ground collision.

Approach and landing is the most common phase of flight for aviation accidents, accounting for approximately 65 per cent of all accidents. A Flight Safety Foundation study[18] of 16 years of runway excursions determined that 83 per cent could have been avoided with a decision to go‑around. The study identified that just over half of the landing excursions followed a fully stable approach; in these instances the flight became unstable only during landing.

Whenever landing conditions are not satisfactory, a go‑around should be initiated. A go‑around is considered a normal procedure, however, they can present challenges, especially when initiated late in the approach or during landing. Good flight preparation includes completing a mental rehearsal before departure and prior to the approach to land. By having plans and procedures in place, the pilot will reduce their workload during critical stages of flight and also in the event of any emergencies. Recurrent training into ‘challenging’ environments is helpful in maintaining consistent operational procedures and identifying any non‑standard practices.

Safety equipment and procedures

The pilot reported that the preparation for a forced landing was not considered during the go‑around attempt. As such, no pre‑impact preparation was conducted or briefed to the passengers. The pilot did however, maintain control of the aircraft during a rapidly changing sequence of events. Continued pilot control, the crashworthiness of the aircraft, combined with all persons on board wearing shoulder-restraint seatbelts, likely resulted in minimal injuries being sustained, even without impact preparedness. The characteristics of the foliage contacted may also have cushioned the impact.

The pilot did not completely shut down and secure the aircraft before evacuating, which increased the risk of a post-impact fire. However, the passengers were consistent in their recollection of the pilot’s prompt and effective handling of the aircraft evacuation and relocation of everyone to a safe distance from the aircraft.

Cancelling flight following prior to landing increased the risk of delay to an emergency response. However, the self-activation and detection of the emergency locator transmitter resulted in prompt initiation of a search and rescue coordination. Use of the satellite phone also provided the means for communication with the operator’s main base.

The occurrence highlighted the importance of emergency training, available equipment and defined safety‑related procedures combining to increase safety to all on board the aircraft.

__________

  1. Flight Safety Foundation Go-around Decision Making and Execution Project can be viewed via www.flightsafety.org

Findings

From the evidence available, the following findings are made with respect to the collision with terrain involving amphibian Cessna Aircraft Company C208 Caravan aircraft, registered VH-WTY that occurred at Chance Bay, 11 km north-east of Hamilton Island airport, Queensland, on 28 January 2016. These findings should not be read as apportioning blame or liability to any particular organisation or individual.

Contributing factors

  • The aircraft's initial touches with water were past the nominated decision point and beyond the northern boundary of the ALA, which reduced the safety margins available for a successful water landing or go-around.
  • The pilot initiated a go-around without using all available power and the optimal speed, turned towards higher terrain and placed the aircraft in a down‑wind situation, which ultimately resulted in the collision with terrain.

Other findings

  • The aircraft was equipped with lap-sash seatbelts, which have been demonstrated to reduce injury, and the use of emergency beacons and satellite phone facilitated a timely response to the accident.

Safety issues and actions

Proactive safety actions

Whether or not the ATSB identifies safety issues in the course of an investigation, relevant organisations may proactively initiate safety action in order to reduce their safety risk. The ATSB has been advised of the following proactive safety actions in response to this occurrence.

Engine operating limits

Wipaire Inc. published an amendment to the pilot operating handbook supplement for the Cessna 208 amphibian on 22 December 2016. The engine operating limits now identify that a transient torque of 2,400 ft-lb is available for 20 seconds, which is consistent with the engine manufacturer’s recommendations.

Aircraft operator

The operator advised they have enhanced/updated existing procedures and checklists for their float plane operations. Among other things, this included provision of engine limitation figures, including transient power, on documents used by pilots, as well as revision of the Chance Bay ALA guidance, incorporating detailed orographic information in addition to that included on the Whitsunday visual terminal chart.

General details

Pilot details

Licence details:Commercial Pilot Licence (Aeroplane), issued June 2012
Endorsements:Single Engine Aeroplane; Tail wheel undercarriage; Manual Propeller Pitch Control; Retractable Undercarriage; Floatplane; Gas turbine engine
Ratings:Nil
Medical certificate:Class 1, valid to March 2016
Aeronautical experience:Approximately 1,350 hours
Last flight review:May 2015

Sources and submissions

Sources of information

The sources of information during the investigation included:

  • interviews with the pilot, passengers, operator, other pilots and a flight instructor
  • engine data
  • aircraft, engine and float manufacturers
  • the Bureau of Meteorology
  • the Australian Maritime Safety Authority.

References

Clarke, S, 1996, The effect of habit as a behavioural response in risk reduction programmes, Safety Science, vol. 22, no.1-3, pp.163-175

Klein, G 1999, Sources of Power How People Make Decisions. MIT Press.

Orasanu and Martin, L, 1998, Errors in Aviation Decision Making: A Factor in Accidents and Incidents, Human Error, Safety and Systems Development Workshop 1998

Reason, J, 1997, Managing the Risks of Organizational Accidents, Ashgate Publishing Limited, Aldershot, England

Riley, Malcolm 2009 Afloat Magazine Bullets

Submissions

Under Part 4, Division 2 (Investigation Reports), Section 26 of the Transport Safety Investigation Act 2003 (the Act), the ATSB may provide a draft report, on a confidential basis, to any person whom the ATSB considers appropriate. Section 26 (1) (a) of the Act allows a person receiving a draft report to make submissions to the ATSB about the draft report.

Draft reports were provided to the pilot, the operator, the pilot’s flight instructor, the Civil Aviation Safety Authority, Transportation Safety Board of Canada, National Transportation Safety Board (United States), the aircraft, engine and float manufacturers, Australian Maritime Safety Authority and Airservices Australia.

Submissions were received from the pilot, the operator, the engine manufacturer and the Civil Aviation Safety Authority. The submissions were reviewed and, where considered appropriate, the text of the report was amended accordingly.

Appendices

Appendix A – Chance Bay ALA published information

Appendix A – Chance Bay ALA published information

Appendix B – Chance Bay ALA additional guidance

Appendix B – Chance Bay ALA additional guidance

Purpose of safety investigations

The objective of a safety investigation is to enhance transport safety. This is done through:

  • identifying safety issues and facilitating safety action to address those issues
  • providing information about occurrences and their associated safety factors to facilitate learning within the transport industry.

It is not a function of the ATSB to apportion blame or provide a means for determining liability. At the same time, an investigation report must include factual material of sufficient weight to support the analysis and findings. At all times the ATSB endeavours to balance the use of material that could imply adverse comment with the need to properly explain what happened, and why, in a fair and unbiased manner. The ATSB does not investigate for the purpose of taking administrative, regulatory or criminal action.

Terminology

An explanation of terminology used in ATSB investigation reports is available here. This includes terms such as occurrence, contributing factor, other factor that increased risk, and safety issue.

Publishing information 

Released in accordance with section 25 of the Transport Safety Investigation Act 2003

Published by: Australian Transport Safety Bureau

© Commonwealth of Australia 2020

image_5.png

Ownership of intellectual property rights in this publication

Unless otherwise noted, copyright (and any other intellectual property rights, if any) in this report publication is owned by the Commonwealth of Australia.

Creative Commons licence

With the exception of the Coat of Arms, ATSB logo, and photos and graphics in which a third party holds copyright, this publication is licensed under a Creative Commons Attribution 3.0 Australia licence.

Creative Commons Attribution 3.0 Australia Licence is a standard form licence agreement that allows you to copy, distribute, transmit and adapt this publication provided that you attribute the work.

The ATSB’s preference is that you attribute this publication (and any material sourced from it) using the following wording: Source: Australian Transport Safety Bureau

Copyright in material obtained from other agencies, private individuals or organisations, belongs to those agencies, individuals or organisations. Where you wish to use their material, you will need to contact them directly.

Occurrence summary

Investigation number AO-2016-007
Occurrence date 28/01/2016
Location 11 km north east Hamilton Island Airport (Chance Bay)
State Queensland
Report release date 25/06/2020
Report status Final
Investigation level Systemic
Investigation type Occurrence Investigation
Investigation status Completed
Mode of transport Aviation
Aviation occurrence category Collision with terrain
Occurrence class Accident
Highest injury level Minor

Aircraft details

Manufacturer Cessna Aircraft Company
Model 208 Caravan
Registration VH-WTY
Serial number 20800522
Sector Turboprop
Operation type Charter
Departure point Hamilton Island, Queensland
Destination Chance Bay, Queensland
Damage Destroyed