On 6 September 2019, at 1430 Eastern Standard Time,[1] the pilot of a Bell Helicopter Company UH-1H helicopter registered VH‑UVC (UVC) departed Archerfield Airport, Queensland, on a private flight with four passengers for Bankstown, New South Wales.
Following a refuelling stop at Coffs Harbour, New South Wales, the pilot made contact with Williamtown air traffic control (ATC), while north-east of Broughton Island and requested clearance to track south via the visual flight rules (VFR) coastal route. The initial radio calls between the pilot and Williamtown ATC, occurred about 6 minutes prior to the published time of last light. The radio calls indicated that the helicopter was being affected by turbulence and as a result the pilot was having difficulty maintaining a constant altitude. In response, the controller issued a clearance for the aircraft to operate between 2,400 and 3,500 ft.
Once past Anna Bay, and about 11 minutes past published last light, UVC was observed on Williamtown ATC radar to make a left turn to the south, depart the coastal route and head offshore, on a direct track to Bankstown Airport. The turn likely resulted in the pilot losing visual cues and encountering dark night conditions.
The helicopter continued to track offshore to the south-west for about 90 seconds, maintaining between about 2,500 and 3,200 ft before commencing a rapidly descending, left spiral turn. It disappeared from Williamtown radar coverage about 12 minutes after published last light. Attempts by the controller to contact the pilot were unsuccessful and authorities were subsequently advised of a missing helicopter.
On 25 September 2019, wreckage from the destroyed helicopter was located in about 30 m of water, 5 km south‑west of Anna Bay. Two of the five persons on board the helicopter were confirmed to have received fatal injuries. The bodies of the pilot and two of the passengers were not found but they were presumed to have similarly not survived the accident.
What the ATSB found
The ATSB found that the pilot continued to fly after last light without the appropriate training and qualifications, and then into dark night conditions that provided no visual cues. That significantly reduced the pilot's ability to maintain control of the helicopter, which was not equipped for night flight.
Once visual references were lost, the pilot likely became spatially disorientated and lost control of the helicopter, resulting in a collision with water.
Further, the pilot did not disclose on-going medical treatment for significant health issues to the Civil Aviation Safety Authority. That prevented specialist consideration and management of the on‑going flight safety risk the medical conditions and prescribed medications posed.
Safety message
Various ATSB research and investigation reports refer to the dangers of flying after last light without the appropriate qualifications and experience. The ATSB report, Avoidable Accidents No. 7, highlights the risks of visual flight at night. Risks include, reduced visual cues, increased likelihood of perceptual illusions, and spatial disorientation.
A VFR flight in dark night conditions should only be conducted by a pilot with instrument flying proficiency as there is a significant risk of losing control if attempting to fly visually in such conditions. If day VFR‑rated pilots find themselves in a situation where last light is likely to occur before the planned destination is reached, a diversion or precautionary landing is probably the safest option. Air traffic control assistance with available landing options is also available.
This accident also highlights the importance of aviation medical certificate holders reporting relevant conditions and medications to their Designated Aviation Medical Examiner. A full understanding by the Civil Aviation Safety Authority’s aviation medical specialists of a pilot’s medical conditions, and use of medications, enables management of the risk for both the individual and flight safety overall.
On 6 September 2019, at 1430 Eastern Standard Time,[2] the pilot of a Bell Helicopter Company UH-1H helicopter registered VH‑UVC (UVC) departed Archerfield Airport, Queensland, with four passengers on board. The pilot was conducting a private flight for the purpose of repositioning the helicopter to Bankstown Airport, New South Wales (NSW).
Witnesses at Archerfield advised that the intent was for UVC to be self-sufficient in terms of fuel requirements during the transit to Bankstown. Pre-flight preparation included the loading and filling of a plastic 400 litre fuel storage tank and a 205 litre drum. A portable, battery‑operated transfer pump and hose was to be used to transfer fuel from the on-board storage into the helicopter’s fuel tanks, when on the ground. Basic maintenance was also completed in preparation for the flight.
At about 1600, the pilot landed at Coffs Harbour, NSW to refuel the helicopter. A nearby helicopter operator who witnessed UVC land, reported that fuel was transferred from the 400 litre tank until it was empty, and then from the 205 litre drum. The refuelling operation drained the available battery power and the pilot sought assistance from the operator, who supplied a battery power pack to complete the refuelling. Shortly after, the operator noted that fuel was overflowing from the helicopter’s fuel tank filling port and called out that the tank was full. The partially‑emptied drum was then reloaded into UVC, and the battery pack returned to the operator.
During the refuelling stop, one of the passengers called a Bankstown operator to advise that they were in the process of refuelling. Arrangements had been made with the operator to provide hangar space for UVC. The operator was awaiting their arrival to assist moving the helicopter into the hangar. Following refuelling, the pilot departed Coffs Harbour at about 1648.
At 1652 the passenger advised the Bankstown operator via text message that they were on their way to Bankstown. The operator was aware of the time it would take to fly to Bankstown and that an arrival after last light was now likely. The operator contacted the passenger via a text message and queried whether they were ‘night VFR’ - a reference to whether the flight could continue at night under the visual flight rules (VFR).[3] The response from the passenger was that the pilot ‘is’ night VFR rated.
At 1755, the pilot made contact with Williamtown Tower, requesting clearance to track south via the VFR coastal route (Figure 1). The pilot also requested a climb to a higher altitude, to take advantage of more favourable winds. In response, the Williamtown Tower controller advised them to contact Williamtown Approach (Approach) for clearance.
At 1757, the pilot of UVC contacted Approach and requested a clearance. At 1758, the Approach controller identified UVC’s position as 7.4 km to the north-east of Broughton Island (Figure 1), and advised the pilot they could operate at whatever altitude was required provided it was not below 2,400 ft.[4] The pilot responded with a request to operate between 3,000 and 3,500 ft. UVC was cleared to track coastal southbound at a block altitude between 3,000 and 3,500 ft.
At 1759, following an inquiry from the Approach controller, the pilot advised that Bankstown was the intended destination. At 1800, the pilot was advised that if any further track or altitude changes were required, to inform Air Traffic Control (ATC) accordingly. While no response was required, the pilot did not acknowledge the transmission.
Published last light for Anna Bay, NSW was 1801. At this time the controller again contacted UVC to offer alternative tracking if required. The pilot responded requesting to remain on the eastern side of the R578A Williamtown restricted area. The controller clarified this request and in response, the pilot advised that if the track was not available, they would continue on the VFR coastal route. The pilot was then cleared to track as required for Bankstown Airport. The track clearance was acknowledged by the pilot at 1802.
Figure 1: Williamtown airspace map with VH-UVC’s position at various times
Source: Airservices Australia, annotated by the ATSB
A final text message from the passenger was received by the Bankstown operator at 1804 advising that UVC was approaching Williamtown.
At 1805, the Approach controller contacted the pilot to confirm that operations were normal, having observed that UVC’s altitude had dropped to 2,700 ft. The pilot acknowledged the loss of altitude, commenting on a wind gust affecting the helicopter. The controller responded by providing clearance for the pilot to operate between 2,400 and 3,500 ft. This was acknowledged by the pilot who also commented on the turbulent conditions that were being experienced. The controller acknowledged the conditions and made a further offer of assistance should it be required.
UVC was then observed on Williamtown ATC radar to make a left turn to the south, depart the VFR coastal route and head offshore. Automatic Dependent Surveillance - Broadcast (ADS-B)[5] data supplied by Aireon, indicated that the helicopter’s position at the beginning of the turn, at 1811:23, was 2.3 km west-south-west of Anna Bay[6] (Figure 2).
The turn offshore was witnessed by two recreational fishers who were located on Stockton Beach, about 2 km to the west of Birubi Point, Anna Bay. They described seeing a helicopter track overhead in a westerly direction, then turn out to sea, heading in a south-westerly direction. They reported that the helicopter sounded loud, and its lights were observed until it disappeared from sight, following a turn to the east.
The helicopter continued to track offshore to the south-west for about 90 seconds, maintaining an altitude of between 2,568 and 3,168 ft, before commencing a rapidly descending left turn. ADS-B data showed that the aircraft commenced this descent from 2,968 ft at 1812:55 which was about 12 minutes after published last light. At 1813:12, a short, loud but indistinct transmission, that may have originated from UVC was recorded by Williamtown ATC. The last Aireon ADS-B data point identified the aircraft passing an altitude of 93 ft at 1813:18. UVC disappeared from the Williamtown ATC radar display at 1813:26.
Figure 2: Flight path of VH-UVC following the VFR coastal route passing Anna Bay and the turn offshore
Source: Google and ADS-B data (Aireon), annotated by the ATSB
Two attempts by the Approach controller to contact the pilot at 1813:17 and 1813:27 were unsuccessful. The controller then broadcast advice to the pilot that surveillance identification had been lost and to immediately check altitude. Further advice of the area’s QNH[7], the lowest safe altitude in the area, and an instruction to climb immediately, were broadcast. The controller followed that transmission with several more unsuccessful attempts to contact the pilot. There was no response and at 1815 the Approach controller contacted the Australian Maritime Safety Authority’s, Joint Rescue Coordination Centre and notified them of the missing helicopter.
The initial search for UVC, using a fixed wing aircraft and several rotary wing aircraft, was hampered by poor weather and sea conditions. The search was concentrated in the vicinity of reported oil slicks and floating wreckage several kilometres to the south west of Birubi Point. The search was suspended after several days when the likelihood of locating survivors had passed.
An extended sea and aerial search for the helicopter was continued by the NSW police and later, with assistance from the Royal Australian Navy. Wreckage from the destroyed helicopter was located on 25 September 2019, 5.3 km to the south west of Anna Bay, in about 30 m of water.
Two of the five persons on board the helicopter were confirmed to have received fatal injuries. The bodies of the pilot and two of the occupants were not found but they were presumed to have similarly not survived the accident.
The pilot held Private and Commercial Pilot licences (Helicopter) and was qualified to fly by day under the Visual Flight Rules (VFR). The pilot also held a single-engine helicopter class rating and a gas turbine engine design feature endorsement. The pilot last conducted a single-engine helicopter flight review on 25 October 2018 that was valid until 31 October 2020. A Class 1 Aviation Medical Certificate issued by the Civil Aviation Safety Authority (CASA), valid until 26 April 2020, was also held.
The pilot’s logbook indicated a total of 1,440.5 hours total flying experience, of this about 103 hours were on the UH-1H. In the previous 90 days, 9 hours were accrued with 1.8 hours on the UH‑1H. A review of flying‑related documents showed that the pilot:
commenced flying on 9 September 2011
completed his Private Pilot Licence (Helicopter) on 10 April 2013
completed his low level (Helicopter) flying training on 13 June 2013
completed his Commercial Pilot Licence (Helicopter) on 26 June 2015.
The pilot completed their endorsement on the UH-1H on 26 October 2018 and was appropriately qualified to operate VH-UVC (UVC). The pilot was not qualified or trained to fly at night. At the time of gaining their Private and Commercial Pilot Licences (Helicopter) there was no requirement for night or instrument flight training. An examination of the pilot’s logbook found no evidence of night flying or instrument flying experience.
Pilot’s medical history
The pilot was being treated for significant health issues and sought regular medical support from a non‑aviation medical specialist from January‑March 2019. Following a break in treatment, the pilot again visited the specialist on 3 September 2019. While being treated, the following medications were prescribed:
valdoxan
olanzapine
naltrexone
diazepam
Valdoxan and olanzapine have the potential for producing a sedating side-effect, requiring management of the dosage amount. During medical reviews with their specialist, the pilot did not report feelings of sedation in the morning or during the day. The diazepam was prescribed three days before the accident, with a planned review at a subsequent appointment.
A witness reported that in the week of the accident the pilot disclosed that they had slept for a full day, waking briefly in the evening, then slept through to the following morning. No explanation was offered as to what prompted this. The pilot’s treating specialist last saw the pilot on 3 September 2019 and was unaware of the reported sleep episode. The specialist’s opinion was sought on possible reasons, and the ATSB’s assessment of their comments was that it was unlikely to have been the result of any of the prescribed medicines taken at their specified dosages.
As the pilot’s body was not recovered following the accident, the ATSB was unable to gain any further medical information from a post-mortem examination or toxicological assessment.
72-hour history
The ATSB was unable to gather sufficient information to complete a 72-hour history, primarily due to the pilot living alone. However, in the 24-hour period prior to the accident, the pilot:
exchanged text messages with a family member around midnight
accessed the National Aeronautical Information Processing System to gain location briefings that included weather related information at 0200
briefly met up with a family member around 0745 on the morning of the accident.
With the limited information available, it was not possible to determine, whether at the time of the accident, the pilot was operating with a level of fatigue known to affect performance. However, from the available history, the pilot had about five hours of sleep opportunity the night before the accident.
Aviation medical certificates
A current medical certificate is required to exercise the privileges of a pilot licence. A Class 1 medical certificate is required to exercise the privileges of a commercial pilot licence and a Class 2 medical certificate is required for a private pilot licence.
When applying to renew a medical certificate, pilots are required to update their medical history by providing details of medications they have taken or have been prescribed. Additionally, pilots are required to provide information relating to any medical procedures, medical issues or symptoms that required the input of a medical specialist.
On completion of an examination by a Designated Aviation Medical Examiner (DAME) a report is submitted to the CASA to assess whether a medical certificate can be issued or whether further information or tests are required.
In the course of renewing their medical certificates, the accident pilot did not disclose medical conditions under treatment, or the medications that had been prescribed.
For the awareness of flight crews, CASA publicises a limited list of approved medications,[8] along with a list of medications that are considered hazardous to aviation. Medications that assist sleep are considered as hazardous. Medications that are considered as hazardous can only be used with the express clearance of the CASA or a DAME.
The ATSB sought advice regarding the medications that had been prescribed to the pilot of UVC from a subject matter expert (SME) in aviation medicine. The SME advised the ATSB that diazepam, olanzapine and naltrexone:
Were absolutely incompatible with flying with respect to CASA guidelines, as were the conditions for which they had been prescribed.
and for valdoxan:
(restrictions) would be imposed for conditions requiring valdoxan, but only after 1-3 months grounding and then with a written clearance from a [treating specialist], DAME and treating GP. CASA would require on‑going medical audit and only a restricted medical certificate would be issued.
The SME further advised that, based on the pilot’s medical history and occurrence information, medical incapacitation from a heart attack, seizure, other underlying condition or known medications were unlikely to have contributed to the accident.
Aircraft information
General information
UVC was a Bell Helicopter Company UH-1H, S/No 5144, manufactured in the United States of America in 1966. The UH-1H is a medium size, single engine utility helicopter with a two‑bladed main rotor system. Standard configuration included dual controls, seating capacity for 13 persons, including two crew members, and skid type undercarriage. UVC was placed on the Australian Civil Aircraft Register on 2 October 2018 and was issued with Special Certificate of Airworthiness No. 13L1817 in the Limited[9] category on 17 October 2018.
The Special Certificate of Airworthiness specified that the aircraft was to be operated:
in accordance with the operating limitations contained within the approved Army Model UH-1H Helicopter Operator’s Manual
by day under the Visual Flight Rules unless the aircraft was appropriately equipped for night or instrument flight.
Aircraft records
UVC’s Log Book Statement[10] specified that maintenance releases were to be issued for periods of 150 hours time-in-service or 12 months, whichever occurred earlier. Maintenance reference data for UVC was the UH-1 series, military services Inspection Planning Guide from the Interagency Committee for Aviation Policy (ICAP[11]).
The maintenance release, current at the time of the accident, was issued on 16 October 2018 for day VFR operations at an aircraft time in service of 6,693.0 hours.
The current maintenance release with flight hour information for UVC was not recovered from the helicopter following the accident. An estimate of the aircraft time in service was derived from the pilot’s logbook to determine UVC’s operating time since the issue of the maintenance release. It was estimated that prior to departure from Archerfield, UVC’s total time in service was about 6790.0 hours.
At 6,743.0 airframe hours a 50-hour inspection was required, involving:
visual inspections
mounting hardware torque checks
rotor drive train oil system maintenance.
Additionally, a voltage regulator inspection was required to be performed by 16 April 2019.
Maintenance history
Following arrival in Australia, the helicopter was assembled and refurbished. The refurbishment included maintenance actions for the initial issue of the certificate of airworthiness, systems checks and post-maintenance testing. Maintenance records indicated that on completion of the refurbishment, flight testing that included dynamic balancing of the main rotor system and confirmation of correct flight control stick forces was conducted. Additional and on-going maintenance requirements were annotated on the maintenance release.
Prior to departure from Archerfield, a 10-hour/14-day inspection was performed, and a clearing endorsement was entered on part 1 of the maintenance release. An image of the maintenance release showing the clearing endorsement was provided to the ATSB.
The image also showed that the 50-hour inspection due at 6,743.0 hours, and the voltage regulator inspection due on 16 April 2019, had not been endorsed on the maintenance release as having been completed. An image of part 2 of the maintenance release, where maintenance can be certified, was not provided. The aircraft logbook did not contain details of maintenance activity beyond UVC’s refurbishment and maintenance release issue on 16 October 2018.
The ATSB was unable to verify if the required maintenance had been performed as the aircraft’s maintenance release was not recovered from the wreckage.
Aircraft systems
Flight control system
UVC was equipped with a hydraulically‑assisted flight control system which could be operated by either the pilot or co-pilot. The system included the cyclic and collective control systems, allowing operator inputs to the main rotor system, and tail rotor pedals for control of the tail rotor.
With hydraulic assistance power removed, the pilot would experience higher than normal forces to move the cockpit controls, and moderate feedback would be felt when the controls were moved. However, full main and tail rotor system control would still be available and control movements would result in a normal helicopter response.
Figure 3: Layout of Bell Helicopter Company UH-1H with major components labelled
Source: Bell Helicopter Company, annotated by the ATSB
Hydraulic system
The hydraulic system consists of a single hydraulic pump supplying pressure to the hydraulic servo cylinders connected to mechanical linkages in the helicopter’s flight control system. When the cockpit controls are moved, pressurised hydraulic fluid enters the cylinders reducing the force for control movement.
In the event of a hydraulic system malfunction, feedback forces from the main rotor are prevented by irreversible (check) valves in the hydraulic servo cylinders. This allows the pilot to continue making the required control system inputs. In the event of a hydraulic power failure, the pilot should land a soon as practicable in an area that will permit a run-on landing.[12]
Aircraft modifications
UVC was a standard UH-1H helicopter with no recorded airframe modifications, however a tablet device (Figure 4) was mounted on the pilot’s side instrument panel. From reference to an image of UVC’s cockpit and the UH-1H Operator’s Manual it was determined that the pilot’s side, attitude indicator and directional gyro may have been removed to accommodate the device or were obscured once the device was installed. A second attitude indicator was mounted in the left side instrument panel.
To accommodate the tablet installation, the pilot’s airspeed and turn and slip indicators were relocated to new positions below the tablet device. While the UH-1H Operator’s Manual did not specify the instruments that were required for VFR flight, relocation of instruments was permitted.
Figure 4: VH-UVC instrument panel
Source: Niza Villanueva, annotated by the ATSB
UH-1H helicopter limitations
The Operator’s Manual for Army Model UH-1H helicopters, specified that intentional flight into severe or extreme turbulence or into thunderstorms was prohibited. Other limitations for UVC were a gross weight limitation of 4,309 kg, and a never exceed limit of 112 kt indicated airspeed. This limiting airspeed varied slightly with aircraft gross weight and atmospheric conditions.
Wreckage information
Search for helicopter and wreckage field
A Royal Australian Navy vessel tasked to assist the search, located the helicopter wreckage field about 3.5 km offshore, in about 30 metres of water. NSW police divers located parts from the helicopter and provided the ATSB with a series of location coordinates from a GPS‑enabled dive camera. The positions of the helicopter parts were mapped to show their relative positions on the ocean floor (Figure 5).
Figure 5: Map showing relative positions of helicopter wreckage on the ocean floor relative to UVC’s flight path
Source: Google using Aireon data for UVC flight path and NSW police supplied positions of wreckage items, annotated by the ATSB.
The heaviest items, including the main rotor system and the engine, were located within 10 metres of each other. Other debris and parts of the cabin were also nearby. The tailboom was located about 51 metres to the south-east of the engine’s position.
Helicopter wreckage
The engine, main rotor system and tailboom were identified in underwater imagery recorded by the Royal Australian Navy during the search for the helicopter. The imagery showed that the tailboom was missing the vertical fin, tail rotor gearbox, tail rotor, and the synchronised elevators (Figure 3).
Imagery of the main rotor system showed both main rotor blades attached to the rotor head and the transmission mast connected to the upper reduction gearbox section of the transmission assembly. The lower section of the transmission assembly that included the mount casing and tail rotor drive section was not identified.
One of the main rotor blades appeared to be largely straight with damage to the outboard section. In contrast, the opposite blade was significantly damaged. The blade tip section was missing and there was evidence of blade deformation in bending. The ‘D’ section leading edge main spar, was visible and portions of the blade aerofoil section between the blade leading and trailing edges were missing. It is likely that both blades were rotating when they struck the water.
The swashplate, main rotor system (Figure 3) and pitch control mechanism were also present. Additionally:
the transmission and main rotor blade system had detached from the fuselage during the accident sequence
there was no evidence of a flight control system fault
significant disruption of other sections of the helicopter was evident
the damage was consistent with a high-speed impact with water.
The engine was located on the ocean floor in the vicinity of the main rotor system and the cockpit and cabin remains (Figure 5). The engine was intact, with the exception of the exhaust pipe. It was not possible to determine the integrity of the engine, or its serviceability from available imagery, however no obvious defects were identified.
Figure 6: Engine from VH-UVC located within the wreckage field
Source: NSW police, annotated by the ATSB.
Other helicopter parts that were identified included:
remains of the cockpit area
both cockpit seats
fragments of cabin structure
sections of the undercarriage
items of portable refuelling equipment.
Other pieces of the helicopter were present however identification was limited by the clarity of the water and some items had become partially buried by sand. On Monday 16 September 2019 a member of the public provided NSW police with a small honeycomb panel. It had washed ashore between Kingsley Beach and Little Kingsley Beach, located about 2 km to the south-east of Anna Bay.
Two other pieces were found and reported to NSW police on 18 September 2019. They were also of honeycomb construction (Figure 7) and were found at separate locations on Stockton Beach, NSW. The construction and paint colour of the panels were similar to structural panels used in UVC, however no features specifically linking the items to UVC were identified.
A portion of helicopter main rotor blade washed ashore at Blinky Beach on Lord Howe Island, NSW and was reported to police on Friday 17 January 2020. The blade was constructed from an aluminium composite material, measured 800 mm by 340 mm and was painted matt black. It bore a sticker that read ‘bh Fort Worth Texas’, which identified the section as belonging to a Bell Helicopter.
Figure 7: Items of honeycomb construction found on Stockton Beach, probably from UVC
Source: NSW police
Tailboom assessment
UVC’s tailboom was retrieved by NSW police divers and made available to the ATSB for examination. The tailboom (Figure 8), without the vertical fin, synchronised elevators, tail rotor gearbox and tail rotor assembly (Figure 3), had separated at the fuselage rear bulkhead due to overstress failure of the rear fuselage structure.
Figure 8: VH-UVC tailboom following recovery from the ocean floor
Source: NSW police, annotated by the ATSB
Internally, the remains of the synchronised elevator control system and the tail rotor pitch control systems were present. Failures of the control tubes and cables were attributed to overstress. Examination of the tailboom did not identify any pre-existing defects likely to have influenced the accident sequence.
The tail rotor drive train from the rear fuselage tailboom junction to the 42° gearbox was also present. Compression damage to the tailboom driveshaft cover was consistent with water impact. Drive shaft coupling imprints were noted on the cover (Figure 9). The imprints were consistent with the driveshaft not rotating at the time of impact. However, rotational damage signatures were also present at either end of the recovered tail rotor drive train. Additionally, multiple contact marks were evident on the side of the boom in the vicinity of the synchronised elevator attachment points. Those marks were consistent with repeated movements of the elevators.
The aircraft was fitted with a Mode S transponder that broadcast ADS-B data. This information included the position and altitude of the aircraft and was received by Airservices Australia as well as other third‑party ADS‑B receivers (Aireon and Flightradar24).
Two mobile devices with the OzRunways electronic flight bag application installed were on board. The application provided the option for live flight tracking by transmitting the device’s position and altitude. ADS-B and OzRunways data was obtained and analysed by the ATSB.
Both the Aireon and OzRunways data was compared and found to be consistent, however the Aireon data has been used in this report as it provided higher fidelity for altitude information over the final flight segment. The data was transmitted at five second intervals and a track line was produced by joining each data point with a straight line. Variations between these data points were not captured.
VH-UVC flight path
From Broughton Island UVC tracked past Yacaaba Head, Fingal Bay then Morna Point (Figure 10). Once past Anna Bay, the pilot commenced a left turn away from the coast, aligning with a direct track to Bankstown (Figure 11 and 12). The turn and subsequent track were inside the Williamtown military control zone area boundary. The helicopter tracked offshore to the south‑west for about 90 seconds before commencing a rapidly‑descending, left turn followed by a collision with the ocean surface.
Figure 10: Townships along the VFR coastal route once UVC passed Broughton Island
Source: Google using ADS-B data (Aireon), annotated by the ATSB
Figure 11: Overhead view of UVC flight path showing turn to seaward and spiral descent
Source: Google and ADS-B data (Aireon), annotated by the ATSB
Figure 12: Side view of UVC flight path showing turn to seaward and spiral descent
Image description: The flight path is provided for illustrative purposes. The altitudes as presented originate from raw data and have not been corrected for atmospheric conditions.
Source: Google and ADS-B data (Aireon), annotated by the ATSB
The variation in UVC’s flight parameters over the final 30 minute period is presented in a graphical format (Figure 13) with key events presented in an overhead view (Figure 14). The rate of change of altitude and track, before and after last light, where the pilot appeared to be attempting to maintaining a constant altitude, were averaged and compared. For the period after last light and prior to the turn away from the coast:
the average variations in altitude increased by a factor of 2 compared to daylight operation.
excluding what appeared to be a deliberate turn by the pilot at about 1809, the average variations in track increased by a factor of 3 compared to daylight operation.
Figure 13: UVC flight parameter variation over the final 30 minutes
Source: ADS-B data (Aireon) with ATSB analysis
Figure 14: UVC flight path from Broughton Island
Source: Google and ADS-B data (Aireon), annotated by the ATSB
Once past Anna Bay, UVC’s flight path from the turn to seaward to the spiral descending turn was further examined. The flight path is presented in a graphical format in (Figure 15) with key aspects noted below:
at 1811:23, UVC commenced a left turn which continued until 1811:56, aligning with the direct track to Bankstown Airport
from 1811:27 to about 1812:24, the altitude increased by about 550 ft
a right turn commenced at 1811:56, continuing until 1812:15. Ground speed decreased during this time period
a turn to the left commenced between 1812:15 and 1812:20
from 1812:20 to 1812:24 the track changed to the left by about 21⁰
from 1812:24 to 1812:50 there were ground speed and altitude changes, with a continuing left turn
from 1812:50 to 1812:55 the turn rate and altitude increased
from 1812:55 there was a rapid loss of altitude and rapid changes in track and ground speed, consistent with a loss of control. The average rate of descent after the loss of control was calculated to be about 7,500 feet per minute, peaking at 11,636 feet per minute at 1813:18
Based on wind speeds recorded at WLM it is estimated that in the last 14 seconds of the descent, UVC’s VNE[13] limit was exceeded by up to 45 kt.
Figure 15: UVC flight parameter variation over the final 150 seconds of flight
Source: ADS-B data (Aireon) with ATSB analysis
Air traffic services
The pilot submitted a flight plan for the Archerfield to Coffs Harbour leg. A flight plan was not submitted for the Coffs Harbour to Bankstown leg, however, there was also no requirement for one.
The pilot’s first contact with Williamtown Air Traffic Control (WLM ATC) was a request for an airways clearance at 1755. When issuing the requested clearance, the controller asked whether UVC had a CAR174B exemption[14], which would allow UVC to operate at a lower minimum altitude at night. On receiving no acknowledgement, the Approach (APP) controller advised the pilot that 2,400 ft was the lowest altitude that could be offered. There was no indication provided to the controller in the radio exchange that the pilot was not qualified to continue the flight after last light.
At 1800:27 and 1800:56 WLM ATC offered the pilot of UVC alternate tracking and at 1801:41 cleared the pilot to manoeuvre as required for tracking to Bankstown. At 1805:41, the APP controller issued a safety alert advising the pilot to ‘check altitude’ when UVC dropped to 2,700 ft, which was below the clearance altitude of 3,000 ft. The pilot reported turbulent conditions and in response the controller re‑cleared the pilot to operate from the lowest safe altitude of 2,400 ft to 3,500 ft. At 1806:09 the controller requested the pilot to advise if anything further was needed.
The turn offshore at 1811:23 was observed on WLM radar. An indistinct transmission, which was assumed by ATC to be from UVC, was heard at 1813:12, about 17 seconds after the loss of control had likely occurred (Figure 15). UVC was observed on radar in a rapid descent from about 2,900 ft, disappearing from WLM radar coverage at 1813:26. By 1813:27, the APP controller had alerted the Tower controller of the unfolding situation, and made two standard radio calls seeking a response from UVC.
A detailed alert to UVC specifying that identification had been lost, and a low altitude warning to check altitude, was made at 1813:32 by the APP controller. The alert also included the area barometric pressure, the lowest safe altitude, and an instruction to initiate an immediate climb. There was no response from UVC and a further five radio calls were made to contact the pilot by WLM ATC controllers.
At 1824:13, in response to a request from the APP controller, the pilot from one of the WLM departing aircraft called UVC on the 121.5 emergency frequency and reported that no response was received.
The ATSB engaged the services of an ATC subject matter expert (SME) to review the controller’s interaction with the pilot of UVC. The SME concluded that:
The actions of WLM ATC throughout the flight of UVC were in accordance with the published rules and procedures for an aircraft operating Night VFR. In addition, WLM ATC offered alternative and flexible clearances to meet the needs of the pilot in command.
Operational information
Flight endurance
CASA regulatory requirements specify that pilots of helicopters conducting private flights under the VFR are to carry a fixed fuel reserve of 20 minutes flight time. The pilot in command is required to ensure that this fuel reserve remains unused on landing unless an emergency is declared. Pilots are also required to refer to operational information such as current weather reports and forecasts for the route to be flown and to plan the flight using that information.
The witness at Coffs Harbour noted that prior to departure, the helicopter’s fuel tank had been filled to overflowing and a quantity of fuel remained in the 205 litre drum. The UH-1H operations manual stated that the useable fuel quantity was 781.6 litres or 1,362 lbs of fuel. UVC’s fixed fuel reserve requirement was calculated to be 195 lbs of fuel.
The distance from Coffs Harbour to Bankstown via a coastal route to Anna Bay and then direct track to Bankstown, was calculated to be about 250 nautical miles. A flight in nil wind conditions, allowing for climb and descent, at an indicated airspeed of 95 kt would have required about 1,570 lbs of fuel. The fuel quantity required for UVC to transit from Coffs Harbour to Bankstown using forecast winds was calculated to be about 1,265 lbs.
Provided the forecast conditions had continued, the pilot of UVC would have required an intermediate refuelling stop or to declare a fuel emergency prior to arrival at Bankstown. Any holding or diversion would likely have required a landing before Bankstown to prevent airborne fuel exhaustion.
Pilot access to weather information
The pilot accessed the National Aeronautical Information Processing System (NAIPS) using the OzRunways electronic flight bag application at 0200 and 0202 on 6 September 2019. Requests were made for location briefings and NOTAM[15] information for Archerfield, Coffs Harbour and Sydney.
A forecast for the intended route was not requested, nor were Head Office NOTAMs or SIGMETs.[16] The pilot did not access further weather information through NAIPS. However, it could not be established whether the pilot, or one of the passengers, sourced further updates enroute via other means.
Night VFR (Helicopter) qualification and training
For VFR flights conducted at night, a Night Visual Flight Rules (NVFR) rating and helicopter NVFR endorsement are required. Training for the rating and endorsement covers theory and practise in the areas of basic instrument flight, navigation aid training and procedures in the event of abnormal situations. In addition, human factors and non-technical skills awareness and application, specific to the night flying environment are covered.
A minimum of 10 hours night flying experience is necessary, of which at least five hours are required to be in a helicopter or approved flight simulation training device. These night hours must include dual flight, solo night circuits, and cross-country flights. Three hours of dual instrument time in a helicopter or approved flight simulation training device is also required.
CASA regulatory requirements specify that a pilot who does not hold a NVFR rating, or instrument rating, is not permitted to depart on a flight before first light or after last light, and is also not permitted to depart unless the estimated time of arrival at the destination is at least ten minutes before last light.
Decision making
Flight under the VFR requires minimum conditions of visibility and distance from cloud. Variation from the expected weather conditions enroute may not enable a pilot to reach the planned destination under this ruleset. That, in turn, will require a timely decision to land or divert when things are not going to plan. However, the human tendency to continue with a course of action is documented in various research studies.
The American Psychological Association defines plan-continuation bias as:
‘The tendency of people to continue with an original course of action that is no longer viable’. An example would be an airline pilot who unexpectedly encounters bad weather at the scheduled destination but decides to land anyway rather than divert to another location. Plan-continuation bias tends to be particularly strong towards the end of the activity and has been theorized to result from the interaction of such factors as cognitive load, task demands, and social influences.
Errors associated with plan-continuation have been recognised in the analysis of a number of aircraft accidents previously (NTSB, 1994; Batt and O’Hare, 2005; Dismukes, Berman and Loukopoulos, 2007).
In the ATSB research investigation report B2005/0127, addressing general aviation pilot behaviours in the face of adverse weather, Batt and O’Hare (2005) identified that the halfway point of a flight may feel like a psychological ‘turning point’ for pilots.
The focus of the pilot’s thoughts and attention will shift gradually from the point of departure to the planned destination…as the flight progressed, the chances of a VFR into IMC encounter increased until they reached a maximum of 27.6% during the final 20% of the flight distance. This pattern suggests that an increasing tendency on the part of pilots to ‘press on’ as they near their goal.
Options available to day VFR pilot’s experiencing reduced visual cues include contacting air traffic control for assistance or conducting a precautionary landing. The ATSB’s ‘Don’t push it, LAND It’ safety messaging, jointly developed and supported by the Civil Aviation Safety Authority and the Australian Helicopter Industry Association, encourages helicopter pilots to exercise this option.
Weight and Balance
Weight and balance information was derived from maintenance records, witness statements and images provided to the ATSB. Additionally, estimated and known weights of the pilot, passengers, baggage, equipment and fuel on board were used to calculate UVC’s weight and centre of gravity. It was estimated that the weight of UVC on departure from Coffs Harbour was 3,808 kg, which was below the Operator’s Manual gross weight limit of 4,309 kg.
The occupant seating positions were established from information provided by witness and from on-board images that occupants exchanged with ground-based parties following their departure from Coffs Harbour. UVC’s longitudinal and lateral balance was found to be within limits from Coffs Harbour to Anna Bay.
Helicopter – basic operational equipment for flight under the night VFR
In addition to the equipment requirements for day VFR operations, Civil Aviation Order, CAO 20.18 specifies that a helicopter may only be operated under the night VFR, if it is equipped with instruments that include an attitude indicator and a heading indicator (directional gyroscope).
Further, for night VFR flights conducted over land or water where the helicopter’s attitude cannot be maintained by the use of external visual surface cues from lights on the ground or celestial illumination, a helicopter is to be:
equipped with an approved automatic pilot or automatic stabilisation system, or
operated by a qualified two pilot crew, each with access to the flight controls.
Helicopter emergency procedures
The Operator’s Manual for Army Model UH-1H helicopters provides guidance for pilots in the event of system malfunctions or loss of function. In the event of a partial power loss, or if the engine is no longer operating (Figure 16), an auto rotational descent[17] and landing is required.
Likewise, the pilot would initiate an auto rotational descent in response to:
a drive train or tail rotor failure
an engine to transmission main drive shaft failure
a transmission free wheel unit disengagement.
Figure 16: Airflow through the main rotor system during an auto rotational descent
Image description: During an autorotation, the upward flow of relative wind permits the main rotor blades to rotate at their normal speed.
Source: FAA Helicopter Flying Handbook
The descent is typically conducted at a specified forward airspeed for the helicopter type and characterised as a controlled descent. For the UH-1H helicopter a typical auto rotational rate of descent is about:
1,600 feet per minute with an indicated airspeed of 52 kt for minimum rate of descent, or
2,060 feet per minute with an indicated airspeed of 82 kt for maximum glide distance.
A loss of tail rotor control or drive to the tail rotor, is manageable provided adequate airspeed is maintained, as directional stability will be provided by the helicopter’s vertical fin. The UH-1H helicopter requires airspeeds above 30-40 kt to maintain directional control with a loss of tail rotor drive. Other tail rotor malfunctions, including stuck pedals (fixed tail rotor pitch settings), require 40‑70 kt airspeed be maintained.
When performing an auto rotational descent to a suitable landing site, a pilot has a choice in the angle of descent, varying from vertical to maximum horizontal range. Pilots are trained to perform auto rotational descents and auto rotational capability is a certification requirement for helicopters.
Meteorological information
Forecast weather
Graphical Area Forecast (GAF)
The flight from Coffs Harbour to Bankstown occurred within the Graphical Area Forecast[18] New South Wales – East that was valid from 1500 to 2100. Forecast conditions included:
average conditions of greater than 10 km visibility with areas of scattered[19] cumulus and stratocumulus cloud at altitudes between 4,000 and 8,000 ft
widespread blowing dust reducing visibility to 5,000 m
scattered showers of rain reducing visibility to 4,000 m with associated scattered cumulus and stratocumulus cloud from 3,000 to 5,000 ft and broken cumulus and stratocumulus cloud from 5,000 to above 10,000 ft
isolated smoke over the land reducing visibility to 4,000 m and isolated heavy smoke over the land north of Taree reducing visibility to 2,000 m
isolated thunderstorms over the sea reducing visibility to 3,000m with associated isolated cumulonimbus clouds from 3,000 to above 10,000 ft
moderate mountain wave activity forecast above 4,000 ft
severe turbulence forecast below 10,000 ft with moderate turbulence north of Taree
The GAF also noted that moderate turbulence[20] is implied in cumulus, stratocumulus and altocumulus cloud and severe turbulence[21] is implied in cumulonimbus cloud.
Significant Meteorological Information Advisory (SIGMET)
The Bureau of Meteorology (BoM) issued a Significant Meteorological Information Advisory at 1436 for severe turbulence below 10,000 ft valid from 1500 to 1900. The area affected by the SIGMET covered the entire flight from Archerfield to Bankstown.
Grid Point Wind and Temperature
The Grid Point Wind and Temperature forecast valid at the time of the flight indicated the average wind south of Coffs Harbour was 25 kt from the north‑north‑west at 2,000 ft.
Mean Sea Level Pressure chart
The Mean Sea Level Pressure chart showed a trough and frontal system approaching the Williamtown area on the afternoon of the flight. These systems were moving west to east and had an associated tight pressure gradient.[22]
Williamtown TAF
The BoM provided an aerodrome forecast (TAF)[23] for Williamtown Airfield, located about 21 km to the west of the accident location. Due to the weather front passing through the area, the TAF was amended several times. An updated TAF for Williamtown was issued at 1534 and was valid from 1600 on the 6 September 2019 to 1600 the following day. The forecast conditions were:
wind 20 kt, gusting 35 kt from 320° with CAVOK[24] conditions
from 1600, moderate to severe turbulence below 5000 ft until 1800
from 1800:
wind 27 kt, gusting 48 kt from 290°, visibility 9,000 m in blowing dust with light showers of rain, cloud scattered 4,000 ft and broken cloud[25] at 12,000 ft
a 40 per cent probability of visibility reducing to 4,000 m in blowing dust until midnight
severe turbulence below 5,000 ft.
Williamtown Aerodrome warning
On the afternoon of the flight there were two aerodrome weather warnings in place for Williamtown. The weather warnings were valid from 1800 to 2200. The first warning released at 1306 was for wind gusts in excess of 41 kts. A later warning released at 1345 added visibility reduction in blowing dust to the wind gust warning.
Actual weather
The BoM provided a summary of the conditions in the area at the time of the accident and stated that broad scale severe turbulence was likely to have been present. A tight pressure gradient near the frontal system generated strong and gusty west to north-westerly winds. Generally, significant west to north-westerly wind crossing the mountains to the west of the Newcastle area would have caused mechanical turbulence in the area, particularly downwind of the ranges. Strong north westerly winds were observed following the passage of the trough (ahead of the front).
The Bureau of Meteorology (BoM) provided the ATSB with the SPECI[26] and METAR[27] data from Williamtown at the time of the accident (Table 1).
Table 1: Williamtown observations
Type
Time
Wind
Visibility (m)
Cloud
Temp (°C)
QNH (hPa)
SPECI
1745
310°, 15‑26 kt
9,999
SCT070, SCT078
30
997
METAR
1800
310°, 14 kt
9,999
BKN072
30
997
SPECI
1810
300°, 15‑29 kt
9,999
BKN070 OVC081
30
997
METAR
1830
290°, 19 kt
9,000
OVC072
29
997
Although SPECI and METAR reports indicated visibility in the area was unlimited, comments between Williamtown Approach and Tower controllers at 1753 made reference to visibility to be about 6‑7 km with dust. Also of note are the overcast cloud conditions from 1810.
The BoM also provided the ATSB with one-minute interval data recorded by the Williamtown Automatic Weather Station. The one-minute cloud data from Williamtown showed that the cloud cover started to build from 1728, was likely overcast by 1751 and considered as overcast by 1802.
Visibility at Williamtown reduced markedly from 35.7 km at 1742 to 8.34 km by 1811. SPECI reports are only issued when weather conditions fluctuate about or below specified criteria. Visibility reductions only trigger a SPECI when the visibility is below an aerodrome’s highest alternate minimum visibility or 5,000 m, whichever is greater. As such, the one-minute visibility data indicating 8.34 km was not low enough to trigger a SPECI.
Last light
For aviation purposes, night is defined as the period of darkness between the end of evening civil twilight (last light) and the beginning of the following morning civil twilight (first light). At last light, in ideal conditions, there will be enough light from the sun for large objects to be seen, but no detail.
Published last light[28] for the Anna Bay area, on the day of the accident was 1801, however the presence of cloud cover, dust and masking terrain to the west would have resulted in last light occurring earlier.
Additionally, although the moon was high on the horizon, with the lunar disc 52 per cent illuminated, any celestial lighting was likely obscured by the overcast conditions.
Data from a privately‑owned weather station located about 4 km to the north‑east of the accident site was provided to the ATSB. The data, which included ambient lighting levels, showed that by 1750, the ambient light had degraded to 19 lux[29], reducing to 4 lux by 1800. By 1820, the available light had reduced to zero. By comparison, at 1700 the lux level was 2,055 while in full daylight, the lux levels were about 10,750.
Once UVC passed Broughton Island various townships were present along the VFR coastal route that may have provided sources of lighting for the pilot’s reference (Figure 10).
Spatial disorientation
Spatial orientation defines the natural human ability to maintain body orientation and/or posture in relation to the surrounding environment (physical space) at rest and during motion. The FAA’s Medical Facts for Pilots provides the following:
Humans are designed to maintain spatial orientation on the ground. The three-dimensional environment of flight is unfamiliar to the human body, creating sensory conflicts and illusions that make spatial orientation difficult, and sometimes impossible to achieve. Statistics show that between 5 to 10 % of all general aviation accidents can be attributed to spatial disorientation, 90 % of which are fatal.
Spatial disorientation is defined by Benson (1999) as where ‘the pilot fails to sense correctly, the position, motion or attitude of the aircraft or of him/herself’ with respect to the ground. For pilots flying under the VFR, seeing the horizon is crucial for orientation of both the pilot’s sense of pitch and bank of the aircraft (Gibb et al, 2010). In conditions of low visibility where the horizon may not be visible to the pilot, they can become rapidly disorientated.
Spatial disorientation is also often simply described as an inability to determine ‘which way is up’, although the effects of disorientation can be considerably more subtle. It occurs when the brain receives conflicting or ambiguous information from the sensory systems. It is likely to happen in conditions in which visual cues are poor or absent, such as in adverse weather or at night. Spatial disorientation presents a danger to pilots, as the resulting confusion can often lead to incorrect control inputs and resultant loss of aircraft control.
Pilots obtain information about their orientation from:
The visual system (eyes), which can obtain information from a range of cues outside the aircraft and relevant flight instruments inside the aircraft
The vestibular system, which consists of the balance organs located in the inner The semicircular canals provide information about angular or rotational accelerations in the vertical (yaw), horizontal (pitch) and longitudinal (roll) axes, and the otolith organs provide information about linear accelerations
The somatosensory system, which includes a range of receptors in the muscles, tendons, joints and skin that sense gravity and other pressures on the Such perceptions are often known as the ‘seat of the pants’ aspect of flying.
The visual system generally provides about 80 per cent of a person’s raw orientation information, with the remainder provided by the vestibular and somatosensory systems, both of which are prone to misinterpretation and illusions during flight (Newman 2007). Although the visual system can overcome these limitations, the risk of spatial disorientation is significantly increased if the relevant visual cues are absent, ambiguous or not attended to.
Benson (1999) outlined that spatial disorientation would typically occur within 60 seconds of all visual cues being removed, while another United States study showed a loss of control by non‑instrument rated pilots would occur, on average, about 180 seconds after the loss of all visual cues (Bryan, Stonecipher, & Aron, 1954).
A range of factors can influence the extent to which a pilot may experience or be able to recover from spatial disorientation. Common factors include limited or ambiguous visual cues outside the cockpit, not directing sufficient attention to the flight instruments due to workload or distraction, and not being proficient in instrument flying skills.
The risk of experiencing spatial disorientation can be managed effectively in the absence of external visual cues by reference to suitable aircraft instrumentation. However, controlled flight by sole reference to cockpit instruments is a separate, and complex, learned skill from those skills associated with flight in visual conditions.
Newman (2007) reported that spatial disorientation is affected by
pilot factors such as fatigue, medication and workload
aircraft factors that include single pilot operations, the presence or otherwise of an autopilot or stability augmentation system, and serviceable cockpit instrumentation
operational factors, that include pressing on into instrument meteorological conditions[30] without an instrument rating
environmental factors that are related to time of day (flight after last light) and ambient weather conditions.
A further consideration is the likelihood that the lack of training and qualifications makes the day VFR‑rated pilot susceptible to spatial disorientation following the loss of visual cues when flying in dark night conditions.
Newman (2007) also commented on the inherent instability of a helicopter increasing pilot workload and the likelihood for spatial disorientation. The Flight Safety Australia (2015) article, Workload and Helicopters includes the following about piloting a helicopter.
Piloting a helicopter is a complex, continuous, multi-task operation…This means helicopter pilots face a high workload in day-to-day flying…Workload also varies temporarily, according to weather (IMC, wind/turbulence) and environment (terrain, obstacles, wires).
Compared to fixed wing aircraft, helicopters are dynamically unstable and require constant pilot input to maintain controlled flight (Fay, 1976; Prouty, 2004). Depending on design, they can be fitted with stability control systems or an autopilot to assist the pilot and reduce workload.
Vestibular system illusion
A false sensation of rotation is an illusion generated by the vestibular system involving the semicircular canals, that can lead to spatial disorientation and result in loss of control. It is commonly referred to as the ‘graveyard spiral’. The FAA’s Medical Facts for Pilots describes how under conditions of unreliable or unavailable visual references, the false sensation of rotation is:
…associated with a return to level flight following an intentional or unintentional prolonged bank turn. For example, a pilot who enters a banking turn to the left will initially have a sensation of a turn in the same direction. If the left turn continues (~20 seconds or more), the pilot will experience the sensation that the airplane is no longer turning to the left. At this point, if the pilot attempts to level the wings this action will produce a sensation that the airplane is turning and banking in the opposite direction (to the right).
If the pilot believes the illusion of a right turn (which can be very compelling), he/she will re-enter the original left turn in an attempt to counteract the sensation of a right turn. Unfortunately, while this is happening, the airplane is still turning to the left and losing altitude. Pulling the control yoke/stick and applying power while turning would not be a good idea–because it would only make the left turn tighter. If the pilot fails to recognize the illusion and does not level the wings, the airplane will continue turning left and losing altitude until it impacts the ground.
With appropriate training and experience, pilots who become disorientated when flying in compromised visual conditions are able to recognise illusions and utilise cockpit instruments to restore their orientation.
Related Occurrences
Between 2010 and 2019 the ATSB investigated 11 fatal accidents, involving aircraft flown after last light in dark night conditions, that resulted in a collision with water or terrain. Loss of control was a factor in five of them, with spatial disorientation found to have contributed to three of the five. Of the 11 accidents, five involved pilots who were qualified to fly an aircraft at night. Six of the accidents involved helicopters, two of which were flown by pilots who were qualified to fly at night. The remaining four accidents involved non-night qualified, day VFR‑rated pilots. Four related occurrences are presented below.
On the evening of 27 July 2011, the owner-pilot of a Robinson Helicopter Co. R22 helicopter, registered VH-YOL was conducting a local flight from Big Rock Dam to Brooking Springs homestead near Fitzroy Crossing, Western Australia. The pilot was reported missing, and the wreckage of the helicopter was located the following day, 14 km north-west of Fitzroy Crossing township. The helicopter was seriously damaged, and the pilot sustained fatal injuries. The ATSB found that the pilot was operating at night without the appropriate training or qualifications in a helicopter that was not suitably equipped.
On 15 August 2011, the pilot of a Piper PA‑28‑180 Cherokee aircraft, registered VH-POJ, was conducting a private flight transporting two passengers from Essendon to Nhill, Victoria under the VFR. The flight was arranged by the charity Angel Flight to return the passengers to their home location after medical treatment in Melbourne. Global Positioning System data recovered from the aircraft indicated that when about 52 km from Nhill, the aircraft conducted a series of manoeuvres followed by a descending right turn. The aircraft subsequently impacted the ground at 1820 Eastern Standard Time, fatally injuring the pilot and one of the passengers. The second passenger later died in hospital as a result of complications from injuries sustained in the accident.
The ATSB found that the pilot landed at Bendigo and accessed a weather forecast before continuing towards Nhill. After recommencing the flight, the pilot probably encountered reduced visibility conditions approaching Nhill due to low cloud, rain and diminishing daylight, leading to disorientation, loss of control and impact with terrain.
On 18 August 2011, an Aérospatiale AS355F2 (Twin Squirrel) helicopter, registered VH-NTV, was being operated under the VFR in an area east of Lake Eyre, South Australia. At about 1900 Central Standard Time, the pilot departed an island in the Cooper Creek inlet with two film crew on board for a 30-minute flight to a station for a planned overnight stay. It was after last light and, although there was no low cloud or rain, it was a dark night.
The helicopter levelled at 1,500 ft above mean sea level, and shortly after entered a gentle right turn and then began descending. The turn tightened and the descent rate increased until, 38 seconds after the descent began, the helicopter impacted terrain at high speed with a bank angle of about 90°. The pilot and the two passengers were fatally injured, and the helicopter was destroyed.
The ATSB found that the pilot probably selected an incorrect destination on one or both of the helicopter’s global positioning system (GPS) units prior to departure. The ATSB concluded that, after initiating the right turn at 1,500 ft, the pilot probably became spatially disoriented. Factors contributing to the disorientation included:
dark night conditions
high pilot workload associated with establishing the helicopter in cruise flight and probably attempting to correct the fly-to point in a GPS unit
the pilot’s limited recent night flying and instrument flying experience
the helicopter not being equipped with an autopilot.
On 7 April 2016, the pilots of two Robinson R22 helicopters flew from Mossman, Queensland, to various fishing locations to the north with a passenger in each helicopter. Late in the afternoon, on the return flight to Mossman the pilots encountered weather and winds that slowed their progress and required them to refuel at Cooktown. The pilots departed Cooktown at last light and as the flight progressed, the light available from the sun continued to decrease and there was no moon. There were also patches of cloud and rain in the general area.
Shortly after passing Cape Tribulation, in dark night conditions one of the helicopters registered VH-YLY, collided with the sea. The passenger was injured in the accident but was able to reach the shore and notify emergency services. A search was initiated and the missing helicopter was located about 400 m offshore in about 10 m of water. The pilot was not located. The ATSB found that the pilot of VH-YLY, who was only qualified to operate in day VFR conditions, departed on a night flight and continued towards the destination in deteriorating visibility until inadvertently allowing the helicopter to descend into water.
While on a positioning flight to Bankstown, New South Wales, Bell Helicopter Company UH-1H registered VH‑UVC entered a descending turn, about 12 minutes after last light, resulting in a collision with water near Anna Bay, New South Wales.
The pilot was not qualified, and the helicopter was not equipped, to operate at night. At the time of the accident, dark night conditions and moderate to severe turbulence were likely present. No evidence was found of a mechanical defect with the helicopter that may have contributed to the accident.
The following analysis will discuss the continuation of the flight after last light, and the reasons for the subsequent loss of control. The analysis also considers the pilot’s medical history.
Flight after last light
Due to the departure time from Archerfield Airport, and the need to refuel enroute, there was insufficient time to reach Bankstown before published last light. Considering the prevailing weather conditions, last light probably passed prior to the published end of evening civil twilight, as the helicopter approached Broughton Island.
Recognising that the pilot could have identified prior to departing Coffs Harbour that the flight could not be completed in daylight, given the inherent utility of a helicopter, there were also opportunities to land at a beach, or other suitable areas, prior to reaching Broughton Island. After this point, the pilot would have required suitable ground lighting to avoid obstacles during landing. An option available to the pilot at this point was to contact Williamtown air traffic control for assistance and a possible landing at Williamtown Airfield.
The pilot’s decision to continue the flight at night may have been influenced by self-induced pressure to complete the flight for business and personal reasons. It is also possible that plan‑continuation bias influenced the pilot’s decision. As the flight passed the halfway point and progressed closer to the destination the pilot may have become increasingly committed to continuing with the original plan. Consequently, deciding to turn back or divert may have become increasingly difficult.
Loss of visual cues
As the flight progressed after last light visual cues may have been available to the pilot from ground‑based lighting close to the aircraft’s track and there may have been a horizon or silhouette of terrain to the west.
However, about 10 minutes after published last light UVC commenced a left turn, departed the coastal route, and tracked offshore. The position of the helicopter at this point was about 2 km to the west of Anna Bay. As the helicopter tracked over a featureless sea with overcast conditions blocking out celestial lighting, the pilot likely lost any remaining visual cues and encountered dark night conditions.
Loss of control
Flight profile
The aircraft’s flight path after last light showed increasing variations in track and altitude. Considering that turbulent conditions were likely present for the whole flight from Coffs Harbour it is likely that the reduced visual cues encountered by the pilot affected their ability to control the helicopter.
UVC’s track following the turn offshore was aligned with a direct track to Bankstown and was inside the Williamtown military control zone, which shared a lateral boundary with the R578A restricted area. As such, it is likely that the pilot was attempting to track directly to Bankstown, rather than follow the R578A restricted area boundary as previously requested.
From 1812:55 UVC entered a descending and tightening left spiral turn. Information derived from ADS-B data indicated that between UVC’s last two recorded positions the helicopter’s descent rate was in excess of 11,500 feet per minute and the aircraft’s airspeed was in excess of 150 kt. The magnitude of those parameters significantly exceeded the operational limitations published in the Operator’s Manual and, together with the characteristic spiralling turn, supported a loss of control of the helicopter at that point.
Helicopter systems assessment
Compression damage to the tailboom driveshaft cover was consistent with the upper surface of the tailboom impacting the ocean surface. Further, witness marks on the driveshaft cover indicated that the tail rotor drive train was stationary at the time of impact. However, there was also physical damage consistent with rotation and continuity of the tail rotor drive train. As such, it was considered likely that the tailboom detached from the helicopter prior to impact, decoupling the tail rotor drive and allowing the boom to rotate to an inverted position prior to impact.
Considering that the loss of control commenced about 1.2 km from the wreckage field and the tailboom was found only about 51 meters away from the main wreckage of the helicopter, it is likely the tailboom separation from the helicopter occurred very close to the helicopter’s impact point and did not contribute to the loss of control.
The vertical fin and synchronised elevators detached from the tailboom and were not identified in underwater wreckage imagery provided to the ATSB. From the available information, it was not possible to determine when these components separated from the tailboom. However, as there was no evidence of pre-existing defects, it is considered more likely that they separated in the final moments due to the forces associated with contacting the water or as a result of dynamic loading effects associated with flight in turbulent conditions at very high airspeed.
The ATSB considered whether a system failure or malfunction influenced the development of the accident. Due to the location and condition of the wreckage the ATSB was unable to examine the helicopter’s powerplant, rotor and flight control systems. As a result, the helicopter’s flight path after 1812:55 was analysed in order to determine if it was consistent with a system fault.
The three possible faults considered were a loss of drive to the main rotor, loss of thrust from the tail rotor or loss of hydraulic power. The Operator’s Manual advised that in the event of a loss of drive to the main rotor system an autorotational descent is required. A loss of tail rotor thrust or failure of the hydraulic system requires the pilot to maintain an airspeed above 30‑70 kt and to position the aircraft for a run on landing at a suitable flat location.
The left turn initiated at 1812:55 was inconsistent with a track to a suitable landing site due to the proximity of Stockton beach to the right of the helicopter’s track and a mayday call was not made, as would be expected in this situation. In addition, the helicopter’s airspeed prior to 1812:55 was above that required to counter both a loss of tail rotor drive and hydraulic failure.
The airspeed and descent rate were also inconsistent with an autorotational descent or approach to a suitable landing site. It is therefore considered likely that the aircraft control and propulsion systems were serviceable and did not compromise the operation of the helicopter.
Spatial disorientation
When the pilot turned offshore near Anna Bay it is likely that the absence of celestial lighting and ground references resulted in dark night conditions being encountered. In addition, moderate to severe turbulence was likely present. The lack of external visual cues would have required the pilot to reference the aircraft’s flight instruments to maintain control of the helicopter.
The primary instrument for maintaining control, or to recover from an unusual attitude, is the attitude indicator. In UVC the pilot’s attitude indicator was not available to the pilot due to the location of a tablet on the instrument panel. The tablet was not located in the wreckage, as a result the screen brightness settings and their potential influence on the pilot’s night vision could not be determined.
A second attitude indicator was located on the left side instrument panel however, it would have been difficult for a pilot with no instrument training to effectively use that instrument given its cross‑cockpit position.
The pilot was not trained or experienced in maintaining control of the helicopter with sole reference to the flight instruments. Research has shown that pilots not proficient in maintaining control of an aircraft with sole reference to the flight instruments will become spatially disorientated and lose control of the aircraft within 1 to 3 minutes after visual cues are lost.
The helicopter’s inherent instability coupled with the turbulence conditions and lack of an auto pilot probably made it more difficult to control UVC and may have increased the pilot’s susceptibility to spatial disorientation. In addition, the pilot’s reduced sleep opportunity the night before the accident, the elapsed flight time since departure from Archerfield and the workload associated with the turbulent conditions may have increased their level of fatigue, increasing the likelihood of disorientation.
The helicopter’s spiralling descent flight profile after 1812:55 was consistent with spatial disorientation influenced by limitations of the vestibular system and absence of visual cues. The absence of external visual references also prevented the pilot from regaining control of UVC before it collided with the water.
Reporting of medication and medical conditions to the Civil Aviation Safety Authority
To assess and manage flight safety risk, the Civil Aviation Safety Authority (CASA) uses Designated Aviation Medical Examiners (DAMEs) as a point of contact for pilots renewing their medical certificates. The renewal process relies on self-reporting by the pilot of any medical conditions or treatments. Specifically, pilots are required to advise their DAME, and ultimately CASA, of any medications, medical procedures, medical conditions or symptoms that required the assessment a medical specialist.
The pilot, who was under the care of a non‑aviation medical specialist in the month prior to their most recent medical certificate renewal process, did not disclose to their DAME the medical conditions that were being treated nor details of the medications that were prescribed.
The pilot’s treating specialist reported that the sedating characteristics of the prescribed medications were known, and the dosages were carefully monitored, albeit based on pilot self‑reports. The specialist further reported that the dosage was appropriate for the pilot and did not impact on the pilot’s decision-making ability or physical functioning.
While the specialist’s clinical assessment was not in question, the input of CASA aviation medicine specialists was necessary to determine whether the pilot remained eligible to be issued with an aviation medical certificate.
Pathways exist for managing certain medical conditions that do not preclude a pilot from maintaining an aviation medical certificate. However, disclosure of medical information is essential to enable CASA to manage any on-going flight safety risk for both the individual and flight safety overall.
Findings
From the evidence available, the following findings are made with respect to the collision with water involving Bell UH-1H helicopter, VH-UVC, 5 km south-west of Anna Bay, New South Wales, on 6 September 2019. These findings should not be read as apportioning blame or liability to any particular organisation or individual.
Contributing factors
The pilot continued to fly after last light without the appropriate training and qualifications, and then into dark night conditions that provided no visual references. That significantly reduced the pilot's ability to maintain control of the helicopter, which was not equipped for night flight.
The pilot likely became spatially disorientated, resulting in a loss of control and collision with water.
Other factors that increased risk
The pilot did not disclose on-going treatment for significant health issues to the Civil Aviation Safety Authority. That prevented specialist consideration and management of the on‑going flight safety risk the medical conditions and prescribed medications posed.
Sources and submissions
Sources of information
The sources of information during the investigation included:
Aireon
Airservices Australia
Bureau of Meteorology
Civil Aviation Safety Authority
FlightRadar24
maintenance organisation for VH-UVC
medical and air traffic control specialists
New South Wales police service
OzRunways
a number of witnesses
References
ATSB (2013), Avoidable Accidents No. 7. Visual flight at night accidents: What you can’t see can still hurt you, ATSB, Canberra, Australia.
Batt, R, and O’Hare, D (2005), General Aviation Pilot Behaviours in the Face of Adverse weather, Australian Transport Safety Bureau, Aviation Research Investigation Report B2005/0127.
Benson, A (1999) Spatial disorientation – general aspects. In J Ernsting, AN Nicholson, DJ Rainford (Eds.) Aviation medicine. Butterworths & Co. Ltd, London:
Bryan L, Stonecipher J, and Aron K (1954) 180-degree turn experiment, 54(11):1-52, University of Illinois Bulletin.
Dismukes, RK, Berman BA and Loukopoulos LD (2007), The limits of expertise: Rethinking pilot error and the causes of airline accidents, Ashgate Publishing Limited, Hampshire, England
Fay, J (1976), The Helicopter. History, Piloting and How it Flies, David and Charles, London.
Federal Aviation Administration (2019), Helicopter Flying Handbook, U.S. Department of Transportation, FAA-H-8083-21B
Federal Aviation Administration, Medical facts for pilots,AM-400-03/1, Civil Aerospace Medical Institute
Flight Safety Australia (2015), Workload and helicopters, Civil Aviation Safety Authority, Australia,
Newman DG (2007), An overview of spatial disorientation as a factor in aviation accidents and incidents, Australian Transport Safety Bureau, Aviation Research and Analysis Report B2007/0063.
NTSB (1994), A review of flight crew involved, major accidents of U.S. air carriers, 1978 through 1990, NTSB/SS-94/01, Washington, D.C. 20594
Prouty RW (2004), Helicopter Aerodynamics, Eagle Eye Solutions, Lebanon, USA.
Flight Safety Foundation (1997), ‘Inadequate visual references in flight pose threat of spatial disorientation’, Human Factors & Aviation Medicine, 44(6).
Submissions
Under section 26 of the Transport Safety Investigation Act 2003, the ATSB may provide a draft report, on a confidential basis, to any person whom the ATSB considers appropriate. That section allows a person receiving a draft report to make submissions to the ATSB about the draft report.
A draft of this report was provided to the following directly involved parties:
medical specialists
Bureau of Meteorology
Civil Aviation Safety Authority
maintenance organisation for VH-UVC
Williamtown air traffic controllers
air traffic control specialist.
Submissions were received from:
Bureau of Meteorology
a medical specialist
The submissions were reviewed and, where considered appropriate, the text of the report was amended accordingly.
Purpose of safety investigations & publishing information
Purpose of safety investigations
The objective of a safety investigation is to enhance transport safety. This is done through:
identifying safety issues and facilitating safety action to address those issues
providing information about occurrences and their associated safety factors to facilitate learning within the transport industry.
It is not a function of the ATSB to apportion blame or provide a means for determining liability. At the same time, an investigation report must include factual material of sufficient weight to support the analysis and findings. At all times the ATSB endeavours to balance the use of material that could imply adverse comment with the need to properly explain what happened, and why, in a fair and unbiased manner. The ATSB does not investigate for the purpose of taking administrative, regulatory or criminal action.
Terminology
An explanation of terminology used in ATSB investigation reports is available here. This includes terms such as occurrence, contributing factor, other factor that increased risk, and safety issue.
Publishing information
Released in accordance with section 25 of the Transport Safety Investigation Act 2003
Ownership of intellectual property rights in this publication
Unless otherwise noted, copyright (and any other intellectual property rights, if any) in this report publication is owned by the Commonwealth of Australia.
Creative Commons licence
With the exception of the Coat of Arms, ATSB logo, and photos and graphics in which a third party holds copyright, this publication is licensed under a Creative Commons Attribution 3.0 Australia licence.
Creative Commons Attribution 3.0 Australia Licence is a standard form licence agreement that allows you to copy, distribute, transmit and adapt this publication provided that you attribute the work.
The ATSB’s preference is that you attribute this publication (and any material sourced from it) using the following wording: Source: Australian Transport Safety Bureau
Copyright in material obtained from other agencies, private individuals or organisations, belongs to those agencies, individuals or organisations. Where you wish to use their material, you will need to contact them directly.
On 20 August 2019 a Regional Express, Saab Aircraft Company 340B, registration VH-ZLX, departed Adelaide, for a regular public transport flight to Port Lincoln, South Australia. During the post flight walk around, the first officer noted that the left main outboard landing gear tyre was deflated and that a piece of the wheel was missing.
Ground support personnel at Adelaide Airport subsequently located the missing section of wheel on the runway strip.
What the ATSB found
An area of fatigue cracking had initiated in the bead seat region of the wheel and progressed 86 mm around the circumference prior to final overstress fracture. Information obtained from the manufacturer and a previous ATSB investigation indicated that fatigue cracking of the bead seat area in this wheel type was a known issue with previously updated maintenance schedules and practices.
It was considered likely that the fatigue crack was present at the most recent maintenance visit, however, it had not been detected. Insufficient guidance in the operator’s maintenance procedures meant that inspections required by the component maintenance manual that might have identified the developing fatigue crack were not carried out.
What's been done as a result
The operator advised that, as a result of this incident, they have implemented new measures to prevent a recurrence. These include:
Updating wheel maintenance procedures to ensure that non normal inspections are identified and carried out.
Making the component maintenance manual for tyres more readily available to personnel by adding it to their engineering website.
Providing additional advisory material to maintenance personnel on the requirements of completing unserviceable tags to ensure that other maintenance personnel performing subsequent work fully understand the defect.
Providing additional training to personnel on wheel maintenance techniques.
Safety message
When situations or issues arise that do not fit into standard operating procedures, maintenance personnel should always be prepared to consult or request further guidance. This guidance can come from internal support materials, such as procedures, or external materials such as maintenance manuals or the manufacturer.
The occurrence
What happened
At approximately 1935 Central Standard Time[1] on 20 August 2019, a Regional Express, Saab Aircraft Company 340B, registration VH-ZLX (ZLX), departed Adelaide, South Australia for a regular public transport flight to Port Lincoln, South Australia. This was the last flight of the day for the aircraft and there were two flight crew, one cabin crew and 14 passengers on board. Following the landing in Port Lincoln, the first officer conducted an external inspection of the aircraft and noticed that the left main outboard landing gear tyre was deflated.
The crew reported no issues with aircraft handling during the take-off, landing or taxi phases of the flight. Additionally, none of the crew or passengers advised of any vibration or unusual noises during the flight.
On closer inspection of the wheel, the first officer noted that a piece of the wheel rim was missing (Figure 1). Ground staff were notified and the Port Lincoln aerodrome reporting officer (ARO) was contacted to conduct a runway inspection. The ARO’s inspection did not reveal any foreign object debris or damage to the runway.
The following morning, the operator dispatched engineers to replace the wheel and brake assembly. They informed the flight crew that the missing piece of wheel had been located on the runway strip at Adelaide Airport.
Context
Incident wheel history
The incident wheel was manufactured in 1995 and acquired by the operator in 2007. Since then, it had undergone 42 tyre changes, and 8 overhauls, the most recent of which was in October 2018. In the 10 months between this overhaul and the occurrence, it had accumulated 943 flight cycles on five different Saab 340B aircraft (Table 1).
The wheel’s removal from the first three aircraft was for routine tyre changes, with the tyres being worn to limit (WTL). Following its removal, the wheel was transported to the operator’s maintenance facility, inspected in accordance with the operator’s process, signed off as serviceable and returned to storage before transport and fitment to the next aircraft.
The removal from the fourth aircraft was due to a flat tyre. During a routine post flight inspection on 16 July 2019 the wheel was identified to be audibly leaking, maintenance personnel were notified and reported that when they arrived, the tyre was flat. As a result, both wheels in the set[2] were removed from the aircraft. The operator reported that prior to the occurrence flight the tyre pressure had been checked with a pressure gauge and was at the appropriate operating pressure before departure.
Table 1: Incident wheel maintenance history since previous overhaul
Date
Aircraft
Reason for removal
Cycles since wheel installation
Cycles since wheel overhaul
11-10-2018
Wheel overhaul
N/A
0
21-12-2018
VH-ZLJ
Tyre change (WTL)
276
276
13-04-2019
VH-OLL
Tyre change (WTL)
230
506
21-06-2019
VH-ZXQ
Tyre change (WTL)
340
846
16-07-2019
VH-ZXK
Flat tyre
94
940
21-08-2019 (occurrence)
VH-ZLX
Wheel failure
3
943
Source: Operator
Following removal of the wheel in July 2019, an ‘unserviceable’ tag was attached, and the wheel was returned to the operator’s maintenance facility. A standard tyre change form with the word ‘Repair’ hand‑annotated at the top of the form was used to document the maintenance. The form indicated that the following items were completed.
‘General wheel check and inspection admin’
valve subassembly reinstallation and the wheel inflation
the post-inflation leak test[3], which found no evident leak.
Other items listed on the form, including visual inspection and non-destructive testing, were not performed as they were marked as ‘N/A’.
Following the leak check, the wheel was inflated to the recommended storage pressure and stored at the operator’s maintenance facility for approximately 1 month. On the day of the occurrence, the wheel was fitted to ZLX, and the aircraft conducted three flight cycles[4] before the rim section separated at Adelaide Airport.
Wheel examination
Following the incident, the wheel and tyre assembly, including the recovered segment, were provided to the ATSB for inspection.
Initial inspections revealed that a section of the rim, comprising approximately one-half of the wheel’s circumference, had broken away with the fracture extending through the bead seat. The tyre had been damaged in the area of the fracture, with exposed steel reinforcing and some fractured wires. The tyre had folded over the fractured section of the rim and was caught on the edge of the rim (Figure 1).
Figure 1: Wheel in as-received condition
Source: ATSB
The tyre was removed, and the wheel disassembled to allow access to both sides of the fracture surface. The fracture followed a radial path through the wheel rim bead seat area (Figure 2).
Figure 2: Cross-section diagram of the wheel hub showing the location of the fracture
Source: Manufacturer, annotated by the ATSB
Beach‑marks consistent with fatigue crack progression were evident across both faces of the fracture surface (Figure 3 and 4). These markings extended radially from the internal bead seat radius surface towards the centre of the exposed fracture face. The beach-marks extended circumferentially around the rim for approximately 86 mm. While several potential fatigue initiation points were examined on both faces of the fracture, the exact origin could not be determined. The outer surfaces of the fracture, beyond the area of fatigue, were dull grey in colour and rough/fibrous in appearance. These features were consistent with a ductile overstress failure in a heat-treated aluminium alloy.
Figure 3: Excised portion of wheel rim with fatigue area highlighted
Source: ATSB
Figure 4: Magnified view of fatigue area showing crack progression along the bead seat and evidence of tyre contamination on the fracture surface
Source: ATSB
There was also black discolouration on the fracture surface. This was determined to be rubber debris from the tyre when it had been caught over the rim.
Scanning electron microscopy of the fracture surface revealed a relatively smooth fracture with evidence of non-uniform stepwise crack formation (Figure 5). This was further indication of a fatigue crack propagation through the material. Due to the non-uniform nature of the steps, it could not be determined how many cycles of fatigue had occurred before the overstress fracture.
Figure 5: Area of fatigue surface showing step-wise crack formation
Source: ATSB
The examinations did not locate any corrosion or pre-existing manufacturing defects. Externally, there was no significant surface or mechanical damage to the fractured rim.
Wheel design
The wheel, serial number AUG 95-1523, was a part number (P/N) 5010488 main wheel assembly manufactured by the Aircraft Braking Systems Corporation (ABSC), now Meggitt Aircraft Braking Systems (MABS) in August 1995. The wheels were for use on a range of fixed and rotary wing aircraft including the Saab 340B.
Following a number of in‑service failures, in August 1994 ABSC identified an issue with the design of these wheels. These failures were attributed to fatigue crack development in the bead seat region of the wheel.
In order to ensure that cracks were detected prior to wheel failure, the manufacturer issued a service bulletin SF340-32-24, ‘SAAB 340 Main Wheel Sub Assembly 5009327 and 5009327-1’, which revised the required inspection and maintenance procedures for this wheel-type. The changes included non-destructive inspection, either eddy current or ultrasonic, at a series of locations around the wheel at each tyre change.
The inspection schedule for these wheels was introduced by service letter (SL) SL-GS-36.[5] The SL indicated that overhauls should be performed at maximum intervals of five tyre changes, or 1,500 flight cycles, whichever occurred first, nominally introducing an interval of approximately 300 flight cycles between each eddy current inspection. That interval was consistent with the maintenance history of the failed wheel.
In December 1995, the manufacturer released an updated design (P/N 5010488-1) that included additional reinforcement in the bead seat region. Figure 6 and 7 show the differences between the two designs. The new design could not be retrofitted to existing wheels. The manufacturer’s advice to operators in the service bulletin that introduced the new design (Saab 340-32-41) was that the older wheels (serial number OCT95-1606 and earlier) could be used until stock depletion, provided the necessary maintenance and inspection standards detailed in SL‑GS‑36 were maintained.
Figure 6: Diagrams showing the difference in the original and revised wheel designs
Source: Manufacturer modified by the ATSB
Figure 7: Example of the difference between the old and new wheel designs
Source: ATSB
The manufacturer advised that they were not aware of any in service failures in the last 10 years and could not determine how many of the older wheel designs remained active, as they were not alerted to removal of wheels from service. The ATSB also reviewed defect reporting service (or equivalent) databases of the Civil Aviation Safety Authority, the United States Federal Aviation Administration and Transport Canada (Canadian Regulatory Authority) for reports of wheel failures. The jurisdiction of these agencies covers the majority of the aircraft with this wheel type. That review identified four reported wheel failures in the last 20 years and none in the last 10 years.
A search of the operator’s engineering database showed 38 wheels of the older design remained active in their fleet. In the 10 years prior to this occurrence, the operator has experienced one other in-service failure on their aircraft (see the section titled Previous occurrence) and 69 wheels of this type have been removed from service. It could not be determined if the removal of these wheels from service was due to the presence of fatigue cracks, as this level of detail was not recorded in the engineering database.
Component maintenance procedures
The component maintenance manual (CMM) outlined a range of different maintenance tasks that were to be carried out on this type of wheel (both the original and updated designs). It stated that, with the exception of the overhaul requirements already outlined, wheels were an ‘on condition’[6] part.
Three key procedures given in the CMM were for tyre change, overhaul and special cases.
Tyre change
The tyre change procedure was carried out when a tyre was worn to its tread limit. This involved recording the details about the wheel, dismantling the removable flange, removing the worn tyre, conducting a detailed visual inspection of the whole wheel assembly and non-destructive (eddy current or ultrasonic) inspection of specific areas.
Overhaul
At an overhaul, wheels had to undergo a full tyre change inspection plus eddy current, ultrasonic or fluorescent penetrant inspection of the whole wheel.
Special cases
‘Special cases’ inspections were required when the tyre had been operated with a flat or damaged tyre, or when the mating wheel[7] has been operated with a flat tyre.
In the case of a wheel operated with a flat tyre, the CMM required that the wheel undergo a careful visual inspection for damage, and a roundness check to ensure that the wheel was still circular. If the wheel was out of a specific tolerance, then it was to be replaced. There was no requirement for the wheel to undergo any non-destructive inspection in this process.
Operator’s maintenance process
The operator provided maintenance personnel with two different forms for carrying out the routine maintenance on wheels of this type, one for overhaul and another for tyre changes. The two forms specified the required tasks (as detailed in the CMM), and a location for each task to be signed off.
At the time of the occurrence, neither of these forms required personnel to confirm the reason for the tyre removal or if any additional maintenance actions, such as those outlined in the ‘special cases’ section, were required. There was no form for the special cases procedures.
A review of maintenance documentation indicated that non‑destructive inspections were carried out during the last overhaul of the occurrence wheel and during each subsequent tyre change conducted prior to the wheel failure. No cracking was identified during any of those inspections.
On 6 February 2009, a Regional Express Saab340B aircraft, registered VH-KDQ, landed at Sydney Airport following a regular public transport flight from Orange, New South Wales. During the post-flight inspection, the crew noted that that the aircraft’s left main outboard landing gear wheel was deflated and had sustained damage. Closer inspection by maintenance personnel revealed that a section of the wheel had fractured but remained attached to the wheel assembly.
The ATSB’s examination of the wheel found that it had failed due to a fatigue crack that had developed within the bead seat after initiating in the transition radius.
The failed wheel was a part 5010488 main wheel assembly manufactured by ABSC, serial number SEP92-0621 and, as discussed in the Wheel Design section, was more susceptible to this type of failure. The investigation reviewed the safety actions that had previously been put in place by both the manufacturer and the operator, finding them to be satisfactory.
Safety analysis
Component failure
Failure of the left main outboard landing gear wheel from Saab 340B aircraft, VH-ZLX, was a result of the fracture and separation of a section of the inner wheel rim adjacent to the tyre bead seat. The cracking and fracture was typical of a progressive fatigue cracking mechanism, which had initiated on the internal bead seat transition radius. In conventional pneumatically pressured wheel designs, the internal bead seat radius is typically a region of high bending stresses. As such, it is pre-disposed to the initiation and growth of fatigue cracking. Operational stresses arising from tyre flexure during taxi and landing can further contribute to this failure mechanism.
The bead seat radius fatigue cracking was a known issue with wheels of the original ABSC P/N 5010488. To improve the reliability of these wheel assemblies, the wheel manufacturer introduced updated inspection methods and tyre change or cycle limits between overhauls. To further address the issue, a revised wheel design (P/N 5010488-1) with features that strengthened the bead seat region of the wheel aimed at preventing fatigue failures was introduced. The failed wheel from VH-ZLX was of the original design.
Wheel inspection and crack development
Each time the non-destructive testing was conducted at a tyre change, no cracks were identified, and the wheel remained in service. Two scenarios were identified that could have accounted for the presence of the fatigue crack that initiated the failure:
the initiation and growth of the crack occurred rapidly, with the crack developing in the time since the last non-destructive inspection was carried out, or
a crack had initiated at the time of the last non-destructive inspection and was not detected.
The ATSB was not able to determine the crack growth rate that occurred in the wheel rim from the fracture surfaces. While rapid crack development could not be conclusively ruled out, for the following reasons the ATSB considered it probable that a crack had been present at the time of the last non‑destructive inspection but had not been detected:
The relatively large size of the fatigue area (86mm), compared to the relatively low number of flight cycles that had occurred (97) since the last eddy current inspection.
The nominal interval between eddy current inspections was 300 flight cycles, however, this failure occurred well before the next inspection was due. The very small number of reported failures in this wheel type in last 10 years indicated that the inspection interval generally appears adequate to capture cracks before they progressed to failure in service.
While it was possible that the wheel was operated for a short time with lower than recommended tyre pressure which could have influenced the crack growth rate, it was considered unlikely that it increased the growth rate enough to cause failure at one third of the nominal inspection interval.
Available forms
When the wheel was presented to the wheel bay following its removal from VH-ZXK, the personnel involved utilised the standard tyre change form to complete the inspection, noting on the form that this was not a standard tyre change, rather a ‘Repair’. Utilising the tyre change form, personnel signed for the ‘general wheel check and inspection admin’ task. This task did not include a visual inspection, as it was listed as a separate item on the form. When reinflated, the tyre retained pressure for the required 24 hours and so the tyre was not changed. As a result, a complete tyre change inspection, including non‑destructive inspection, was not performed.
As the wheel had been operated with a flat tyre, even if for a short time, it should have undergone the additional inspections outlined in the ‘Special cases’ section of the CMM. However, the documentation that maintenance personnel used did not identify this as a requirement, nor did it direct them to the CMM for further guidance in non-standard cases.
The ‘Special cases’ section of the CMM required a detailed visual inspection and roundness check to be carried out. The ATSB was unable to determine whether either of these inspections could have identified the crack. However, they would have been opportunities to determine that something was out of place and prompt further investigations. Although not required as part of the ‘Special cases’ section, had the wheel been subject to non-destructive inspection, the crack would have almost certainly been detected.
Findings
These findings, related to the landing gear wheel failure of Regional Express Saab 340B VH-ZLX, should not be read as apportioning blame or liability to any particular organisation or individual.
A fatigue crack initiated at the bead seat and led to the failure of the left outboard main landing gear wheel.
This wheel design was susceptible to fatigue cracking in the bead seat region.
It is probable that a fatigue crack was present at the time of the last non-destructive eddy current inspection but not detected.
The operator’s wheel maintenance forms did not adequately convey the inspection requirements for wheels operated with flat tyres. Subsequently, when the flat tyre was detected and the wheel brought in for maintenance, inspections that may have detected the crack were not carried out.
Safety action
Whether or not the ATSB identifies safety issues in the course of an investigation, relevant organisations may proactively initiate safety action in order to reduce their safety risk. The ATSB has been advised of the following proactive safety action.
Aircraft operator
The aircraft operator has advised the ATSB that in response to this incident they have updated several of the forms used for carrying out wheel maintenance. The forms now include additional steps to identify and treat wheels that fall into the ‘Special cases’ categories of the CMM and to ensure that all wheels in these categories undergo non-destructive inspection.
Additionally, they have made the tyre CMM more readily accessible to maintenance personnel, and disseminated advisory materials to ensure that the reason wheels are removed from service is correctly annotated on the unserviceable documentation. They have also provided retraining for a number of their staff in the correct wheel maintenance procedures.
Purpose of safety investigations
The objective of a safety investigation is to enhance transport safety. This is done through:
identifying safety issues and facilitating safety action to address those issues
providing information about occurrences and their associated safety factors to facilitate learning within the transport industry.
It is not a function of the ATSB to apportion blame or provide a means for determining liability. At the same time, an investigation report must include factual material of sufficient weight to support the analysis and findings. At all times the ATSB endeavours to balance the use of material that could imply adverse comment with the need to properly explain what happened, and why, in a fair and unbiased manner. The ATSB does not investigate for the purpose of taking administrative, regulatory or criminal action.
Terminology
An explanation of terminology used in ATSB investigation reports is available here. This includes terms such as occurrence, contributing factor, other factor that increased risk, and safety issue.
Publishing information
Released in accordance with section 25 of the Transport Safety Investigation Act 2003
Ownership of intellectual property rights in this publication
Unless otherwise noted, copyright (and any other intellectual property rights, if any) in this report publication is owned by the Commonwealth of Australia.
Creative Commons licence
With the exception of the Coat of Arms, ATSB logo, and photos and graphics in which a third party holds copyright, this publication is licensed under a Creative Commons Attribution 3.0 Australia licence.
Creative Commons Attribution 3.0 Australia Licence is a standard form licence agreement that allows you to copy, distribute, transmit and adapt this publication provided that you attribute the work.
The ATSB’s preference is that you attribute this publication (and any material sourced from it) using the following wording: Source: Australian Transport Safety Bureau
Copyright in material obtained from other agencies, private individuals or organisations, belongs to those agencies, individuals or organisations. Where you wish to use their material, you will need to contact them directly.
On the evening of 29 August 2019, a Regional Express Saab 340B, registered VH-RXX, departed Moruya, New South Wales. The aircraft was performing a scheduled passenger service to Merimbula, New South Wales. At the time, the aircraft’s right engine was being monitored for high oil consumption.
Soon after top of climb, the flight crew received an engine fire indication from the right engine. While conducting the engine fire checklist, the engine surged and then failed. A cabin crew member reported seeing a brief flash of light from the right side of the aircraft. The flight crew then shut the engine down.
Based on the close proximity to the destination, the flight crew decided to continue to Merimbula Airport. The aircraft landed without incident at about 1950.
What the ATSB found
The engine failed as a result of an internal oil fire, which weakened a turbine disk and resulted in turbine blades being released. The fire occurred when oil leaked from an oil sump due to carbon deposits, known as coking, within that oil sump. The coking was most likely due to either the component not being completely clean when installed at the last major overhaul and/or accelerated coking on the component.
What's been done as a result
The engine manufacturer has enhanced the troubleshooting procedures to identify internal engine oil leaks more effectively and developed enhancements to the overhaul facility cleaning procedure for the affected oil sump.
Safety message
This incident highlights the importance, when piloting multi-engine aircraft, of maintaining the ability to operate with one engine inoperative. Aircraft turbine engines are complex, and can fail for reasons that are rare and difficult to identify prior to the failure. In this occurrence, the maintainers had followed the correct troubleshooting procedure but were unable to determine the reason for the high oil consumption. The crew’s skill and knowledge, however, along with the built-in redundancies of the system ensured the overall safety of the flight.
The occurrence
What happened
At 2000 Eastern Standard Time[1] on 29 August 2019, a Regional Express Saab 340B, registered VH-RXX, departed Moruya, New South Wales. The aircraft was performing a scheduled passenger service to Merimbula, New South Wales. The flight was expected to take about 20 minutes.
Approximately 8 minutes into the flight, and shortly after levelling off at an altitude of 9,000 ft, the flight crew received an engine fire indication from the right engine. In response, they commenced the memory items[2] for the associated checklist. While conducting the first item on the checklist—reducing the power lever—they heard the engine surge and then produce a loud bang. The cabin crew member reported seeing a brief flash of light from the right side of the aircraft. The flight crew continued the Engine Fire checklist and subsequently shutdown the right engine.
Due to the close proximity to the destination, and with the aircraft already having been set up for the approach, the flight crew decided to continue to Merimbula Airport. A hold was established at a waypoint in order to allow the flight crew to complete all the required checklists, and to ensure the availability of emergency services at the destination.
At about 2040, the aircraft commenced the final approach to Merimbula. It landed without incident 7 minutes later.
A post-flight visual examination of the engine revealed that there were several small burn holes[3] in the power turbine (PT) case (Figure 1) and that the C-sump assembly and a section of the PT shaft were missing (Figure 2). The engine had previously undergone unscheduled maintenance for elevated oil consumption.
Figure 1: Right-hand view of engine with burn holes indicated
Source: GE – annotations by ATSB
Figure 2: Rear-view comparison of undamaged engine (left) and the occurrence engine missing the C-Sump Assembly (right)
Source: GE – annotations by the ATSB
Context
Engine information
The engines fitted to VH-RXX were General Electric (GE) CT7-9B turboprop engines. At the time of the occurrence, the right engine, serial number ESN 785398, had accumulated 37,854.4 hours and 42,877 flight cycles since new.
The CT7-9B consisted of a modular power unit and a propeller gearbox. The modular power unit comprised the:
cold section module – including the compressor and the midframe assemblies
hot section module – including the combustor and the gas generator turbine
power turbine module – transmitted power from the power turbine to the output shaft and into the propeller gearbox.
Located within the cold section module and part of the midframe assembly was the B-sump. This supplied oil to the bearing that supported the gas generator. A labyrinth seal[4] separated the B-Sump oil cavity and the B-sump air cavity (Figure 3). During normal operation, it was possible for oil to leak beyond the labyrinth seal and accumulate within the B-sump air cavity. A drain tube incorporated into the cavity was intended to direct any oil from the B-sump air cavity into the exhaust gas path. Another labyrinth seal separated the B-sump air cavity from the compressor discharge leakage pressure[5] (CDLP) air cavity. Oil was not intended to accumulate within the CDLP cavity.
Figure 3: Cross-section diagram of the CT7 – zoom showing the B-sump in relation to the CDLP air cavity and the PT stage 3 disk.
Source: CT-7 Training Manual – Annotated by the ATSB
Maintenance information
In May 2018, at 36,366.7 engine hours (41,144 cycles), 1,481 flight hours before the occurrence, a major work scope[6] was conducted on the cold section of the engine at an approved engine overhaul facility in the United Kingdom. The previous major work scope was conducted about 14,000 flight hours prior.
As part of that work scope, the midframe assembly (which included the B-sump) was replaced with a refurbished component. Prior to installation, the components were cleaned in accordance with the latest GE procedure. Due to the design of the midframe, there was no visual means to inspect the B-Sump oil cavity in order to confirm complete removal of any coking (see the associated section below). Assurance that the part was clean was provided by means of a repeated flushing technique until there was no further debris found on a filter within the fluid path.
On 30 May 2019, the maintainers began troubleshooting the engine for high oil consumption. The maintainers followed the most current manufacturer’s guidance for fault isolation of oil consumption issues but were unable to identify the cause of the oil consumption issue.
Manufacturer’s findings
GE reviewed all available flight and engine data from prior to the failure and found that the engine had been operated in accordance with their prescribed recommendations.
The engine was transported to the GE Strother facility in the United States for a teardown and detailed examination supervised by the National Transportation Safety Board. The examination found that:
the B-Sump oil cavity and the B-sump air cavity were heavily coked (Figure 4)
the B-Sump oil drain was coked and blocked at the time of disassembly
there was minor presence of coking and oil in the CDLP cavity
a number of the power turbine (PT) stage 3 disk blades had been released. Examination of the remaining disk post tangs showed elongation and hardness values consistent with a creep condition as a result of exposure to elevated temperatures.
Conclusions of the analysis were that heavy coke build-up in the B-sump oil cavity resulted in the sump flooding[7] and oil leaking into the B-sump air cavity. Due to the blocked B-sump air cavity oil drain tube, oil leaked into the CDLP air cavity. An oil fire then occurred in the CDLP air cavity and at the stage 3 outer diameter near the disk posts. This weakened the disk posts and resulted in several blades being released. The resulting imbalance caused the separation of the section of PT shaft and the C-sump.
Figure 4: The coking within the B-sump of the occurrence engine (left) in comparison to the condition of a typical engine (right).
Source: GE
Coking
Coking is an artefact from exposure of oil to abnormally high temperatures that leads to oxidation and chemical breakdown of the oil. Coking can form as a thin film layered deposit or in thicker clumps. Determining the initiating source of coke formation is difficult, as it can be attributed to a combination of influences, including:
operational conditions such as hot shutdown
design traits such as abrupt changes in oil flow direction and areas of low fluid velocity that can lead to reduced oil flow rates
low-drainage areas resulting in conductive or convective oil temperature increases post shutdown
reductions in cross-sections such as scavenge ports that increase the likelihood of blockage
prolonged aircraft inactivity leading to moisture absorption of coke deposit.
Related occurrence
In 2005, a SAAB 340B fitted with a CT7-9B (ESN 785179) (not operated by Regional Express) sustained an in-flight shutdown determined to be due to B-Sump oil leaking into the CDLP air flow and igniting just forward of the PT stage-3 nozzle. Analysis of that engine also found heavy coking of the B-sump oil cavity and a blocked B-sump air cavity drain tube.
As a result of that occurrence, GE made several changes to improve the effectiveness of the procedure for cleaning the midframe and modified the oil consumption fault isolation procedures with the intent of better identifying B-Sump leak issues.
Safety analysis
The engine failure involving Saab 340B VH-RXX, on 30 August 2019, was initiated by heavy coking in the B-Sump oil cavity, which resulted in oil leaking from the B-Sump and eventually causing an internal oil fire. This over-temperature condition weakened the PT stage 3 disk posts sufficiently to allow some turbine blades to be released, resulting in an imbalance and subsequent fracture of the PT shaft. The engine fire indication received by the flight crew was the result of hot gases being released through the burn holes in the PT case activating the fire-detection system.
The B-sump component had only completed 1,481 flight hours since it was installed on the engine in May 2018. This represented only about 10 per cent of the typical time between major work scopes. The high level of coking found in the B-sump could only have occurred in that timeframe if:
the component was not completely clean on installation following the major work scope
there was an accelerated formation of coking within the component
or a combination of both.
Despite the part being cleaned in accordance with the manufacturer’s recommendation, it was not possible to inspect the oil cavity of the B-sump visually to confirm complete removal of coking. In addition, if any coke deposits were remaining within the component, this could have affected the oil flow and cooling within the sump and contributed to further coking.
The manufacturer advised that there was no evidence that the engine was operated outside their recommendations, and so it is unlikely that there were any operational factors that contributed to the accelerated formation of coking. The exact mechanism which resulted in the level of coking present in the B-sump could not be determined.
A CT7 engine failure or in-flight shutdown due to significant coking in the B-sump is a rare event, with only two known occurrences in the 38 million flight hours accumulated by the engine type.
Findings
These findings should not be read as apportioning blame or liability to any particular organisation or individual.
Excessive coking in the B-sump oil cavity resulted in oil leaking from the B-sump. This ultimately initiated an internal engine fire and subsequent fracture of the PT shaft and separation of the C-Sump assembly.
The excessive coking was most likely due to the component not being completely clean when installed at the last major work scope and/or accelerated coking on the component.
Safety action
Whether or not the ATSB identifies safety issues in the course of an investigation, relevant organisations may proactively initiate safety action in order to reduce their safety risk. The ATSB has been advised of the following proactive safety action in response to this occurrence.
Engine manufacturer
As a result of this occurrence, the engine manufacturers (GE) have advised the ATSB that they:
have completed a technical review and incorporated changes to the Maintenance Manual troubleshooting procedure to better identify a B-sump flooding condition.
are ensuring licensed CT7-TP overhaul facilities are conducting the cleaning in accordance with the GE procedure. GE have also completed a review of the B-Sump cleaning procedure and developed enhancements which will be added to the next revision of the document.
Purpose of safety investigations
The objective of a safety investigation is to enhance transport safety. This is done through:
identifying safety issues and facilitating safety action to address those issues
providing information about occurrences and their associated safety factors to facilitate learning within the transport industry.
It is not a function of the ATSB to apportion blame or provide a means for determining liability. At the same time, an investigation report must include factual material of sufficient weight to support the analysis and findings. At all times the ATSB endeavours to balance the use of material that could imply adverse comment with the need to properly explain what happened, and why, in a fair and unbiased manner. The ATSB does not investigate for the purpose of taking administrative, regulatory or criminal action.
Terminology
An explanation of terminology used in ATSB investigation reports is available here. This includes terms such as occurrence, contributing factor, other factor that increased risk, and safety issue.
Publishing information
Released in accordance with section 25 of the Transport Safety Investigation Act 2003
Ownership of intellectual property rights in this publication
Unless otherwise noted, copyright (and any other intellectual property rights, if any) in this report publication is owned by the Commonwealth of Australia.
Creative Commons licence
With the exception of the Coat of Arms, ATSB logo, and photos and graphics in which a third party holds copyright, this publication is licensed under a Creative Commons Attribution 3.0 Australia licence.
Creative Commons Attribution 3.0 Australia Licence is a standard form licence agreement that allows you to copy, distribute, transmit and adapt this publication provided that you attribute the work.
The ATSB’s preference is that you attribute this publication (and any material sourced from it) using the following wording: Source: Australian Transport Safety Bureau
Copyright in material obtained from other agencies, private individuals or organisations, belongs to those agencies, individuals or organisations. Where you wish to use their material, you will need to contact them directly.
In August and October 2019, a Gippsland Aeronautics GA8 Airvan (GA8) aircraft, registered VH‑BFS and operated by Air Fraser Island, sustained failures of the right main landing gear, with both occurrences occurring during landings on beach aeroplane landing areas (ALAs) on Fraser Island. Both landings were described as normal with no excessive loads.
On 24 August 2019, during the landing roll, and just prior to reaching taxi speed, the right main landing gear collapsed, resulting in minor damage to the aircraft as it came to a stop. There were no reported injuries to the pilot or passengers on board. On 31 October 2019, during the landing roll the right main wheel and axle separated from the landing gear at slow speed, resulting in minor damage. There were no reported injuries to the pilot (the only occupant).
What the ATSB found
The ATSB found it was probable that a number of the eight mounting bolts securing the right main landing gear had loosened and wound out, placing excessive loads on the remaining bolts. The remaining bolts eventually sheared, resulting in the gear leg collapsing during landing on 24 August 2019. Although the bolts not being securely fastened would have been apparent during one or more periodic inspections, recent maintenance had not detected any problems.
The ATSB found that because of low weld penetration from manufacture at the right main landing gear axle attach sleeve, it was likely that a fatigue crack formed and propagated undetected, eventually resulting in the axle failure on 31 October 2019. It was likely the axle cracks were present, and detectable visually, when last inspected 27 flight hours before the occurrence. In addition, the axle inspection area had surface contamination and corrosion that indicated the requirement for cleaning prior to inspection had not been conducted for an extended period, thereby decreasing the likelihood of identifying cracks by visual means. Furthermore, the requirement for a magnetic particle inspection of the axles had not been carried out, and was about 470 flight hours overdue at the time of the 31 October 2019 axle failure.
The operator’s aircraft experienced increased loads on the landing gear when routinely operating from beach ALAs up to 20–30 times daily, and they were subjected to a salt-laden and humid environment. With consideration of this context, the ATSB concluded that the operator did not place appropriate emphasis on ensuring the continuing airworthiness of the landing gear of its GA8 fleet.
What has been done as a result
Following the incidents, Air Fraser Island made changes to the control and conduct of maintenance on its aircraft. This included the appointment of a new head of aircraft airworthiness and maintenance control (HAAMC), the appointment of a quality assurance officer to audit the operator’s maintenance system, and changes to the personnel conducting maintenance.
Safety message
Operators routinely conducting operations to beach landing areas should consider the options available for improving the resilience of their landing gear. In particular, they should ensure that they are conducting the required inspections in accordance with the manufacturer’s maintenance schedule and procedures as a minimum standard. Improved and additional inspections should also be considered by operators when aircraft are frequently operated in challenging conditions.
The occurrence
Right main landing gear collapse (24 August 2019)
On 24 August 2019, a Gippsland Aeronautics GA8 Airvan (GA8), operated by Air Fraser Island and registered VH-BFS, conducted a local scenic flight over Fraser Island, Queensland. There was a pilot and five passengers on board.
On completion of the flight, the aircraft landed on a beach aeroplane landing area (ALA).[1] The landing was described as normal with no excessive loads. The pilot reported that, just prior to reaching taxi speed, the right main landing gear began to rotate towards the fuselage very slowly, and that the aircraft began to tilt to the right. This caused the aircraft to head toward the higher part of the beach before coming to a stop. The aircraft sustained minor damage and there were no reported injuries.
The operator’s licenced aircraft maintenance engineer (LAME) reported that the right main landing gear was no longer secured at its mount fitting by eight mount bolts, allowing it to rotate aft and upwards to a position where it could no longer support the aircraft (Figure 1). The aircraft was repaired and returned to service.
Figure 1: VH-BFS where it came to rest on 24 August, showing the right landing gear collapsed
Source: Air Fraser Island, modified by the ATSB
Right main landing gear axle fracture (31 October 2019)
On 31 October 2019, VH-BFS was operated to Fraser Island to collect passengers returning to the mainland. The pilot[2] was the sole occupant.
The pilot reported that the landing was normal with no excessive loads. During the landing roll on the beach ALA, the right main landing gear wheel separated from the aircraft. There were no reported injuries. Following the flight, fuel was observed to be leaking from the right wing. Queensland Parks and Wildlife Service personnel were in attendance and attempted to manage the spill (Figure 2).
Figure 2: VH-BFS where it came to rest on 31 October, showing the right main wheel separated from the aircraft.
Source: Queensland Police Service, modified by the ATSB
The operator’s LAME established that the right main landing gear had fractured at the axle, which is the attachment point for the main wheel to the landing gear. Another main landing gear assembly from the operator’s other GA8[3] was fitted to VH-BFS, and the nose wheel axle bolt was replaced. The aircraft was subsequently returned to service.
Air Fraser Island primarily conducted scenic charter flights over Fraser Island, Queensland. This involved positioning aircraft from the mainland to Fraser Island in the morning and making multiple scenic flights daily from beach ALAs. The operator utilised two GA8 Airvans, a Cessna 172, and a Cessna 206 for these flights.
Since October 2017, the operator’s head of aircraft airworthiness and maintenance control (HAAMC) was a LAME who also maintained and certified their aircraft under a third-party maintenance approval.
The operator’s LAME advised that generally, each of their aircraft flew about 100 hours in a 7-week period and made 200–300 landings in that time. The operator’s safety manager advised that, on a busy day, pilots would conduct 20–30 take-offs and landings.
The majority of take-offs and landings were on beach ALAs that typically were below the high tide mark on sand that had been compacted by the receding tide. The physical characteristics of beach ALAs regularly exposed the aircrafts’ main landing gears to additional loads when compared to graded or sealed runways. The salt-laden and humid environment also increased the speed and severity of corrosion on the aircrafts’ metal components.
Aircraft information
General
The Gippsland Aeronautics GA8 Airvan (GA8) is a high-wing, all-metal, unpressurised aeroplane with a fixed tricycle landing gear. It has a single, reciprocating piston engine driving a constant speed propeller. The aircraft type first entered service in December 2000 and 262 aircraft were produced.
VH-BFS was manufactured and first registered in Australia in 2003. The aircraft had been in service with Air Fraser Island since that time. VH-BFS was being maintained in accordance with the GA8 service manual and held a current maintenance release at the time of both occurrences. At the time of the second occurrence (31 October 2019), VH-BFS had accumulated about 10,492 flight hours total time in service (TTIS).
Main landing gear and mounting description
The GA8 main landing gear legs were manufactured from machined and heat-treated 5160 steel tube. They passed through fittings in the fuselage main landing gear carry-through structure and then into mount fittings that were bolted to the main keel members. The legs were fixed to these fittings by eight NAS6606-12 close-tolerance bolts per side. These mount bolts screwed into a special nut, with eight threaded holes, and the special nut was nested inside the landing gear tubing. The main landing gear tubing incorporated a waisted section that was designed to twist when subjected to excessive loads, such as a runway overrun, rather than transmitting those loads to the airframe via the mounting bolts.
The manufacturer, Gippsland Aeronautics, advised that the original design for fixing the main landing gear leg into the mount fitting was with four mount bolts per side. During testing with this arrangement, the bolts were found to shear off (in overstress) from the forces placed upon them. The design was subsequently modified to have eight bolts before the aircraft type first entered service. The manufacturer was not aware of any subsequent failures of the bolts after the aircraft type entered service.
At manufacture, the eight mount bolts fixing each main landing gear leg, after being tightened to the correct torque, were secured in place with safety wire.
Safety wiring is a means of securing hardware (such as bolts) to prevent them from loosening during operation. Safety wiring is not a means of maintaining the torque of a bolt, but rather to prevent their disengagement. Safety wire is most commonly stainless steel, and after being threaded through pre-drilled holes in bolt heads, is twisted together either by hand or by using special pliers (Figure 3).
Figure 3: Examples of safety wiring of bolts
Source: US Federal Aviation Administration, modified by the ATSB
In-service experience showed that the GA8 landing gear mount bolts would loosen slightly due to the vertical and ratcheting forces on the main landing gear during take-off and landing. Access to the upper mounting bolts for removal, installation and safety wiring was limited by their proximity to the underside of the cabin floor (Figure 4).
Figure 4: GA8 main landing gear assembly showing the location of the mount fitting, mount bolts and axle
Source: Gippsland Aeronautics, modified by the ATSB
Soon after the GA8 entered service, the manufacturer made a design change so that a bolt retaining cap was installed over the mount fitting that covered the eight bolt heads. When installed, the cap ensured that the bolts could not wind out of the special nut and the bolt heads no longer needed to be safety wired. The design change was incorporated on the production line and could be incorporated as a non-mandatory modification to aircraft in service.
VH-BFS had not been fitted with the retaining caps on its landing gear at the time of the first occurrence (24 August 2019). Following the occurrence, when the aircraft was being repaired, the operator fitted a retaining cap on the left landing gear. No retaining cap was fitted to the right landing gear.
Main landing gear axle description
The main landing gear axles were manufactured from 4130 steel tube that was machined and welded. They were fixed to the main landing gear with two bolts (Figure 5). The axles incorporated a torque plate to attach the brake callipers.
The design specifications for the main landing gear axle assembly were progressively improved from the time the aircraft entered service. From October 2009 they included references to an internal Gippsland Aeronautics welding procedure that was intended to improve the integrity of the welded region between the axle and landing gear tube.
In response to a GA8 operator sustaining an in-service failure from fatigue cracking of a main landing gear axle, Gippsland Aeronautics issued service bulletin SB-GA8-2016-169 (Inspection of the Main Undercarriage Axle Assembly) in 2016. The associated issue was that cracks had been found to form on the upper side of the axle on the inboard side of the brake torque plate (Figure 5).
Figure 5: GA8 main landing gear axle assembly inspection areas
Source: Gippsland Aeronautics, modified by the ATSB
As a result of the initial service bulletin inspections identifying cracks in some instances, the service bulletin was re-issued to make it mandatory.[4] The service bulletin was issued for a third time on 11 November 2016 to give operators time to comply with the non-destructive inspection requirements. That inspection was to be conducted no later than 11 February 2017 if the axle had accumulated 2,000 hours TTIS.
The ongoing inspection requirements in the SB included:
Part B - every 100 +/-10 flight hours, a detailed visual inspection of the external inspection area using at least 10x magnification and visual inspection internally
Part C - from 2,000 flight (axle) hours, and every 1,000 +/-10 hours afterwards, a magnetic particle inspection.[5]
In both cases the main wheel, brake calliper and torque plate required removal and the inspection areas had to be cleaned with solvent to ensure they were free of contaminants and corrosion prior to commencing the inspection. The service bulletin also stipulated that the aircraft logbooks had to be certified showing the completion of the service bulletin.
Another requirement of service bulletin SB-GA8-2016-169 was to report the results of inspections by completing the included document compliance notice and returning it to the manufacturer. Gippsland Aeronautics advised that of the 262 production aircraft, 10 compliance notices had been received. None of those notices were for inspections conducted on VH-BFS or the operator’s other GA8 aircraft (VH-BNX).
Recent scheduled maintenance
Periodic inspections of VH-BFS were certified as being carried out in accordance with the GA8 service manual at intervals of 100 +/- 10 hours or 12 months, whichever came first. They included the requirement to carry out a general inspection of the main landing gear attachment to the aircraft structure and, from 2016, a special inspection associated with SB-GA8-2016-169.
Recent periodic and special inspections were documented as being conducted on VH-BFS on:
2 August 2019 at 10,263.7 hours TTIS (22 days and 61.8 flight hours before the landing gear collapse occurrence)
15 September 2019 at 10,362.3 hours TTIS
21 October 2019 at 10,464.5 hours TTIS (10 days and 27.4 hours before the axle fracture occurrence).
Right main landing gear history
The right main landing gear involved in both of VH-BFS occurrences in 2019 was fitted to the aircraft following another occurrence in 2009 where the right wheel and brake calliper separated in flight due to a previous axle failure (see Previous right main landing gear axle failure (21 June 2009) in this report for further details). Based on the available evidence, the ATSB was unable to establish if the replaced landing gear was new or a part-life item at the time it was fitted in 2009.
The operator’s LAME advised that they began carrying out maintenance on VH‑BFS in October 2017 at 9,125.1 hours TTIS. They stated that the previous maintenance provider informed them that all the required inspections had been carried out. The LAME also reported that they expected the SB-GA8-2016-169 magnetic particle inspection (MPI) requirement to be due at 10,025.1 hours TTIS (900 flight hours after taking over the maintenance), but about that time experienced issues with their computer-based maintenance scheduling. That resulted in the most recent MPI of the main landing gear axle, as required by SB-GA8-2016-169, not being carried out.
At the time of the axle fracture occurrence (31 October 2019), VH-BFS was about 470 flight hours overdue for that inspection based on the statement from the operator’s LAME. Further, the ATSB’s examination of the aircraft maintenance documentation did not identify any previous occasion when the axle had an MPI conducted, including the initial inspection that was to be carried out no later than February 2017. MPI inspections were carried out on the operator’s other GA8, VH-BNX, in July 2017.
Examination of recovered components
Main landing gear mounting hardware
Initial inspection by maintenance personnel
The worksheet completed for the recovery of the aircraft following the 24 August 2019 occurrence indicated that the bolts had sheared during landing and that an aircraft inspection was carried out. The LAME advised that:
three bolt remnants consisting of bolt heads and part of their shanks were found in the keel of the aircraft, safety wired together
the other five bolt heads with partial shanks were unable to be located, possibly lost during the repair activity
the special nut used to secure the landing gear leg was lost during the repair activity.
Therefore, only three bolt heads with partial shanks were available for inspection.
Detailed examination of the remaining mounting hardware
The ATSB conducted a technical examination of the three main landing gear mount bolt remnants that were recovered (Figure 6). A summary of the examination is as follows:
Manufacturing stamps and measurements indicated the bolts were the right type and fit for purpose.
There were no pre-existing defects with the bolts.
There was no evidence of cracking, and there were shear lips present on all three bolts. Their fracture surfaces were consistent with shear overstress[6] from a single event.
Dimensional examination of the bolt remnants showed it was likely that all three bolts were correctly tightened, and that the fractures occurred at the interface between the landing gear leg and its mount fitting.
There was no physical evidence provided to determine if the five missing bolts had sheared in the same way as the three bolts recovered, or if they had wound out of the special nut so that the three bolts provided had supported the landing gear shear loads.
Figure 6: The three recovered main landing gear mount bolt heads with partial shanks
Source: ATSB
Main landing gear axle assembly
Examination of photographs
Examination of photographs taken immediately after the main landing gear axle fracture occurrence on 31 October 2019 showed that significant amounts of pre-existing contamination existed at the axle inspection area, and that one of the mount guides on the brake calliper torque plate had broken off at an unknown time prior to the occurrence (Figure 7).
Figure 7: VH-BFS right main wheel, brake and axle taken just after 31 October 2019 occurrence
Source: Queensland Police Service, modified by the ATSB
Figure 8 shows dark and light areas across the axle fracture surface. Analysis of the photograph by materials failure specialists assessed the darkened areas as being pre-existing areas of fracture and the brighter areas, such as the area labelled as the ‘axle lower doubler’, were overstress in nature. Based on that evidence, the axle weld was cracked around about two thirds of the circumference. The remaining structure failed in overstress during the landing occurrence.
Figure 8: VH-BFS right main landing gear axle failure taken just after 31 October 2019 occurrence
Source: Queensland Police Service, modified by the ATSB
Detailed examination of the axle fracture
The right main landing gear leg and axle were provided to the ATSB for examination (Figure 9). A summary of that examination is as follows:
There was low weld penetration (less than 1 mm) in some areas.
The axle assembly was fractured in the area known to crack as described in SB-GA8-2016-169. However, smearing[7] and corrosion at the fracture surface prevented a determination on the degree of fatigue present prior to the occurrence.
The axle assembly lower doubler had failed in overstress.
There was paint missing on the leg and axle assembly with darker corrosion visible, likely present prior to the occurrence.
Corrosion pitting was present on the fracture surface opposite the doubler, suggesting pre-existing damage.
A secondary crack was found opposite the doubler, near the region of corrosion pitting.
Figure 9: VH-BFS right main landing gear axle after cleaning
Source: ATSB
Other noted defects
The ATSB identified that the right torque plate that located the brake calliper on the axle was significantly corroded and had a section of the brake calliper guide missing. The extent of the corrosion at the missing calliper guide indicated that it had been missing for an extended period.
Previous right main landing gear axle failure (21 June 2009)
On 21 June 2009, while travelling from Harvey Bay and during descent to Fraser Island, VH-BFS sustained a fracture of the right main landing gear axle assembly, resulting in separation of the wheel and brake calliper. The aircraft was diverted to Maryborough, Queensland, where it landed safely on the remaining portion of the axle.
To assist its investigation of the occurrence, the Civil Aviation Safety Authority (CASA) requested the assistance of the ATSB in the metallurgical examination of the fractured landing gear leg. The ATSB conducted that examination as an investigation under the Transport Safety Investigation Act 2003 (see AE-2009-045 for details).
The ATSB examination concluded the following [emphasis added]:
As a result of gross abrasion sustained during the aircraft landing, the amount of material lost from the leg attach fracture surfaces (including the doubler from the underside of the axle assembly) precluded an accurate determination of the failure mechanism.
Considering the assembly design, the fillet weld would likely have been the region of highest stress in the axle assembly and therefore, in the absence of material or manufacturing defects, it is probable that the fracture would have originated and progressed through the weld along its full path.
The onset of failure under low nominal stress conditions, that is, during flight, suggested a progressive or fatigue-type mechanism, rather than a gross transient overload event. However, there was no evidence of fatigue on the remaining fracture surface.
Future increased examination vigilance and possible enhanced inspections of the leg attach sleeve welds of other GA8 aircraft is suggested in view of the nature of the failure sustained.
On two occasions in 2019, while conducting a landing on a beach aeroplane landing area (ALA), VH-BFS sustained failures of the right main landing gear. In the first occurrence, the right landing gear collapsed, and in the second the right main wheel separated from the aircraft due to an axle fracture. There were no reported injuries from either occurrence.
This analysis will discuss the likely failure modes involved in each occurrence and maintenance issues that were identified during the investigation.
Right main landing gear collapse (24 August 2019)
Landing gear mount bolt shear forces
Figure 10 shows an illustration of the eight mount bolts that are designed to secure the landing gear to the airframe structure. The bolts pass through the airframe fitting, into the landing gear leg and then they are retained by a special nut with eight threaded holes. The illustration also indicates the point of intersecting forces or loads applied by the airframe against forces applied by the landing gear. These forces are in shear and the point of intersection is the location where the three provided bolts sheared in overstress.
Figure 10: Main landing gear leg, mount fitting and special nut
Source: Gippsland Aeronautics, modified by the ATSB
Scenarios to explain the overstress failure of the recovered bolts
Technical analysis of the three provided landing gear mount bolt remnants were of the appropriate specification and they had no pre-existing defects. The fracture surfaces showed they had sustained an overstress failure due to shear loads.
The ATSB considered two possible scenarios with regards to the 24 August landing gear collapse:
the shear overstress failure of all eight mount bolts due to significant landing loads
the migration and release of five mount bolts that were not safety wired and the overstress failure of the three remaining bolts during normal landing loads.
Possible overstress failure of all eight bolts
The operator’s LAME indicated that all eight mount bolts had failed in shear overstress during the landing. Apart from the three sheared bolt head remnants, the LAME was unable to provide any additional photographic or physical evidence to support that scenario; instead reporting that the five other sheared bolt remnants and the special nut were lost during repair activity. The LAME was unable to recall the circumstances regarding the removal of the eight bolt shanks and their threaded portions during the repair activity, and their subsequent whereabouts was not supplied.
In a scenario where all eight bolts fail in shear overstress, their shanks and threaded portion should retain the special nut in the landing gear leg, and the bolt heads should still be safety wired together, at least in pairs. Evidence such as the five missing bolts, the remaining threaded bolt shanks, and the special nut would have provided supporting evidence to show that all eight bolts were fitted and secure at the time of the 24 August occurrence. However, the only supporting evidence was the LAME’s statement.
Possible migration of five unsecured bolts
Evidence to support the migration of five bolts that were not safety wired was as follows:
The aircraft manufacturer reported that there have not been any taxi, take-off or landing incidents or accidents where all the landing gear bolts had sheared in overstress.
The manufacturer designed the landing gear to twist and deform at a waisted section during hard landings before landing loads were significant enough to deform the airframe and shear the mount bolts. VH-BFS’s landing gear was not twisted at the waisted section and was refitted to the aircraft during the repair activity.
The manufacturer reported that, during pre-production testing, the original installation of four mount bolts would shear in overstress rather than deform the landing gear leg. Therefore, an aircraft with four or less bolts fitted would likely shear those bolts.
The landing was reported to have been normal with no excessive loads.
There was no physical or photographic evidence available to show that the five bolts had sheared in overstress.
The bolts examined were the correct type and fit for purpose.
ATSB analysis of the two scenarios
In the absence of a hard/abnormal landing, it would be unlikely for all eight mount bolts to fail in shear overstress provided they were all secured, the correct type, and fit for purpose. Further details about the recovery, repair and the replacement of parts requested by the ATSB was not forthcoming. Therefore, the ATSB could not assure itself that the LAME’s account was entirely accurate.
The ATSB considered that, based on the available evidence, it was probable that the landing gear was not secured by all eight bolts prior to landing. It was also considered probable some bolts were not safety wired to ensure that they could not migrate out during numerous landing and take-off cycles. The replacement of the landing gear in 2009 due to the previous axle failure was at least one point in time where the bolts were removed and refitted with the possibility that they were not resecured by safety wire.
Access to the upper mounting bolts for safety wiring is limited by their proximity to the underside of the cabin floor. However, removal of this requirement could have been accomplished by retrofitting a main landing gear mount bolt retaining cap.
Each periodic (100 hourly) inspection required the examination of the landing gear securing points, which included the eight mount bolts. It was estimated that at least six periodic (100-hourly) inspections were conducted on VH-BFS every year. Each of those inspections provided an opportunity to identify an underlying issue with the security of the landing gear before it progressed to the point of failure.
Right main landing gear axle fracture
Landing gear axle examination
Technical analysis of axle fracture surfaces showed that a fatigue crack formed and propagated undetected around two thirds of the axle circumference along the weld and eventually failed in a weakened state during a normal beach landing. Examination of the weld points on the axle indicated that there was a low weld penetration at the axle attach sleeve. A combination of low weld penetration, operations on uneven beach ALAs and high landing cycles in a highly corrosive environment may have increased the crack initiation and propagation rate. Corrosion pitting inside the fracture surfaces indicated that the crack had been present for a significant period of time.
The age of the right main landing gear from VH-BFS was not able to be established, however the low weld penetration at the axle attach sleeve suggests that it pre-dated the specification change in October 2009, when greater definition was added to the welding procedure by the aircraft manufacturer.
Maintenance aspects related to the axle failure
The ATSB’s investigation into the axle failure of VH-BFS in 2009 recommended increased examination vigilance and possible enhanced inspections of the leg attach sleeve welds.
The manufacturer was aware of the possibility of fatigue cracks forming in axle attachment sleeves from the 2009 occurrence, and later in 2016 via in-service data gathered during the compilation of service bulletin SB-GA8-2016-169. The resulting mandatory requirements of this service bulletin were designed to identify fatigue cracks before they propagated to the point of failure. The fatigue cracking on the right axle of VH-BFS was located in the inspection area described in service bulletin SB-GA8-2016-169.
The service bulletin required detailed visual inspections in the area of the fatigue crack with a 10x magnifier every 100 hours, and a magnetic particle inspection (MPI) every 1,000 hours. The visual and MPI inspections required the removal of the main wheels, the brake callipers and torque plates for access, and the area had to be cleaned prior to inspection. Following each examination, a maintenance log entry was required to show that the examination was completed in accordance with the service bulletin and certified by appropriately licensed maintenance engineers.
Since February 2017, the aircraft had a periodic (100 hourly) inspection, which included the service bulletin, about every 7 weeks, with the last one being about 27 flight hours prior to the occurrence.
In accordance with the maintenance schedule, a calculation of aircraft hours and dates indicated that two MPIs should have been carried out on the aircraft since February 2017. The ATSB could not find any documented evidence to indicate that the initial MPI had been carried out, however an MPI was carried out on the operator’s other GA8 in July 2017. The operator’s LAME cited issues relating to maintenance scheduling software as a reason for the overrun of the second scheduled MPI.
Additionally, there was significant amount of pre-existing contamination at the axle inspection area. This indicated that required cleaning of the inspection area had not been conducted for an extended period, which reduced the likelihood of identifying cracks in the inspection area.
Each of the scheduled MPI and visual inspections represented an opportunity to identify a pre-existing crack in the axle area prior to failure. The ATSB concluded that a detectable crack would very likely have been present in the axle over numerous periodic inspection periods.
The operator was routinely operating from beach landing areas with increased loads on the landing gear, was aware of the axle failure of VH-BFS in 2009 and, later, the mandatory inspection requirements of SB-GA8-2016-169. However, it did not place appropriate emphasis on ensuring the continuing airworthiness of the landing gear of its GA8 fleet.
Landing gear maintenance procedures
Scheduled maintenance is designed to capture irregularities well before they can manifest into failures. More specifically, both issues that led to the landing gear failures involving VH-BFS were known to the aircraft manufacturer and had been mitigated by scheduled and special inspections. The ATSB considered that the manufacturer’s maintenance schedule, requirements and documentation, if followed correctly, were sufficient to identify the associated issues before they become incidents or accidents.
Operating aircraft on beach ALAs exposes them to increased loads on the landing gear, as well as also exposed the aircraft to sand and a salt-laden environment. Accordingly, operators conducting such operations on a routine basis should consider the options available for improving the resilience of their landing gear. In addition, they should ensure that all minimum maintenance inspections and requirements are being conducted at the specified frequency, and even consider whether to conduct them more frequently.
As a result of investigating these two occurrences, the ATSB identified that the relevant inspections of the landing gear did not appear to have been conducted at the inspection intervals required. More specifically:
Each 100 hourly / periodic inspection required the examination of the landing gear securing points, which included the eight mount bolts. It was estimated that at least six periodic (100-hourly) inspections were conducted on VH-BFS every year. Each of those inspections represented provided an opportunity to identify an underlying issue with the security of the landing gear before it progressed to the point of failure (on 24 August 2019).
Each of the scheduled visual and MPI inspections represented an opportunity to identify a pre-existing crack in the axle area prior to the failure (on 31 October 2019). However, the available evidence indicates two required MPIs since February 2017 were not conducted. In addition, a detectable crack would very likely have been present in the axle over numerous periodic inspection periods, and the amount of contamination in the axle inspection area meant that at least some of the visual inspections would not have been able to be effectively conducted.
The operator was aware of the previous axle failure involving its aircraft in 2009 and was aware of the service bulletin. Both occurrences involving VH-BFS highlight the importance of ensuring scheduled maintenance is carried out at the appropriate times and in accordance with the required maintenance data.
In summary, based on the available information, the ATSB concluded that the operator did not place appropriate emphasis on ensuring the continuing airworthiness of the landing gear of its GA8 fleet.
The manufacturer’s ability to improve maintenance requirements relies partly on the provision of in-service data for analysis. SB-GA8-2016-169 incorporated an ‘inspection result compliance notice’ and, from 262 production aircraft, there have been only 10 responses. This represented a missed opportunity for the manufacturer and operators to obtain important ongoing airworthiness information.
Findings
ATSB investigation report findings focus on safety factors (that is, events and conditions that increase risk). Safety factors include ‘contributing factors’ and ‘other factors that increased risk’ (that is, factors that did not meet the definition of a contributing factor for this occurrence but were still considered important to include in the report for the purpose of increasing awareness and enhancing safety). In addition, ‘other findings’ may be included to provide important information about topics other than safety factors.
Safety issues are highlighted in bold to emphasise their importance. A safety issue is a safety factor that (a) can reasonably be regarded as having the potential to adversely affect the safety of future operations, and (b) is a characteristic of an organisation or a system, rather than a characteristic of a specific individual, or characteristic of an operating environment at a specific point in time.
These findings should not be read as apportioning blame or liability to any particular organisation or individual.
From the evidence available, the following findings are made with respect to the landing gear failures involving a GA8 Airvan, VH-BFS, on 24 August and 31 October 2019.
Contributing factors
It is probable that a number of the eight right main landing gear mount bolts had migrated out of the special nut undetected and over an extended period. The three remaining bolts failed in overstress, resulting in the gear leg collapsing during a normal beach landing on 24 August 2019.
Recent maintenance inspections specific to the security of the landing gear attachment had not detected issues related to the migration of the right main landing gear mount bolts. It is probable that the mount bolt migration would have been apparent during one or more inspections.
There was low weld penetration at the right main landing gear axle attach sleeve, which likely resulted in a fatigue crack forming, then propagating undetected and eventually failing during a normal beach landing on 31 October 2019.
It was likely the axle cracks were present, and detectable visually, when last inspected 27 flight hours before the 31 October 2019 occurrence.
The axle inspection area had surface contamination and corrosion that indicated the requirement for cleaning prior to inspection had not been conducted for an extended period, thereby decreasing the likelihood of identifying cracks by visual means.
The most recent mandatory service bulletin SB-GA8-2016-169 requirement for a magnetic particle inspection (MPI) of the axles had not been carried out and was about 470 flight hours overdue at the time of the 31 October 2019 axle failure.
The operator did not place appropriate emphasis on ensuring the continuing airworthiness of the landing gear of its GA8 fleet, although being aware of:
the increased loads on the landing gear when routinely operating from beach landing areas up to 20–30 times daily, and being subjected to a salt-laden and humid environment
the axle failure of VH-BFS in 2009
the mandatory inspection requirements of service bulletin SB-GA8-2016-169. (Safety issue)
Other factors that increased risk
Although not mandatory, the operator had not retrofitted main landing gear mount bolt retaining caps on the landing gear of VH-BFS. Such retaining caps would have prevented the possible scenario of the main landing gear mount bolts becoming loose and thereby reducing the integrity of the main gear leg.
A requirement of service bulletin SB-GA8-2016-169 was to report the results of inspections by completing the document compliance notice and returning it to the manufacturer. Of the 262 production aircraft, 10 compliance notices had been received. This represented a missed opportunity for the manufacturer and operators to obtain important ongoing airworthiness information.
Safety issues and actions
Central to the ATSB’s investigation of transport safety matters is the early identification of safety issues. The ATSB expects relevant organisations will address all safety issues an investigation identifies.
Depending on the level of risk of a safety issue, the extent of corrective action taken by the relevant organisation(s), or the desirability of directing a broad safety message to the aviation industry, the ATSB may issue a formal safety recommendation or safety advisory notice as part of the final report.
All of the directly involved parties were provided with a draft report and invited to provide submissions. As part of that process, each organisation was asked to communicate what safety actions, if any, they had carried out or were planning to carry out in relation to each safety issue relevant to their organisation.
Descriptions of each safety issue, and any associated safety recommendations, are detailed below. Click the link to read the full safety issue description, including the issue status and any safety action/s taken. Safety issues and actions are updated on this website when safety issue owners provide further information concerning the implementation of safety action.
Safety issue description: The operator did not place appropriate emphasis on ensuring the continuing airworthiness of the landing gear of its GA8 fleet, although being aware of:
the increased loads on the landing gear when routinely operating from beach landing areas up to 20–30 times daily, and being subjected to a salt-laden and humid environment
the axle failure of VH-BFS in 2009
the mandatory inspection requirements of service bulletin SB-GA8-2016-169.
Sources and submissions
The sources of information during the investigation included the:
pilot of the occurrence flight and another pilot who conducted flights for the operator
chief pilot of Air Fraser Island
Civil Aviation Safety Authority
Queensland Police Service
aircraft manufacturer
maintenance organisation for VH-BFS at the time of the occurrences
witnesses
photographs taken on the day of the accident.
References
ATSB external investigation AE-2009-045, Engineering examination into the fractured main landing gear axle Gippsland Aeronautics GA-8 Airvan, VH-BFS, 21 June 2009, Australia.
Gippsland Aeronautics, Model GA8 service manual amendment 12, 15 May 2018.
Gippsland Aeronautics, Service Bulletin SB-GA8-2016-169 issue 3, Inspection of the Main Undercarriage Axle Assembly.
Federal Aviation Administration (1998), Advisory circular AC 43.43-1B, Acceptable methods, techniques, and practices – aircraft inspection and repair.
Submissions
Under section 26 of the Transport Safety Investigation Act 2003, the ATSB may provide a draft report, on a confidential basis, to any person whom the ATSB considers appropriate. That section allows a person receiving a draft report to make submissions to the ATSB about the draft report.
A draft of this report was provided to the following directly involved parties:
the pilots of the occurrence flights and another pilot who conducted flights for the operator
the chief pilot and safety manager of Air Fraser Island
the Civil Aviation Safety Authority
the aircraft manufacturer
the maintenance organisation for VH-BFS at the time of the occurrences.
The submissions were reviewed and, where considered appropriate, the text of the report was amended accordingly.
Purpose of safety investigations & publishing information
Purpose of safety investigations
The objective of a safety investigation is to enhance transport safety. This is done through:
identifying safety issues and facilitating safety action to address those issues
providing information about occurrences and their associated safety factors to facilitate learning within the transport industry.
It is not a function of the ATSB to apportion blame or provide a means for determining liability. At the same time, an investigation report must include factual material of sufficient weight to support the analysis and findings. At all times the ATSB endeavours to balance the use of material that could imply adverse comment with the need to properly explain what happened, and why, in a fair and unbiased manner. The ATSB does not investigate for the purpose of taking administrative, regulatory or criminal action.
Terminology
An explanation of terminology used in ATSB investigation reports is available here. This includes terms such as occurrence, contributing factor, other factor that increased risk, and safety issue.
Publishing information
Released in accordance with section 25 of the Transport Safety Investigation Act 2003
Ownership of intellectual property rights in this publication
Unless otherwise noted, copyright (and any other intellectual property rights, if any) in this report publication is owned by the Commonwealth of Australia.
Creative Commons licence
With the exception of the Coat of Arms, ATSB logo, and photos and graphics in which a third party holds copyright, this publication is licensed under a Creative Commons Attribution 3.0 Australia licence.
Creative Commons Attribution 3.0 Australia Licence is a standard form licence agreement that allows you to copy, distribute, transmit and adapt this publication provided that you attribute the work.
The ATSB’s preference is that you attribute this publication (and any material sourced from it) using the following wording: Source: Australian Transport Safety Bureau
Copyright in material obtained from other agencies, private individuals or organisations, belongs to those agencies, individuals or organisations. Where you wish to use their material, you will need to contact them directly.
At approximately 0030 on 21 August 2019, freight train 4WM2 operated by Pacific National stopped at signal W26U near Waterfall, New South Wales. The train crew consisting of driver A and B were directed by the Waterfall Signaller at 0200 to remarshal the train. The train could not continue and was required to return to Coalcliff to clear the main line. The train consisted of three locomotives and a rake of 50 wagons.
Remarshalling the train required one of the drivers to enter the danger zone to apply hand brakes on the wagons. Driver A requested safeworking protection from the Waterfall Signaller before entering the danger zone. Driver A walked the length of the train applying hand brakes before returning to the locomotives.
The locomotives were detached and operated to Waterfall, before travelling to Helensburgh and returning to the stabled wagons near Waterfall.
On arrival at the stabled wagons, driver B requested safeworking protection from the Waterfall Signaller. Driver B entered the danger zone to release the hand brakes from the stabled wagons. At about 0417, driver A signalled (hand signals and red marker lights) to the driver of an approaching passenger train (404A) to stop. The train was travelling on the adjacent track towards driver B in the danger zone and the driver of 404A made an emergency brake application to stop the train. The train stopped before arriving at the location driver B and there were no physical injuries.
What the ATSB found
The safeworking network rule and procedure for protecting activities associated with in-service rail traffic were not used effectively to ensure workers were protected from rail traffic. The requests for protection were informal and did not detail the required activities or protection. Both drivers of 4WM2 unknowingly entered the danger zone without appropriate protection and were at risk of being struck by rail traffic.
There were multiple parties involved in the communication and decision making relating to the movements of 4WM2. This led to confusion and misunderstanding of the required activities and likely affected the actions of the Waterfall Signaller and train crew. Additionally, not all communications were conducted in accordance with the network rules.
What has been done as a result
The train crew and Waterfall Signaller underwent re-training and assessment before returning to rail safety work.
Sydney Trains reviewed the risk management processes applied by network operations and the processes relating to incident management. Pacific National reviewed the processes for protecting in‑service rail traffic and reinforced the requirements with train crew.
Safety message
Rail infrastructure managers and rail transport operators must ensure that safety critical communication is conducted in accordance with network rules. Additionally, network controllers should consider the potential dangers train crews are exposed to before requiring them to enter the danger zone.
Workers must ensure they have appropriate safeworking protection in place before entering the danger zone and are protected from rail traffic. Workers must also ensure that rest periods are utilised to manage non-work related fatigue.
The occurrence
On 20 August 2019, Pacific National (PN) were operating freight train 4WM2 between Port Kembla, New South Wales and Melbourne, Victoria.
At approximately 0030,[1] on 21 August 2019, the crew consisting of a driver A and driver B stopped at signal W26U near Waterfall, New South Wales. The Sydney Trains’ Waterfall Signaller (WS) advised the crew of train 4WM2 that they would be held at the signal due to a track fault in the adjoining network.[2]
At 0158, the Train Services Delivery Manager (TSDM)[3] Freight advised the WS that train 4WM2 could not proceed and the train would need to remarshal.[4] The WS relayed the directive to the crew of 4WM2 to remarshal the train so the train could move to Coalcliff, clear of the main line.
Driver A contacted the WS at 0209 and requested safeworking protection stating ‘just wondering if we can get a block[5] on the Down[6] there please over’. The WS responded with ‘yeah, sure there driver, standby…ok driver I have secured points out of the Up refuge and on the main line and given you two signals at stop with blocks applied’. Driver A contacted the WS again at 0224, to confirm that protection was in place and was advised ‘yeah got blocks on up here on the city side of your train on the Down signals’.
Between approximately 0220 and 0319 driver A walked in the six-foot[7] to manually apply the hand brakes on the wagons and to divide the locomotives from the rake.[8] At 0320, the crew of 4WM2 requested the block to be removed and permission to shunt the locomotives towards Waterfall.
At 0321, the WS contacted the Wollongong North Panel Area Controller (WNP) to advise of the plan to run 4WM2 to Helensburgh before returning and attaching to the stabled wagons.
The three locomotives departed Waterfall platform at approximately 0332, crossing from the Up Illawarra main line to the Down Illawarra main line to travel to Helensburgh in the Down direction.
The WS contacted the WNP at 0345, to discuss the progress of 4WM2 and make arrangements for managing approaching Up passenger service 404A. The WS and WNP determined that 404A could cross from the Up Illawarra and travel in the Up direction on the Down Illawarra.
At approximately 0359, the three locomotives departed Helensburgh station towards the rake of wagons in the Up direction on the Up Illawarra.
The WNP contacted the driver of 404A at 0409:12, to advise that they would cross to the Down Illawarra as there was a freight train remarshalling near the Waterfall accept signal (W26U).
At 0409:40, driver B contacted the WS requesting safeworking protection stating ‘We’re about to attach to our train again, can I please get a block on the Down? Over’. The WS responded with ‘Yeah I’ve got blocks on the Down and blocks on the Up. So we’ve taken away control from north panel [WNP] and there’s blocks on the Down’.
Following the communication with WS, driver B entered the danger zone[9] on the Down main to reattach the locomotive. Driver A changed ends while driver B walked in the six-foot to release the hand brakes on the wagons.
At 0417:28, driver A called driver B on the radio to warn that they had stopped an approaching passenger train that was travelling towards their location (Figure 1). Driver A then contacted the WS to advise there was worker in the danger zone releasing the hand brakes when the passenger train approached. At the same time, the driver of 404A contacted WNP to advise that the crew of the freight train signalled 404A to stop. The driver of 404A confirmed the train was stopped and was requested to remain stationary until the WNP advised.
Figure 1: Location map
Source: Geoscience Australia and OpenStreetMaps, annotated by OTSI
Train 404A departed the location at 0423 after receiving authority and confirmation that driver B had moved clear of the Down Illawarra main line. Blocking facilities were applied following the departure of 404A to provide protection to driver B to release the hand brakes.
At 0505, 4WM2 departed towards Coalcliff with the crew relieved at 0525 at Helensburgh Station.
The WS was subjected to post incident drug and alcohol testing returning negative results for both tests. Neither driver reported the incident to PN’s Integrated Planning Services (IPS) before completing their shift, as such, post incident drug and alcohol testing was not conducted.
Train 4WM2 was operating between Port Kembla and Melbourne at the time of the incident. The train consisted of three locomotives and a rake of 50 wagons. The total length was 925 m with a trailing mass of 3618 t.
Train radio
At the time of the incident train 4WM2 was not fitted with a compatible digital train radio system (DTRS), preventing the driver communicating with or broadcasting an emergency call to alert the driver of train 404A. The train radio at the time was operating on the National Train Communications System (NTCS).
PN advised the train radio software was updated across their fleet as of December 2019, as part of the Transport for NSW DTRS project.[10] The revised train radio software allows freight drivers to initiate an emergency call that can be heard by passenger trains nearby. Direct communication is still not possible between freight and passenger trains without assistance from the signaller.
404A
Train 404A consisted of a four car Oscar operated by NSW Trains between Kiama and Central station. This service was scheduled to stop at Helensburgh at 0411 and Waterfall at 0419.
The driver of 404A was advised that they would crossover at Helensburgh to travel on the Down Illawarra in the Up direction. The driver operated the train as expected and stopped in response to the crew of 4WM2.
Location
The incident occurred between Waterfall and Helensburgh. The Up and Down Illawarra main lines operate with Rail Vehicle Detection (RVD) and both permit bi-directional running. The rail corridor runs through the Garawarra State Conservation Area and the track consists of steep cuttings, embankments and areas of cleared land based on the topography (Figure 1). The area is remote with no artificial lighting excluding train lighting or hand-held torches.
The crew of 4WM2 were advised to remarshal the train while stationary at signal W26U, located in a steep cutting at 40.191 km.[11] The train length of 925 m positioned the rear of the consist at approximately 41.116 km (Figure 2).
The gradient between Waterfall and Helensburgh varies between 1 in 76 and 1 in 165. The location at which 4WM2 was required to remarshal varied between 1 in 80 and 1 in 165. The crew were concerned about leaving the wagons on the grade so applied more than the required minimum of 50 per cent hand brakes for this grade. A total of 40 hand brakes were applied from the six-foot to hold the wagons on the grade before detaching the locomotives. The hand brakes could not be applied from the cess[12] due to the cutting and ballast shoulder.
Following the remarshalling, the lead locomotive was positioned at approximately 41.182 km on the Up Illawarra. Driver B had walked approximately 300 m along the consist when contacted to advise that train 404A had been stopped.
Figure 2: Position of 4WM2 before and after remarshalling
The image on the left shows the position of 4WM2 (orange) before remarshalling. The image on the right shows the position of 4WM2 (orange) after remarshalling and the approximate location of driver B and 404A (red) when stopped. Source: SixMaps, NSW Spatial Services, annotated by OTSI
At Waterfall there was a stabling yard for passenger trains located on the Down (eastern) side of the station. On the Up (western) side of Waterfall station, there were a number of sidings (Up yard) available for goods (freight) trains as below with siding length:
Up refuge loop - 867 m
Up goods loop - 711 m
1 Up siding - 239 m
2 Up siding - 251 m.
The gradient in this area varies between 1 in 120 and 1 in 220 and the area is close to suburban Waterfall with some artificial lighting.
Directly involved persons
Waterfall Signaller
The WS had performed the role of a signaller since late 2011 and was qualified to operate Waterfall signal box. The signaller had undergone routine assessments relating to safety critical communications[13] with the two most recent assessments completed on 19 February 2019 and 1 May 2019.
The WS’s duty periods for the 2 weeks prior to the incident on the morning of 21 August are shown in Table 1. The WS had worked seven out of eight days leading up to the occurrence, with the previous day off on 15 August after completing a night shift. The WS was on their fifth shift and second nightshift when the incident occurred.
Table 1: Actual duty times for the WS over the previous 14 days
Date
Duty start
Duty end
Duty time
Time free (of duty)
7 August 2019
1400
2200
8 hours
13 hours
8 August 2019
1100
1900
8 hours
Multiple days
9 August 2019
Rostered off
10 August 2019
Rostered off
11 August 2019
Annual leave
12 August 2019
Annual leave
13 August 2019
0600
1400
8 hours
32 hours
14 August 2019
2200
0600
8 hours
48 hours
15 August 2019
Rostered off
16 August 2019
0600
1400
8 hours
16 hours
17 August 2019
0600
1400
8 hours
16 hours
18 August 2019
0600
1400
8 hours
32 hours
19 August 2019
2200
0600
8 hours
16 hours
20 August 2019
2200
0600
(incident occurred between 0200 and 0420)
The WS reported that when not working a night shift, they would get about 7–8 hours sleep at night. Following a night shift (ending at 0600) they would normally sleep for about 4–5 hours in the morning and then also sleep for 1.5–2 hours in the evening. They noted that their sleep during the day was never as deep or restorative as sleep at night, and they did not always achieve this planned amount of sleep.
The WS advised that they had been experiencing some personal stress relating to caring for a family member. This had been an ongoing issue for a number of months leading up to the occurrence and had required varying and unpredictable levels of attention, and that these issues had resulted in regular disrupted sleeping patterns and had presented some difficulties at times during work hours.
The WS could not recall the exact amount of sleep they obtained during the day on 20 August (following the night shift that ended at 0600). They reported they had cared for their family member during the day on 20 August, and they probably felt a bit tired, distracted and stressed. The WS advised they had considered taking the night shift off (20 August) but felt that this would impact Sydney Trains operations and thought that they could still complete their role effectively, noting that night shifts are typically less busy than a day shift. The WS also advised that it was their perception that reporting issues with fatigue or personal matters that could influence their performance could be detrimental to the security of their employment.
Sydney Trains had a fatigue management system that included the provision of rostered duty periods and periods off duty that provided rest opportunity. It also evaluated planned rosters using a bio-mathematical model of fatigue (BMMF), and the predicted scores for the WS’s roster using this model were below the limits it had set for a signaller’s roster.
Driver A
Driver A had approximately 30 years’ experience within the rail industry and was a qualified driver trainer. On the night, driver A was conducting a route verification of competence (VOC)[14] of driver B.
Both drivers of 4WM2 commenced their shift at 1745 on 20 August at the Sydney Freight Terminal (SFT) for a rostered shift of 9 hours 37 minutes. Delays to the journey of 4WM2 extended both drivers shifts beyond their rostered finish time of 0322. Driver A finished at 0655 (13 hours 10 minutes) and driver B finished earlier at 0612 (12 hours 36 minutes) as they elected to take a taxi home.
The roster for driver A in the week prior to the incident is shown in Table 2. They were on their third shift in a row on the night of the occurrence.
Table 2: Actual duty times for driver A over the previous 7 days
Date
Duty start
Duty end
Duty time
Time free (of duty)
14 August 2019
Annual leave
15 August 2019
Annual leave
16 August 2019
Annual leave
17 August 2019
Annual leave
18 August 2019
1800
0200
8 hours
16.5 hours
19 August 2019
1830
0330
9 hours
14.2 hours
20 August 2019
1745
0655
Driver A reported that following a night shift they would normally sleep until midday and then also normally sleep for a couple of hours in the afternoon or evening prior to the next shift. The driver reported having a nap prior to commencing on 20 August but could not recall the exact amount of sleep. Driver A advised that they felt fine when they commenced on the night of the occurrence although probably felt a bit tired as the shift progressed. At the time, driver A’s commute was about 1-1.5 hours each way.
Driver B
Driver B had approximately 15 years’ experience operating trains in Australia and overseas and transferred to PN from another Australian operator in early 2018. Driver B was not qualified to operate the route and was under observation of driver A.
The roster for driver B in the week prior to the incident is shown in Table 3. They were on their second shift in a row on the night of the occurrence.
Table 3: Actual duty times for driver B over the previous 7 days
Date
Duty start
Duty end
Duty time
Time free (of duty)
14 August 2019
2038
0748
11.1 hours
24 hours
15 August 2019
Barracks – rest period for return trip 16 August
16 August 2019
0845
2037
11.9 hours
More than 48 hours
17 August 2019
Rostered off
18 August 2019
Rostered off
19 August 2019
0330
1230
9.0 hours
29.2 hours
20 August 2019
1745
0612
Driver B reported that they typically sleep around 8 hours when not on night shift. The driver advised that they would try to have a nap around 1400 and sleep for a 2-3 hours prior to a night shift but may not always have a nap. Driver B could not recall if they had napped or the amount of sleep prior to commencing on 20 August but advised that they felt pretty good when signing on. The driver advised that they probably felt a bit tired during the wait period at signal W26U. At the time, driver B’s commute was about a 1 hours each way.
Network operations
Sydney Trains as the rail infrastructure manager (RIM) is responsible for the safe operation of rail traffic across their network. Within the Sydney Trains Rail Operations Centre (ROC) there are a number of roles that assist co-ordinating movements of trains through the network and responding to incidents.
Train Service Delivery Manager
There are seven TSDMs within the ROC with each TSDM responsible for a defined network area, the boundaries for the relevant TSDMs are:
Main – Central to Emu Plains, Richmond, Olympic Park and the City Circle
North – Sydney Terminal to Berowra via Strathfield and Central to Hornsby via North Shore
Central Coast – Berowra to Hamilton
Illawarra – Bondi Junction to Waterfall (yard limit[15] inclusive) and Central to Macarthur, Merrylands and Lidcombe
South West – Bomaderry to Waterfall (yard limit exclusive) and Lithgow to Emu Plains
Freight – Monitors freight operations across the entire Sydney Trains network and liaises with the relevant TSDM to advise of any issues involving freight
Desk – assists other TSDMs with administrative functions and relieves for rest breaks.
The TSDMs are responsible for planning and monitoring train movements, developing, implementing and co-ordinating alternative train working during service disruptions.
The TSDMs liaise with the various signalling staff within the area of their control to advise of changes to standard working or in response to an incident. The Illawarra, South West and Freight TSDMs were all involved in communication relating to the movements of 4WM2 at different stages through the night.
Train 4WM2 stopped at signal W26U which was the yard limits for Waterfall and within the boundary of the TSDM Illawarra.
Network Incident Manager
There are three Network Incident Managers (NIM) within the ROC responsible for monitoring the rail network, operationally leading and managing the response to incidents on the network. The NIMs manage a defined area with each NIM covering the following TSDM areas;
North – Main, North and Central Coast
South – Illawarra and South West
Desk – assists North and South NIMs with administrative functions, relieves for rest breaks and responding to incidents and disruptions.
Duty Control Manager
The Duty Control Manager (DCM) forms the central functional and strategic operational lead within the ROC. The TSDMs and NIMs both report to the DCM.
Network rules
Sydney Trains requires that activities completed within their network are completed in accordance with their network rules and procedures. These rules apply to all rail transport operators (RTO) while within the Sydney Trains network.
Network communications
Communications within the rail network must be completed in accordance with the relevant network rules, procedures and standards. Network rule NGE 204 Network communication prescribes the rules for spoken and written communication within the Sydney Trains network. The principles of NGE 204 are that network communication must be:
Clear, brief and unambiguous
Relevant to the task at hand
Agreed to its meaning before acted upon.
Communication must also be confirmed to ensure that the messages were received correctly if the message relates to safety critical information including:
a Condition Affecting the Network (CAN)
a Proceed Authority
an instruction not to proceed
a work on track authority
a work on track method
work on track Train Running Information
Special working.
Persons completing safety critical communications must not assume the receiver understands the message before the receiver confirms they understood the message. If the meaning of spoken communication is not understood, the receiver must ask for it to be repeated.
If a person cannot communicate directly with an intended receiver, a message may be relayed to the receiver by a qualified worker.[16] The message must be relayed exactly as received.
It is also a requirement that if recorded communication devices are available, they must be utilised when communicating safety critical information.
Monitoring network communications
Network standard NS 0919 Network communications required organisations whose workers communicate within the Sydney Trains network to monitor and review network communications. Sydney Trains monitored network communications through random and routine assessments that focused on both technical and behavioural markers. Based on the assessment there may be either: no further action or participants may require coaching and further development.
Pacific National monitored network communications through the following:
auditing of local channels (PN controlled yards and terminals)
checking through their critical control verification process (safety engagements)
assessments by driver trainers as part of the VOC process.
Monitoring and reviewing network communication provides an indication of the performance of the persons involved in safety critical communication at that point in time.
Protecting activities associated with in-service rail traffic
Sydney Trains utilise network rule NTR 432 Protecting activities associated with in‑service rail traffic network procedure to provide protection for workers required to attend rail traffic while in‑service. Network procedure NPR 750 Protecting activities associated with in-service rail traffic is associated with NTR 432 and details the requirements for requesting and authorising protection, conducting work and removing protection as detailed below.
Requesting protection
The qualified worker must inform the signaller of their name, role, train details and the type of activity requiring protection. They must also identify the lines requiring protection, advise the location of work and ask the signaller to protect all points of entry into the portion of track.
The signaller must confirm all protection request details and confirm the location of the worksite. The signaller must also determine if the work requires involvement of more than one signaller to ensure that all rail traffic is excluded. If more than one signaller is required, the signallers must determine who will be the authorising signaller. In this case, protection was required on both the Up and Down main line between Waterfall and Helensburgh and as such required involvement of two signallers.
The signaller (authorising signaller) must:
make sure that blocking facilities have been applied to exclude all rail traffic.
confirm the location of the last rail traffic to enter the affected portion of track.
ensure that there is no approaching rail traffic.
The authorising signaller must tell qualified worker:
that blocking facilities have been applied.
the affected portion of track is protected.
location of the last rail traffic and confirm there is no approaching rail traffic.
The qualified worker must confirm the assurances and details with the authorising signaller.
Authorising protection
The signaller authorises protection to the qualified worker after confirming the assurances and issues a unique protection number for the protection. The qualified worker must make sure that the protection is authorised and they have been issued with a unique protection number prior to entering the danger zone.
Conducting in-service inspections
The qualified worker must ensure that a safe place[17] exists or protection has been authorised prior to entering the danger zone.
Removing protection
The qualified worker must advise the signaller of their location, train details and unique protection number and confirm that all workers are clear of the danger zone. The signaller must confirm the qualified workers details and the workers are clear of the danger zone before removing protection.
Safeworking protection
The primary method for protecting rail traffic and workers attending rail traffic was the use of fixed signals and signal blocking.
Absolute signal blocking
Absolute signal blocking (ASB) is a method of protection to prevent unauthorised rail traffic entering a protected area. Signalling staff must manipulate the appropriate absolute signals[18] and points to provide protection in accordance with the relevant network rule (NTR 432 or NWT 308).[19]
There must be two absolute signals at Stop at all potential entry points with a block (physical or electronic) applied to prevent the inadvertent activation of the signal or authorisation of rail traffic.
In addition, Sydney Trains required the signaller to complete and record all associated protection details utilising form NRF 018 Absolute Signal Blocking (ASB). The form provided the signaller with a list of requirements and could act as a memory aid to ensure the protection was completed successfully.
The communications relating to the decisions and movement of 4WM2 were assessed to understand the events leading up to the occurrence (Figure 3). It was found that while recorded network communication devices were available, not all communications, decisions or directions relating to 4WM2 were made utilising recorded communication devices as required by NGE 204.
Figure 3: Communication timeline
The timeline shows the parties involved with the decision making and communication relating to 4WM2. Times shown with an asterisk (*) are approximate times. Communication shown at 04:17:28 was driver A advising driver B of 404A by radio. Source: Sydney Trains recorded data, modified by OTSI
The TSDM Illawarra advised the WS at 0012 to hold train 4WM2 at the Waterfall accept signal (W26U) due to the track fault in the adjoining network. The TSDM discussed that 4WM2 would be too long for the goods loop or refuge loop at Waterfall and that the train may need to ‘run around [remarshal] on the Up main’. The TSDM suggested the train might be held for less than an hour.
Around 0140 the DCM requested the involvement of the NIM Desk to resolve service disruptions once it was determined freight traffic would be unable to transit through Sydney Trains network. The NIM Desk and TSDM Freight determined that 4WM2 would need to remarshal and return to Coalcliff as it would be too long for the sidings at Waterfall.
The TSDM Freight contacted the WS at 0158 to advise of the directive to remarshal 4WM2. The WS began to repeat the message when the TSDM responded with ‘they should be all over that procedure’. The WS broadly relayed the message to the crew of 4WM2 to remarshal as received.
It was a requirement of NGE 204 that messages were understood before acting on the message. In this case, the WS relayed a message that they did not understand the full meaning of. The crew of 4WM2 received the message from the WS not realising that the WS did not understand applying hand brakes required workers to enter the danger zone. Neither party explicitly clarified the requirements or meaning of messages before acting on the requests.
The TSDM Freight contacted the TSDM South West around 0158 to advise them of the plan for 4WM2; the TSDM South West responded with ‘Illawarra owns it [TSDM Illawarra]’. The TSDM Illawarra was not advised that 4WM2 would be remarshalling and was not involved again until 0338.
Prior to being directed to remarshal, the crew of 4WM2 reported discussing alternatives with the WS and IPS. The following alternatives had been discussed:
dividing the consist and storing across two sidings at Waterfall, or
utilising the Waterfall yard to remarshal the train.
The TSDM Freight contacted IPS to discuss the train path for 4WM2 and advised that 4WM2 would be remarshalling. IPS questioned why the plan of utilising Waterfall yard to store the train had changed. The TSDM Freight advised that they had been directed for the train to remarshal by higher management.
The decision for 4WM2 to remarshal and return to Coalcliff while at signal W26U was not made in consultation with or communicated to all parties. Train 4WM2 was stationary within the area of control of the TSDM Illawarra. The remarshalling movement crossed into and out of the TSDM South West’s area of control. Following the initial communication directing the train to remarshal, TSDM Freight was not involved in the movements until 0405. The three TSDMs and NIM while co-located in the ROC did not communicate effectively to discuss the movement prior to or during the remarshalling.
The TSDM Illawarra contacted the WS at 0338 enquiring about the movements of 4WM2 and raised that 404A would be approaching shortly. During the call the TSDM Illawarra reported they had been unaware that 4WM2 was remarshalling and that it had apparently been arranged by the TSDM Freight.
The lack of clear communication and consultation between relevant parties resulted in different levels of understanding among all involved. This likely affected the actions of the WS and crew of 4WM2.
Drivers are required to attend rail traffic while in the rail corridor, in particular, when there is a fault preventing the train moving to a safer location. Train 4WM2 did not have a fault and the dangers the drivers would be exposed to should have been considered before the drivers were directed to remarshal the train.
An alternate and safer location had been discussed between some of the individuals but was dismissed as it would have required the consist to be divided. The Waterfall Up sidings were available and had a number of benefits over remarshalling on the Up Illawarra:
the sidings provide some separation from rail traffic on the main line.
the track alignment, gradient, ballast and clearances would make it safer to walk.
some artificial light was present.
The change to the perceived plan held by the crew of 4WM2 of utilising Waterfall Up yard possibly created further confusion and distraction. Stabling or remarshalling at Waterfall would likely have placed less pressure (perceived or actual) on the crew as the train could have cleared the main line quickly and remarshalling in the yard required fewer hand brake applications. Additionally, there were engineering controls[20] in the yard to arrest potential uncontrolled movements should the hand brakes have failed or if insufficient hand brakes had been applied.
Safeworking irregularity
Driver A requested safeworking protection after being directed to remarshal the train. The request for protection of ‘just wondering if we can get a block on the Down there please over’ was not clear that the driver wanted protection on the Down Illawarra main line. The drivers’ request did not detail the required activity, identify the lines requiring protection, the location of the work or request that all points of entry were protected. The WS applied the following protection in response to the initial request:
Set signal W19 and W27U at Stop in the Down direction on the Up Illawarra.
Secured the points out of the refuge and set signal 41 at Stop in the Down direction.
Applied blocks to signals W19, W27U, 41 and points 57.
The protection applied by the WS protected the train on the Up Illawarra main line in the Down direction (Figure 4).
Figure 4: Safeworking protection diagram
The image shows a line diagram for the track between Waterfall and Helensburgh. The area protected by the WS is shown with a red box, the area that required protection is shown in the orange box. Protection was required on both Up and Down Illawarra main lines in both directions. Source: Sydney Trains, modified and annotated OTSI
Both Driver A and the WS appeared to be working on the assumption that the other knew what was required without seeking clarification. The driver sought confirmation of the block at 0224 and the WS responded with ‘yeah got blocks on up here on the city side of your train on the Down signals’. The driver did not detect that the WS stated there was no protection on the country (Helensburgh) side of their train.
There were a number of other activities competing for the driver’s attention that may have distracted them from the safeworking aspect of remarshalling. These include determining the number of hand brakes required to hold the wagons (3618 t) on the grade, completing brake holding (retention)[21] test and uncoupling the locomotive prior to the move.
The initial request for protection did not meet the requirements of NPR 750 and the WS did not identify the request was for protection under NPR 750.
Had the request been completed in accordance NPR 750, or the WS identified that workers were required to enter the danger zone, it is probable that additional protection would have been applied. In addition, the use of form NRF 018 Absolute Signal Blocking may have assisted if it had been used. The protection required the involvement of the WS and WNP to ensure that all points of entry were protected from rail traffic. This did not occur and the WNP was unaware of the remarshalling until 0321. The WNP facilitated the remarshalling movement but was not involved in protection arrangements for 4WM2.
After the locomotives had travelled to Helensburgh and returned to the stabled consist, driver B requested protection. The request for protection was informal, did not specify the required protection and was requested in a similar manner to driver A. The WS advised the driver that ‘I’ve got blocks on the Down and blocks on the Up. So we’ve taken away control from north panel (WNP) and there’s blocks on the Down’. The WS was referring to the protection on the Up main in the Down direction. Having not identified workers needed to access the danger zone in the first instance, the WS repeated the protection applied previously.
Driver B completed a Take 3[22] form noting ‘750 block’ as the method of safeworking protection before entering the danger zone. The driver believed that the requirements of NPR 750 had been met, assuming that their request had been understood as a request for protection on both the Up and Down Illawarra main lines.
Both drivers entered the danger zone unknowingly with no protection on the Down Illawarra in either direction and were at risk of being struck by rail traffic. No trains passed through the area while driver A was in the danger zone.
Driver A signalled to the driver of 404A to stop by switching the marker lights to red and displaying a stop hand signal[23] from the drivers cab. The driver of 404A responded to the stop signal and made an emergency brake application stopping on approach to the location of driver B.
Fatigue and alertness
Introduction
Fatigue can have a range of adverse influences on human performance, including slowed reaction time, decreased work efficiency, reduced motivational drive, increased variability in work performance and more lapses or errors of omission (Battelle Memorial Institute, 1998), as well as various effects on decision making (Harrison and Horne, 2000).
Sleep is vital for recovery from fatigue, with both the quantity and quality of sleep being important. Most people need at least 7–8 hours of sleep each day to achieve maximum levels of alertness and performance. Research has shown that obtaining less than 5 hours sleep in the previous 24 hours is inconsistent with a safe system of work (Dawson and McCulloch, 2005), with some research indicating less than 6 hours sleep can increase risk (Thomas and Ferguson, 2010, Williamson and others, 2011).
In addition to sleep, a number of other factors can increase fatigue, including time of day, time awake and the nature of work activities. Working during the window of circadian low or tough, from about 0200 to 0600, has been associated with increased sleepiness, slower response times and increased errors and incidents (Battelle Memorial Institute, 1998).
Waterfall Signaller
In this case, it is unclear exactly how many hours of sleep the WS had in the 24 or 48 hours prior to the incident. However, based on the available information, it is likely that they had less hours of sleep than normal following a night shift, and this sleep was disrupted. In addition, it is likely that the WS was experiencing a level of cumulative fatigue due to non-work related factors. The incident also occurred during the period between approximately 0200 and 0420. Overall, based on this information, due primarily to non-work-related factors, the WS was probably experiencing a level of fatigue that has been demonstrated to adversely influence performance.
Conducting night shift work undoubtedly increases the potential for fatigue, and most people will not be able to sleep as effectively during the day as during their normal sleep periods at night. However, fatigue risk can be reduced to an acceptable level with the use of a set of appropriate risk controls. In this case, Sydney Trains had limited the WS’s overnight duty periods to 8 hours and ensured there was a significant period of time off duty between duty periods.
Fatigue management is a responsibility shared between the organisation and employees. Employees are responsible for utilising the provided rest periods and managing their non-work related fatigue. In addition, they must report if they are affected by fatigue or unfit for duty in any other way.
In this case, the WS had not advised their employer of the potential for them to be affected by fatigue prior to commencing duty on the night of 20 August. It should be recognised that most people generally underestimate their level of fatigue (Battelle Memorial Institute 1998). Although it appeared the WS had some level of concern about their fitness for duty, it is likely that they did not fully appreciate the extent to which their performance could be affected.
The WS also advised that they perceived there could be some negative consequences associated with reporting that they were fatigued or not fit for duty. Such reservations are common in some organisations, and the ATSB did not fully examine the extent to which this was a commonly perceived problem amongst other Sydney Trains employees. However, this incident provides a reminder to all organisations and safety-critical workers of the importance of reporting concerns about their fitness for duty if their sleep has been adversely affected in the period prior to commencing work.
Although it is likely that the WS was experiencing fatigue, it is unclear based on the available evidence that the fatigue contributed to the limitations in their performance involved in this incident. It is likely there were that other factors including the personal stress and distraction and poor communications relating to the occurrence impacted their performance.
Crew of 4WM2
Both drivers of 4WM2 commenced their shift at 1745 on 20 August. Delays to the journey of 4WM2 extended both drivers' shifts beyond their rostered finish time of 0322. Driver A finished at 0655 (13 hours 10 minutes) and driver B finished earlier at 0612 (12 hours 36 minutes). However, both drivers had sufficient sleep opportunity prior to commencing their shift.
The first safeworking irregularity occurred within the drivers' rostered shift with the second occurring close to their rostered finish time. The drivers' shift extended approximately two hours after the safeworking irregularity in which time the remarshalling was completed and the crew were relieved.
There was a period of low workload between approximately 0030 and 0200 while stationary at signal W26U. Both drivers reported that during that period they probably felt a bit tired. It is possible that the combination of a period of low workload, time of night and time on shift may have increased their risk of fatigue-related errors. However, based on the available information, there was insufficient evidence to conclude that the drivers were experiencing a level of fatigue known to affect performance.
ATSB investigation report findings focus on safety factors (that is, events and conditions that increase risk). Safety factors include ‘contributing factors’ and ‘other factors that increased risk’ (that is, factors that did not meet the definition of a contributing factor for this occurrence but were still considered important to include in the report for the purpose of increasing awareness and enhancing safety). In addition ‘other findings’ may be included to provide important information about topics other than safety factors.
These findings should not be read as apportioning blame or liability to any particular organisation or individual.
From the evidence available, the following findings are made with respect to the safeworking irregularity involving the crew of freight train 4WM2 on 21 August 2019.
Contributing factors
The safeworking network rules and procedures for protecting activities associated with in-service rail traffic were not effectively utilised by the either crew of train 4WM2 or the Waterfall Signaller to ensure workers in the danger zone were protected from rail traffic.
There were multiple parties involved in the decision making and communications relating to the movements of train 4WM2. A lack of clear communication lead to confusion and misunderstanding of the required activities.
The Sydney Trains and Pacific National personnel did not ensure that network communications were conducted in accordance with network rule NGE 204.
Other factors that increased risk
Primarily associated with non-work related factors, the Waterfall signaller was probably experiencing a level of fatigue that has been demonstrated to adversely influence performance.
The location the crew of 4WM2 were directed to remarshal the train placed the crew at increased risk as the area was remote, poorly lit and difficult to access.
Other findings
The Waterfall Up sidings were available as a safer and practical alternative to either stow or remarshal the train until normal operations resumed.
Safety actions
Safety action not associated with an identified safety issue
Whether or not the ATSB identifies safety issues in the course of an investigation, relevant organisations may proactively initiate safety action in order to reduce their safety risk. The ATSB has been advised of the following proactive safety action in response to this occurrence.
Proactive safety action by Sydney Trains
Sydney Trains advised that the following proactive safety actions had been taken:
The Waterfall Signaller completed training and coaching in the establishment of protection associated with in-service rail traffic before returning to full duties.
Reviewed the risk management processes applied by Network Operations to the management of controls nominated as critical, including critical control nomination, type and frequency of assurance activities, control effectiveness rating and control improvement activities.
Reviewed the risk management process applied by Network Operations to the network hazard identified as ‘Person in path of rail vehicle / Worker in path of rail vehicle - Absolute Signal Blocking (ASB) incorrectly implemented/maintained’, in the context of conducting protection activities associated with in-service rail traffic.
Reviewed the processes as they relate to incident management and the duties, responsibilities, interdependencies and relationships between Duty Control Managers, Network Incident Managers, Train Service Delivery Managers, Area Controllers, Signallers and Qualified Workers.
Reviewed the processes relating to the assessment of the ongoing competence of Signallers engaged in protection activities associated with in-service rail traffic.
Reviewed the processes as they relate to the assessment of the ongoing competence of Drivers engaged in protection activities associated with in-service rail traffic.
Proactive safety action by Pacific National
Pacific National advised they reviewed the process for the protection of in-service rail traffic inspection and activities and ensured the requirements of both Pacific National and the Network Owners, were reinforced and understood by all required train crew.
Sources and submissions
Sources of information
The sources of information during the investigation included the:
Drivers of 4WM2
Pacific National
Sydney Trains
Waterfall Signaller.
References
Battelle Memorial Institute (1998). An Overview of the scientific literature concerning fatigue, sleep, and the circadian cycle. Report prepared for the Office of the Chief Scientific and Technical Advisor for Human Factors, United States Federal Aviation Administration.
Dawson D & McCulloch K (2005). Managing fatigue: It’s about sleep, Sleep Medicine Reviews, vol. 9, pp. 365–380.
Harrison H & Horne JA (2000). The impact of sleep deprivation on decision making: A review, Journal of Experimental Psychology, vol. 6, pp. 236–249.
McInerney, PA. (2005). Special Commission of Inquiry into the Waterfall Rail Accident, Final Report, Vol 1.
Rail Industry Safety and Standards Board (2020). Glossary of Terms.
Sydney Trains (2015). Rail Industry Safety Induction Handbook, v5.1.
Sydney Trains (2018). NGE 204 Network communications, v4.1.
Sydney Trains (2018). NPR 750 Protecting activities associated with in-service rail traffic, v3.0.
Sydney Trains (2018). NTR 432 Protecting activities associated with in-service rail traffic, v3.0.
Sydney Trains (2019). NRF 018 Absolute Signal Blocking (ASB), v2.2.
Sydney Trains (2019). NS 0919 Network communications, v7.0.
Sydney Trains (2019). NWT 308 Absolute Signal Blocking, v8.2.
Thomas MJW & Ferguson SA (2010). Prior sleep, prior wake, and crew performance during normal flight operations, Aviation, Space, and Environmental Medicine, vol. 81, pp. 665–670.
Williamson A, Lombardi DA, Folkard S, Stutts J, Courtney TK & Connor JL (2011). The link between fatigue and safety, Accident Analysis and Prevention, vol. 43, pp. 498–515.
Submissions
Under section 26 of the Transport Safety Investigation Act 2003, the ATSB may provide a draft report, on a confidential basis, to any person whom the ATSB considers appropriate. That section allows a person receiving a draft report to make submissions to the ATSB about the draft report.
A draft of this report was provided to the following directly involved parties:
Drivers of 4WM2
Office of the National Rail Safety Regulator
Pacific National
Sydney Trains
Transport for NSW
Waterfall Signaller.
Submissions were received from:
Office of the National Rail Safety Regulator
Pacific National
Sydney Trains.
The submissions were reviewed and, where considered appropriate, the text of the report was amended accordingly.
Purpose of safety investigations & publishing information
Purpose of safety investigations
The objective of a safety investigation is to enhance transport safety. This is done through:
identifying safety issues and facilitating safety action to address those issues
providing information about occurrences and their associated safety factors to facilitate learning within the transport industry.
It is not a function of the ATSB to apportion blame or provide a means for determining liability. At the same time, an investigation report must include factual material of sufficient weight to support the analysis and findings. At all times the ATSB endeavours to balance the use of material that could imply adverse comment with the need to properly explain what happened, and why, in a fair and unbiased manner. The ATSB does not investigate for the purpose of taking administrative, regulatory or criminal action.
Terminology
An explanation of terminology used in ATSB investigation reports is available here. This includes terms such as occurrence, contributing factor, other factor that increased risk, and safety issue.
Publishing information
Released in accordance with section 25 of the Transport Safety Investigation Act 2003
Ownership of intellectual property rights in this publication
Unless otherwise noted, copyright (and any other intellectual property rights, if any) in this report publication is owned by the Commonwealth of Australia.
Creative Commons licence
With the exception of the Coat of Arms, ATSB logo, and photos and graphics in which a third party holds copyright, this publication is licensed under a Creative Commons Attribution 3.0 Australia licence.
Creative Commons Attribution 3.0 Australia Licence is a standard form licence agreement that allows you to copy, distribute, transmit and adapt this publication provided that you attribute the work.
The ATSB’s preference is that you attribute this publication (and any material sourced from it) using the following wording: Source: Australian Transport Safety Bureau
Copyright in material obtained from other agencies, private individuals or organisations, belongs to those agencies, individuals or organisations. Where you wish to use their material, you will need to contact them directly.
On the afternoon of 8 August 2019, a De Havilland Aircraft of Canada DHC-8-315 was being operated by QantasLink on a flight from Adelaide to Whyalla, South Australia.
The flight proceeded normally until just after top of descent when a loud repetitive banging noise started in the cabin. The cabin crew decided to break the protocols for the sterile cockpit environment to inform the flight crew, via the interphone, of the abnormal noise. The flight crew could not hear the noise in the cabin and were unaware of the situation.
Further investigation by the cabin crew identified that the noise was coming from the vicinity of the right rear emergency exit at seat row 10. They then identified a yellow object flapping on the outside of the aircraft, just below the exit. The flight crew concluded that the right ditching dam had likely deployed. The decision was made to continue to Whyalla, where an uneventful landing was conducted.
After landing, it was confirmed that the right rear emergency exit ditching dam had opened in flight, and had been destroyed by aerodynamic forces.
What the ATSB found
The operator subsequently determined that the ditching dam had not inflated but rather, for reasons that could not be determined, the ditching dam cover had opened in flight, allowing the uninflated dam to unfurl into the slipstream. The opening of the ditching dam did not affect the safety of other aircraft systems or the continued flight.
The cabin crew informing the flight crew of the issue while the aircraft was on descent had the potential to be a distraction. However, the cabin crew’s decision to break the sterile cockpit environment and alert the flight crew to the situation was appropriate.
Safety message
Not every system in an aircraft is controllable or monitored by the flight crew. Cabin crew should not hesitate to inform flight crew of abnormal conditions within or external to the cabin, as flight crew may be unaware of the situation.
The occurrence
What happened
On the afternoon of 8 August 2019, a De Havilland Aircraft of Canada DHC-8-315 was being operated by QantasLink on a flight from Adelaide to Whyalla, South Australia. For both the flight crew and cabin crew, it was the first of four scheduled passenger flights for the day. The captain was the pilot flying and the first officer was the pilot monitoring.[1] The planned flight time to Whyalla was approximately 35 minutes.
Conditions for the flight were as forecast, with severe turbulence and icing conditions at lower levels. Once the aircraft reached the cruise altitude of 16,000 ft, it was clear of cloud and the crew described the conditions as calm.
At top of descent, the first officer made a public address to the cabin informing the cabin crew to ‘Prepare the cabin for landing’. This was acknowledged by the first flight attendant over the aircraft interphone. At this point, a loud repetitive banging noise started in the cabin.
The cabin crew initially suspected the sound was ice coming off the propellers and hitting the fuselage, which they had been briefed on before the flight. However, both cabin crew were confused by the volume and intensity of the noise, which did not align with their previous experience of flying in icing conditions. The cabin crew decided to break the sterile cockpit environment (see the section titled Sterile cockpit procedures) to inform the flight crew, via the interphone, of the abnormal noise in the cabin.
Up until that time, the flight crew were unaware of the issue and their only indication of a problem was being able to hear the noise when talking to the cabin crew over the interphone. There were no cockpit warnings. The captain transferred flying duties to the first officer so he could coordinate the cabin crew investigation, radio communication and decision-making tasks. The descent was halted and the aircraft held at the Whyalla RNAV holding point.
Upon further investigation by the cabin crew, they identified the sound was coming from the vicinity of the right rear emergency exit at seat row 10. Shortly after, they identified through the window a yellow object flapping on the outside of the aircraft, just below the exit. Based on this information, the flight crew concluded that the right ditching dam had possibly deployed (see the section titled Ditching dam).
The flight crew contacted their maintenance organisation and a decision was made to continue to Whyalla. The captain resumed pilot flying duties and the aircraft landed without further incident.
After landing, it was confirmed that the ditching dam at the right-hand rear emergency exit had opened in flight and been destroyed by aerodynamic forces (Figure 1).
Post-flight maintenance
It was subsequently determined that the ditching dam had not inflated but rather, for unknown reasons, the ditching dam cover had opened in flight, allowing the uninflated dam to unfurl into the slipstream. When the replacement ditching dam assembly cover was installed, it did not initially meet the required engagement tolerance into the airframe channel that retains it. The flight crew member who conducted the pre-flight inspection reported that the ditching dam cover was securely engaged before the flight.
Figure 1: The ditching dam as found upon landing
Source: Qantaslink. Annotated by ATSB.
Context
Ditching dam
The ditching dam on the rear Type III emergency exits of a DHC-8-315 is an inflatable device that activates on operation of the exit hatch to minimise water ingress into the cabin after a ditching or landing on water. The device is only required for high-weight operations when the aircraft would sit lowest in the water. For the occurrence flight, the aircraft would not have required the ditching dam to be available. The inflation is automated and there are no controls or indications in the cockpit of its deployment.
Previous occurrences
A review of reports on inflatable ditching dams for De Havilland Aircraft of Canada DHC-8-300 series aircraft was conducted using the following sources:
Australian Transport Safety Bureau’s Aviation Occurrence Database
Civil Aviation Safety Authority’s Defect Report Service (DRS)
Federal Aviation Administration’s Service Difficulty Reporting (SDR)
Transport Canada’s Continuing Airworthiness Web Information System (CAWIS).
Since 1982, there were a total of 22 reports, of which 13 were in-flight deployments. Most in‑flight deployments were due to leaking fuselage adaptor burst discs or discs that had burst for unidentified reasons. When this occurs, leaky inflation bottle valves or fuselage pressurisation can lead to the ditching dam bag inflating.
However, five in-flight deployments were not the result of inadvertent inflation of the bag, with no reason for the deployment identified. Three of the reports stated that the deployment occurred during either cruise or descent.
None of the reports indicated any subsequent damage or interference with other aircraft systems.
Sterile cockpit procedures
A sterile cockpit environment incorporates procedures throughout safety critical phases of flight, such as take‑off and landing, during which non-essential activities and communications are not permitted. For approach and landing, many operators start the sterile cockpit environment following acknowledgement of the ‘Prepare the cabin for landing’ call. While it is primarily focused on communication between flight crew members, it also applies to cabin crew contact with the cockpit.
With the introduction of reinforced cockpit doors, it has been recognised that this has had the effect of introducing an additional psychological barrier between flight crew and cabin crew. There has been a history of misunderstanding and hesitancy by cabin crew of informing flight crew of critical and sometimes life-threatening situations occurring in or external to the cabin of the aircraft[2].
Safety analysis
The specific reason for the ditching dam cover opening could not be determined.
While the aircraft had operated in both severe icing and turbulence during the initial part of the flight, conditions were benign when the device opened. However, it is possible that earlier exposure to these severe weather conditions may have affected the security of the cover.
It was reported that the cover was secure prior to the flight, but post‑occurrence replacement of the ditching dam identified that it did not initially meet the required engagement tolerance into the airframe retaining channel. That raised the possibility that the occurrence cover may have appeared to be visually secure during the pre‑flight inspection while also not being properly engaged.
Once the cover partially opened, aerodynamic forces drove the cover fully open and permitted the dam bag to unfurl into the airstream. The bag, cover and inflation hose then hit the fuselage repeatedly, which was the loud noise heard by the occupants of the aircraft. As a result of the deployment and given its location on the aircraft, if the device or part thereof had come loose, it was unlikely to have resulted in further damage to the aircraft.
The ditching dam opened when flight crew had initiated the sterile cockpit procedures for approach to Whyalla Airport. The cabin crew chose to break the sterile cockpit environment to inform flight crew of the issue. This had the potential to distract the flight crew from other flying-related tasks. However, this was appropriately balanced by the need to inform the flight crew of an abnormal situation of unknown severity. The ATSB considered that the cabin crew acted appropriately in informing the flight crew of the abnormal noise in the cabin. Management of the unexpected deployment was controlled through the use of non‑normal checklists and effective resource management.
Findings
These findings should not be read as apportioning blame or liability to any particular organisation or individual.
The ditching dam cover opened in‑flight, possibly due to exposure to severe icing and turbulence and/or improper engagement of the cover with the airframe.
The deployment of the ditching dam did not increase the risk of damage to other aircraft systems or to continued safe flight.
The ditching dam deployment occurred when flight crew had started sterile cockpit procedures but before cabin crew were required to be seated. It was appropriate that the cabin crew chose to break the sterile cockpit environment to inform flight crew of the issue.
Purpose of safety investigations
The objective of a safety investigation is to enhance transport safety. This is done through:
identifying safety issues and facilitating safety action to address those issues
providing information about occurrences and their associated safety factors to facilitate learning within the transport industry.
It is not a function of the ATSB to apportion blame or provide a means for determining liability. At the same time, an investigation report must include factual material of sufficient weight to support the analysis and findings. At all times the ATSB endeavours to balance the use of material that could imply adverse comment with the need to properly explain what happened, and why, in a fair and unbiased manner. The ATSB does not investigate for the purpose of taking administrative, regulatory or criminal action.
Terminology
An explanation of terminology used in ATSB investigation reports is available here. This includes terms such as occurrence, contributing factor, other factor that increased risk, and safety issue.
Publishing information
Released in accordance with section 25 of the Transport Safety Investigation Act 2003
Ownership of intellectual property rights in this publication
Unless otherwise noted, copyright (and any other intellectual property rights, if any) in this report publication is owned by the Commonwealth of Australia.
Creative Commons licence
With the exception of the Coat of Arms, ATSB logo, and photos and graphics in which a third party holds copyright, this publication is licensed under a Creative Commons Attribution 3.0 Australia licence.
Creative Commons Attribution 3.0 Australia Licence is a standard form licence agreement that allows you to copy, distribute, transmit and adapt this publication provided that you attribute the work.
The ATSB’s preference is that you attribute this publication (and any material sourced from it) using the following wording: Source: Australian Transport Safety Bureau
Copyright in material obtained from other agencies, private individuals or organisations, belongs to those agencies, individuals or organisations. Where you wish to use their material, you will need to contact them directly.
On 12 August 2019, a Piper Aircraft Inc. PA-36-300, registered VH-TVU (TVU), departed Latrobe Regional Airport, Victoria, at 0830 Eastern Standard Time, on a ferry flight to Coffs Harbour, New South Wales. The aircraft had recently been sold and the new owner had arranged for the aircraft to be ferried to New Zealand. Shortly after take-off, the engine power reduced to below idle. Faced with limited options, the pilot conducted a forced landing into a paddock. During the approach, the aircraft struck power lines and subsequently contacted a fence and tree stumps during the landing. The pilot suffered minor injuries and the aircraft was substantially damaged.
What the ATSB found
The ATSB found that the engine power loss was probably the result of water‑contaminated fuel, and that the methods used to detect and remove the water before the flight were unreliable. An inspection of the fuel control unit also detected additional contamination that may have hindered fuel flow to the engine.
Finally, the aircraft was utilising the chemical hopper as a ferry fuel tank, contrary to the recommendation of the aircraft manufacturer, and no approved technical data could be provided on the installed fuel system.
Safety message
This accident highlights the danger of water‑contaminated fuel, a topic discussed in CASA Airworthiness Bulletin AWB 28-008. While this bulletin is related to aircraft using AVGAS or MOGAS, it is also relevant to the use of turbine fuel. It discusses the issue of water entering the fuel system through poor fitting, unapproved, incorrectly adjusted, or failed seals on the fuel caps or damaged/distorted tank filler necks.
When conducting fuel contamination checks, it is important that the check is positive and does not rely on sensory perceptions of colour and smell, as these can be deceptive. There are a number of ways this can be done:
place a small quantity of known fuel in container before taking the fuel sample
use a water-detecting paper or paste
check for cloudiness or other evidence of suspended water droplets, particularly in turbine fuel.
The accident also illustrates the importance of being mentally prepared for an emergency. In this case, the pilot had secured the seatbelts over their flying suit prior to take-off. The pilot had also conducted a pre-take-off brief, so was prepared to take immediate action when an engine power loss occurred. An article in Flight Safety Australia ‘Your one and only: mitigating the risk of engine failure in singles’ advises that:
Rather than passively waiting for power loss and falling back on trained responses, pilots must actively defend their aircraft against the consequences of engine failure. Know your aircraft and procedures. Fly as high as practical, keep your options open and have a clear plan rehearsed for engine failure during every sequence of flight.
The investigation
Decisions regarding whether to conduct an investigation, and the scope of an investigation, are based on many factors, including the level of safety benefit likely to be obtained from an investigation. For this occurrence, a limited-scope investigation was conducted in order to produce a short investigation report, and allow for greater industry awareness of findings that affect safety and potential learning opportunities.
The occurrence
On 12 August 2019, at around 0820 Eastern Standard Time,[1] a Piper Aircraft Inc. PA-36-300, registered VH-TVU (TVU), departed Latrobe Regional Airport, Victoria, on a flight to Coffs Harbour, New South Wales, the first leg of a ferry flight to New Zealand.
On the day before the accident, the pilot detected water in the fuel within the chemical hopper (hopper), which was being used as a fuel tank, and consequently fully drained approximately 40 L of fuel from the hopper by opening the bottom cam lock. The aircraft was then refuelled to full, including the hopper, and the pilot reported that they[2] conducted a fuel drain to check for water contamination. The fuel was drained from each aircraft fuel tank into two opaque 3-litre containers. Fuel from one container was ignited to confirm it was fuel. The second container was examined a significant time after the accident, and a small amount of water was identified. The pilot advised it was not raining when the aircraft was refuelled, but it had been raining in the days prior.
The pilot arrived at the aircraft on the morning of the accident, and conducted a pre-flight inspection, including another fuel drain. The fuel was checked by sight and smell and the pilot did not detect any water.
The plan was to fly to Coffs Harbour where the aircraft would be refuelled and then flown to Lord Howe Island, for the first section of the over-water flight to New Zealand. The pilot was prepared for a long, cold flight that day and wore a thick neoprene flying suit with Nomex flying gloves. They were not wearing a helmet, because the flight was not an agricultural operation. After entering the cockpit, the pilot adjusted the four-point harness to fit tightly over their flying suit.
The pre-take off checklist was actioned, and the main fuel tanks were selected for the take-off, with the hopper fuel tank selected OFF. The pilot conducted a pre-take-off safety brief and lined up on runway 21 with a crosswind, as this runway provided more landing options if the engine failed after take-off. After the departure, a left turn on to the crosswind leg of the circuit was conducted followed by a turn to the north, staying below the overcast cloud at around 500 ft above ground level. The pilot planned to track east of the airport over a semi-rural area (Figure 1), continuing in a northerly direction before joining the departure track to avoid a township further to the east.
As the take‑off flap was raised and the departure course set, the engine power reduced to below idle, and the aircraft could not maintain height. The pilot immediately selected the electric fuel pump to ON and set the igniters to continuously ON. A paddock was selected, which the pilot later advised was not ideal as it had a downwind component but was the best landing site option among the properties in the area.
Figure 1: Latrobe Valley Airport and the accident site
Source: Google Earth annotated by ATSB
During the approach to the paddock, the pilot detected power lines directly ahead and elected to descend below them. While flying under these, the propeller struck and cut a smaller power line running beneath the main lines on the same poles, which the pilot had not seen.
The selected paddock had a fence running down the middle. To ensure this was not struck while the aircraft was airborne, the pilot intentionally landed the aircraft hard before reaching the fence. The right wing struck one of the fence posts resulting in separation of the outboard wing section. A number of tree stumps in the paddock were also struck, removing the undercarriage legs (Figure 2).
As the aircraft came to a stop, the pilot undid the harness and moved away from the aircraft in case it caught fire. When this did not occur, they returned and, as the engine was still running, pulled the condition lever back to idle and selected the master switch to OFF.
The pilot did not dump the fuel in the hopper during the forced landing sequence, to avoid contaminating the houses in the area.
Figure 2: VH-TVU after the accident with undercarriage and right-wing section missing.
Source: Pilot
Context
Aircraft
The aircraft was a Piper Aircraft Inc. PA-36-300 single engine, low-wing, agricultural aircraft, which had been fitted with a Pratt & Whitney Canada PT6A-20 turboprop engine. The aircraft had recently been refurbished and a hot section inspection had been completed on the engine. It had received an export certificate of airworthiness, indicating that all required maintenance had been completed.
Weather
Weather observations at Latrobe Valley Airport showed that there had been significant rainfall in the days before the accident (Table 1).
Table 1: Rainfall at Latrobe Valley
Date
Rainfall
8 August 2019
13.4 mm
9 August 2019
3.8 mm
10 August 2019
26.2 mm
11 August 2019
31.0 mm
Source: Bureau of Meteorology
The pilot advised the aircraft had been flown to Latrobe Valley Airport the week before the accident and had been parked on the apron since.
Main fuel system
Each wing had a bladder-type fuel tank filled with reticulated polyurethane foam to prevent fuel sloshing in the tank. The tanks were filled separately through a cap on each wing. They each fed into a small header tank, with a single on/off valve. An electric fuel pump acted as a primer and as a back-up fuel pump if the engine driven fuel pump failed. Fuel drains were located on the underside of both wings, on the fuel filter and on the underside of the fuselage, which was the drain for the header tank.
An inspection of the fuel caps following the accident found that the seals were in good condition. It also showed that the necks on the fuel tanks were raised to avoid water running into the tanks.
According to the United States Federal Aviation Administration Advisory Circular AC 20-125:
Water can enter the aircraft fuel system through leaks in the vents, seals, or poorly fitting fuel caps on filler openings during rain … by condensation and precipitation (especially when an aircraft has partially filled tanks) …
and that:
Water occurs in aviation fuel in two forms: dissolved and free:
Dissolved water: all aviation fuels dissolve water in varying amounts depending upon the fuel composition and temperature. Dissolved water in fuel is similar to humidity in air. Lowering the fuel temperature will cause dissolved water to come out of solution as free water.
Free water: Any water in excess of that which will dissolve is called free water. Free water can appear either as water slugs or as entrained water (suspended tiny droplets of water in fuel).
Aircraft engines can tolerate a small amount of free water (30 parts per million is usually considered maximum) if it is in a fine and uniformly dispersed state.
Smaller amounts of entrained water can be detected by testing with a clean and dry clear glass bottle. If fuel is acceptably dry it will appear bright with fluorescent appearance and will not be cloudy or hazy.
Chemical hopper
The aircraft had been configured to use the hopper as a ferry fuel tank. The door for the hopper hinged at the rear and sat over a raised rim that pressed into a seal (Figure 3).
Figure 3: Chemical hopper
Source: Supplied
The hopper fuel tank was selected ON using an ON/OFF tap in the cockpit. This connected to the main fuel system before the main fuel filter, ensuring the fuel passed through two filters before it entered the fuel system. No approved technical data could be provided to show how the system was installed in the aircraft.
Additionally, the pilot’s operating handbook stated that:
The chemical hopper is not designed for the storage of fuel; therefore, the use of the hopper as a spare fuel tank is not recommended.
Aircraft fuel checks
Civil Aviation Order 20.2 Air service operations – Safety precautions before flight part 5 ‘Fuel system inspection’ advised:
It is important that checks for water contamination of fuel drainage samples be positive in nature and do not rely solely on sensory perceptions of colour and smell, both of which can be highly deceptive. The following methods are acceptable:
1. Place a small quantity of fuel into the container before taking samples from tank or filter drain points. The presence of water will then be revealed by a visible surface of demarcation between the two fluids in the container.
2. Check the drainage samples by chemical means such as water detecting paper or paste, where a change in colour of the detecting medium will give clear indication of the presence of water.
3. In the case of turbine fuel samples, tests should also include inspection for persistent cloudiness or other evidence of the presence of suspended water droplets, which will not necessarily be detected by methods mentioned in notes 1 and 2. Should any doubt exist of the suitability of the fuel, the checks specified in the aircraft Operators Maintenance Manual should be followed. It is advisable to allow turbine fuel a reasonable period of stagnation before drawing test samples from fuel drain points; this allows settling of suspended water which is a slower process in turbine fuel than in aviation gasoline.
This order also stated:
If, at any time, a significant quantity of water is found to be present in an aircraft fuel system, the operator and pilot in command must ensure that all traces of it are removed from the fuel system, including the fuel filters, before further flight.
Note: In eliminating water from an aircraft fuel system, it is important that consideration be given to the possibility of water lying in portions of the tanks or fuel lines where, because of the design of the system or the existing attitude of the aircraft, it is not immediately accessible to a drain point.
Pilot experience
The pilot had around 24,500 hours of flying experience with about 400 hours on the aircraft type. They had flown TVU extensively a number of years previously and had recently ferried it to Latrobe Valley Airport. The pilot had about 6,000 hours flying in aircraft with PT6 engines.
Engine inspection
An inspection of the engine, conducted 7 weeks after the accident, did not find any defect or degradation that would have contributed to the engine power loss. However, the inspection identified a significant quantity of water in the fuel system, including in the airframe fuel bowl, fuel pump, and the fuel control unit (drained at the flow divider) (Figure 4).
Figure 4: Photographs of water detected in the fuel system
Source: Provided by aircraft insurer, annotated by ATSB
Based on engine data (Figure 5), there was no indication of an engine surge that caused the power reduction. Unexplained variation of fuel flow was recorded prior the power reduction. Pratt and Whitney Canada reviewed the data and consider the fuel flow recording is inaccurate.
Figure 5: Engine data
Legend: ITT - Interstage turbine temperature: WF - Fuel flow; NG - Gas generator rotation speed indication
Source: Provided by the aircraft insurer
Fuel control unit
The fuel control unit (FCU) was sent to a specialist PT6 engine accessory overhaul facility for detailed technical examination. That investigation determined that there was contamination (an off-white jelly substance that could be the result of incorrectly mixed anti‑icing additive) in the fuel section of the FCU, which may have hindered or resulted in abnormal fuel flow (Figure 6). The pilot advised that they did not use anti-ice additives. Evidence of blue grease was present at the drive shaft bearing retaining plate. This was indicative of a previous fuel or oil leak with the potential to damage the FCU bearing due to insufficient lubrication. No further detail was available at the time of writing.
Figure 6: Contamination within the fuel control unit
Source: Provided by the aircraft insurer, annotated by ATSB
Safety analysis
During the departure, when the aircraft was operating at about 500 ft to avoid low-level cloud, the power level reduced below idle. The low altitude left the pilot with little choice in the selection of the area to conduct the forced landing. Consequently, the landing was conducted with a downwind component, in a paddock with obstacles, resulting in substantial aircraft damage.
Based on the significant quantity of water identified in the aircraft fuel system components after the accident, and the absence of any other engine defect, the ATSB concluded that the engine power loss was probably the result of water contamination. The water detected in the hopper during the aircraft inspection on the day before the accident indicated that, despite the seal and lip, water could enter the chemical hopper. Therefore, it was considered a possible source of water contamination to the fuel system. However, as the ferry fuel system was reportedly not used during the accident flight, there was no obvious mechanism for such contamination to enter the aircraft’s fuel system. It is also possible that the water entered the wing tanks while the aircraft was exposed to rain in the days leading up to the accident, as the fuel tanks were only partially filled.
The methods used to check for water in the fuel—opaque sampling containers/fuel sight and smell were not in accordance with the Civil Aviation Safety Authority and United States Federal Aviation Authority guidance for pre-flight fuel testing and did not assure that there was no suspended water droplets—a particular risk with turbine fuel. Nor did they ensure that the fuel drain conducted on the morning of the flight, was free of water.
Given the elapsed time between refuelling and the accident flight, it is possible that any suspended water separated out overnight as the fuel cooled. In that case, the change in aircraft attitude associated with the departure and level off may have permitted water to move to the fuel pick up in the fuel tanks, resulting in the power loss.
However, the engine data showed that the engine did not surge when the power loss occurred. This could indicate that the water droplets had stayed in suspension and resulted in the engine not producing enough power to maintain flight. The time between the accident and the engine inspection would have allowed any water droplets to separate out of suspension from the fuel, as found during the examination.
In addition to the water found in the fuel, the examination of the fuel control unit showed additional contamination and grease washout, which may have also hindered the fuel flow to the engine. However, there was insufficient available information to determine if that occurred.
Finally, the use of the chemical hopper as a ferry tank was contrary the manufacturer’s advice and no approved technical data was available for the modification. Using approved and documented engineering processes to make changes to a safety-critical aircraft system is important, as it ensures the design complies with applicable airworthiness standards or an equivalent level of safety.
Findings
ATSB investigation report findings focus on safety factors (that is, events and conditions that increase risk). Safety factors include ‘contributing factors’ and ‘other factors that increased risk’ (that is, factors that did not meet the definition of a contributing factor for this occurrence but were still considered important to include in the report for the purpose of increasing awareness and enhancing safety). In addition, ‘other findings’ may be included to provide important information about topics other than safety factors.
These findings should not be read as apportioning blame or liability to any particular organisation or individual.
From the evidence available, the following findings are made with respect to the power loss and forced landing involving a Piper Aircraft Inc. PA-36-300, registered VH-TVU that occurred near Latrobe Valley Airport, Victoria on the 12 August 2019.
Contributing safety factors
Due to a layer of low cloud, the aircraft was operating at low level over a semi-rural area when the engine power reduced to a level below that required to maintain altitude.
The engine power loss was probably due to undetected water contamination in the fuel and possibly additional contamination/mechanical issues with the fuel control unit.
Other factors that increased risk
The chemical hopper was being used as a ferry tank contrary to the recommendation of the aircraft manufacturer and no approved technical data could be provided on the installed fuel system.
Sources and submissions
Sources of information
The sources of information during the investigation included the:
pilot’s recollection of the accident flight
photographs taken on the day of the accident
Bureau of Meteorology
maintenance organisation for VH-TVU
aircraft and engine manufacturers
Civil Aviation Safety Authority.
Submissions
Under section 26 of the Transport Safety Investigation Act 2003, the ATSB may provide a draft report, on a confidential basis, to any person whom the ATSB considers appropriate. That section allows a person receiving a draft report to make submissions to the ATSB about the draft report.
A draft of this report was provided to the following directly involved parties:
pilot of the accident flight
aircraft owner
previous aircraft owner
Civil Aviation Safety Authority
aircraft maintainer
Pratt & Whitney Canada
the Transportation Safety Board of Canada
the National Transport Safety Board
Piper Aircraft Incorporated.
Submissions were received from:
pilot of the accident flight
Pratt & Whitney Canada.
The submissions were reviewed and, where considered appropriate, the text of the report was amended accordingly.
Purpose of safety investigations
The objective of a safety investigation is to enhance transport safety. This is done through:
identifying safety issues and facilitating safety action to address those issues
providing information about occurrences and their associated safety factors to facilitate learning within the transport industry.
It is not a function of the ATSB to apportion blame or provide a means for determining liability. At the same time, an investigation report must include factual material of sufficient weight to support the analysis and findings. At all times the ATSB endeavours to balance the use of material that could imply adverse comment with the need to properly explain what happened, and why, in a fair and unbiased manner. The ATSB does not investigate for the purpose of taking administrative, regulatory or criminal action.
Terminology
An explanation of terminology used in ATSB investigation reports is available here. This includes terms such as occurrence, contributing factor, other factor that increased risk, and safety issue.
Publishing information
Released in accordance with section 25 of the Transport Safety Investigation Act 2003
Ownership of intellectual property rights in this publication
Unless otherwise noted, copyright (and any other intellectual property rights, if any) in this report publication is owned by the Commonwealth of Australia.
Creative Commons licence
With the exception of the Coat of Arms, ATSB logo, and photos and graphics in which a third party holds copyright, this publication is licensed under a Creative Commons Attribution 3.0 Australia licence.
Creative Commons Attribution 3.0 Australia Licence is a standard form licence agreement that allows you to copy, distribute, transmit and adapt this publication provided that you attribute the work.
The ATSB’s preference is that you attribute this publication (and any material sourced from it) using the following wording: Source: Australian Transport Safety Bureau
Copyright in material obtained from other agencies, private individuals or organisations, belongs to those agencies, individuals or organisations. Where you wish to use their material, you will need to contact them directly.
At Sydney Airport in the early evening of 5 August 2019, the crews of 3 aircraft were using runway 34R in various phases of flight:
de Havilland Canada Dash 8 operated by QantasLink, nearing the end of the landing approach
Boeing 737 operated by Qantas, on the final segment of an independent visual approach
Airbus A330 operated by Qantas, awaiting instructions and clearance to line up and take off and make a right turn to track to the east via the MARUB SIX standard instrument departure (SID).
This traffic was managed by an aerodrome controller (ADC) position in the Sydney air traffic control tower that was occupied at the time by a controller in the late stages of training for the ADC role under the supervision of an on-the-job-training-instructor (OJTI).
When the Dash 8 had landed and taxied off the runway, the trainee ADC issued a clearance to the A330 crew for an immediate take-off, and they complied. Assessing that there could be insufficient runway separation between the A330 on the take-off roll and the anticipated arrival of the 737 at the runway threshold, the trainee ADC instructed the 737 crew to go around (conduct a missed approach).
The 737 flight crew initiated the missed approach procedure by climbing on the runway heading but climbed through the mandatory turn altitude. The 737 turned when instructed by the trainee ADC. Meanwhile, the A330 followed the SID track by turning right shortly after passing the departure end of the runway, and the two flight paths began to converge.
As the 2 aircraft were turning right and climbing, the A330 flight crew received a traffic alert from the onboard traffic collision advisory system. Shortly after this, the A330 first officer sighted the 737.
As the respective departure and missed approach procedures both involved climbing from a low level and tracking/heading to the east, the aircraft came into close proximity. Nevertheless, the controllers maintained sight of both aircraft throughout the sequence and the risk of a collision was low.
In the absence of compliant methods to separate the aircraft at night, the trainee ADC attempted to establish horizontal separation by instructing the 737 crew to turn onto a heading that was divergent from the A330 outbound track.
In the early stages of the respective procedures, the separation between the aircraft reduced to about 0.42 NM (800 m) laterally and about 508 ft vertically. This was categorised as a loss of separation.
What the ATSB found
The loss of separation and close proximity between the 737 and the A330 was the culmination of a series of events that, individually, would only be minor concerns but collectively resulted in a significant incident.
When the 737 was transferred to the ADC from the approach controller, the spacing between it and the landing Dash 8 ahead was less than permitted without coordination between the controllers. In addition, the 737’s speed during some of the final approach was higher than the approach design specified and the flight crew did not advise the ADC. These factors increased the risk of compromised runway separation and associated go-around.
The trainee ADC’s mental model of the developing traffic situation did not fully account for the effects of the 737’s delayed and relatively wide turn, and they expected the A330’s flight path to be further from the 737. Partly as a result of this, the trainee ADC’s actions were not optimal even though they did reduce the extent of the close proximity between the two aircraft. No safety alert or avoiding action advice was given to either flight crew to notify them of their proximity and thereby increase their situational awareness, particularly that of the 737 flight crew who could not visually sight the A330. The trainee ADC also did not modify the A330’s projected flight path, which would have increased the distance between the aircraft and re-established a separation standard sooner.
The on-the-job training instructor (OJTI) was not confident that runway separation could be achieved between the A330 cleared for take-off and the 737 on final approach or that the turn instructions issued to the 737 in the missed approach were sufficient mitigation. However, the OJTI did not provide effective prompts and did not intervene, mindful that at this point in the training, the trainee ADC was meant to be demonstrating the ability to work without instructor intervention.
The ATSB identified safety issues relating to the management of the MARUB SIX SID and the missed approach procedure for runway 34R directing aircraft onto similar outbound tracks. This could require controller intervention to maintain separation. In daytime, although this was potentially problematic, controllers were permitted to vector the aircraft. At night, however, controllers had no procedural controls to draw upon to separate aircraft in this situation when they were below the minimum vector altitude, and there were no compromised separation training scenarios involving aircraft below this altitude at night.
Furthermore, although these issues were known among Sydney controllers generally and Airservices had identified and addressed similar issues at other airports, those at Sydney remained unaddressed. The ATSB considered that this was partly due to the use of operational risk assessments as a high-level representation of threats and not for specific threat scenarios.
The ATSB also made other findings that were not found to be contributory to the occurrence: the tower shift manager (TSM), in a supervisory role, was fully engaged in a controller function and was not aware of the go-around and development of the compromised separation until after the event; air traffic control transfer after the occurrence; and the location of a relevant navigation waypoint in the 737’s flight management computer was incorrect.
What has been done as a result
In 2020, Airservices conducted a risk assessment on the runway 34R missed approach procedure and the MARUB SIX SID procedure, and on the distances between successive arrivals. Subsequently, Airservices implemented redesigned the missed approach procedures for Sydney’s runway 34R to provide an increased likelihood that distance will be maintained with another aircraft departing on a SID from the same runway. The ATSB urges Airservices to apply its expertise and data to monitor the safety outcomes on an ongoing basis so that the lowest-risk designs can be identified and implemented in the long term.
Additionally, in 2020 Airservices advised that compromised separation scenarios where an aircraft is operating below the minimum vector altitude were to be included into the Sydney tower controller instructor guide at night, and in 2023 Airservices advised that the training program also now included a missed approach with a preceding departure in instrument meteorological conditions. Airservices advised that it was working to have the same scenario during night operations included in the compromised separation recovery simulator training for all capital city towers.
Airservices also conducted several further safety actions including improved risk management processes to address specific threat scenarios, issuing a standardisation directive on spacing for aircraft arrivals, established a focus group to foster an increased understanding of shared risk factors among different operational groups at Sydney, and actions to improve the operational availability of tower shift managers in the supervisory role. All safety issues identified by the ATSB in relation to this occurrence have now been adequately addressed.
Qantas conducted several safety actions relevant to the occurrence including updating the missed approach coding in its 737 flight management computers, incorporated related scenarios into cyclic training sessions, and updated its flight data analysis program to more closely monitor approach speeds and traffic collision avoidance system data.
Safety message
Flight path design principles ensure the safety and protection of aircraft, passengers and crew as well as communities under flight paths. Aircraft mostly fly predictably and consistently along arrival and departure routes that have strategic separation by design. This increases awareness of the traffic situation for both pilots and controllers, reduces the need for human intervention and reduces pilot and controller workload at critical times. Where routes converge, such as at a runway, strategic separation is no longer possible. It is also not possible to provide strategic separation of an aircraft conducting a missed approach with one taking off from the same runway. Nevertheless, routes should still require minimal intervention by air traffic controllers to prevent a loss of separation.
The airspace around Sydney Airport is complex: the use of parallel runways limits the options available for separation assurance, and it can be busy. Controllers are expected to maintain an orderly traffic flow with minimal delays while still safely managing separation. There will be times when controllers misjudge runway separation or flight crews don’t conform to procedures, resulting in the need for a missed approach or other intervention.
Missed approaches generally result in a high flight crew workload, particularly when they are manually flown, and sometimes lead to errors. Non-standard missed approaches and unexpected navigation modes further increase the risk of error.
In this occurrence, a series of individual errors and decisions made by flight crews and controllers gradually reduced margins to a point where the two aircraft came within close proximity. Although events like this are uncommon, they will occur from time to time and systems should be designed to minimise the likelihood of a more serious outcome.
Summary video
The occurrence
Overview
At Sydney Airport in the early evening of 5 August 2019, the crews of 3 aircraft were using runway 34R in various phases of flight:
de Havilland Canada Dash 8 operated by QantasLink, nearing the end of the landing approach
Boeing 737 registered VH-VZO and operated by Qantas, on the final segment of an independent visual approach
Airbus A330 registered VH-EBJ and operated by Qantas, awaiting instructions and clearance to line up and take off and make a right turn to track to the east via the MARUB SIX area navigation (RNAV) standard instrument departure (SID).
The airport was operating with parallel runway operations using a runway configuration of 34L and 34R for arrivals and departures. At the time, there were no other aircraft in the area directly relevant to the occurrence. The Sydney automatic terminal information service broadcast the wind was from 30° at 12 kt with a crosswind of 10 kt. The conditions were clear and it was in the early evening after last light.[1]
The above traffic was managed by air traffic control (ATC) in the Sydney Tower in the ‘aerodrome controller – east’ (ADC) position, responsible for operations using runway 34R and the airspace east of the airport. This position was filled by two people:
a controller who was in the late stages of training for the ADC role and who managed traffic in the vicinity of the airport (trainee ADC)
an on-the-job-training-instructor (OJTI), who was assisting and supervising the trainee ADC, and held the overall responsibility for the provision of safe air traffic services by the ADC position.
When the Dash 8 had landed and taxied off the runway, the trainee ADC issued a clearance to the A330 crew for an immediate take-off, and they complied. Assessing that there could be insufficient runway separation between the A330 on the take-off roll and the anticipated arrival of the 737 at the runway threshold, the trainee ADC instructed the 737 crew to conduct a missed approach.
The 737 flight crew initiated the missed approach procedure by climbing on the runway heading but did not commence the mandatory right turn on passing 600 ft. The 737 turned when instructed by the trainee ADC. Meanwhile, the A330 followed the SID track (MARUB SIX) by turning right shortly after passing the departure end of the runway, and the two flight paths began to converge (Figure 1).
Both aircraft continued turning right and climbing. The A330 flight crew then received an audible traffic collision advisory system (TCAS) alert (‘TRAFFIC TRAFFIC’). The A330 first officer looked out the right rear flight deck window and saw the 737 above in a climbing turn and in close proximity. The aircraft came within about 0.42 NM horizontally and 508 ft vertically, with the two aircraft abeam of each other and turning right.
The trainee ADC issued further instructions to both aircraft. Before the minimum required separation standard was met, but with the separation increasing as the 737 accelerated ahead of the A330, the trainee ADC transferred the 737 to the approach controller.[2]
Figure 1: Overview of aircraft flight paths
White lines link the locations of the two aircraft at the same point in time.
Source: Google Earth, annotated by the ATSB
Events prior to the occurrence
Dash 8 approach and landing
The first aircraft in the approach and landing sequence for runway 34R was a De Havilland Canada DHC-8 (Dash 8) turboprop aircraft, operated by QantasLink. Its flight crew made contact with Sydney tower (the ADC) at 1827:55.
Boeing 737 instrument arrival
The second aircraft in the arrival sequence was a Boeing 737, registered VH-VZO, operated by Qantas Airways as scheduled passenger transport flight QF545 from Brisbane, Queensland to Sydney, New South Wales.
The captain was the pilot monitoring (PM)[3] and the FO was pilot flying (PF).
Prior to descent, ATC issued the flight crew with a clearance for the ‘BOREE ONE ALPHA’ area navigation (RNAV) arrival to runway 34R. This standard instrument arrival (STAR) comprised a series of altitude limits and waypoints that diverted aircraft inbound from the north to the east of the airport to fly parallel to the runway in a southerly direction until ATC provided radar vectors to intercept the northerly approach path (335°) of runway 34R.[4]
The 737 flight crew were also cleared to conduct an independent visual approach (IVA)[5] to runway 34R and programmed the flight management computer (FMC) with the GBAS[6] landing system (GLS) runway 34R instrument approach procedure (a GPS-based type of instrument approach). This provided guidance for a straight-in approach to a point on the runway threshold, published as waypoint RW34R, on the typical glide-path angle of 3°.
For a missed approach during this IVA, the crew were required to follow the instructions on the runway 34R approach chart (Figure 2). If a missed approach was initiated at or after the missed approach point, at about 0.5 NM from the runway (corresponding to the approach path intersecting with the decision altitude[7] of 220 ft), flight crews were to maintain the approach track (335°) until a mandatory right turn at 600 ft onto a heading of 070°.[8] The specified level-off altitude was 2,000 ft or as directed by ATC. If the missed approach was initiated before the missed approach point, flight crews were expected to maintain the approach track until reaching the missed approach point, then follow the procedure.
In accordance with standard operator procedures, the flight crew completed an arrival and approach briefing before descent. According to the crew, they reviewed all of the standard items, including the approach chart.
The captain recalled checking that the missed approach procedure loaded in the FMC was consistent with the approach chart. Both flight crew members later reported that they were familiar with the missed approach procedure for runway 34R and had discussed the risk of inadvertently climbing above the 2,000 ft level-off altitude, which was lower than typical at other locations.
They also discussed the requirement to turn right in a missed approach. The flight crew did not discuss how a missed approach would be flown with regard to the autopilot flight director system (AFDS)[9] modes, or whether the autopilot would be engaged, or how they would manage configuration changes during the required low-level manoeuvring.
The FO mentally noted that the GLS approach had speed restrictions but the flight crew did not discuss the required speeds. As the STAR did not join the GLS runway 34R approach, the flight crew observed a discontinuity between the two procedures in the FMC route legs page (in a GLS approach, the aircraft follows a predetermined approach path and angle). This meant that there was no active waypoint for AFDS guidance. There was no standard procedure for the crew to resolve the discontinuity.
During descent, the captain contacted Sydney air traffic control (the approach controller) and reported being visual with runway 34R in sight. The approach controller was responsible for the arrival sequence prior to transfer of aircraft to the aerodrome controller. The controller advised the ATSB that it was a normal day and they did not recall any details of the approach sequence of the Dash 8 and 737.
Figure 2: Sydney GLS runway 34R approach chart with missed approach requirements defined by blue boxes and approach speed requirements highlighted in yellow
Source: Qantas Airways, annotated by ATSB
The approach controller issued the flight crew a series of radar vectors to intercept the final approach for runway 34R. The FO selected the aircraft’s AFDS lateral mode to heading select (HDG SEL) to maintain the assigned headings.
After engaging heading select mode the flight crew did not update the route legs page in the FMC. As a result, the active FMC waypoint (the one to which the FMC would guide the flight crew or autopilot in LNAV) remained behind the aircraft’s position when it later passed through the waypoint (see 737 automatic flight system).
3The approach controller later cleared the flight crew for an independent visual approach (IVA).
Passing 4,300 ft, at 1827:19, the 737 flight crew selected flaps 1. At 10 NM track distance from the runway 34R threshold the aircraft was decelerating through 200 kt (the IVA required speed was 160–185 kt).
Descending through 2,300 ft, the aircraft was fully established on the approach with the autopilot and autothrottle engaged.
At 1830:05, as the 737 was passing about 1,850 ft and about 6.2 NM from the threshold, the approach controller instructed the flight crew to contact Sydney tower (a role carried out by the trainee ADC).
At this time, recorded data showed that the Dash 8 was 4.5 NM (8.4 km) ahead of the 737. Successive arrivals were to be at least 5 NM (9.3 km) apart unless there was prior coordination between the two controllers (see Surveillance separation).
Airbus A330 taxi to holding point
The flight crew of Airbus A330, registered VH-EBJ, was operating scheduled passenger transport flight QF459 for Qantas Airways from Sydney to Melbourne, Victoria. The captain was the PM and the FO was the PF.
The A330 crew was cleared to depart via the MARUB SIX RNAV departure (Figure 3). This was a commonly-used standard instrument departure (SID) for jet aircraft taking off from runway 34R and tracking south. On reaching 500 ft, flight crews were required to make a right turn onto a south-easterly heading to intercept an easterly track (075°) from the airport to waypoint MARUB.[10] From there, aircraft were turned right onto a southerly track and a further right turn after passing 10,000 ft.
At 1824:58, the trainee ADC cleared the A330 to taxi to the holding point at the southern end runway 34R.
Figure 3: Sydney SID MARUB SIX RNAV departure plate
Source: Jeppesen
Concurrent 737 final approach and A330 departure
The trainee ADC cleared the Dash 8 to land at 1830:08. At 1830:21, when the 737 was 5.3 NM (9.5 km) from the runway 34R threshold, the flight crew selected flaps 15 and landing gear down. At 1830:24 the 737 flight crew established contact with the ADC. The aircraft was descending through 1,200 ft on a stable approach in landing configuration with flaps 30 and both the glideslope and localiser hold modes engaged. The 737 was gaining on the Dash 8 which was about 4.1 NM (7.5 km) ahead.
At 1830:31, the aircraft passed waypoint OLSOG, 4.8 NM (8.6 km) on the extended runway centreline, decelerating through 180 kt (with no wind). The approach chart (Figure 2) required flight crews to be 150–160 kt at this point, and if unable to comply, crews were to advise ATC. The 737 flight crew did not do so.
The Dash 8 was ahead of the 737 continuing its approach to runway 34R. The trainee ADC and OJTI both recalled that the Dash 8 appeared slower than a typical Dash 8 during approach and landing and then when vacating the runway. Radar data showed the ground speed of Dash 8 averaged 100 kt in the minute leading up to it crossing the runway 34R threshold. Airservices reported that the typical speed for a Dash 8 is 120–140 kt over the threshold.
At 1831:04, as the Dash 8 crossed the runway 34R threshold, the trainee ADC instructed the A330 flight crew to line up and wait on runway 34R (Figure 4Figure 4).
Figure 4: Position of the 737 when the A330 was instructed to line up
Source: Google Earth, annotated by the ATSB
At this time, the 737 was 3.3 NM from the runway 34R threshold, fully configured for landing (gear down and flaps 30), and was decelerating through 153 kt (Figure 5).
Figure 5: Representation of an ATC display when the A330 crew was instructed to line up showing location of the A330, Dash 8 and 737 aircraft and an exemplar separation measurement (light yellow).[11]
Source: Airservices Australia, annotated by the ATSB
The OJTI recalled that when the trainee ADC instructed the A330 to line-up in preparation for a departure, they glanced at the traffic display and noted that the 737 on approach was about 3.5 NM from the runway. At the time, the OJTI considered the gap to be ‘ambitious’ but if the preceding Dash 8 turned off early and the right phrases were used for an immediate take-off it should be expected to work.
At 1831:10, the trainee ADC instructed the 737 flight crew to reduce to minimum speed. The captain responded that they were at minimum speed. Flight data recorded that at that time the 737 was about 3.1 NM from the runway threshold with an airspeed of 155 kt and reducing, which was slightly above the selected approach speed and the minimum approach speed.[12]
The Dash 8 had landed but was still on the runway. At 1831:20 the trainee ADC instructed the A330 flight crew to expedite the line-up and be ready for an immediate departure. The captain responded that they were ready (for take-off).
At this time, the 737 was about 2.7 NM from the runway threshold with an airspeed of about 152 kt. The 737 captain recalled mentioning to the FO ‘this is not going to work’ and mentally preparing for a potential missed approach. The FO disconnected the autopilot and autothrottle at 1832:24 in preparation for a manually flown go-around should it be required.
At 1831:45, with the Dash 8 vacating the runway via the first available exit (T2), the trainee ADC advised the A330 flight crew, ‘on 34R cleared for immediate take-off’ (Figure 6). The 737 was now 1.8 NM from the runway threshold with a ground speed of 140 kt. The A330 FO pushed the power levers forward for take-off once the aircraft was lined up at 1831:54.
Figure 6: Sequence from A330 clearance for take-off
Source: Google Earth, annotated by the ATSB
The OJTI recalled they did not expect the trainee ADC to issue the take-off clearance but this was not discussed with the trainee. They asked the trainee if the runway separation standard would be met, to which the trainee replied ‘no’.[13] The OJTI also recalled asking the trainee ‘if you send [the 737] around, what are we going to do?’
At 1831:58, the trainee ADC instructed the 737 flight crew to ‘go around’ (conduct a missed approach). Initially, that instruction was mistakenly issued to the A330 (‘Qantas 459’) before immediately being corrected to the 737 (‘Qantas 545’). At 1832:02, the 737 captain read back the instruction. The 737 was descending through about 400 ft and was 1.2 NM (2.2 km) from the runway 34R threshold.
At this time the A330 was accelerating past 60 kt. The A330 captain recalled hearing the trainee ADC issue the 737 a go-around instruction and expected the take-off clearance to be cancelled. The A330 captain also recalled being aware of the potential conflict between their planned departure track via the SID and the 737 concurrently on the 34R missed approach. However, no further instruction was given by the controller, and the A330 flight crew continued the take-off in accordance with their clearance.
The trainee ADC later advised the ATSB that cancelling the A330 take-off clearance was an option but there would be risk involved. The OJTI considered that as the A330 was accelerating and it was difficult to visually assess speed at night, it would not be appropriate to cancel the take‑off clearance.
There was a tower shift manager (TSM) on duty in the tower, who performed direct supervision of the operating environment, and was required to support, intervene, or broadly direct activities. During this time the TSM was assisting a surface movement controller[14] and was not actively supervising or aware of the developing traffic scenario on runway 34R. The OJTI wanted to report the missed approach to the TSM, as procedures required, but gaining the TSM’s attention would require leaving the trainee ADC unsupervised.
737 missed approach
At 1832:03, at about 350 ft and about 1.0 NM (1.8 km) from the runway threshold, the 737 flight crew commenced a manually-flown go-around and missed approach procedure. The FO pressed the take-off/go-around (TOGA) button[15] and called for the captain to select flaps 15, which the captain actioned at 1832:08. Once a positive climb was established the FO called for the landing gear to be selected up, and this was actioned by the captain.
At 1832:15, the 737 overflew the missed approach point while climbing through 400 ft, tracking on the runway heading. The aircraft passed through the mandatory missed approach turn altitude (600 ft) at 1832:21. The FO later stated that they believed the missed approach point was still ahead of the aircraft’s position and therefore delayed commencement of the right turn. The FO also recalled expecting the navigation mode to change from TOGA to lateral navigation (LNAV) and command the right turn, but that did not happen. The flight director lateral guidance instead maintained the runway track.
Passing about 600 ft the FO called for flap 5. The captain later reported hesitating before retracting the flaps because of an outdated procedure where flap retraction could only be commenced above 1,000 ft. The captain set flap 5 at 1832:23, and the FO commenced acceleration while still maintaining runway track.
At 1832:28 and accelerating through 160 kt, the 737 passed the pre-programmed missed approach point in the FMC (incorrectly located at the runway 34R threshold; see Runway 34R missed approach procedure) and was climbing through 860 ft to the right of the runway. The A330 had just commenced rotation.
The OJTI recalled they were aware that two aircraft departing on the MARUB SID and missed approach track concurrently would potentially conflict due to the inherent design of the two procedures. As a way of prompting a response, the OJTI asked the trainee ADC where the A330 was going to be tracking. The trainee ADC described the tracking of aircraft on the MARUB SID, which indicated to the OJTI that the trainee had understood they were going to have to apply tactical separation by adjusting the missed approach tracking of the 737 to increase the spacing with the departing A330.
The TSM was still assisting the other controller and remained unaware of the missed approach and developing conflict.
Air traffic control vectoring and close proximity
At 1832:31, passing about 920 ft, the 737 flight crew retracted flaps to flaps 1 while continuing to maintain runway track. The A330 was about 0.7 NM (1.2 km) ahead and beginning to climb.
Immediately after this, the trainee ADC instructed the 737 flight crew to turn right to heading 100°, thinking at the time that this would provide divergence from the A330 that was going to intercept the 075° radial. The trainee’s expectation was that the 737 would turn well before the crossing runway and be manoeuvring south of the 075 radial. The trainee ADC did not issue a traffic alert or a safety alert.[16]
The OJTI later reported that while the trainee’s choice of action would not have been the OJTI’s ‘first choice’ they expected the trainee to manage it. The OJTI was mindful that, at this point in the training, the trainee ADC was meant to be demonstrating the ability to work without instructor intervention. The OJTI later reported that they would have preferred the trainee ADC to cancel the A330’s SID and issue its flight crew a heading to the right of the runway centreline (such as 030°), but the OJTI did not communicate this to the trainee.[17]
The 737 was then at about 980 ft, which was below the minimum vectoring altitude (MVA) of 1,500 ft in this area (see Compromised separation). The turn instruction did not include phrasing to indicate the safety or urgency of the situation (such as traffic ahead) and responsibility for terrain clearance could not be assigned to the flight crew. A visual separation standard was still being applied between the two aircraft (see Air traffic control recorded data).
At 1832:37, about 1.1 NM (2.1 km) past the missed approach point and climbing through about 1,100 ft, the 737’s autopilot was engaged, the lateral mode was changed to heading select, and it commenced turning off the runway track (335°). The 737’s bank angle reached 25° (a standard rate turn) at 1832:51 and a steady turn at an average 210 kt was maintained until 1833:42; this gave an average turn radius of about 1.4 NM (2.6 km).
Due to the high nose attitude and increased workload during the climbing turn the flight crew did not see the A330, which was 0.6 NM (1.2 km) ahead of them and just passing the departure end of the runway at an altitude of about 350 ft.
The trainee ADC recalled that, at this point, there was quite a bit of distance between the two aircraft and the 737 looked like it was starting to turn south of the 075 radial. According to the trainee, for most of the time they were looking out the windows and able to see the aircraft clearly and judge speed, distance, and angle of bank. In addition the trainee ADC was looking at the radar display for speed and height.
The OJTI later reported they were monitoring the aircraft visually and were confident that the aircraft would not collide.
The A330 flight crew recalled that they were aware of the other aircraft being behind them conducting the missed approach procedure. The A330 FO looked for the 737 at about 1832:41, expecting it to have made an earlier right turn in accordance with the published missed approach procedure, but was unable to see it.
At 1832:44, passing about 650 ft, the A330 FO, who was PF, commenced a right turn to track in accordance with the MARUB SID. The FO later stated that after passing the turn altitude (500 ft) they delayed making the turn by a few seconds in the knowledge that the 737 was behind them.
The A330’s rate of climb at the initiation of the turn was about 2,800 ft/min. The A330 reached its average bank angle through the initial part of the turn (23°) at 1832:52 with an average airspeed of 141 kt and turn radius of about 0.7 NM (1.3 km). That is, as both aircraft turned, the A330 was turning tighter and travelling slower than the 737.
At 1832:50 the A330’s traffic collision avoidance system (TCAS) began to generate a traffic advisory[18] (TA) visual and aural annunciation. At this point the aircraft were 0.5 NM (0.9 km) and 600 ft apart. In response, the A330 FO verbalised the TA and confirmed that they had control in accordance with Qantas procedures. Figure 7 shows the position and flight paths of the aircraft through this period, and Figure 8 shows how an ATC display might appear if a controller measured the separation at this point.
Figure 7: Concurrent right turns and close proximity
Source: Google Earth, annotated by the ATSB
Figure 8: ATC display showing both aircraft at the time of A330 TCAS TA
Image represents a typical ATC display but is not necessarily representative of the display shown to any controller at the time of the occurrence. The separation measurement was manually added during a later replay of the occurrence and is approximate.
Source: Airservices Australia, annotated by the ATSB
The FO looked for the 737 again but was still unable to see it. A few seconds later the A330 FO saw the 737 in close proximity out the rear flight deck window towards the right rear quarter. In response, the FO reduced the aircraft’s angle of bank to widen the turn further away from the 737. Recorded data showed the rate of turn decreasing at 1833:06.
The FO advised the captain that ‘the 737 is very close’. In response, the captain reportedly instructed the FO to continue climbing at maximum rate, do not accelerate, and keep climbing until they were through 4,000 ft. The 737 captain recalled observing a TCAS TA alert but could not remember hearing an aural alert.
Throughout this period the trainee ADC was coordinating with the approach controller about the 737’s missed approach and anticipated track and altitude. The OJTI reported being confident that the 737 would pull ahead of the A330 in the turn. At 1833:03:
Separation between the aircraft had reduced to a minimum of about 0.42 NM (0.78 km) horizontally and about 508 ft vertically. At this time, the two aircraft were approximately abeam of each other and turning right. The A330 was climbing at about 1,900 ft/min and the 737 was levelling off at the altitude required by the approach chart (2,000 ft).[19]
Intending to increase the separation distance, the trainee ADC instructed the 737 flight crew to turn further right to 120°. Its heading was about 022° at the time.
The trainee ADC later reported that the A330 made an earlier and tighter turn than other widebody jet aircraft typically make (although still complying with the SID). This had unexpectedly brought the A330 closer towards the 737’s anticipated track.
At 1833:09, the trainee ADC issued a further instruction to the 737 crew to climb to 3,000 ft.
Increasing separation
At 1833:17, the A330 captain made a radio transmission to the ADC, stating ‘that was very close – you could have asked us to do a heading’. At around this time, the A330’s TCAS TA ceased.
Intending to stop the A330’s turn, the trainee ADC issued an instruction to the A330 flight crew to turn ‘left’ to 100°. Initially, the trainee ADC did not cancel the SID clearance as was required before issuing vectors. After the A330 captain advised that the A330 was following a SID, the trainee ADC instructed the A330 flight crew to cancel the SID and turn ‘left’ to 100°.
The A330’s heading was about 070° at the time, almost directly behind the 737, with both aircraft turning right. The A330 was accelerating slowly through 158 kt while the 737 was maintaining about 205 kt before accelerating further; as a result, the distance widened.
Figure 9: Indicative ATC display at 1833:03 (the time of the closest horizontal distance)
Image represents a typical ATC display but is not necessarily representative of the display shown to a controller at the time of the occurrence. The separation measurement was manually added during a later replay of the occurrence and is approximate.
Source: Airservices Australia, annotated by the ATSB
The two flight paths then crossed with the 737 about 0.8 NM (1.5 km) ahead of the A330 (Figure 10). The trainee ADC asked the 737 flight crew to contact the approach controller at 1834:03 without first coordinating with the approach controller. At this time the two aircraft were about 1.2 NM (2.2 km) and 400 ft apart. This was less than the surveillance separation standard required for the transfer without coordination.[20]
The 737 climbed to 3,000 ft and was issued radar vectors for a second approach to runway 34R, landing at 1841. The A330 climbed to 5,000 ft and continued the planned flight to Melbourne.
Figure 10: Flight paths after the occurrence
Source: Google Earth, annotated by the ATSB
Context
Air traffic control
Overview
Airservices Australia is Australia's principal civil air navigation service provider (that is, the provider of air traffic services for civil airports and airspace). The functions of Airservices are outlined in the Air Services Act 1995 and include the provision of air navigation services, aeronautical information, and aviation rescue and fire fighting services. The Manual of air traffic services (MATS)[21] stated the objectives of air traffic services were to:
prevent collisions between aircraft;
prevent collisions between aircraft on the manoeuvring area and obstructions on that area;
expedite and maintain an orderly flow of air traffic;
provide advice and information useful for the safe and efficient conduct of flights; and
notify appropriate organisations regarding aircraft in need of search and rescue aid, and assist such organisations as required.
This section details the context around the air traffic services aspects of the occurrence, including objectives and functions of Airservices and the manner in which they were applied, the involved personnel, separation standards, and flight path design. Unless otherwise specified, document references are from the version current at the time of the occurrence.
Personnel information
Trainee aerodrome controller
The trainee aerodrome controller (ADC), along with the on-the-job training instructor (OJTI), were controlling aircraft landing and departing on runway 34R at Sydney Airport from the Sydney air traffic control (ATC) Tower. At the time of the occurrence, the trainee ADC was completing their last shift before a performance assessment (check) for initial grant of the ADC rating that was scheduled for the next day.
The controller had joined Airservices and started initial tower training in 2012. On completion of training, the controller was stationed for about 4 years in the tower of a regional airport.
In November 2017, the controller commenced training for the surface movement control role at Sydney tower. The controller operated in this role until training was commenced for the Sydney tower ADC role in April 2019.
Training records indicate that the controller was judging spacing (for departures between arriving aircraft) well and had been advised to always have an ‘out’ (contingency plan). As the training progressed, the controller was instructed to make those decisions with less reliance on confirmation from the various OJTIs.
In regard to missed approaches, training records show that the controller was advised that ensuring separation from the preceding departure was more important than advising the departure controller about it. Also discussed was instructing aircraft to turn during missed approaches below minimum vectoring altitude (MVA) at night and compromised separation phraseology.
Two routine performance assessments were carried out by different check controllers in May and June 2019 to ascertain training progress. In general, the controller was found to be at the expected competency level for the respective stages of training.
Both check controllers noted that traffic volume during each assessment was relatively light and further experience in more challenging traffic and weather conditions (including at night) would be beneficial. There was no recorded concern about traffic sequencing or application of separation standards, although it was noted on the first assessment that the controller was a bit more conservative with traffic spacing than necessary.
On 23 July 2019, the controller began a 3-day performance assessment (check) conducted by a check controller as a prerequisite for granting of an aerodrome controller rating for the west, east, and coordinator functions in Sydney tower. The assessment report recorded that during the first 2 days the controller was able to process the traffic in a safe and expeditious manner. This was in the context of favourable weather conditions but relatively fast approaches (due to winds above 600 ft) and receiving aircraft that had reduced spacing at the time of transfer (less than the required 5 NM spacing).
The check controller also noted in the report that there is a ‘fine line’ between maximising the departure rate while ensuring separation, and that there is a need to always have a ‘way out’ – especially at night or in instrument meteorological conditions. This was prompted by an example of ‘bare’ (minimum) runway separation standard between departing and landing aircraft on runway 34R, with advice that if the crew of the approaching aircraft conducted a missed approach from short final approach, it would have been difficult to ensure separation if the departing aircraft was tracking via the MARUB standard instrument departure (SID).
During the check, the controller was questioned about a range of local procedures that could be implemented in different scenarios at Sydney. The check controller assessed that the controller’s knowledge was inadequate for issue of the rating and the check did not progress to Day 3. As part of a new training plan, the controller completed some additional classroom theory and was scheduled for 5 training shifts before another check, that was scheduled for the day after the occurrence.
The controller advised there had been some interruptions to the ADC training due to personal circumstances leave and there had been constraints on study outside of work hours. Although the controller described the training program as disjointed, it was completed within the average time frame for this rating of 12 weeks and none of the OJTIs had commented that there was any change to the controller’s skills on return from leave.
A review of the trainee ADC’s training records identified that one OJTI was involved in the initial practical training then was intermittently involved in subsequent training along with 8 other OJTIs. The controller advised the ATSB that, in their opinion, a variety of trainers could be positive as they can offer multiple perspectives and can address different areas, but there was a lack of continuity that probably hindered some aspects of the training.
Following the unsuccessful check, another OJTI was rostered for the additional training shifts. This was the same OJTI who was supervising the trainee ADC during the occurrence. The trainee considered this to be a positive phase of the training.
On 11 and 12 June 2019, the controller had completed practical emergency refresher training with a check controller in the Airservices tower simulator. This included a compromised separation exercise involving runways 16L/R by day. The check controller recorded that it was a good result and valuable part of the ADC training.
On the day of the incident, the controller recalled wanting the training process to be complete. Although recalling not feeling the pressure to perform or the upcoming check itself, after conversations with other people the trainee felt the check ‘was weighing in the back of [their] mind’.
On-the-job training instructor
The OJTI who was supervising the trainee ADC at the time of the occurrence had about 7 years previous experience as a tower and approach controller in the United States. After moving to Sydney, the OJTI converted the US qualifications and held all of the ratings for Sydney tower except shift manager. The OJTI endorsement was obtained in February 2019 and the OJTI had been a training instructor for one other controller prior to the occurrence.
On 12 and 13 June 2019, the OJTI had completed practical emergency refresher training with a check controller in the tower simulator. This included a compromised separation exercise involving runway 16L/R by day.
The OJTI was aware that the trainee ADC had been unsuccessful in the first performance assessment (check) because of knowledge deficiency rather than practical controlling skill. The OJTI was assigned to provide additional training to prepare the trainee for a performance assessment (check) that was scheduled for the day following the occurrence. If any intervention was required on the day of the occurrence, the OJTI was aware that the check would be postponed.
Prior to the day of the occurrence, the OJTI had supervised the trainee ADC on 3 shifts, all within the preceding week. The records indicate that the trainee was performing well with no requirement for the OJTI to provide prompts during controlling. In those previous training shifts, there were no missed approaches and the OJTI was confident in the trainee’s gap selection. As part of the training, the OJTI and trainee ADC reviewed minimum vector altitudes and some ways to manage missed approaches at night.
Tower shift manager
The tower shift manager (TSM) was a supervisory position responsible for the tactical management of risk while maintaining efficient air traffic operations. The purpose of supervision in the air traffic management context is to provide tactical management of risks while maintaining efficient air traffic operations. To achieve this, the TSM was required to directly supervise and maintain situation awareness of the immediate operating environment. Where necessary, the TSM role included supporting, intervening, or directing activities.
A TSM did not have authority to direct a controller to issue an operational instruction (the operational controller may accept advice from the TSM, but is always responsible for traffic separation).
Other aspects of the TSM role included management of controller resources across positions, providing ad hoc assistance to controllers, and administrative tasks. Ad hoc assistance tasks included to support the workload of the surface movement controller and provide break relief for other controllers as required.
The TSM had been in air traffic control since 1981, primarily in various roles at Sydney, and had been operating in the tower since 2004. Most of the shifts were conducted in the TSM role.
At the time of the occurrence, the TSM was temporarily engaged in the coordinator role for a surface movement controller. In that role, the TSM used a computer to locate and pre-activate the flight plans of taxiing aircraft. During busy periods, this allowed the surface movement controller to focus on monitoring ground traffic visually. The coordinator roles were not usually specially staffed, and as a result, this task was routinely done by the TSM during the afternoon/evening peak period.
Fatigue analysis
A review of both the OJTI and trainee’s roster and sleep information found there was a low likelihood the trainee and OJTI were experiencing a level of fatigue known to have an adverse effect on performance.
Air traffic control recorded data
Air traffic control (ATC) audio recordings and radar data records were obtained from Airservices. The audio recordings provided radio communications between controllers and flight crews. Radar data records provided aircraft position, speed and altitude information.
Separation standards
Definition
Separation is the concept of using approved separation standards, associated conditions and procedures to ensure spacing between aircraft is never less than a prescribed separation minimum. The Manual of air traffic services (MATS) defined separation as:
…the concept of ensuring aircraft maintain a prescribed minimum from another aircraft or object, whilst meeting the associated condition(s), and requirements of the standard, as specified in MATS.
In this context, the minimum separation can be measured in horizontal and/or vertical distance, or by time. Separation standards are a means to ensure separation between aircraft, the ground and protected airspace using longitudinal, lateral, vertical, and visual criteria and minima. The separation standards applicable to this occurrence are detailed in the following sections.
A 'loss of separation' was defined by Airservices as:
An infringement of prescribed minimum separation: - between aircraft - between aircraft and objects, or - between aircraft and Prohibited or Restricted Areas, or airspace reservations.
A related concept was ‘inadequate separation assurance’ (ISA) which Airservices defined as:
A traffic scenario where separation exists but: - the conflict is not identified, and/or - separation is not planned or is inappropriately planned, and/or - the separation plan is not executed or is inappropriately executed, and/or - separation is not monitored or is inappropriately monitored.
Surveillance separation
An ATS surveillance system can include information from radar, ADS-B,[22] or any other system that enables ATC to identify and locate aircraft.
The horizontal separation minimum based on ATS surveillance information is 5 NM (9.3 km), which may be reduced to not less than 3 NM (5.6 km) if the aircraft are under the control of a terminal control unit or associated control tower.
The Airservices Sydney operational procedures[23] detailed minimum aircraft separation distances for arrivals and departures at Sydney Airport. When runways 34L and 34R were in use for arrivals and departures, the terminal control unit (TCU)[24] was required to ensure the distance between successive arrivals was no less than 5 NM when transferred to the tower. This distance could be reduced after prior coordination between the TCU and tower.
In its safety investigation into the occurrence, Airservices found that:
The Sydney Tower and TCU [were] not consistently managing the arrival sequence spacing in accordance with the requirements of Sydney Operational Procedures. While tower controllers are able process departures with less than the required arrival spacing, this reduces the time available to process departures and achieve a runway standard. This increases the potential use of aircraft go-arounds as a risk mitigation strategy.
The Airservices report also stated:
While Sydney Operations are continuing to address the issues [regarding arrival sequence spacing], tower controllers have become habituated to the inconsistencies.
Within the tower’s airspace, successive arrivals and departures needed to be kept 3 NM apart. There was no separate restriction on spacing between aircraft departing from and arriving to the same runway, except for the runway separation standard (see Runway separation). When visual separation could not be applied between an aircraft departing from one runway and an aircraft executing a missed approach from the other runway, controllers were to ensure that the missed approach course diverged by at least 30° from the departure course unless another separation standard applied.
Runway separation
Runway separation standards are to ensure that a runway area is not occupied by another aircraft or obstruction when air traffic services (ATS) clear an aircraft for take-off or landing. The standards outline the requirements for separation of aircraft operating to and from runways and the required distances, expressed in units of time or distance, between departures and arrivals in a number of configurations, on the same, crossing or parallel runways.
When an aircraft was landing behind a preceding departing aircraft, controllers were instructed to:
Apply the ‘landing behind a preceding departing aircraft’ standard to fixed wing aircraft, provided that you do not permit the landing aircraft to cross the runway threshold until the preceding aircraft is airborne and:
a) has either commenced a turn; or
b) is beyond the point on the runway at which the landing aircraft could be expected to complete its landing roll and there is sufficient distance to enable the landing aircraft to manoeuvre safely in the event of a missed approach.
An aerodrome controller could only issue a landing clearance after:
a) the aircraft has commenced final approach of a straight-in instrument approach or has been sighted by the tower controller: i) on the late downwind leg of the circuit pattern; ii) on base leg; or iii) on final in the case of a straight-in visual approach;
b) a visual check of the landing path has been completed; and
c) no obstructions or collision risk exists.
When the runway was occupied by a preceding aircraft landing or taking off, controllers were instructed that they may:
… clear an aircraft to land only if there is reasonable assurance that the prescribed separation standard will exist when the aircraft crosses the threshold to land.
The ATSB estimated that the 737 would have required a landing clearance by about 1832:15, and at the time at which the 737 would have crossed the threshold (about 1832:26), the A330 would have just been passing the first runway exit and about to lift off.
Wake turbulence separation
Wake turbulence[25] standards must be applied for aircraft departing or conducting a missed approach behind another aircraft. Separation in a surveillance-equipped tower environment such as Sydney was generally based on time and/or distance criteria.
Wake turbulence separation was determined by grouping aircraft types according to maximum take-off weight and wake turbulence characteristics. The maximum take-off weight of the A330 placed the aircraft in the heavy category and the 737 in the medium category. Between these two types, with the heavier aircraft ahead, a distance separation minimum of 2 minutes or 5 NM was generally applicable.
A wake turbulence standard was not required between an aircraft landing behind an aircraft taking off on the same runway. If the landing aircraft, however, conducts a missed approach behind one departing, the aircraft in the missed approach is now considered a departing aircraft. Consequently, a controller should issue a wake turbulence caution to the flight crew of the following aircraft when less than the applicable wake turbulence standard exists.
Visual separation
Visual separation is a means of spacing aircraft through the use of visual observation by a tower controller. The use of visual separation allows a reduction in separation from that required when using a procedural or surveillance standard.
A tower controller was permitted to use visual separation if:
the aircraft were continuously visible to the controllers
the projected flight paths did not conflict
there were wide margins when judging relative distance or height, and
there was no possibility of aircraft being in close proximity.
To visually separate aircraft, controllers were instructed to primarily use azimuth (horizontal angle). Other considerations included:
faster following aircraft and closure rates
projected flight paths
the possibility of visual errors.
In the event of a missed approach, the controller must apply and maintain visual separation until another separation standard may be applied.
Limitations of visual separation
The MATS noted that visually determining the relative distance of aircraft in close proximity can be in error or affected by optical illusions.
The ATSB investigation (AO-2015-084) discussed limitations of using visual separation at night, specifically a controller’s judgement of distance being limited by the physiology of the human eye.
In July 2013, the United States National Transportation Safety Board (NTSB) issued a safety recommendation to the Federal Aviation Administration (FAA). It raised safety concerns about use of visual separation to resolve aircraft conflicts at airports where ATC procedures permitted independent take-off and landing operations on separate, non-intersecting runways with intersecting arrival or departure paths. In these circumstances, with different geometry to the Sydney occurrence, ATC were unable to ensure safe separation in the event of a missed approach. The NTSB stated:
The separation standards … require that potential conflicts be resolved as part of the tower controller’s initial decision on when to issue takeoff clearances to two departing aircraft [on converging, non-intersecting runways]. However, the NTSB notes that there is no requirement for controllers to provide the same protections for the potential go-around flightpath of a landing aircraft even though, in the event of a go-around, the arriving aircraft effectively becomes a departure. Conflicts such as those described in this letter would have been clear violations of FAA safety and separation standards had the scenarios involved two aircraft departing the airport rather than one arrival and one departure. There appears to be no safety justification for treating the situations differently.
Because of the nature of the geometry of the encounters and the unexpected nature of the go-arounds, it was not possible for the ATC tower controllers to issue effective control instructions to ensure that the aircraft avoided each other. Therefore, visual separation procedures could not be successfully applied or asserted as an adequate means of resolving the conflicts. The NTSB is concerned that in these events, ATC was not able to ensure the safe separation of aircraft. Instead, separation was established by resorting to impromptu evasive maneuvers by pilots during critical phases of flight. The NTSB concludes that the lack of specific separation standards, similar to those defined in paragraph 3-9-8 of FAA Order 7110.65, “Air Traffic Control,” applicable to departing aircraft and aircraft conducting a go-around from non-intersecting runways where flight paths intersect, facilitates hazardous conflicts and introduces unnecessary collision risk.
Therefore, the National Transportation Safety Board makes the following recommendation to the Federal Aviation Administration:
Amend Federal Aviation Administration Order 7110.65, “Air Traffic Control,” to establish separation standards similar to the provisions of paragraph 3-9-8 between an arriving aircraft that goes around and any combination of arriving or departing aircraft operating on runways where flight paths may intersect. (Safety recommendation A-13-024).
In response to the safety recommendation, the FAA responded that:
…the FAA amended paragraph 10-3-14, Go-Around/Missed Approach, to require the implementation of procedures to ensure that an arrival that executes a go-around does not conflict with a departure off the non-intersecting converging runway, and for facility management to define tools that could assist in the locally developed procedures.
The NTSB closed the recommendation with the status ‘Closed-Acceptable action’.
Separation assurance
Separation assurance can be either strategic or tactical. Strategic separation assurance includes the development of air traffic practices to reduce the likelihood of aircraft coming into conflict, particularly where traffic frequency congestion may impair control actions. Tactical separation assurance is an activity conducted by the controller that includes traffic planning and conflict avoidance. Where two routes converge, such as at a runway, strategic separation is not possible; nevertheless, routes are designed to optimise separation while being tactically managed by air traffic controllers.
To achieve the first objective specified in the MATS (avoiding collisions between aircraft), ATS have preventative defences in place to assure aircraft remain separated, and recovery defences when separation is comprised or lost. The MATS described the responsibilities for aircraft separation for ATS as follows:
Provide separation
Provide separation using approved separation standards, associated conditions and procedures ensuring spacing between aircraft is never less than a prescribed separation minimum.
Assure separation
Assure separation through the process of assessing traffic, identifying conflicts, planning to ensure separation, executing the plan and monitoring the situation to ensure the standard is not infringed.
Maintain separation
Where the type of separation or minimum used to separate two aircraft cannot be maintained, establish another type of separation or another minimum prior to the time when the current separation minimum would be infringed.
The separation standard may vary depending on a number of factors, including the type of airspace in which the aircraft are operating, and may specify horizontal or vertical distances, or separation based on a flying time between two aircraft passing the same location.
Controllers proactively plan to avoid conflict between aircraft, rather than to wait for or allow a conflict to develop before its resolution.
Sydney Airport information
Background
Sydney Airport is a major international airport which facilitates international, domestic, and regional aircraft movements. It has two parallel runways that are oriented 16/34, separated by about 1 km, and another runway oriented 07/25. The Sydney tower is located to the east of runway 16R/34L and south of runway 07/25.
The airport is located in a low-lying area adjoining Botany Bay. The elevation of terrain to the east of runway 34R within a 10 NM radius is generally no higher than 150 ft with some terrain to the north-east rising up to about 350 ft. The major obstacles rising to a maximum of 1,100 ft were buildings located in the city, about 5 NM (9 km) to the north-north-east of the airport.
Air traffic control at Sydney Airport
Airservices provided 24-hour air traffic services at Sydney Airport. The Sydney Airport Demand Management Act 1997 (Cth) imposed, among other things, a maximum limit on the number of aircraft movements (landings and take-offs) at the airport in any 60-minute period of operation.
The on-duty controllers responsible for the management and sequencing of arrival and departure aircraft inside the Sydney terminal control area were located in the Terminal Control Unit (TCU). That unit operated from a building located at Sydney Airport, separate to the tower.
The on-duty controllers responsible for all aircraft and vehicle movements on taxiways, runways and in the immediate vicinity of the airport were located in the tower. They were responsible for 4 NM around the airport and separation was primarily on a visual basis supplemented by radar displays.
At the time of the occurrence, the air traffic control mode at Sydney was parallel runway operations with independent visual approaches (IVA) to runway 34L and 34R. Independent departures were in effect from runway 34L and 34R.
Arrivals to runway 34R were managed by the approach and director controllers in the TCU before being transferred to the ADC to a boundary approximately 4 NM from the runway 34R threshold and at or below 500 ft.
Independent visual approaches
Independent visual approaches (IVA) allowed two aircraft to be on final approach to parallel runways at Sydney in visual meteorological conditions (VMC). Depending on the meteorological conditions, an IVA could be initiated from a circuit or from an instrument approach once a pilot was visual (could see the runway).
The Aeronautical information publication (AIP) Australia outlined important instructions and advisory information to pilots for the conduct of an IVA. Once ATC cleared a pilot for an IVA the requirements of the procedure must be followed.
Pilots were instructed to fly accurate headings when being vectored for final approach and that it was imperative to intercept the final approach path without overshooting the assigned runway centreline.
Another requirement was that pilots must operate at approach speeds of 160–185 kt when 10 NM from the runway threshold and 150–160 kt when 5 NM from the runway threshold. ATSB analysis of track distance indicated that the 737 was at about 200 kt at 10 NM and 180 kt at 5 NM.
Standard instrument departures and arrivals
At most major airports flight crew navigate their aircraft along flight paths which are known as standard instrument departures (SIDs) and standard terminal arrival routes (STARs). SID and STAR flight paths provide controllers and flight crew with:
separation standards built into the airspace design for departing and arriving aircraft
improved flight path predictability
reduced complexity and workload for pilots and controllers.
At Sydney, in most cases flight path design used open STARs, which did not join directly with instrument approach procedures. Open STARs required the director controller to provide radar headings to link the STAR with final approach.
According to Airservices, the MARUB SIX SID had been published and in operation since about 1997.
Supervision of air traffic control
Controller duty of care
The Airservices National ATS procedures manual (NAPM) provided guidance to all controllers on their duty of care requirements. It outlined that all controllers who are aware of information of an unsafe situation or potential unsafe situation are expected to take all necessary action to remove that risk. It was also expected that the extent of the action required will be driven by professional judgement given the circumstances and would include an assessment of the likelihood of the event occurring and the potential severity of the outcome.
Tower – Supervision and Operational Command Authority
The Airservices National ATS administration manual (NAAM) provided guidance on supervision and operational command authority (OCA). It stated the purpose of supervision in operational environments:
…is to provide tactical management of risks while maintaining efficient air traffic operations. Supervision involves observation of air traffic service delivery and, where necessary, supporting, intervening or directing activities within the area of responsibility. The supervisor is responsible for managing airspace and traffic to ensure safety and maximise network efficiency.
The Sydney tower shift manager (TSM) position held OCA and was therefore required to perform direct supervision of the operating environment within Sydney Tower’s area of responsibility. Direct supervision required the TSM to be physically present within the immediate operating environment and maintain situational awareness of that environment. The NAAM stated:
Where supervision is provided in the delivery of ATS services the supervisor must:
a) monitor the environment and maintain situational awareness of the factors affecting the safety risks and hazards within the environment being supervised;
b) identify threats within the operational environment and ensure adequate, effective risk controls are in place to ensure safe service delivery;
c) prioritise tasks based on the level of risks being managed;
…g) issue Withdrawal of ATS Privilege (ATS-FORM-0009) to relevant employees for which they are responsible when circumstances are considered to be (or to possibly be) compromising to the safety and/or efficiency of the overall operational service.
The NAAM included a limitation in the exercising of OCA, in stating that:
OCA does not give the holder the authority to instruct an operational controller to take certain actions such as directing a controller to issue an operational control instruction. The operational controller is always responsible for traffic separation, but may accept advice from the OCA holder.
Airservices advised the ATSB that the supervisor (TSM) could not have assisted with the provision of safety alerts or wake turbulence caution.
On-the-job instruction
Air traffic control training comprised theoretical, simulator and on-the-job components. On-the-job instruction is conducted in the workplace by specially trained instructors (OJTI).
While conducting training, an OJTI would hold overall responsibility for the provision of a safe and efficient air traffic service, as a trainee would either be not licenced or not endorsed.
During the training period, a trainee would be given increasing levels of responsibility for the control and separation of aircraft, but the OJTI must monitor the trainee’s performance and ensure that any errors or omissions that may impact safety can be corrected in a timely manner. Intervention strategies for an OJTI range from questioning the trainee, to suggesting an alternate course of action, to directing the trainee, and finally to intervening by taking over or overriding the trainee.
Airservices defined a progressive ‘prompting hierarchy’ to be applied by OJTIs to allow a trainee to develop the required skills throughout the development of a safety situation while ensuring it will be effectively managed:
1. Asking – situation awareness/monitoring When prompting at this level, [an] OJTI is trying to determine if the trainee has detected that there is something in their environment that needs their attention.
2. Suggesting – decision making (prioritising) When prompting at this level, [an] OJTI is assisting the trainee to prioritise their attention appropriately to the emerging situation.
3. Directing – decision making (planning) When prompting at this level, [an] OJTI is providing the trainee with the specific solution or plan to the safety critical situation. The trainee is implementing the directed instruction from the OJTI and at this stage, the plan is the OJTI’s.
4. Taking over (execution) At this level of prompting, [an] OJTI has taken over the execution of the plan as there is no longer an opportunity for the trainee to act to safely resolve the situation.
Direct intervention was considered a ‘last resort’ and only used to ensure safety. To facilitate this, the communication system enabled the OJTI to override the trainee’s transmissions.
On the night of the occurrence, the OJTI was cognisant of compromising the assessment and considered that any level of intervention would result in a failed assessment for the trainee ADC.
Compromised separation
Compromised separation recovery
Separation of aircraft is considered to be compromised when separation standards have been infringed, or where separation assurance is absent to the extent that a breakdown of separation is imminent.
In accordance with the MATS, controllers were required to:
… give first priority to separating aircraft, issuing safety alerts and providing directed traffic information as provided by this manual. Perform first that action which is most critical from a safety standpoint.
The MATS required that, except in certain circumstances, controllers issue a safety alert prefixed by the phrase 'SAFETY ALERT' when they become aware that an aircraft is in a situation that places it in unsafe proximity to another aircraft.
The MATS required a controller to issue traffic avoidance advice, prefixed by the phrase 'AVOIDING ACTION', to an aircraft that is receiving an ATS surveillance service and in the controller’s judgement is in a situation that places it at risk of a collision with another aircraft under surveillance.
The phraseology to be used by ATC when providing safety alerts and avoiding action was contained in the AIP. An example of a generic traffic alert is:
(Callsign) AVOIDING ACTION, TURN LEFT/RIGHT IMMEDIATELY (specific heading, if appropriate), and/or CLIMB/DESCEND (specific altitude if appropriate), TRAFFIC (provide position of traffic).
It was permissible for a controller to abbreviate safety alerts and traffic avoidance advice phraseologies to ensure timely provision of advice.
Vectoring at night below minimum vectoring altitude
In daytime, vectoring aircraft at low altitudes was permitted because flight crews could visually maintain adequate height to avoid ground and obstacle collisions. To do this, controllers could assign terrain clearance responsibility to the flight crews.
The MATS stated that a controller could only provide an instrument flight rules (IFR) aircraft with a vector in visual meteorological conditions (VMC) by day.
At night when radar vectoring, the controller needed to retain the responsibility for ensuring terrain clearance is maintained as pilots may not be able to see terrain and obstacles. For this reason, controllers were generally not permitted to vector aircraft below a minimum vectoring altitude (MVA) at night.
The MVA was the lowest altitude a controller may assign to a pilot in accordance with a radar terrain clearance chart (RTCC). The MVA (minimum RTCC) was 1,500 ft in the area the 737 flight crew was initially vectored (Figure 11).
In response to recent occurrences at surveillance towers where tower controllers had vectored aircraft conducting a missed approach without complying with the MATS requirements, Airservices issued a standardisation directive to all surveillance towers (including Sydney), effective 18 June 2019. The Airservices safety investigation report stated:
The directive reiterated that tower controllers are not permitted to vector or provide an uncoordinated vector in IMC [instrument meteorological conditions] conditions or at night unless prior coordination through the relevant TCU and that tower controllers may only assign terrain clearance to the pilot when vectoring, in VMC [visual meteorological conditions] by day.
When controllers become aware that an aircraft is in unsafe proximity to terrain or an obstacle they are required to issue a safety alert to the pilot.
In addition to the occurrence controllers, the ATSB interviewed several other Sydney tower controllers from Sydney tower to understand their view of how they would deal with a similar situation as the occurrence. The general view was that in line with the requirement for controllers to provide a duty of care in an unsafe situation, their professional judgement was that the least-risk option to aircraft was to issue vectors below MVA at night and issue a safety alert terrain to the flight crew. These controllers were aware this was not in accordance with the MATS but commented that it had become a normalised solution to the hazard.
Figure 11: Extract of replayed ATC display showing 737 location when its crew was instructed to turn right (from 800 ft) and relevant radar terrain clearance chart (RTCC) levels
Source: Airservices Australia, annotated by the ATSB
Application of best judgement and initiative
The MATS stated:
Do not allow anything in these instructions to preclude you [the controller] from exercising your best judgement and initiative when:
a) the safety of an aircraft may be considered to be in doubt; or
b) a situation is not covered specifically by these instructions.
Similarly, the Airservices National ATS Procedures Manual stated:
Upon becoming aware of information such that it would be reasonable to conclude that an unsafe situation has, or may occur, it would be expected that all necessary action is taken to remove that risk.
Note: The extent of the action required will be driven by professional judgement given the particular circumstances and would include an assessment of the likelihood of the event occurring and the potential severity of the outcome.
Compromised separation training
Compromised separation recovery training was required for all ATC endorsement training courses. This comprised a training workshop and a simulator exercise. The learning outcomes for the compromised separation training workshop were:
identify the critical sector/unit hot spots for compromised separation and unsafe proximity
describe critical actions and responsibilities in the event of compromised separation or unsafe proximity, including phraseology and with reference to sector/unit specific scenarios
identify aircraft performance considerations critical to resolution of sector/unit specific situations.
Points to be covered included the requirements for safety alerts or traffic avoidance information, and the issuance of accurate timely and well delivered instructions to de-conflict. This training workshop was assessed by the on-line compromised separation training package.
Along with 4 other emergency training sessions, the compromised separation simulator exercise was conducted by a check controller at the Airservices tower simulator. This was a practical application of the topics from the training workshop, and was based on parallel runway 16L/R operations by day.
Following this initial training, tower controllers were required to complete the knowledge-based online training package annually and the skills-based simulator training at least every 3 years.
At the time of the occurrence, Airservices had no compromised separation recovery training scenarios for conflicts on the MARUB SID / runway 34R missed approach procedure, or for compromised separation scenarios where aircraft were below the MVA at night at Sydney.
Flight path design
General information
Airservices designs flight paths in compliance with Civil Aviation Safety Authority (CASA) regulations and standards, and International Civil Aviation Organization (ICAO) standards and recommended practices (SARPs). CASA has mandated that flight path design in Australia must comply with the ICAO SARPs for instrument flight procedure design, except where varied by Australian legislation/manual of standards.
In accordance with Civil Aviation Safety Regulations (CASR) Part 173, CASA has certified Airservices as an organisation permitted to design approach and departure procedures for aircraft operating under instrument flight rules (IFR). The certification process requires a chief designer to manage flight path design and a team of qualified designers.
Design objectives, constraints, and guidance
International Civil Aviation Organization publications
When designing flight paths consideration is given to multiple elements outlined in ICAO publications Procedures for air navigation services – Aircraft operations (PANS-OPS, ICAO Doc 8168) and Procedures for navigation services – Air traffic management (PANS-ATM, ICAO Doc 4444). These include terrain and obstacle clearance, wake turbulence, meteorological conditions, aircraft performance, climb gradients, descent profiles, speeds, rate of turn, angle of bank (turning movement) and the airspace available to safely contain the procedure. Operationally significant design criteria are specified on the charts for each procedure.
Australian legislation
The Air Services Act 1995 requires that Airservices:
In exercising its powers and performing its functions, must regard the safety of air navigation as the most important consideration.
Subject to subsection (1), [Airservices] must exercise its powers and perform its functions in a manner that ensures that, as far as is practicable, the environment is protected from:
(a) the effects of the operation and use of aircraft; and
(b) the effects associated with the operation and use of aircraft.
The latter subsection required, among other things, consideration of elements such as environmental impact (including noise) and community impact associated with flights around airports.
Long Term Operating Plan
Airservices also needed to follow Ministerial directions including, in the case of Sydney Airport, a direction to follow the Long Term Operating Plan (LTOP).[27]
The Ministerial direction meant that Airservices must ensure that, subject to safety and weather conditions:
as many flights as practical use flight paths over water or non-residential areas where aircraft noise has the least impact on people
the rest of the air traffic is spread or shared over surrounding communities as fairly as possible
runway modes (patterns of aircraft movement) change throughout the day so individual areas have some respite from aircraft noise on most days.
In practice, these requirements limited the options available for the design and operation of flight paths such as SIDs and missed approach paths, although the Ministerial direction emphasised that ‘the safety of aviation operations is not to be compromised.’
Among the ‘main matters raised relevant to the Ministerial direction’ were ‘concerns of individuals and community groups about flight paths over specific areas, including flight corridors to the north’ of Sydney Airport. The LTOP stated:
[Outbound runway 34R tracks] were designed to make use of the open golf course area, and the shortest route to the sea, to facilitate over water tracking, and to avoid the ‘obstacle clearance area’ posed by the city. Additionally, the design had to satisfy the requirement of the independent parallel runway separation standard, which dictates a turn of a minimum of 15 degrees to the east from runway heading.
When runway 16L/34R was built in the mid-1990s, take-offs to the north from runway 34R were initially not permitted. From 19 October 1996, Airservices introduced new procedures to further reduce the number of overflights of the areas that had been exposed to the greatest levels of aircraft noise. The LTOP stated:
The first procedure involves take offs to the north from the new parallel runway (runway 34R) and turning east as soon as safely practicable, following existing flightpaths out to sea.
Sydney flight paths generally direct aircraft departing from runway 34R to the east, while aircraft departing from the parallel runway 34L are directed to the north and west. This distributes the noise of departures from each runway across different areas.
Flight Safety Foundation guidance
The Flight Safety Foundation is an international non-profit organisation that provides impartial, independent, expert safety guidance and resources for the aviation and aerospace industry. It identifies global safety issues, sets priorities and serves as a catalyst to address these concerns through data collection and information sharing, education, advocacy and communications.
The Go-Around Decision Making and Execution Project: Final Report to Flight Safety Foundation (Blajev and Curtis, 2017) recommended that:
An ATS agency responsible for instrument approach procedure design should ensure that straightforward go-around procedures are available and published for each runway. These go-around procedures should be designed in consultation with pilots who are representative of those who will be expected to use them.
Implementation advice for the Flight Safety Foundation recommendation regarding a missed approach point design included:
- a low (eg. Below 2,000 ft) first stop altitude and an early turn in a missed approach procedure should be avoided.
- procedural de-confliction of the missed approach path from other traffic and from the risk of exposure to wake turbulence, especially on late go-arounds, should be provided
- environment restrictions – especially noise-abatement restrictions – must not affect the design of missed approach procedures if their imposition would compromise safety standards.
Implementation
Prior to the publication of a flight path, Airservices ensures that flight path designs are compliant with the CASR through, among other requirements, designs carried out by qualified designers in accordance with ICAO Doc 8168. CASA then conducts flight validations to ensure procedures are safe and flyable and that they meet applicable design standards.
For instrument approach procedures, the missed approach design provides a minimum obstacle clearance to aircraft climbing along the specified missed approach path. This ensures aircraft are protected from obstacles and terrain when conducting a missed approach providing the aircraft remains on the missed approach procedure track.
Air traffic services safety management
Safety management systems
ICAO Annex 11 required air traffic service providers to have a safety management system (SMS) and stated that system shall:
a) Identify actual and potential hazards and determine the need for remedial action
b) Ensure that remedial action necessary to maintain an acceptable level of safety is implemented and;
c) Provide for continuous monitoring and regular assessment of the safety level achieved.
Based on the ICAO document 9859 (Safety management manual), the CASR Part 172 outlined an SMS framework with four major components:
safety policy, objectives and planning
safety risk management
safety assurance
safety training and promotion.
Airservices had a CASA-approved SMS which was oversighted in accordance with CASR Part 172.
Safety risk management
Safety risk management includes hazard identification, safety risk assessments and safety risk mitigation. The ICAO Safety management manual stated:
The SRM [safety risk management] process systematically identifies hazards that exist within the context of the delivery of its products or services. Hazards may be the result of systems that are deficient in their design, technical function, human interface or interactions with other processes and systems. They may also result from a failure of existing processes or systems to adapt to changes in the service provider’s operating environment.
Organisational investigations of safety occurrences and hazards are an essential activity of the overall risk management process in air traffic services. Investigations identify latent system deficiencies and missing or inadequate defences for which corrective safety action can be taken to ensure continuous improvement to an organisation’s entire safety system.
Risk assessment and mitigation at Sydney airport
Operational risk assessments
The Airservices risk management and mitigation measures of local Sydney tower hazards were recorded in the Sydney tower operational risk assessment (ORA). ORAs were managed and reviewed in accordance with the requirements of the Airservices SMS. They were described by Airservices as ‘a higher level representation of the threats and barriers and one artefact reviewed as the outcome of safety risk management activities’.[28]
The Airservices ORA review procedure described the roles and responsibilities for the identification, assessment, and management of hazards/threats. Furthermore, it described when ORA reviews should be conducted, stating:
- Reviews driven by changes to practices, procedures and/or equipment (referred to as 'ad hoc' reviews) which are conducted at the time of any such change.
- Comprehensive reviews conducted at periods not exceeding 24 months from the previous comprehensive review.
Airservices ORAs were based on the ‘bow-tie’ model as a risk evaluation method to analyse and demonstrate causal relationships in high-risk scenarios such as a mid-air collision. Risk in bow-tie methodology is elaborated by the relationship between hazards/threats, top events, and consequences. Controls are used to display what measures an organisation has in place to control the risk. Controls can be proactive and reactive. A third control classification is escalation control which is used to manage escalation factors. Escalation factors are certain conditions that can make a control fail.
Identification of conflict scenarios
The ATSB examined all 10 Sydney tower ORAs for item ‘H-01-Conflict in the air’ from 2012 to 2019. At the time of the occurrence the most recent review was Sydney tower ORA (H-01-Conflict in the air) version 6.1, dated 3 July 2019. It identified a top event of ‘Inappropriate or lack of control action or advice’ with the hazard of ‘Conflict in the air’. The threats contained in the ORA relevant to this occurrence were:
controller incorrectly applies standards or procedures
independent parallel departures
missed approach (go-around)
unexpected pilot action
loss of separation with obstacle (terrain)
loss of separation (including runway separation).
The ORAs did not include specific scenarios involving loss of separation. More specifically, the ORAs did not include the potential MARUB SID / runway 34R missed approach conflict as a threat or escalation factor. Additionally, the Sydney tower ORA did not contain the hazard of compromised separation when aircraft were below the MVA at night.
Evaluation of risk controls
Each of the threats had identified defensive barriers to prevent the associated threat from realising the top event and subsequently the hazard. Most of these barriers were procedural in nature and included supervision, compromised separation rules and procedures, the issuing of safety alerts, and pilot action.
Airservices advised ATSB that threats associated with aircraft concurrently following the MARUB SIX SID and runway 34R missed approach procedures were ‘known’ and that the risk was ‘effectively managed.’ Airservices reasoned that ‘there had not been an occurrence history or operational assurance activities that had identified systemic risk control shortfalls’ with the management of MARUB SIX SID and runway 34R missed approach traffic scenarios to indicate that the level of risk was not as low as reasonably practicable.
Civil Aviation Safety Authority oversight
The Civil Aviation Safety Authority (CASA) has the responsibility of oversighting and ensuring Airservices maintained and operated its ATS functions in accordance with the Manual of Standards for CASR Part 172 and approved procedures in the MATS. This oversight consisted of regulatory audits of Airservices functions such as air navigation service delivery and flight path design management, and the Airservices SMS.
CASA completed a surveillance audit on Sydney Tower in July–August 2018, one year before the occurrence. The report stated:
The surveillance team reported two (2) Safety Findings and three (3) Safety Observations.
The first Safety Finding related to the Operational Risk Assessment (ORA) not being updated to track ongoing A-SMGCS [advanced surface movement guidance and control system] faults.
The second Safety Finding related to the Business Continuity Plan (BCP) not being reviewed in accordance with the document.
The Safety Observations related to:
- occurrence rates on Runway 16R - standardisation of stop bar protocols - lighting intensity of an advertising sign.
Runway 16R is a runway to the west of and parallel to runway 34R and refers to operations in the opposite direction. Regarding the runway 16R occurrence rates, the CASA report stated:
Sydney Tower CIRRIS[29] data confirms aircraft landing behind a departing aircraft on Runway 16R are involved in an increased number of go arounds and Loss of Separation (LOS) events. The occurrence rate is noted as being higher for Runway 16R compared to other Runways at Sydney.
A secondary impact of increased go rounds is the loss of an additional landing slot, thereby negatively impacting airport efficiency and increased ATC workload and complexity.
Observations and reports from personnel interviews at Sydney defined this situation as an increased latent risk.
CASA recommends that Airservices review and investigate the underlying reasons behind the increased go round / LOS occurrences for arriving aircraft behind a departing aircraft on Runway 16R.
No issues regarding runway 34R were raised.
Related occurrences
Airservices data
Airservices advised the ATSB that in the 2019 calendar year, there were 348,730 movements at Sydney and within the Airservices occurrence reporting system there were 349 reports where ‘go around’ was recorded as the primary occurrence type. However, due to limitations in recorded data and the type of occurrences that were required to be reported, it was not possible to obtain detailed data on related occurrences at Sydney involving aircraft concurrently following the MARUB SIX SID and runway 34R missed approach procedures and the level of controller intervention, if any, that resulted.
Controller interviews
Of 9 Airservices controllers interviewed by the ATSB, 8 indicated that the MARUB SIX SID and the runway 34R missed approach procedure was a recognised concern. Some discussed the absence of compliant options to resolve a potential conflict as being problematic. One controller interviewed by the ATSB estimated that intervention due to the potential for conflict between the MARUB SIX SID and runway 34R missed approach procedures occurred 10 to 20 times in a year (day and night).
ATSB occurrence data
A search of ATSB occurrence records from 2013-2022 did not identify any other losses of separation associated with aircraft concurrently using the MARUB SIX SID and a missed approach from runway 34R.
On 5 reported occasions, including the one under this investigation, an aircraft on approach to runway 34R conducted a missed approach due to a potential conflict with another aircraft taking off from the same runway. All were initially reported to the ATSB as a missed approach; the occurrence under investigation was revised to include the loss of separation category after further enquiries from the ATSB based on the Qantas reports. No flight path data for the other occurrences were available at the time of review.
ATSB study into loss of separation occurrences in Australian airspace
The ATSB research report Loss of separation between aircraft in Australian airspace – January 2008 to June 2012 (AR-2012-034) found that ‘assessing and planning’ or ‘monitoring and checking’ errors were involved in most individual controller actions that contributed to loss of separation (LOS) occurrences. Ineffective management of compromised separation before it became a LOS was categorised as an assessing and planning error. Monitoring and checking errors included controller actions associated with maintaining awareness of traffic disposition.
In addition, the ATSB research found that of the LOS occurrences in which ATC actions were contributory, about one quarter involved communication errors. These included not passing traffic information to pilots once separation was compromised. The research found that task demands were the most common type of local condition identified in LOS occurrences where controllers were involved – in particular, high workload and distractions. Common in all ATC environments, these local conditions were more common in the tower environment.
2015 loss of separation in Adelaide
On 18 May 2015, there was a series of LOS occurrences and vectors issued to flight crew below the minimum vector altitude (MVA) in the airspace around Adelaide Airport, South Australia.[30] An Airservices safety investigation into the occurrences identified the following safety issues:
Compromised separation training for controllers at Adelaide Tower did not incorporate scenarios where aircraft were below the minimum vector altitude at night.
The updated Intervention Techniques and Prompting initial qualification training was not provided to existing OJTIs or workplace assessors. Additionally, the relevant refresher training module had not been updated.
There were no defined explicit requirements, including the required phraseology, for coordinating the transfer of separation responsibility between controllers.
Airservices subsequently advised that each of the safety issues had been addressed and all related safety actions had been completed. The ATSB reviewed the Airservices report, safety issues and safety actions. Based on this review, the ATSB considered it was very unlikely that further investigation would identify any systemic safety issues and discontinued the investigation.
Losses of separation in Melbourne
Occurrence information
In October 2011, at night at Melbourne Airport, Victoria and during land and hold short operations (LAHSO), an aircraft on final approach to land on runway 34 conducted a missed approach while another aircraft was landing on runway 27. LAHSO allowed for simultaneous landings on crossing runways, with the requirement that one aircraft stops well before the intersection of the runways. As the aircraft in the missed approach was below the MVA, the controller was unable to issue a radar vector to ensure separation. The occurrence was reported but the ATSB did not investigate.
On the evening of 5 July 2015, with LAHSO in effect at Melbourne Airport, a Boeing 777 was cleared for an immediate take-off from runway 34 while two Boeing 737s were on approach to runways 34 and 27. This resulted in the crew of the 737 on approach to runway 27 initiating a missed approach, followed by the crew of the 737 on approach to runway 34 being instructed by ATC to go around. The 737 on approach to runway 34 was then radar vectored by ATC below the MVA.
Civil Aviation Safety Authority response
On 2nd November 2015 CASA wrote to the ATSB and Airservices listing a number of key concerns involving Melbourne operations, which included:
the requirement for IFR aircraft to remain on the published missed approach procedure until reaching the lowest safe altitude
the procedural restrictions on ATC not to issue turn instructions applicable while the aircraft is below the MVA during a missed approach at night that takes the aircraft outside the protections of the published missed approach
the limitations on the ability of ATC to provide effective separation to aircraft at night based on visual observation
the limitations on pilots of IFR aircraft to see and manoeuvre to avoid one another at night
the lack of demonstrated training competency of air traffic controllers in the handling of night-time compromised separation.
In the same correspondence CASA also stated:
… the (air traffic management) system should not rely, as a primary means of defence, on vectoring or heading changes for (instrument flight rules) category aircraft at night that are below the appropriate minimum altitude.
ATSB investigation
The ATSB investigation[31] into the 2015 occurrence reported that:
…since 2011, Airservices Australia had been aware of the hazard associated with the inability to separate aircraft that were below the appropriate lowest safe altitude at night but had not adequately mitigated it. This resulted in a situation where, in the event of a simultaneous go-around at night during LAHSO at Melbourne Airport, there was no safe option available for air traffic controllers to establish a separation standard and to ensure a mid-air collision did not occur when aircraft were below minimum vector altitude. Though Airservices Australia had implemented a number of preventative controls prior to this occurrence in response to concerns expressed by the Civil Aviation Safety Authority (CASA), a recovery control was not implemented until 2016.
The ATSB identified a safety issue, stating that ‘the hazard associated with the inability to separate aircraft that are below the appropriate lowest safe altitude at night was identified but not adequately mitigated.’ The ATSB also found that:
… the compromised separation recovery training provided to the air traffic controllers employed in the Melbourne ATC Tower did not include a night scenario for missed approaches during LAHSO.
Safety actions
In response to the occurrence, Airservices introduced:
a stagger procedure for arrival pairs to prevent unsafe proximity in the event of a missed approach
training for Melbourne ATC Tower controllers in compromised separation recovery at night during LAHSO
a safe sector to allow controllers to vector aircraft to a path clear of obstacles when below the MVA following a missed approach at Melbourne during LAHSO.
The safe sector at Melbourne had been assessed for obstacle clearance and found suitable for vectoring the aircraft below the MVA at night. CASA issued Airservices with a partial exemption to the MATS to allow this. The exemption only applied during LAHSO at Melbourne at night, and had certain conditions including that controllers could only vector aircraft when they were above 600 ft and only towards an internally-published region (the safe sector). Melbourne tower controllers also had to be trained in the use of safe sectors. The exemption was renewed at intervals and was current at the time of the Sydney occurrence.
In November 2015 Airservices advised CASA that it intended to roll out a national program to further enhance the knowledge and skills of tower controllers. The action would involve enhancements to night-time compromised separation training for risk situations.
To implement this, an Airservices standards manager emailed line training managers to include scenarios where aircraft are below the MVA at night in their respective training packages. However, the Airservices system for assigning safety-related tasks and assuring their completion (CIRRIS) was not used. Consequently, some Airservices line training managers, including those at the Sydney and Gold Coast airports, had not incorporated compromised separation scenarios where aircraft are operating below the MVA at night at the time of the Sydney occurrence.
Several Sydney controllers interviewed by the ATSB for the current investigation stated that the provision for controllers to use safe sectors would improve safety by providing compliant options to reduce the risk of unsafe proximity without increasing the risk of terrain/obstacle collision.
Flight operations
Overview
This section details the context around the flight operations aspects of the occurrence, including personnel, aircraft information, procedures, and flight crew training. Unless otherwise specified, document references are from the version current at the time of the occurrence.
Personnel information
737 flight crew
Both 737 flight crew members held an air transport pilot licence (ATPL) aeroplane and Class 1 aviation medical certificate. They reported no recent or ongoing medical or personal issues likely to have influenced their performance.
The captain had about 19,017 hours of aeronautical experience, including 13,680 hours on 737 variants. The captain reported feeling alert at the time of the occurrence.
The first officer (FO) had about 7,710 hours of aeronautical experience, including 1,460 hours on 737 variants. The FO reported feeling a little tired at the time of the occurrence. They reported getting a normal amount of sleep in the nights before the occurrence. ATSB analysis indicated that the FO was probably not experiencing a level of fatigue known to have an adverse effect on performance.
A330 Flight crew
Both A330 flight crew members held an ATPL aeroplane and Class 1 Aviation medical certificate and were appropriately qualified to conduct the flight.
The A330 captain had a total of 19,100 hours flight time, with about 335 hours on A330 variants. They reported feeling fully alert at the time of the occurrence.
The FO had a total of 12,105 hours flight time, with 2,945 hours on A330 variants. They reported feeling fully alert at the time of the occurrence.
ATSB analysis indicated there was a low likelihood that either A330 pilot was experiencing a level of fatigue known to have an adverse effect on performance.
Aircraft information
737 flight management computer
The 737 flight management computer (FMC) contained a navigation database that included most of the information presented on navigation charts as well as additional data used for navigation. Lateral navigation guidance (LNAV) and vertical navigation guidance (VNAV) could be coded using the FMC and displayed on flight instruments.
Typically, flight crews can program the FMC with arrival routes that join runway approaches to provide continuous lateral navigation guidance. At Sydney, most of the STARs were open, which meant there was a discontinuity between the last waypoint of the STAR and the instrument approach. Once the aircraft reached the end of the STAR route and/or were vectored from the STAR to intercept the instrument approach, LNAV automatically disconnected.
A route discontinuity was displayed on the central display unit (CDU) with an alert message and associated message indications (Figure 12). A flight crew could resolve the discontinuity by entering an adjoining waypoint in the CDU. There was no requirement to do this.
Figure 12 displays an example route legs page with a route discontinuity present indicated by a break in the waypoints and the message ‘route discontinuity’. Also displayed is the joining of waypoints when the discontinuity is cleared.
Figure 12: Example flight management computer route legs page with discontinuity present (top) or cleared (bottom)
Source: Qantas Airways, annotated by the ATSB
737 automatic flight system
Overview
The 737 automatic flight system (autopilot) consisted of an autopilot flight director system and autothrottle, in conjunction with a flight management computer and mode control panel.
In normal autopilot operation, the flight director and autothrottle were controlled automatically to fly a pre-programmed and optimised flight path through climb, cruise, and descent.
To select the desired mode, flight crew pushed the applicable mode selector switches, which illuminated when active. Flight mode annunciations were displayed above the attitude indicator on the outboard display unit (primary flight display).
The engaged flight modes were displayed in green letters and armed modes were displayed in smaller, white letters beneath the engaged modes. A highlighting rectangle appeared around the relevant mode annunciation for a period of 10 seconds following mode engagement.
To manoeuvre the aircraft in a missed approach, the following modes could be used:
lateral navigation (LNAV)
heading select (HDG SEL)
go-around (GA).
A standard rate turn was at a 25° bank angle, and the flight crew could also select other bank angles up to 30°.
Lateral navigation mode
To engage LNAV in flight, an active route must be entered in the flight management computer. LNAV will automatically disconnect on reaching a route discontinuity or when other modes such as HDG SEL are engaged.
When LNAV mode is selected, flight director roll is commanded to intercept and track via the active route. This route can include airways, SIDs, STARs, instrument approach and missed approach path.
When conducting an instrument approach, following localiser (LOC) capture the roll (lateral) mode window will display LNAV in white (armed), providing the engagement criteria in flight is met. This visual display is the only indication to pilots that LNAV guidance will be available during a missed approach (Figure 13).
Figure 13: 737 indications on ground-based augmentation system landing system (GLS) approach displaying when LNAV becomes armed
Source: Qantas Airways, annotated by the ATSB
Heading select mode
The HDG SEL mode commands a turn to the heading selected by the pilot on the mode control panel and maintains that heading.
Go-around mode
Go-around mode is engaged by pushing either of the take-off/go-around (TOGA) buttons. An autopilot go-around can be conducted in certain conditions or flight crew can carry out a manual flight director procedure.
In the manual procedure, with the first push of either TOGA button:
autothrottle (if armed) engages and advances thrust to produce 1,000 to 2,000 ft/min rate of climb
pitch mode engages in TOGA
flight director commands pitch 15 degrees nose up until reaching programmed rate of climb.
roll mode maintains existing ground track and, above 400 ft radio altitude, LNAV will engage (if TOGA to LNAV equipped and no route discontinuities after missed approach point).
Above 400 ft, the flight crew can terminate the go-around mode by selecting a different pitch or roll mode.
Traffic collision avoidance system
In accordance with regulatory requirements, the 737 and A330 were each equipped with an advanced traffic alert and collision avoidance system (TCAS). This system operated independently of air traffic control (ATC) by using on-board surveillance capability to detect other transponder-equipped aircraft. The relative position of aircraft were presented as coded symbols on the TCAS display with two levels of traffic alerting:
Traffic advisory (TA) for potential collision threats (40 seconds from closest point of approach) – aural message ‘TRAFFIC, TRAFFIC’, and TRAFFIC annunciation on the display
Resolution advisory (RA) for real collision threats (25 seconds from closest point of approach) – aural message with vertical guidance, and corresponding annunciation on the display.
In most encounters, two aircraft will declare the other to be a threat at slightly different times.[32]
All RA are inhibited below approximately 1,000 ft above ground level (AGL) and all TCAS aural alerts are inhibited when below approximately 500 ft. This is to ensure that alerts are not generated during certain phases including initial take-off climb and go-arounds for two reasons: to avoid distracting the flight crew at a critical phase of flight and, because the aircraft is already flying close to the performance limit (body angle/attitude and thrust).
An example TCAS RA indication showing the relative location of a ‘threat’ aircraft (in amber) on an Airbus navigation display is shown in Figure 14. In this display, the other aircraft is ahead, to the right, 600 ft above, and descending.
Qantas arranged for the A330 TCAS computer to be analysed. A review of the recorded data showed that during the occurrence the A330 received a TA without any RAs. The 737 flight data did not record traffic alerts.
Figure 14: Example TCAS display
Source: Airbus
Enhanced ground proximity warning system
Both the A330 and 737 were equipped with an enhanced ground proximity warning system (EGPWS). The purpose of the EGPWS is to warn the flight crew of potentially hazardous situations, such as a collision with terrain. It detects terrain collision threats and triggers aural and visual indications.
Runway 34R missed approach procedure
Missed approach from visual approach
The AIP described the procedure for a missed approach (go-around) from a visual approach:
In the event that an aircraft is required to go around from a visual approach in VMC, the aircraft must initially climb on runway track, remain visual and await instructions from ATC. If the aircraft can not clear obstacles on the runway track the aircraft may turn.
The exception to the above procedure is that, at Sydney, visual go arounds must be carried out:
a. In accordance with the GLS or ILS missed approach procedure for the runway the aircraft is using, or
b. As directed by ATC.
In this case, the missed approach procedure for the GLS runway 34R approach (used by the 737 crew) required flight crew to maintain runway track (335°) and at 600 ft turn right, track 070° and climb to 2,000 ft (Figure 2).
The Jeppesen and Airservices instrument approach charts depicted the missed approach path for runway 34R tracking straight ahead until well north of the departure end of runway 34R before the right turn (Figure 2). Missed approaches initiated before or at the missed approach point will reach the mandatory 600 ft right turn well before the turn depicted on the chart.
Determination of the missed approach point location
The AIP defined a missed approach point as:
That point in an instrument approach procedure at or before which the prescribed missed approach procedure must be initiated in order to ensure that the minimum obstacle clearance is not infringed.
For instrument landing system (ILS) and GLS approaches, the point of intersection of an electronic glide path with the applicable decision altitude is used to determine the missed approach point. The location of a missed approach point varied depending on a number of factors, and there was typically no fixed missed approach point in published approach procedures. However, operators could pre-program a missed approach point into aircraft navigation computers to help flight crews manage this phase of flight (particularly when commencing a missed approach before reaching the missed approach point); see Flight management computer missed approach waypoint.
In practice, the missed approach point is the last point that flight crew need to decide to conduct a missed approach when they have not made visual contact with the runway. However, missed approaches can be conducted after the missed approach point for other reasons, including obstructed runways or any issue making a normal landing difficult.
In the context of instrument approaches, the AIP stated:
In executing a missed approach, pilots must follow the missed approach procedure specified for the instrument approach flown. In the event that a missed approach is initiated prior to arriving at the MAPT [missed approach point], pilots must fly the aircraft to the MAPT and then follow the missed approach procedure.
The 737’s FMC uses predefined waypoints to navigate the aircraft along the approach and missed approach path. The location of the runway 34R threshold is marked in the FMC with waypoint RW34R.
The missed approach point is the point at which the glidepath intercepts the decision altitude. A reference missed approach point (where the nominal glidepath intercepts the decision altitude) was pre-programmed into the FMC so that flight crews could use it as guidance for following the missed approach procedure. The location of the reference missed approach point could vary depending on the approach type and chart.
After the occurrence, Qantas conducted a review of these waypoints for 9 different approaches to runway 34R and found that 8 of the waypoints programmed into the FMC were incorrectly located at the runway threshold instead of on the final approach path before the runway. These included the waypoint for the approach carried out by the 737 flight crew during the occurrence: it should have been about 0.5 NM before the threshold.
History of Sydney runway 34R tracking
Several controllers interviewed by the ATSB advised there was a recognised variation of aircraft tracking via the runway 34R missed approach path.
Figure 15 shows a composite of recorded runway 34R missed approach tracking (in red) between July 2017 and March 2019 illustrating how the paths can cross or converge with typical aircraft tracks following the MARUB SIX SID (grey). A small number of tracks also crossed the ENTRA FIVE SID.
The OJTI reported that in their experience with similar situations to the occurrence, even with 5 NM spacing, a missed approach still results in conflict.
Figure 15: Aircraft tracks for runway 34R missed approaches (red) compared with tracks following the MARUB SIX and ENTRA FIVE SIDs (grey) from July 2017 to March 2019
Some of the variation in aircraft tracking, particularly for missed approaches, is likely to be due to control instructions issued. In addition, this diagram shows all departures and missed approaches, not just those that are concurrent, for which additional data was not available.
Source: Airservices, annotated by the ATSB.
Qantas procedures
Go-around and missed approach procedure
The Qantas 737 Flight Crew Operations Manual (FCOM) contained a procedure for the conduct of a missed approach. That procedure included the following actions required above 400 ft:
Above 400ft, verify LNAV or selected HDG SEL as appropriate [pilot flying]
Observe mode annunciation [pilot monitoring]
Verify that the missed approach route is tracked [both pilots]
The Qantas 737 Flight crew training manual (FCTM) provided supplementary guidance to flight crews on the management of all engines operating go-arounds and missed approaches. It provided the following advice when using the flight director:[33]
If a missed approach is required following a single autopilot or manual instrument approach, or a visual approach, push either TO/GA [TOGA] switch, call for flaps 15, ensure/set go-around thrust, and rotate smoothly toward 15° pitch attitude. Then follow flight director commands and retract the landing gear after a positive rate of climb is indicated on the altimeter.
The TO/GA roll mode maintains existing ground track. Above 400ft RA [radio altitude], verify that LNAV is engaged for airplanes equipped with the TO/GA to LNAV feature, or select a roll mode as appropriate.
Note: Route discontinuities after the missed approach point will prevent the TO/GA to LNAV function from engaging.
The FCTM also contained information on how to manage initial manoeuvring if required by a missed approach procedure. It stated:
If initial manoeuvring is required during the missed approach, do the missed approach procedure through gear up before initiating the turn. Delay further flap retraction until initial manoeuvring is complete and a safe altitude and appropriate speed are attained.
Automation systems management and communication
The Qantas Flight administration manual (FAM) described the preferred method for flight crew to manage automatic flight management systems. It highlighted that while automation can be a valuable tool for flight crew, a good understanding of the systems and an awareness of the flight modes was required.
To maintain a positive awareness of the automation system status, and to ensure that both flight crew had a shared understanding of any mode changes, standard operating procedures (SOPs) outlined in the FAM were to be applied. This included a number of standard calls and procedures.
The most relevant procedure to this occurrence was the verbalisation of any changes to the flight mode or autopilot status. In most situations that entailed a call by the pilot flying acknowledging that a change had occurred followed by a ‘checked’ confirmation call from the pilot monitoring. The flight crew did not recall verbalising these calls.
Flight crew training
During recurrent simulator training and checking, pilots had opportunities to practice go-around procedures, including go-arounds with one engine inoperative, and with all engines operating. All Qantas pilots were required to demonstrate proficiency in go-arounds biannually. Qantas advised that in the 3 years prior to the occurrence there were no cyclic training go-around exercises conducted specifically on Sydney runway 34R for pilots on the 737 fleet.
The 737 captain recalled flying the runway 34R missed approach some years prior in the simulator. At that time there had been a number of aircraft overshooting the 2,000 ft level off altitude which increased risk of a loss of separation with overflying aircraft. As such, the training emphasis was on the threat being not capturing the low altitude level off.
The 737 FO advised that they had not flown the Sydney 34R missed approach procedure in the simulator and had only conducted one go-around in the aircraft. That go-around was conducted at Melbourne Airport in day VMC and the procedure required the pilot to fly straight ahead on runway track and climb to 4,000 ft.
The ATSB reviewed the 737 captain and FO’s training records and found both pilots had met the competency standard for one engine inoperative and all engines operating go-arounds.
Recorded data
Both the 737 and A330 aircraft involved in the occurrence were fitted with a flight data recorder (FDR) and cockpit voice recorder (CVR) as required by legislation.
The CVR data recorded during the occurrence was overwritten during subsequent operation of the aircraft. Both FDRs included data over the period of the occurrence.
Safety analysis
Introduction
On the night of 5 August 2019, aircraft landing and taking off from runway 34R were controlled from the Sydney air traffic control (ATC) tower via the ‘aerodrome controller (ADC) – east’ position. That position was operated by a trainee ADC and an on-the-job supervisor.
Following the landing of a Dash 8, the trainee ADC cleared the Airbus A330 to line up and take off while the Boeing 737 was on final approach to land. After realising that runway separation could not be assured, the trainee controller instructed the 737 to go around (conduct a missed approach). During the subsequent missed approach and turn to the right, the 737 came into close proximity with the A330 on its initial climb and turn to the right. This was classified as a ‘loss of separation’ under the ATSB’s occurrence classification system.
The loss of separation and close proximity between the 737 and the A330 was the culmination of a series of events that, individually, would only be minor concerns but collectively resulted in a significant incident.
This analysis first examines the development of the occurrence, and then discusses associated air traffic management and flight operations considerations.
Speed control on approach
The operational requirements for independent visual approaches (IVA) at Sydney and the instrument approach chart used by the flight crew detailed the speed control requirements for aircraft on approach.
In the initial parts of the approach the 737 flight crew operated at higher speeds than specified for the IVA. The aircraft was well above the maximum speed when 10 NM from the threshold and did not attain the required speed until after the trainee aerodrome controller (ADC) instructed the A330 crew to line up.
Although this did not have any detrimental effect on the 737’s operation (as the approach was stable), it contributed to the reduction of spacing between the 737 and the preceding Dash 8 and gave the trainee ADC less time to process the A330 departure. The flight crew did not advise air traffic control (ATC) of this increased speed, as required by the approach chart, and this probably affected the trainee ADC’s judgement of the amount of time available before the 737 would cross the runway threshold, as detailed in the following section.
Adherence to published approach speed limits aids to improve safety and efficiency by bringing more predictability to arrival sequences. This provides controllers with information used to manage separation standards between aircraft.
Sequencing of arriving aircraft
Aircraft arriving at Sydney Airport were sequenced for landing by the approach controller, who operated from the terminal control unit (TCU) at the airport. When aircraft were established on approach, they were transferred from the approach controller to the applicable aerodrome controller in the tower—in this case, the ADC position.
The local instructions applicable at the time specified the minimum distance between successive arrivals to runway 34R to be 5 NM. This distance could be reduced in some cases (not below 3 NM) if there was prior coordination between the approach and aerodrome controllers.
In this case, the spacing between the landing Dash 8 and the following 737 on approach was 4.5 NM when the 737 was instructed to contact the tower (ADC), and 4.1 NM when the ADC was first contacted. However, the approach controller had not coordinated with the trainee ADC for the transfer as required by the Sydney operational procedures.
The director controller did not later recall details of the arriving aircraft and operations in the TCU were described as normal. The sequencing of aircraft arrivals is dynamic and subject to a number of variables such as traffic density, aircraft performance, operator procedures, and environmental conditions.
In this case, the primary factor was the difference in aircraft performance as the aircraft in the approach sequence was a turboprop Dash 8 with a relatively low approach speed compared to the 737. Although the approach controller would have taken this speed difference into account, the Dash 8 was still slower than expected and the 737 was faster than specified for the independent visual approach. Had the 737 been 5 NM behind the Dash 8 and not 4.1 NM when the crew first contacted the ADC, there would likely have been enough additional spacing (about 0.9 NM) and time (about 25 seconds) for the A330 to take off without the 737 needing to conduct a missed approach: the A330 would have been crossing the departure end of the runway at about the same time the 737 would have reached the missed approach point.
Airservices found that Sydney TCU controllers routinely sequenced aircraft arrivals with less than the required 5 NM spacing without prior communication with Sydney Tower, and that this non‑conforming practice had been normalised. While some variability in aircraft spacing is expected in the dynamic Sydney terminal environment and ADCs are required to exercise their judgement as to the suitability of gaps for departures, provision of spacing within parameters generally reduces ADC workload and associated risk of traffic management misjudgements.
Although ADCs had access to radar position information for aircraft on approach, their primary focus was on visual separation of the aircraft on the runway and within 4 NM of the airport. As a result, ADCs may not have time to maintain an awareness of the distance between aircraft on approach. In that context, advance notice from the approach controller of less than 5 NM spacing (in accordance with operational procedures) would help an ADC to plan arrivals and departures and reduce the risk of compromised runway separation and associated go-arounds.
Management of the landing and departing aircraft
In visual meteorological conditions, the trainee ADC sequenced departing aircraft between arriving aircraft according to visual separation standards with supplementary information, mainly from the air traffic display. Although the distance between the arriving aircraft could be measured on the display, this was a dynamic parameter and required diversion of attention from the primary task of visual separation.
Controllers are expected to optimise traffic flow with minimal delays while still safely managing separation in accordance with the applicable standards. The standard most relevant at this point in the occurrence was the runway separation standard where, in simple terms, only one aircraft at a time was permitted to be on (or over) the runway.
It was permissible to instruct an aircraft to line-up for take-off behind a landing aircraft, but a take‑off clearance could not be given until the runway ahead was clear. In this case, the trainee ADC was required to anticipate the time taken for:
the preceding landing Dash 8 to clear the runway
the departing A330 to become airborne then turn or be clear of the runway required by the following 737
the following (landing) 737 to reach the runway threshold.
Although the 737 was at close to its minimum approach speed by the time the Dash 8 crossed the runway threshold, the spacing had reduced to 3.3 NM. If the approach controller had advised the ADC of the non-conforming spacing, or the ADC controllers were aware that the 737 was faster than the specified approach speed, the trainee ADC and OJTI would have been prompted to pay closer attention to the 737’s proximity when considering the plan for the A330’s departure. The trainee aerodrome controller’s judgement of the spacing between the Dash 8 and 737 was therefore likely affected by incomplete appreciation of their initial spacing and speed difference.
The trainee ADC and OJTI both reported being aware that the spacing between the arriving Dash 8 and following 737 aircraft was less than the specified minimum of 5 NM by the time the Dash 8 crossed the threshold. However, the trainee ADC must have still anticipated that there was a sufficient gap at this time to allow the A330 to depart. It is likely that, having formulated a plan to allow the A330 to take-off between the Dash 8 and 737, and in the absence of knowledge about the 737 not maintaining the specified speed, the gradual reduction in spacing as the Dash 8 approached had not been enough of a prompt for the trainee ADC to challenge their commitment to the plan.
To execute the plan, the trainee ADC expedited the departure of the A330 by lining it up to hold on the runway so the crew was ready to start the take-off roll as soon as the Dash 8 was clear of the runway. The trainee ADC did not consult with the OJTI before initiating the A330 departure and there was no obligation to do so.
In any case, once the Dash 8 was clear of the runway the trainee ADC issued a clearance to the A330 for an immediate take-off, and the crew complied.
As the A330 started to roll the trainee ADC’s attention turned to the 737 on final approach, and the OJTI asked whether the runway separation standard would be met. The trainee ADC correctly assessed that the A330 might not be clear before the 737 passed over the threshold, so instructed the 737 crew to go around (conduct a missed approach) to avoid a runway loss of separation.
This was about 12 seconds after clearing the A330 for take-off. At this point, the 737 was 1.2 NM (2.2 km) from the threshold and the A330 was rolling and accelerating through 60 kt. The trainee ADC had the option to instruct the A330 crew to reject the take-off but (reasonably) wanted to avoid the risks associated with rejected take-offs.
The OJTI advised it was difficult to visually assess aircraft speed at night and there was no speed data for aircraft on the runway. Based on judgement and experience, the OJTI did not intervene and cancel the A330’s take-off clearance because it might have increased the risk to safety of the aircraft.
From that point onwards, although infringement of the runway separation standard was prevented, there was an increased potential for conflict because the MARUB SIX departure and the missed approach procedure both involved low-level right turns onto similar easterly tracks. This required controller intervention. The trainee ADC and OJTI had to maintain separation visually (at night) by judging and anticipating the three-dimensional positions, speeds and flight paths of both aircraft; this was complicated by the fact that both were climbing and turning, both at different rates.
Issues around the procedure design and procedural constraints are addressed in Air traffic management considerations.
737 flight path during missed approach
When instructed to go around (conduct a missed approach), the 737 crew was required to fly to the missed approach point and then follow the missed approach procedure for the runway 34R GLS approach unless otherwise advised by ATC. As specified on the approach chart, this was an initial track of 335° (runway bearing), then a mandatory right turn at 600 ft onto a 070° track, and climb to 2,000 ft.
As the aircraft would already be climbing before it reached the missed approach point, it would be expected that the aircraft would be above 600 ft at or soon after the missed approach point and then commence the turn. In this occurrence, however, the flight crew did not commence the turn until after this when at 1,100 ft, after they were instructed by the trainee ADC.
The 737 flight crew had an early awareness that separation from the rolling A330 would be marginal and they initiated the missed approach without delay. The initial actions were performed correctly. The crew had briefed the procedure for Sydney, which required the turn to be initiated after the landing gear and initial flap retraction, and for further flap retraction to be delayed. However, the first officer (FO) as pilot flying (PF) inadvertently followed the trained procedure for missed approaches (which was applicable to airports other than Sydney and did not involve an early turn). There were several contextual factors that likely contributed to this relatively late turn.
Missed approaches generally result in a high flight crew workload, particularly when they are manually flown like this one. Research has found that during missed approaches, there is an increase in the number of flight crew errors including flight path deviations (Dehais and others, 2017). Aspects of this missed approach that increased crew workload included a level-off altitude that was lower than typical, and the need for a turn soon after passing the missed approach point.
Another aspect of this missed approach was management of the automatic flight system. For operations at Sydney, Airservices used standard terminal arrival routes (STARs) that did not provide a continuous navigation path from the STAR to the approach. Therefore, in aircraft flight management computers (FMCs), there is a discontinuity in the route leg positions between last waypoint of the STAR and first waypoint of the runway instrument approach.
When the 737 flight crew programmed the assigned STAR and the runway 34R GLS approach they identified the FMC discontinuity. However, once the flight crew was assigned headings to intercept the IVA they did not update the FMC route legs page to have the active waypoint in front of the aircraft’s position. While there was no requirement for the flight crew to do so, this resulted in the lateral navigation (LNAV) mode not engaging during the missed approach.
The FO (as PF) saw that the LNAV mode did not automatically engage as expected when the aircraft climbed through 400 ft. Because LNAV was not engaged, there was no prompt for the FO to turn when reaching the missed approach point. The turn would normally be initiated at 600 ft after this point, but the FO was likely initially confused and distracted by the absence of LNAV, delaying the corrective action (turning manually or through the use of heading select and autopilot).
For the flight director to direct the turn the FO would have needed to select a roll mode such as HDG SEL (heading select). Because this was not done, the flight director guidance remained oriented to the runway track. For the same reason there was also no prompt to turn soon after this, when the aircraft overflew the flight management computer’s (FMC) actual pre-programmed missed approach point (incorrectly located at the runway threshold; see Runway 34R missed approach point coding).
The flight crew did not verify whether the missed approach route was being tracked in accordance with the published procedure. They were probably focussed on the aircraft’s configuration and speed, as well as the 2,000 ft level‑off altitude which they had previously identified as their main threat. The flight director guidance was commanding the FO to maintain runway track, which they followed until the trainee ADC instructed them to turn right about 15 seconds after they passed the missed approach point.
Automatic systems management and automation surprise can pose problems for flight crews. When modes are different from those expected for the flight phase or when modes are neither called out or checked, the flight path can deviate from what is expected. Distractions (such as hesitation over the misremembered procedure on the minimum altitude for flap retraction, and the navigation mode not changing as expected) probably also initially drew their attention away from the need to turn. In this context, and not yet completely certain about the required flight path, it would be reasonable to follow the flight director in the interim.
Another contextual consideration was the diagrammatic depiction of the missed approach on the approach chart. This showed a turn starting beyond the departure end of the runway rather than at or soon after the missed approach point as was probably intended. Although this diagram was not primary guidance for the missed approach procedure, and so unlikely to have contributed in this instance, it potentially provided the crew with a misleading mental model of when the turn would be expected to start.
In summary, the 737’s flight crew workload was high during the initial stages of the missed approach and the turn required by the procedure was not made until the crew were instructed by the trainee ADC. Distractions, an uncorrected route discontinuity, and potentially the depiction of the missed approach route on the approach chart well after the runway, were all potential factors.
Although the non-conforming missed approach alone did not affect the safe operation of the 737 and would not have been a concern in the absence of other traffic, the later turn positioned the 737’s flight path closer to that of the A330.
Trainee ADC response to conflict scenario
Throughout the missed approach sequence, the trainee ADC was applying visual separation. In the first phase of the missed approach, the 737 was travelling in the general direction of the tower, and it was after last light, which probably affected both controllers’ ability to visually determine the position of the 737 from the tower.
Another contextual factor was the historical variability in the location of the height-based right turn in the first part of the missed approach (Figure 15 and discussed further in Missed approach and departure procedures). This meant that the tower controllers could not develop a consistent visual reference to aid in their assessment of aircraft conformance to the runway 34R missed approach procedure (since other aircraft they saw likely turned at differing points).
In summary, it may not have been obvious at first that the 737 flight path was not conforming to the missed approach procedure.
From recent discussion of the scenario of an aircraft taking off concurrently with an aircraft going around from runway 34R, the trainee ADC was aware of the potential for compromised separation. The trainee ADC was also aware that an intervention might be required to preserve separation and that vectoring was not permitted at night below the MVA. Instead, the trainee ADC appropriately applied ‘best judgement and initiative’, which allowed controllers to work outside of prescribed actions when the safety of an aircraft may be considered to be in doubt, as in this case.
Observing that the 737 was not turning, the trainee ADC instructed the 737 crew to turn right onto a heading of 100°. This was about 9 seconds after the 737 passed through the 600 ft mandatory turn height, as described in 737 flight path during missed approach. By turning the 737 further than the default 070°, the trainee ADC was intending to direct the 737 onto a flight path that was divergent to the A330 in the process of turning to intercept the 075° radial. The trainee ADC’s likely mental model of the situation at this point is shown in Figure 16.
The trainee ADC’s instruction to the 737 to turn, soon after the aircraft passed 600 ft, was an important factor in keeping the two aircraft apart. However, in the absence of any other intervention, the instruction to turn would not prevent separation from being compromised. As the turn progressed, the 737 flight path was further to the north than the trainee ADC had anticipated due in part to the radius of turn (as a result of the 737’s increased speed since passing the missed approach point). The instruction to turn to heading 100° instead of the 070° specified by the procedure had no effect in the early part of the turn that was critical to separation.
Further, the trainee ADC did not issue the 737’s turn instruction using the phrase required for avoiding action, which would have alerted the 737 flight crew of the potential traffic conflict with the A330 and emphasised the reason for the instruction. As a result, their immediate response was not assured, and the turn was not made at the fastest possible rate. ATSB analysis indicated that a maximum-rate turn probably would have increased the minimum distance between the aircraft to about 0.55 NM (1.0 km). The trainee ADC also did not issue either flight crew with a safety alert to advise of the unsafe proximity situation.
Figure 16: Trainee ADC’s likely mental model of the approximate flight paths the aircraft were expected to take after issuing the instruction for the 737 to turn
Partial flight paths of the occurrence aircraft are shown for comparison (in faint orange and blue).
Source: Google Earth, annotated by the ATSB.
The trainee ADC’s separation model relied on the assumption that the flight path of the A330 would be further north than it was (prior to intercepting the 075 radial). The trainee ADC recalled that the A330’s turn was earlier and tighter than their recollection of other widebody jet aircraft taking off from that runway. Although that was their experience, the flight path was reasonably consistent with typical MARUB SIX departures (see Missed approach and departure procedures and Figure 15).
Although the 737 crew initiated the right turn about 6 seconds after the trainee ADC began issuing the instruction, the A330 also started to turn in accordance with the SID.
The A330 crew received an audible traffic advisory alert from the traffic collision avoidance system (TCAS) and the first officer sighted the 737. An alert was not generated by the 737 TCAS, probably because of differences in the calculations by each system. Shortly afterwards the separation between the aircraft reduced to 0.42 NM (800 m) laterally and about 508 ft vertically. This was the closest proximity during the occurrence.
As stated previously, the trainee ADC was applying visual separation in the terminal area. The Manual of air traffic services (MATS) allowed for visual separation of aircraft in the vicinity of aerodromes only when the projected flight paths of the aircraft do not conflict, with consideration of faster following aircraft, and with ‘wide margins’ when judging relative distance or height due to the possibility of visual errors. The ATSB considered that these conditions were not met, which makes the occurrence a loss of separation.
There are limitations to the human visual system at night (Gibb and others 2010). For example, in the absence of other cues, the apparent size of an object is related to its brightness rather than its image size. As a result, the judgment of distance is extremely difficult at night (Isaac and Ruitenberg 1999). The MATS stated that ‘visual determination of the relative distance of aircraft in close proximity can be in error or affected by optical illusion’.
In the context of having no time to plan for the conflict, the trainee ADC did not make a change, initially, to the flight path of the A330. Although the constraints of vectoring at night also applied to the A330, the trainee ADC had the option to instruct the A330 crew to turn to a more northerly heading. This would have reduced the risk of unsafe proximity without any significant terrain/obstacle collision risk.
About 30 seconds after assigning the initial turn instruction to the 737 crew, the trainee ADC instructed the crew to continue the right turn onto 120° to provide further separation. The 737’s heading was then passing through 022°, and with the disposition of the 2 aircraft and the A330 still turning, this instruction had no immediate effect on separation.
After a further 20 seconds and a transmission from the A330 flight crew to advise that they had passed ‘very close’ to the other aircraft, the trainee ADC instructed the A330 crew to turn left heading 100°. A left turn by the A330 at this time would have increased the gap further. In fact, this heading would have required a right turn from the A330’s current heading (about 070°), indicating that the trainee ADC thought that the A330 had turned further south than it had, and the instruction had limited effect. Nevertheless, the 737 was now ahead of the A330 and travelling faster so the spacing widened.
Following the loss of separation, the trainee ADC transferred the 737 to the approach controller without a separation standard having been established and without coordinating a transfer of separation responsibility with the approach controller. As a result, the 737 was under the control of the approach controller without a required surveillance separation standard.
On-the-job training and supervision
The trainee ADC was operating under the supervision of a qualified on-the-job training instructor (OJTI) who was responsible for the safety and efficiency of the aerodrome control function for runway 34R. Although the OJTI had the authority to override the trainee ADC, any intervention would have resulted in deferral of the check planned for the next day. In addition, and based on the trainee ADC’s recent performance, the OJTI was expecting the trainee ADC to identify and manage traffic conflicts with minimal prompting and no intervention. The trainee ADC had been operating with similar expectations.
When the trainee ADC instructed the A330 crew to line-up then cleared them for an immediate take-off, the OJTI considered the sequencing of the A330 departure was ‘ambitious’ but this was not communicated to the trainee at the time because there was a possibility the plan could work and would be an opportunity for the trainee ADC to demonstrate a solution. Once the trainee ADC instructed the 737 crew to conduct a missed approach, the OJTI was aware that the aircraft would need to be separated and prompted the trainee ADC to focus on a resolution.
The OJTI reported they would have preferred the trainee ADC to cancel the SID and provide the A330 flight crew with a heading to the right of the runway centreline (such as 030°) to resolve the compromised separation but did not communicate this to the trainee. As described above, the trainee instructed the 737 crew to turn right to heading 100°. The OJTI recalled understanding the trainee’s logic for the instructions, but would not have chosen this strategy to resolve the situation and believed more azimuth could have been provided to the 737.
There were differing understandings between the trainee ADC and OJTI in managing the compromised separation situation. Communications effectiveness depends on shared assumptions, a shared mental model or shared situation awareness (Salas and others 1995). Research in mental models and shared awareness has found that information that is shared in strategic mental models allows team members to have common explanations of the meaning of task cues, make a compatible assessment of the situation, and form common expectations of additional task and information requirements. This shared level of situational awareness allows them to take appropriate actions, whether gathering additional information critical to making a decision, or implementing a particular procedure (Salas and others 1994).
As part of on-the-job instruction of Airservices controllers, a prompting hierarchy is used to guide the performance of the trainee. The purpose of the prompting hierarchy is to assist with determining the trainee’s readiness for a final check with the underlying premise that, in an air traffic control context, the OJTI is maintaining the traffic picture and commences prompting once a potential safety occurrence is identified, and they can then be certain that the trainee has identified the issue, and that the solution is satisfactory.
In this case, after the A330 was cleared for take-off, the OJTI asked the trainee ADC whether the runway separation standard would be met. This successfully prompted the trainee ADC to reassess the spacing between the two aircraft and led to the instruction for the 737 to go around.
The OJTI then prompted the trainee ADC to resolve the separation issue by directing the trainee’s attention to resolving the situation, asking ‘what are we going to do’ and to provide the aircraft with more horizontal separation. From this communication, the trainee ADC likely believed they shared the same understanding of the situation and had chosen the same solution, or at least a feasible one.
However, the OJTI did not use the higher levels to communicate to the trainee ADC the urgency of the situation, did not prompt the trainee ADC to share their mental model of the emerging traffic picture or confirm that the trainee ADC was projecting the flight paths accurately. This also meant that the trainee ADC may not have had sufficient prompts to question their interpretation of the developing situation. It is likely the OJTI was cognisant that the trainee ADC needed to demonstrate competence without intervention, and was reluctant to provide additional instructions to manage and recover from the compromised separation situation effectively.
The OJTI was monitoring the aircraft visually and was confident that they would not collide. However, for the separation of two aircraft at night, it is desirable to have a wide buffer to account for potential errors in judging and predicting flight paths, and the two controllers allowed the distance between the aircraft to decrease without further effective intervention.
As the situation developed and the A330 began turning towards the 737, the controllers’ ability to maintain visual separation began to be compromised and the controllers probably misjudged the proximity and direction of the two projected flight paths. This limitation may be illustrated by the trainee ADC’s instruction for the A330 to turn ‘left’ to heading 100°. With both aircraft heading away from the tower at this point, a left turn would have been an obvious solution to separate them, but this instruction indicated that the trainee ADC’s understanding of at least the A330’s flight path was erroneous. The error was not corrected by the OJTI.
Although the gap was widening by this point, it meant the A330 continued to turn towards the 737 instead of away as intended. While the OJTI’s judgement that the 737 would pull ahead of the A330 in the turn was correct, the separation by the time the flight paths crossed was still only about 0.8 NM (1.5 km) and any unanticipated variation in speeds or flight paths could have resulted in it reducing further.
Tower shift manager supervision
In the time leading up to and immediately following the occurrence, the tower shift manager (TSM) was engaged in supporting another controller to reduce their workload. After the 737 crew was instructed to go-around, the OJTI wanted to notify the TSM in accordance with accepted practice but could not leave the trainee ADC unsupervised, and could not gain the TSM’s attention.
As a result, the TSM was not aware of the missed approach and separation issue until after the event. This limited the effectiveness of the TSM role as a risk control for the ADC controller position as they could not provide operational supervision to tactically manage the risk.
Air traffic management considerations
Missed approach and departure procedures
Airservices is required to design procedures in accordance with international technical standards and the primary principle of safety along with other considerations such as noise, environment, and flight operations and restrictions imposed through the Ministerial direction and Long Term Operating Plan. For safety assurance, segregation of aircraft flight paths reduces complexity and workload for pilots and controllers.
Although each instrument procedure separately met regulatory design requirements, the concurrent use of the MARUB SIX SID and the runway 34R missed approach procedure could result in converging flight paths, depending on the timing and radius of each turn as well as the relative speeds (Figure 17).
Figure 17: Potential aircraft tracks for runway 34R missed approaches compared with tracks following the MARUB SIX SID
Standard-rate turns are taken at 25° bank. All turns in blue, orange and white are shown with a constant 0.8-NM radius, which is a standard-rate turn at 160 kt, or a 1.4-NM radius, which is a standard-rate turn at 210 kt. The red turn has a constant 1.4-NM radius. Partial flight paths of the occurrence aircraft are shown for comparison (in faint orange and blue).
Source: Google Earth, annotated by the ATSB.
Generally, aircraft conducting a missed approach are required to turn once climbing through 600 ft once at or past the missed approach point. The turn point could change depending on the climb gradient and the location and height at which a missed approach is initiated and there was no clear limit on the extent to which an aircraft could continue on the runway heading before initiating the turn.
Missed approaches that commence the turn near the 737’s missed approach point would generally not come as close to the departure paths as in this occurrence, albeit still closer than the 3‑NM (5.6 km) separation standard (the blue track in Figure 17). However, this would require a missed approach to be initiated early enough before that point for the aircraft to have reached 600 ft. A more serious compromise could occur if the missed approach turn is initiated well after the missed approach point, and particularly if the missed approach turn is also wider than the other aircraft’s departure turn (for example taken at a higher speed). Both of these scenarios occurred in this case.
In general, the missed approach procedure was more likely to result in a wider turn than an aircraft on the MARUB SIX SID, because:
an aircraft conducting a missed approach was more likely to have a higher speed, because it would start accelerating from the landing speed and from an earlier point
there was no minimum bank angle required for the missed approach turn, whereas the MARUB SIX SID turn required a minimum 25° bank angle.
Recorded data indicated that the majority of missed approaches from runway 34R followed a similar path to that of the 737, either intersecting with or crossing the typical MARUB SIX SID track (Figure 15). Although there was some variation in where the missed approach turns began, most appeared to have been initiated from above the runway, as the 737 did in this occurrence. These tracks either merged with or came close to the MARUB SIX SID radial or crossed the typical departure track heading south-east to meet the MARUB radial.
Conversely, there was little variation in the MARUB SIX SID tracks, with most aircraft commencing the turn before crossing runway 07/25 and following a similar flight path to the A330 in this occurrence. The ATSB estimated the average track to intercept the MARUB radial was about 100°, resulting in the tracks converging with the runway 34R missed approach heading (070°) at a typical angle of 30°.
As stated previously, the extent of conflict depends on a number of factors. Approach spacing appears to be one of the most important. Air traffic controllers can allow for this by ensuring sufficient initial spacing between the aircraft to reduce the likelihood of a missed approach to prevent a runway separation issue and to reduce the potential for conflict if a missed approach occurs for other reasons. However, if approach spacing is reduced below the minimum, as it was in this instance and as Airservices reported was ‘habituated’ among Sydney controllers, a controller might judge that there is enough spacing to allow a third aircraft to depart between them, in which case:
the risk of a missed approach is increased due to the traffic ahead and
the risk of the runway 34R missed approach path then coming into conflict with the third (departing) aircraft on the MARUB SIX SID also increases due to the initial proximity of the following aircraft.
Therefore, spacing should only be reduced if the aircraft can still be kept apart with minimal, or no, intervention.
In addition, the Flight Safety Foundation (Blajev and Curtis, 2017) recommended avoiding missed approach procedures that had a low first stop altitude and an early turn. These characteristics were both present in the runway 34R missed approach procedure and probably contributed to the 737 flight crew’s workload in this occurrence, increasing the likelihood of a more serious loss of separation.
It is important to note that there were constraints on the manner in which Airservices were permitted to design the departure and missed approach procedures, particularly the Long Term Operating Plan and Ministerial direction associated with it. However, these documents also emphasised that ‘the safety of aviation operations is not to be compromised’ and this occurrence is an indicator that the current departure and missed approach procedures do compromise safety, at least to some extent.
Airservices stated there had not been an occurrence history that indicated systemic risk control shortfalls with the management of MARUB SIX SID and runway 34R missed approach scenarios to indicate that the level of risk was not as low as reasonably practicable. Although it was anecdotally reported that controller intervention due to the potential for conflict between the MARUB SIX SID and runway 34R missed approach procedures occurred 10 to 20 times in a year, and controllers interviewed by the ATSB generally recognised it as a known hazard, a search of the ATSB database found that no comparable occurrences had been reported. This would not account for some other events, such as those that do not result in a loss of separation (due to controller intervention) but were still a separation concern. Also, it was not possible to obtain detailed data on the level of controller intervention, if any, that resulted. Furthermore, low-incidence hazards are still important to control when there is a potential for a catastrophic consequence.
Controller options for mitigating loss of separation
As a result of the potential for conflict with the concurrent use of the MARUB SIX SID and the runway 34R missed approach procedure, a controller needed to modify the flight path of one or both aircraft to maintain separation. The only resolution in this situation would be to issue headings and/or altitude instructions to one of the aircraft (that is, vector the aircraft) to establish divergent tracks and/or altitude spacing. During the occurrence the trainee ADC and the OJTI formulated separate resolution plans, both of which required aircraft to be vectored at low level.
However, this could be problematic at night because the MATS only allowed vectoring below the MVA in daylight. In daytime, vectoring at low altitudes was permitted because flight crews could visually maintain adequate height to avoid ground and obstacle collisions. To do this, controllers could assign terrain clearance responsibility to the flight crews.
Controllers interviewed by the ATSB stated that in line with the requirement for controllers to provide a duty of care in an unsafe situation, their professional judgement was that, when faced with this time- and safety-critical conflict situation, the least-risk option to aircraft was to issue vectors below MVA at night and issue a safety alert for terrain to the flight crew. These controllers were aware this was not in accordance with the MATS but commented that it had become a normalised solution to the hazard.
In the absence of effective, compliant options, these controllers have needed to break a rule under the cover of a general allowance to apply their ‘best judgement and initiative’ to ensure safety. Although the existence of this type of rule is appropriate and allows controllers to manage unforeseen situations using their initiative and experience, this type of rule should not be applied as a normalised solution. Instead, the underlying reasons for conflict should be removed (so that the situation does not, or is very unlikely to, arise) or controllers should be provided with compliant options to resolve them. If vectoring below the MVA is a normalised solution to a known, recurring problem, it needs to be effectively managed and controlled by Airservices at a systemic level.
In 2015, CASA advised Airservices that the air traffic management system should not rely, as a primary means of defence, on vectoring or heading changes below the MVA at night. However, the Airservices standardisation directive reiterating limitations on vectoring at night indicates that this was a tactic that controllers continued to employ, and that Airservices was aware of it. The underlying reasons for controllers to breach this requirement were apparently not identified and addressed, but likely included situations where separation was (or was going to be) compromised and controllers needed to intervene. These situations likely included the concurrent use of the MARUB SIX SID and runway 34R missed approach procedures.
A broadly similar issue had been addressed at Melbourne Airport in 2016 in response to a loss of separation involving a missed approach at night. The ATSB investigation identified that ‘in the event of a simultaneous go-around at night during LAHSO [land and hold short operations] at Melbourne Airport, there was no safe option available for air traffic controllers to establish a separation standard and to ensure a collision did not occur when aircraft were below the minimum vector altitude.’ In response to this occurrence, Airservices implemented strategies (permitted by CASA exemption) that permitted terrain clearance to be maintained when vectoring aircraft below the MVA at night, including controller training and the implementation of a safe sector.
Although related issues existed elsewhere, these safety actions only applied at Melbourne Airport and only under specific circumstances (during LAHSO operations at night).
Safety risk management
According to Airservices, the MARUB SIX SID had been published and in operation since about 1997. As discussed above, the issue of the flight path design and reduced separation assurance between the MARUB SID and runway 34R missed approach procedures was generally recognised among Airservices controllers. This is consistent with this trainee ADC having discussed it with at least 2 trainers.
Airservices considered the risk to be effectively managed. However, as noted in previous sections, the ATSB identified a number of limitations with the management of risk for operations involving conflicts between aircraft on the MARUB SIX SID and the runway 34R missed approach. Accordingly, the investigation considered potential reasons why these problems existed and had not been addressed.
Airservices identified and managed risk through operational risk assessments (ORA), and had an ORA specifically for Sydney airport. The ORA identified a mid-air collision as a threat; however, it mostly did not list specific threat scenarios such as the potential conflict between the MARUB SIX SID and the runway 34R missed approach procedure. This suggests that any risk assessment for this scenario, and others, were not recorded and it was not possible to evaluate their validity.
The ATSB found that the generalised ORA defensive barriers had limited effectiveness in addressing risk. Specifically:
Supervision: During normal operations, the Sydney tower shift manager rosters undertook non‑supervisory tasks that restricted their ability to maintain direct supervision of the operating environment and therefore did not ensure the defensive barrier was available.
Compromised separation rules and procedures: Airservices did not have a prescribed procedure or training for managing compromised separation recovery when the aircraft was below MVA at night. In addition, a standardisation directive to controllers prohibited them from vectoring aircraft below the MVA at night.
Safety alerts: Safety alerts rely on the timely recognition and memory by the controller. In this occurrence, no safety alert for traffic proximity or terrain was issued by any controller to flight crew.
Pilot action: the TCAS traffic advisory (TA) and resolution advisory (RA) functions are inhibited at low altitudes, and there are limitations on the ability of pilots to see and manoeuvre to avoid one another at low heights, at night or in instrument conditions. In this case, the 737 flight crew had no knowledge of the intended departure tracking of the A330 via the MARUB SID and the aircraft attitude during the missed approach prevented both pilots from sighting the A330. Meanwhile, the A330 FO was only able to see the 737 when looking back during the turn after a TCAS TA had already activated, and the A330 captain would not have been able to see the other aircraft until after the conflict began resolving.
Previous ATSB and Airservices investigations had identified related safety issues at other locations (notably Melbourne and Adelaide) including scenarios that involve vectoring below MVA at night, compromised separation procedures, and controller training.
In November 2015, CASA wrote to Airservices regarding operations at Melbourne Airport, expressing ongoing concern with a number of issues. Some of these were relevant to Sydney operations and the scenarios discussed in the current report. While safety action was undertaken by Airservices and CASA at other Australian airports to manage local issues, the lessons were not applied on a national level, and not at Sydney Airport.
Airservices likely would have identified suitable risk controls for the MARUB SIX SID and runway 34R missed approach conflict, had it:
broadened the scope of lessons learned at other airports
considered the effects of routine controller non-compliance in the application of arrival spacing which increased the risk of missed approaches on runway 34R
identified variations in tracks of aircraft on the runway 34R missed approach including more northerly flight paths which increased the risk of conflict with aircraft departing on the MARUB SIX SID
considered the reasons for controllers knowingly making a non-compliant action to vector aircraft below the MVA at night to prevent a more serious loss of separation (the prevalence of which prompted a directive to controllers reiterating that this was not permitted)
formally identified and managed the risk.
This could have led to the identification of risk control and mitigation shortfalls and timely action taken to reduce risk. Through proactive and predictive hazard identification processes involving specific scenarios, it is probable that at least some of the risk controls associated with the MARUB SIX SID and runway 34R missed approach conflicts would have been improved, particularly in terms of compromised separation procedures at night.
Tower controller training and assessing
Key aspects of this occurrence, including sequencing of arriving and departing traffic and recovery from compromised separation, were taught to controllers through classroom instruction and on‑the-job training, and ultimately checked. Although this trainee ADC’s training was reported to have been somewhat disjointed and lacking continuity of trainers (likely as a consequence of trainee or OJTI unavailability), there was no evidence to indicate any deficiencies with this training and the trainee ADC had demonstrated capability to manage traffic without missed approaches.
The trainee ADC had completed the required compromised separation training for Sydney Airport and was expected to be aware of the higher risk scenarios, recognise potential conflicts, and issue instructions for deconfliction and safety alerts to flight crews. Within the aviation industry, incorporating scenarios within training has been used extensively with flight crew (Fowlkes and others 1998). The potential for conflict between the MARUB SIX SID and runway 34R missed approach procedures had been discussed in the trainee ADC’s check about 2 weeks before the occurrence and reviewed with the OJTI prior to the occurrence.
Although the trainee ADC had been made aware of this potential conflict and challenge to keep aircraft separated, especially below the MVA at night, the delivery of this information relied on the individual trainers and, to some extent, whether relevant scenarios arose during training. This meant that trainees would not necessarily be exposed to this scenario or others requiring aircraft to be vectored when below the MVA at night. While it is not possible to present every conceivable variety of scenario, controllers should be presented with scenarios that they have a realistic chance of encountering and presents a significant risk, especially if the only option for resolution is non-compliant.
There are a number of potential benefits in providing tower-specific compromised separation simulator training. It could provide a valuable opportunity for controllers to apply and trial compromised separation recovery techniques, in a controlled training environment, for the airspace on which they are endorsed, and with aircraft types with which they are familiar.
In summary, although Airservices provided compromised separation recovery training for Sydney tower controllers, this did not include scenarios involving aircraft below the minimum vector altitude at night.
Runway 34R missed approach point coding
Following the occurrence, Qantas conducted a review of the 737 FMC database for Sydney runway 34R approaches. The review determined that in all but one instance, the location of the missed approach point was at the runway threshold, the same location as the published RW34R waypoint. This did not conform to the published instrument approach procedures, where the missed approach point would be along the approach path before the runway.
Detection of this discrepancy would only be highlighted to flight crew after a thorough check of the FMC data compared with the missed approach point as published on the chart for the approach being flown.
In the case of the runway 34R approach, the erroneous waypoint location could lead flight crew into delaying the commencement of the right turn (if already at 600 ft) by up to 0.5 NM for the GLS approach.
In this instance, given LNAV did not automatically engage, displacement of the missed approach point did not contribute to the occurrence. It did, however, have the potential to confuse the flight crew and might explain some of the non-conforming missed approach paths recorded by Airservices.
Findings
ATSB investigation report findings focus on safety factors (that is, events and conditions that increase risk). Safety factors include ‘contributing factors’ and ‘other factors that increased risk’ (that is, factors that did not meet the definition of a contributing factor for this occurrence but were still considered important to include in the report for the purpose of increasing awareness and enhancing safety). In addition ‘other findings’ may be included to provide important information about topics other than safety factors.
Safety issues are highlighted in bold to emphasise their importance. A safety issue is a safety factor that (a) can reasonably be regarded as having the potential to adversely affect the safety of future operations, and (b) is a characteristic of an organisation or a system, rather than a characteristic of a specific individual, or characteristic of an operating environment at a specific point in time.
These findings should not be read as apportioning blame or liability to any particular organisation or individual.
From the evidence available, the following findings are made with respect to the close proximity involving Boeing 737 VH-VZO and Airbus A330 VH-EBJ at Sydney Airport, New South Wales, on 5 August 2019.
Contributing factors
The 737 flight crew did not maintain the aircraft’s speed within the specified range during the first part of final approach, and did not advise air traffic control of this non-compliance as required by the approach procedure.
The spacing between the landing Dash 8 and the following 737 on approach reduced to less than 5 NM without the required coordination between the approach controller and aerodrome controller position prior to transfer.
The trainee aerodrome controller’s judgement of the spacing between the Dash 8 and 737 was likely affected by incomplete appreciation of their initial spacing and speed difference. As a result, the A330 was instructed to line up and was then issued a clearance for an immediate take‑off without sufficient spacing to prevent a runway separation issue or go-around. Because the respective departure and missed approach procedures both involved climbing from a low level and tracking to the east, this led to a compromised separation situation.
After initiating the missed approach, the 737 flight crew inadvertently continued on the runway heading above the mandatory 600 ft turn beyond the missed approach point, and did not turn until instructed by the trainee aerodrome controller. As a consequence, the flight path of the 737 was closer to that of the A330’s departure track than it would have been if the turn had been commenced at the required height.
Although the trainee aerodrome controller’s instruction for the 737 to initiate the turn reduced the collision risk, the extension of the turn to 100° did not mitigate the short-term effect of the delayed and relatively large-radius turn of the 737, or modify the A330’s projected flight path. Further, the aerodrome controller did not issue the 737’s turn instruction using the phrase required for avoiding action or issue a safety alert to either flight crew.
After the missed approach was initiated, the on-the-job training instructor’s prompts to the trainee aerodrome controller were at the lower level of the prompting hierarchy and did not reflect the potential criticality of the situation or elicit an effective response.
The Airservices Australia MARUB SIX standard instrument departure and the missed approach procedure for runway 34R directed aircraft onto outbound tracks that did not sufficiently assure separation between aircraft following the procedures concurrently. (Safety issue)
Although Airservices Australia applied operational risk assessments to high-level threats, it did not formally assess and manage the risk of specific threat scenarios. As a likely result, Airservices did not formally identify and risk manage the threat of separate aircraft concurrently carrying out the MARUB SIX standard instrument departure and a missed approach from runway 34R at Sydney Airport, even though it had been a known issue among controllers generally. (Safety issue)
Other factors that increased risk
The tower shift manager (TSM) was fully engaged in a controller function and was not aware of the missed approach and development of the compromised separation until after the event. This negated the TSM role as a risk control and increased the risk that a compromised separation would not be managed effectively.
The missed approach points pre-programmed into the flight management computer of Qantas 737s were incorrect for 8 different approaches to Sydney runway 34R. The missed approach points were located over the runway threshold, which was not consistent with the locations of the missed approach points as determined by the relevant instrument approach charts.
Airservices Australia did not have procedural controls to separate aircraft concurrently carrying out the MARUB SIX standard instrument departure and a missed approach from runway 34R at Sydney Airport while below the minimum vector altitude at night. (Safety issue)
Airservices Australia’s compromised separation recovery training for Sydney tower controllers did not include scenarios involving aircraft below the minimum vector altitude at night. (Safety issue)
After the occurrence, the trainee aerodrome controller transferred the 737 to the approach controller without the separation standard being met and without coordination.
Safety issues and actions
Central to the ATSB’s investigation of transport safety matters is the early identification of safety issues. The ATSB expects relevant organisations will address all safety issues an investigation identifies.
Depending on the level of risk of a safety issue, the extent of corrective action taken by the relevant organisation(s), or the desirability of directing a broad safety message to the aviation industry, the ATSB may issue a formal safety recommendation or safety advisory notice as part of the final report.
All of the directly involved parties are invited to provide submissions to this draft report. As part of that process, each organisation is asked to communicate what safety actions, if any, they have carried out or are planning to carry out in relation to each safety issue relevant to their organisation.
Descriptions of each safety issue, and any associated safety recommendations, are detailed below. Click the link to read the full safety issue description, including the issue status and any safety action/s taken. Safety issues and actions are updated on this website when safety issue owners provide further information concerning the implementation of safety action.
Safety issue description: The Airservices Australia MARUB SIX standard instrument departure and the missed approach procedure for runway 34R directed aircraft onto outbound tracks that did not sufficiently assure separation between aircraft following the procedures concurrently.
Safety issue description: Although Airservices Australia applied operational risk assessments to high-level threats, it did not formally assess and manage the risk of specific threat scenarios. As a likely result, Airservices did not formally identify and risk manage the threat of separate aircraft concurrently carrying out the MARUB SIX standard instrument departure and a missed approach from runway 34R at Sydney Airport, even though it had been a known issue among controllers generally.
Absence of procedural controls to separate aircraft below the minimum vector altitude at night when on identified conflicting flight paths
Safety issue description: Airservices Australia did not have procedural controls to separate aircraft concurrently carrying out the MARUB SIX standard instrument departure and a missed approach from runway 34R at Sydney Airport while below the minimum vector altitude at night.
Safety issue description: Airservices Australia’s compromised separation recovery training for Sydney tower controllers did not include scenarios involving aircraft below the minimum vector altitude at night.
Safety action not associated with an identified safety issue
Whether or not the ATSB identifies safety issues in the course of an investigation, relevant organisations may proactively initiate safety action in order to reduce their safety risk. All of the directly involved parties are invited to provide submissions to this draft report. As part of that process, each organisation is asked to communicate what safety actions, if any, they have carried out to reduce the risk associated with this type of occurrences in the future. The ATSB has so far been advised of the following proactive safety action in response to this occurrence.
Additional safety action by Airservices Australia
Airservices advised that it had or would conduct the following safety actions in response to this occurrence:
Standardisation Directive (DIR_19_0039) issued to ensure controllers adhere to the agreed spacing for arriving aircraft as detailed in the Sydney Operational Procedure (LoA_3183) and the requirement to coordinate any reduction to these distances.
Establish an operations manager-led focus group to facilitate joint discussion between the Sydney Tower and Terminal check and standardisation supervisors to foster an increased understanding of shared risk factors.
Group circular reinforcing the arrival and departure spacing requirements, expectations and procedure design objectives.
Issue a safety alert to airlines on the importance of adherence to published missed approaches to increase the understanding of shared risk factors.
Temporary Local Instruction (TLI_19_0340) issued to advise TSMs [tower shift managers] to operate as a stand-alone role and only combine with other roles following a risk assessment.
Redesign the Sydney TSM roster to allocate stand-alone TSM during core hours.
Additional safety action by Qantas Airways Limited
In response to the occurrence, Qantas:
promulgated communications to flight crew ‘highlighting the event and the importance of approach speeds and the missed approach point’
updated its 737 flight management computer missed approach point coding
incorporated missed approaches from Sydney Airport runway 34R in its cyclic training sessions
tested and confirmed flight management system transition to lateral navigation (LNAV) during different approach types to Sydney Airport runway 34R
updated its flight data analysis program to:
monitor approach speeds at key points for compliance with approach speed requirements
record traffic collision avoidance system (TCAS) traffic advisory (TA) data in addition to resolution advisory (RA) data.
Glossary
ADC
Aerodrome controller – east
AFDS
Autopilot flight director system
AGL
Above ground level
AIP
Aeronautical information publication
ATC
Air traffic control
ATPL
Air transport pilot licence
ATS
Air traffic services
CASA
Civil Aviation Safety Authority
CASR
Civil Aviation Safety Regulations
CIRRIS
Corporate Integrated Reporting and Risk Information System (Airservices)
CPA
Closest point of approach
CVR
Cockpit voice recorder
ERSA
En route supplement Australia
FAA
Federal Aviation Administration (United States)
FAM
Flight administration manual
FCOM
Flight crew operations manual
FCTM
Flight crew training manual
FDR
Flight data recorder
FL
Flight level
FMA
Flight mode annunciation
FMC
Flight management computer
FO
First officer
GA
Go-around (missed approach)
GBAS
Ground-based augmentation system
GLS
Ground-based augmentation system landing system
HDG SEL
Heading select
ICAO
International Civil Aviation Organization
ILS
Instrument landing system
IVA
Independent visual approach
LAHSO
Land and hold short operations
LNAV
Lateral navigation
LOC
Localiser
LOS
Loss of separation
LOSA
Loss of separation assurance
MATS
Manual of air traffic standards
MVA
Minimum vectoring altitude
NTSB
National Transportation Safety Board (United States)
OJTI
On-the-job training instructor
ORA
Operational risk assessment
PF
Pilot flying
PM
Pilot monitoring
RA
Resolution advisory
RNAV
Area navigation
RTCC
Radar terrain clearance chart
SARP
Standards and recommended practices
SID
Standard instrument departure
SMC
Surface movement control
SMS
Safety management system
STAR
Standard instrument arrival
TA
Traffic advisory
TAU
Time to co-altitude
TCAS
Traffic collision advisory system
TCU
Terminal control unit
TOGA or TO/GA
Take-off/go-around
TSM
Tower shift manager
VMC
Visual meteorological conditions
Sources and submissions
Sources of information
The sources of information during the investigation included:
captain and first officer of the 737
captain and first officer of the A330
trainee aerodrome controller
on-the-job training instructor
director controller
tower shift manager
Qantas Airways
Civil Aviation Safety Authority
Airservices Australia
recorded data from the 737 and A330.
References
Blajev, T and Curtis, W (2017) Go-Around Decision Making and Execution Project: Final Report to Flight Safety Foundation. Flight Safety Foundation.
Dehais, F, Behrend, J, Peysakhovich, V, Causse, M and Wickens, CD (2017) Pilot flying and pilot monitoring’s aircraft state awareness during go-around execution in aviation: A behavioral and eye tracking study, The International Journal of Aerospace Psychology, 27(1-2): 15-28.
Fowlkes, J, Dwyer, DJ, Oser, RL and Salas, E (1998) Event-based approach to training (EBAT), The International Journal of Aviation Psychology, 8(3): pp. 209-221.
Gibb, R, Gray, R and Scharff, L (2010) Aviation visual perception, Routledge, London.
Isaac AR and Ruitenberg B (1999) Air traffic control: human performance factors, Routledge, London.
Submissions
Under section 26 of the Transport Safety Investigation Act 2003, the ATSB may provide a draft report, on a confidential basis, to any person whom the ATSB considers appropriate. That section allows a person receiving a draft report to make submissions to the ATSB about the draft report.
A draft of this report was provided to the following directly involved parties:
captain and first officer of the 737
captain and first officer of the A330
trainee aerodrome controller
on-the-job training instructor
director controller
tower shift manager
Qantas Airways
Civil Aviation Safety Authority
Airservices Australia.
Submissions were received from:
the captain of the A330
Qantas Airways
Civil Aviation Safety Authority
Airservices Australia.
The submissions were reviewed and, where considered appropriate, the text of the report was amended accordingly.
Purpose of safety investigations
The objective of a safety investigation is to enhance transport safety. This is done through:
identifying safety issues and facilitating safety action to address those issues
providing information about occurrences and their associated safety factors to facilitate learning within the transport industry.
It is not a function of the ATSB to apportion blame or provide a means for determining liability. At the same time, an investigation report must include factual material of sufficient weight to support the analysis and findings. At all times the ATSB endeavours to balance the use of material that could imply adverse comment with the need to properly explain what happened, and why, in a fair and unbiased manner. The ATSB does not investigate for the purpose of taking administrative, regulatory or criminal action.
Terminology
An explanation of terminology used in ATSB investigation reports is available here. This includes terms such as occurrence, contributing factor, other factor that increased risk, and safety issue.
Publishing information
Released in accordance with section 25 of the Transport Safety Investigation Act 2003
Ownership of intellectual property rights in this publication
Unless otherwise noted, copyright (and any other intellectual property rights, if any) in this report publication is owned by the Commonwealth of Australia.
Creative Commons licence
With the exception of the Coat of Arms, ATSB logo, and photos and graphics in which a third party holds copyright, this publication is licensed under a Creative Commons Attribution 3.0 Australia licence.
Creative Commons Attribution 3.0 Australia Licence is a standard form licence agreement that allows you to copy, distribute, transmit and adapt this publication provided that you attribute the work.
The ATSB’s preference is that you attribute this publication (and any material sourced from it) using the following wording: Source: Australian Transport Safety Bureau
Copyright in material obtained from other agencies, private individuals or organisations, belongs to those agencies, individuals or organisations. Where you wish to use their material, you will need to contact them directly.
[1] Technically, this was before the end of nautical twilight. At this time in the absence of moonlight, artificial lighting or adverse atmospheric conditions, it is dark for normal practical purposes. There was a quarter moon to the north-west.
[2] The approach controller was part of the terminal control unit (TCU) that managed the terminal control area.
[3] Pilot Flying (PF) and Pilot Monitoring (PM): procedurally assigned roles with specifically assigned duties at specific stages of a flight. The PF does most of the flying, except in defined circumstances; such as planning for descent, approach and landing. The PM carries out support duties and monitors the PF’s actions and the aircraft’s flight path.
[4] In this report, bearings are magnetic. At Sydney in 2019, true bearings are about 13° higher than magnetic bearings; for example, 335° magnetic is 348° true.
[6] Ground Based Augmentation System (GBAS), is a satellite-based precision landing system and is recognised by ICAO as a potential future replacement for current instrument landing systems (ILS). The system uses GPS signals to provide aircraft with precise positioning guidance during the final stages of an approach, both horizontal and vertical, which is especially critical during the landing phase of flight.
[7] Decision altitude (DA): a specified altitude in an instrument approach operation at which a missed approach must be initiated if the required visual reference to continue the approach has not been established. The point at which this occurs is known as the missed approach point. The GLS runway 34R approach chart specified 2 DAs according to aircraft performance. For this operation, the applicable DA was 220 ft.
[9] The flight director generates pitch and roll indications and commands to maintain the desired flight path, either through visually guiding the flight crew’s manual control inputs or commanding manoeuvres through the autopilot.
[10] This radial passes about 0.7 NM past the northern threshold of runway 34R and almost crosses the intersection of runway 16R/34L and runway 07/25.
[11] Image sourced from Airservices PC Replay reproduction tool and modified for display purposes. It does not necessarily reflect the screen viewed by the controllers during the occurrence. The separation measurement can be applied at any time by a controller and was added to the replay as an example. There are also symbols on the display background that provide distance references on approach.
[12] The approach reference speed (Vref) was 144 kt; the flight crew selected 149 kt as the approach speed (Vapp).
[17] Controllers were not permitted to issue a ‘track extended centreline’ instruction to aircraft departing runway 34R.
[18] Traffic advisory aural annunciations are inhibited when the aircraft is less than 500 ft (+/- 100 ft) above ground level. The inhibit status was recorded, and the annunciation occurred about 6 seconds after the inhibit ceased to apply.
[19] The ATSB calculated that had the 737 made the same turn but commencing at the missed approach point, and with both flight paths otherwise identical, the minimum separation would have been about 1.4 NM (2.6 km).
[20] The applicable standard was either 3 NM (5.6 km) horizontal separation or 1,000 ft vertical separation.
[21] MATS is a joint document of Defence and Airservices and is based on the rules published in Civil Aviation Safety Regulations Part 172 – Manual of Standards and International Civil Aviation Organization standards and recommended practices, combined with rules specified by Airservices and Defence.
[23] Sydney Operational Procedures Letter of Agreement (LoA_3183), version 32, effective 8 August 2019.
[24] The terminal control unit provides air traffic services within the terminal control area.
[25] Wake turbulence: turbulence from wing tip vortices that result from the creation of lift. Those from large, heavy aircraft are very powerful and persistent, and are capable of causing control difficulties for smaller aircraft either following or below.
[27] Airservices Australia. The Long Term Operating Plan for Sydney (Kingsford Smith) Airport and Associated Airspace, 1996. Available at https://sacf.infrastructure.gov.au/ltop.
[29] Corporate integrated reporting and risk information system. The system Airservices uses to capture safety, environment and risk management information, including occurrences.
[30] Loss of separation and radar vectors below minimum vectoring altitude involving Saab 340B, VH‑OLL, Boeing 737, VH‑YVC, and Airbus A320, VH-VNH near Adelaide, South Australia on 18 May 2015 (AO-2015-054).
[31] Unsafe proximity and radar vector below minimum vector altitude involving a Boeing 777-31HER, A6-EBU, and two 737-838s, VH-VXS and VH-VYE, Melbourne Airport, Victoria, on 5 July 2015 (AO-2015-084).
[32] Federal Aviation Administration (2011). Introduction to TCAS II, version 7.1.
This preliminary report details factual information established in the investigation’s early evidence collection phase and has been prepared to provide timely information to the industry and public. Preliminary reports contain no analysis or findings, which will be detailed in the investigation’s final report. The information contained in this preliminary report is released in accordance with section 25 of the Transport Safety Investigation Act 2003.
Sequence of events
On the night of 5 August 2019, at 1831:45 Eastern Standard Time[1], an Airbus A330-300 (A330) aircraft, registered VH-EBJ and operated by Qantas Airways, was cleared by air traffic control (ATC) for take-off from runway 34 right (34R) at Sydney Airport, New South Wales. At that time, a Boeing 737-800 (737) aircraft, registered VH‑VZO and operated by Qantas Airways, was on final approach to the same runway.
A trainee controller was operating the Sydney aerodrome controller east (ADC-E) ATC position, under the supervision of an on-the-job training instructor (OJTI).
The ADC-E controller assessed that there would be insufficient runway spacing between the aircraft and instructed the 737 flight crew to ‘go around’. As the 737 flight crew conducted the missed approach, a loss of separation occurred between their aircraft and the departing A330. Flight data showed that separation between the aircraft reduced to about 0.43 NM laterally and about 500 ft vertically (Figure 1).
Figure 1: A330 and 737 flight paths and indication of the area of minimum separation
Source: Google earth overlaid with Qantas Airways flight data. Annotated by ATSB
The ADC-E controller reported that he had both aircraft in sight. In an attempt to increase separation between the two aircraft, he instructed the 737 flight crew to turn further right. The 737 was then at about 980 ft, which was below the minimum vectoring altitude (at night). As both aircraft converged, the A330 flight crew received a traffic advisory alert from their aircraft’s airborne collision avoidance system (ACAS). The A330 first officer, who was pilot flying,[2] then saw the 737 in close proximity and, in response, reduced the aircraft’s angle of bank to reduce the turn towards the 737. The captain of the A330 made a radio transmission to advise the ADC-E controller that it was ‘very close’. The controller then issued an instruction to the A330 flight crew to turn left.
The A330 climbed to 5,000 ft and continued to Melbourne without further incident. The 737 climbed to 3,000 ft and was issued radar vectors for a second approach to runway 34R. It landed without further incident a short time later.
Table 1 provides a more detailed summary of the sequence of events.
Table 1: Summary of key events
Time
Event
1831:04
The ADC-E instructed the A330 flight crew to line up runway 34R. The 737 was on final approach at about 2.8 NM.
1831:10
The ADC-E instructed the 737 flight crew to maintain minimum speed. The 737 flight crew responded that they were already at minimum speed.
1831:21
The ADC-E instructed the A330 to expedite lining up and to be ready for an immediate take-off. The ADC‑E was waiting for a turboprop aircraft, which had just landed on runway 34R, to taxi clear of the runway.
1831:45
Once the turboprop aircraft was clear of runway 34R, ADC-E cleared the A330 for immediate take-off.
1831:58
The ADC-E assessed that the runway separation standard would not be maintained at the time the 737 crossed the threshold of runway 34R. He instructed the 737 flight crew to go around. The A330 was still in its take-off roll and the 737 was at about 400 ft.
1832:30
The 737 was climbing through about 920 ft still on runway track (335°). The A330 was becoming airborne on runway track (335°).
1832:38
The ADC-E instructed the 737 flight crew to turn right onto heading 100°. Flight data showed the 737 flight crew commenced the right turn when passing about 1,300 ft AGL. At that time the aircraft was approximately 1,500 m north of the runway threshold. The A330 was in a climbing right turn tracking on the MARUB 6 standard instrument departure. The projected flight paths of the two aircraft were then converging.
1832:50
The A330 flight crew received an ACAS traffic advisory alert (‘TRAFFIC TRAFFIC’). The A330 first officer looked out the right cockpit window and sighted the 737 above in a climbing turn and in close proximity.
1833:03
The ADC-E instructed the 737 flight crew to turn further right onto heading 120°.
1833:09
The ADC-E instructed the 737 flight crew to climb to 3,000 ft.
1833:17
The A330 captain made a radio transmission saying ‘that was very close’.
1833:23
The ADC-E instructed the A330 to turn left heading 100°. Both aircraft were then on diverging flight paths.
Standard instrument departures and approaches
Standard instrument departures (SIDs) and instrument approaches are charted procedures that flight crews must follow when departing or landing at suitably equipped aerodromes.
ATC had cleared the A330 flight crew to depart from runway 34R on the MARUB 6 SID (Figure 2). The design of that SID required flight crew to climb on the runway track (335°) to 500 ft and then turn right to intercept the 075° track to waypoint MARUB.
Figure 2: MARUB 6 standard instrument departure from runway 34R
Source: Qantas Airways
Prior to descent into Sydney, ATC had cleared the 737 flight crew to conduct a global navigation satellite system landing system (GLS) approach to runway 34R. In the event of a go-around, Airservices Aeronautical Information Publication Australia (AIP) 2.14.2 (Go Around and Missed Approach Procedure in VMC) stated that at Sydney visual go-arounds must be carried out in accordance with the GLS or instrument landing system (ILS) missed approach procedure for the runway the aircraft was using, or as directed by ATC.
When the ADC-E instructed the 737 flight crew to go around, the aircraft was descending through about 400 ft. The missed approach procedure for the GLS runway 34R required the flight crew to maintain the runway track (335°) until 600 ft and then turn right, track 070° and climb to 2,000 ft (Figure 3). Flight data showed the 737 flight crew commenced the right turn when climbing through about 1,300 ft AGL (above ground level). At that time the aircraft was approximately 1,500 m north of the runway threshold.
A missed approach procedure is designed for each instrument approach to provide aircraft with terrain and obstacle clearance during a go-around. A missed approach point (MAP) is a point where flight crew must initiate a missed approach if suitable visual references are not available to make a safe landing or the aeroplane is not in a position to make a safe landing.
For ILS and GLS approaches, the decision height (DA) in conjunction with the glide slope (G/S) is used to determine the MAP. The DA and MAP are annotated on the approach chart (Figure 3).
From the MAP, flight crews are required to navigate their aircraft in accordance with the applicable published missed approach procedure unless directed otherwise by ATC.
Figure 3: GLS approach runway 34R
Source: Qantas Airways annotated by ATSB
The MARUB 6 SID runway 34R and the missed approach flight path for the GLS approach runway 34R both required flight crew to make an early right turn and track to the east of Sydney Airport.
As in this occurrence, should an aircraft be departing on the MARUB 6 SID at the same time an aircraft conducts a go-around from runway 34R, both aircraft will track out to the east. There is potential that those flight paths will conflict and require intervention from ATC in order to ensure separation is maintained between the aircraft.
Aircraft flight management systems
Modern commercial aircraft are generally fitted with a flight management system (FMS) or similar system. A FMS uses a variety of sensors to determine the aircraft’s current position and then sends guidance commands to the aircraft control systems to navigate it along the flight path programmed by the flight crew.
An FMS has a worldwide navigation database that is coded with published instrument procedures including missed approach procedures. The navigation database allows an FMS to create a continuous display of navigational data to flight crew. Vertical navigation guidance can also be coded and displayed. Any discrepancies in a navigation database may lead to flight crew not following the correct flight path.
Air traffic control information
Separation standards refer to the minimum distance or time apart that aircraft operating in controlled airspace and at Class C[3] airports must be kept. These are outlined in the Manual of Standards for Air Traffic Services and air traffic controllers use them to safely manage air traffic.
Air traffic controllers must keep aircraft separated vertically or horizontally. When the separation between two or more aircraft is less than the standard, there is a loss of separation.
A surveillance separation standard is used when aircraft position information is derived from air traffic services’ surveillance systems (including radar). When aircraft are operating inside terminal area airspace, such as Sydney, controllers must maintain a minimum separation between aircraft of 3 NM laterally or 1,000 ft vertically. That standard of separation may be reduced by a tower controller when using visual observation.
A runway separation standard is applied for aircraft landing and taking off from the same runway. The standards required that an aircraft landing behind a departing aircraft cannot cross the runway threshold until the preceding aircraft is airborne and:
has either commenced a turn, or
is beyond the point on the runway at which a landing aircraft could be expected to complete its landing roll and there is sufficient distance to enable the landing aircraft to manoeuvre safely in the event of a missed approach.
In this case, the ADC-E ensured runway separation standard was not infringed by instructing the 737 flight crew to go-around.
Aerodrome controllers (ADCs) may reduce the radar separation minima in the vicinity of aerodromes when adequate separation can be provided using visual observation and each aircraft is continuously visible to the ADC. However, ADCs are not permitted to provide visual separation if the projected flight paths of the aircraft conflict.
In this case, the ADC-E and his supervising OJTI stated they had the two aircraft sighted and applied visual separation. At night or in instrument meterological conditons, ATC maintains responsibility for terrain clearance when an aircraft is being radar vectored. When the ADC-E issued a radar vector (at night) to the 737, the aircraft was still below the minimum vector altitude, therefore terrain separation was not maintained.
When a loss of separation occurs, compromised separation recovery procedures are required to be applied to reduce the risk of a collision. A controller is required to issue safety alerts to pilots of aircraft as a priority when a controller becomes aware that aircraft are considered to be in an unsafe proximity to each other. In this case, no safety alert was issued by either the ADC-E or OJTI as both controllers considered visual separation existed.
The ADC-E trainee was an experienced controller. He had previously worked as an ADC in another tower and had a surface movement controller rating at Sydney. At the time of the occurrence, he had neared the end of his training for the Sydney ADC-E position, with his performance check to obtain his rating scheduled for the next day. Both the ADC-E and OJTI had completed compromised separation recovery training.
Further investigation
The investigation is continuing and will include examination of:
design and risk assessment of MARUB standard instrument departures and missed approaches from runway 34 right
air traffic control procedures, controller training and controller actions
737 and A330 operator’s procedures and flight crew actions
coding of flight management system navigation databases
further analysis of flight data recordings and ATC recordings.
______________
The information contained in this preliminary report is released in accordance with section 25 of the Transport Safety Investigation Act 2003 and is derived from the initial investigation of the occurrence. Readers are cautioned that new evidence will become available as the investigation progresses that will enhance the ATSB's understanding of the accident as outlined in this preliminary report. As such, no analysis or findings are included in this update.
Purpose of safety investigations
The objective of a safety investigation is to enhance transport safety. This is done through:
identifying safety issues and facilitating safety action to address those issues
providing information about occurrences and their associated safety factors to facilitate learning within the transport industry.
It is not a function of the ATSB to apportion blame or provide a means for determining liability. At the same time, an investigation report must include factual material of sufficient weight to support the analysis and findings. At all times the ATSB endeavours to balance the use of material that could imply adverse comment with the need to properly explain what happened, and why, in a fair and unbiased manner. The ATSB does not investigate for the purpose of taking administrative, regulatory or criminal action.
Terminology
An explanation of terminology used in ATSB investigation reports is available here. This includes terms such as occurrence, contributing factor, other factor that increased risk, and safety issue.
Publishing information
Released in accordance with section 25 of the Transport Safety Investigation Act 2003
Ownership of intellectual property rights in this publication
Unless otherwise noted, copyright (and any other intellectual property rights, if any) in this report publication is owned by the Commonwealth of Australia.
Creative Commons licence
With the exception of the Coat of Arms, ATSB logo, and photos and graphics in which a third party holds copyright, this publication is licensed under a Creative Commons Attribution 3.0 Australia licence.
Creative Commons Attribution 3.0 Australia Licence is a standard form licence agreement that allows you to copy, distribute, transmit and adapt this publication provided that you attribute the work.
The ATSB’s preference is that you attribute this publication (and any material sourced from it) using the following wording: Source: Australian Transport Safety Bureau
Copyright in material obtained from other agencies, private individuals or organisations, belongs to those agencies, individuals or organisations. Where you wish to use their material, you will need to contact them directly.
On 6 August 2019, at 1103 Eastern Standard Time, a Liberty XL-2, registered VH-XLK, departed Moruya Airport, New South Wales, for a rural property near Braidwood. The pilot was the sole occupant and had been flying in company with another pilot.
The accompanying pilot landed their aircraft on a private landing area at the Braidwood property about 15 minutes prior to the arrival of VH-XLK. That pilot advised the pilot of VH-XLK by phone that the landing area was undulating and not suitable for the Liberty XL-2 aircraft type. At about 1126, witnesses on the ground observed VH-XLK circling the landing area with a slowing airspeed.
On the second orbit, at about 400 ft above ground level, and after crossing the marked end of the landing area, witnesses observed the left wing drop and the aircraft entered a steep rotating descent. The pilot was unable to recover control of the aircraft before it impacted terrain. The pilot sustained fatal injuries and the aircraft was destroyed.
What the ATSB found
Recorded data showed that the pilot was circling the landing area at a height of 200–400 ft. The ATSB also found that the aircraft departed controlled flight after slowing and turning downwind with no flap selected. The left wing stalled, and this resulted in the aircraft entering into an upright spin, at an altitude that limited an effective recovery.
An airworthiness directive requiring an inspection of the engine exhaust muffler had not been completed, however this did not contribute to the accident.
Safety message
The accident highlights the need for pilots to minimise the risk of aerodynamic stall, particularly when in proximity to the ground, such as during take-off and landing. Turning manoeuvres at or close to the aircraft’s critical angle of attack, if mishandled, can lead to a stall that may result in the aircraft entering a spin. Pilots can limit their risk of losing control in flight by maintaining situational awareness of the aircraft state while conducting turns, maintaining adequate airspeed through appropriate power application during increased bank angles, and by selecting altitudes to operate at that provide sufficient height to recognise and recover from a stall.
In addition, aircraft owners should ensure that required maintenance and airworthiness directives are completed and recorded as they become due, to avoid invalidating the aircraft maintenance release and potentially increasing risk to flight safety.
The occurrence
Events prior to the accident flight
On 4 August 2019, the pilot of a Liberty XL-2, registered VH-XLK, departed Camden Airport, New South Wales, on a private flight to Adaminaby Airstrip to attend a social function. The pilot met a friend, who was flying a recreational aircraft, at the airstrip. That night, both pilots stayed at Adaminaby before departing the next day to fly around the local area before heading to Merimbula.
On arrival at Merimbula Airport on 5 August, the pilot refuelled VH-XLK with about 73 L of aviation gasoline and then continued in company with the other aircraft to Moruya Airport, where both pilots stayed the night. They met some aviation friends for dinner before retiring back to their accommodation early in the evening.
On 6 August 2019, both pilots planned to fly to a property located 9 km to the north-east of Braidwood to meet friends that owned the property (Figure 1). This was the first time an aircraft would use the freshly prepared landing area on the property. The pilot of VH-XLK then intended to continue on to Camden Airport later that day.
Figure 1: Aircraft’s flight path and accident site location
Source: Google Earth, modified by the ATSB
Accident flight
Due to the performance differences between the two aircraft, the pilot of the slower recreational aircraft departed Moruya first at about 1030 Eastern Standard Time[1] and arrived in the vicinity of the Braidwood landing area at about 1110. After surveying the landing area, the recreational pilot made a landing to the east. The slower aircraft was designed for landing on unprepared areas, having a different landing gear configuration and high propeller clearance from the ground.
The landing area was oriented in an east-west direction, and the recreational pilot reported that they landed with a left quartering tailwind, uphill to the east. After landing there, the recreational pilot believed that the runway was not suitable for the Liberty XL-2 (VH-XLK).
VH-XLK departed Moruya at about 1103 and had sufficient fuel to either land at Braidwood, or to continue to Camden Airport. The recreational pilot recalled that, prior to VH-XLK’s arrival overhead the Braidwood landing area, they called the pilot of VH-XLK by mobile phone to advise that the runway was not suitable for the Liberty XL-2.
Recorded data showed that VH-XLK approached the landing area (Figure 2) from the south-east and overflew the property homestead at about 1123, before turning left to circle around the landing area. A witness reported that the aircraft appeared to be slowing and descending and that the engine noise was a lot less noticeable overhead the landing area than when it first approached the property. The witness also stated that the aircraft appeared to be ‘hanging off the prop’, describing VH-XLK having a slowing speed and nose-high attitude. The recorded data indicated an inconsistent airspeed and height during the first orbit overhead the Braidwood landing area (Figure 5).
Figure 2 : VH-XLK flight path approaching the Braidwood landing area
Flight data overlay of Braidwood aircraft landing area, with final 15 seconds recreated from witness accounts and highlighted for reference.
Source: Google Earth, modified by the ATSB
As VH-XLK approached the western end of the landing area, it began a left turn to track close to the western threshold of the runway on a slow descent, at about 400 ft above ground level. At about 1127, after passing over the western threshold and travelling in a southerly direction, a further left turn was initiated.
Witnesses described that, during this left turn, the left wing of VH-XLK dropped and the aircraft pitched nose-down while rotating to the left. The aircraft then entered a steep, rotating, counterclockwise descent around the longitudinal axis for one rotation before impacting the flat, open farmland adjacent to the landing area.
Witnesses to the accident arrived promptly to assist, however the pilot was fatally injured.
The pilot obtained a recreational pilot certificate in March 2008 and achieved a cross country endorsement in May 2008. In July 2010, the pilot purchased VH-XLK and in December 2010 obtained a Private Pilot Licence (Aeroplane).
The pilot completed their last aeroplane flight review on 8 December 2018. They had about 654 hours total flying experience, with about 548 hours in VH-XLK. This included 22 hours flight time in the 2 weeks prior to the accident, and 4.1 hours during the 2 days prior to 6 August.
Stall and spin recovery training
The pilot had previously been taught theoretical and practical stall recovery techniques, including recovery from an entry into a spin, during their initial flying training. A part of the pilot’s last aeroplane flight review required the pilot to demonstrate competency in the recognition of stall signs and symptoms, and the recovery from incipient stalls and spins.
Medical and recent history information
The pilot’s last medical examination was on 10 August 2018 for a class 2 medical certificate. This medical certificate placed restrictions on the exercise of the pilot’s licence and required that distance vision and reading correction was to be worn whilst exercising the privileges of the licence.
Post-mortem examination identified that there was no evidence of pre-existing natural disease and that the pilot most likely succumbed to impact-related injuries. Toxicological testing identified low levels of a cough suppressant, however no other drugs or medications were detected. Further specific testing for carbon monoxide did not indicate elevated levels.
The recreational pilot reported that the pilot of the accident flight had significant sleep opportunity on the nights of 4 August and 5 August, but did not know how much sleep the pilot actually obtained. On the morning of 6 August both pilots had breakfast before heading to Moruya Airport.
Weather information
The aerodrome forecast (TAF)[2] for Goulburn Airport (62 km north of the Braidwood landing area) for the period from 0900 included clear conditions with a wind of 12 kt from 290°. The TAF for Canberra Airport (58 km west of the landing area) for the period from 1000 indicated conditions of broken cloud at 500 ft above ground level with clear visibility and wind of 4 kt from 040°, improving to clear conditions with a wind of 12 kt from 330° by 1200.
The weather observation (METAR) [3] for Goulburn at 1200 indicated a wind of 13 kt from 270° with clear visibility and no cloud. One-minute weather observations for Braidwood racecourse, about 8 km from the accident site, for the period from 1122 to 1132 indicated an average wind of 2.3 kt with a maximum gust of 5.4 kt (recorded at 1126). The recorded winds during this period varied from 330° to 030°.
Witness reports identified the wind direction as being from the north-west, and the recreational pilot reported that the wind direction and strength produced a quartering tailwind from the left when approaching to land towards the east at the landing area. They estimated the wind at the landing area to be about 5–7 kt, and they also noted that they had experienced no turbulence during their flight.
The ATSB considered that the recreational pilot’s weather observations provided a reasonable and timely local representation of the weather below 1,000 ft above ground level. These observations were broadly consistent with the Bureau of Meteorology (BoM) forecasts and the observations at ground level. All the weather sources confirmed that the conditions and visibility were conducive to flight under visual flight rules.[4]
Aircraft information
General
The Liberty XL-2 aircraft is a single engine, two seat, low wing aircraft mostly used as a private touring aircraft, or as a primary flight trainer. The fuselage is made from composite fibreglass and carbon, with metal wings. The limited propeller ground clearance and relatively small tyres make it less suited to rough field operations and more suited to prepared runway surfaces.
The aircraft is powered by a Continental IOF-240-B engine with a full authority digital engine control (FADEC), fuel injection control system, which produces 125 hp and a cruise speed of about 125 kt. The FADEC system is a solid state, computer controlled electronic ignition and fuel injection system, allowing the electronic control unit (ECU) to adjust the fuel to air ratio, and other engine parameters, to adapt to the operating conditions and obtain peak engine performance, and to promote reduced pilot workload and better fuel economy.
Airworthiness and maintenance
The aircraft involved in the accident, serial number 0106, was manufactured in 2008. In February 2009, the aircraft had 19.6 hours total time and was issued with an Australian certificate of airworthiness in the normal category[5] and was registered as VH-XLK.
The aircraft’s last maintenance release[6] (MR) was issued by a maintenance provider at Bankstown on 30 November 2018, at which time the aircraft had 766.5 hours total time in service.
At the time of the accident (6 August 2019), the last entry on the MR was recorded on 5 August 2019 and showed an aircraft total time in service of 822.6 hours. VH-XLK was operated for an additional three additional flights, totalling 1.1 hours, until the time of the accident.
The MR was issued in the instrument flight rules[7] category, however an entry by the issuing maintenance organisation advised that VH-XLK was restricted to night visual flight rules as the electrical, instrument and radio periodic inspection had not been completed at the time of MR issue.
The MR indicated a requirement for an oil and filter change to be conducted every 50 flight hours; that is by 816.5 hours with tolerance of +/- 5 hours. There was no certification on the MR to indicate that this had occurred before the accident flight.
Airworthiness Directive (AD) FAA AD 2009-08-05R1 was required to be completed every 50 hours of service or every 12 calendar months, whichever came first. The AD required a check for cracking in the exhaust muffler system, and was due on 30 November 2019 or at 816.5 flight hours (whichever came first), as annotated on VH-XLK’s MR. The AD stated, that should cracking be identified, then it must be replaced as it had potential to allow carbon monoxide to enter the aircraft cabin through the cockpit heating system.
On 19 July 2019, while returning from another journey, the AD became due on VH-XLK (50-hour requirement). The aircraft continued to operate for another 6.1 hours and 10 flights, until the time of the accident. There was no certification on the MR to indicate that the AD inspection was conducted.
Stall warning system and stall speed
VH-XLK was equipped with a stall warning system. The stall warning capability was provided through a lift switch (stall sensor) mounted in the left-wing leading edge, and electrically connected to an aural warning device located behind the instrument panel. The stall warning system was designed to produce an audible tone about 5–10 kt above the airplane stalling speed to warn the pilot of an impending stall, and to enable them to take avoiding action.
The stall speeds listed in the XL-2 Flight Manual varied according to aircraft configuration and the bank angle, as shown in Table 1.
Table 1: Liberty XL-2 stall speeds
Source: Liberty XL-2 Flight Manual, Section 5 Performance
Site and wreckage information
Accident site
The accident site was located about 150 m to the south of the western threshold of the landing area in relatively flat and open farmland, about 9 km north-east of Braidwood (Figure 1).
Witnesses reported that the aircraft was travelling in an easterly direction when it impacted the ground. Ground scars indicated that the aircraft impacted terrain in an upright, nose‑down, left wing low attitude, consistent with counter‑clockwise rotation around the longitudinal axis.
Wreckage examination
The wreckage was distributed over a relatively small area, with all of the major aircraft components accounted for at the site (Figure 3).
Examination of the wreckage identified:
the flight control system was assessed for control continuity with no pre-existing defects identified
fragments of the wood propeller blades, and propeller slash marks, were located at the point of impact
the propeller blades showed evidence of rotation damage consistent with engine operation at impact
the engine, empennage and right wing were located about 20 m from the initial impact point
the left wing had separated from the fuselage and was located a short distance from the initial impact point
the flaps were in the retracted position, consistent with the observed position of the electric flap actuator.
Figure 3: Accident site
Source: ATSB
Impact signatures were consistent with witness reports, indicating that the left wing struck the ground first, followed by the propeller, engine and then the fuselage. The wing ground strike resulted in compression damage to the left lower fuselage below the gull door at the wing root location, and subsequent separation of the left wing from the fuselage.
Creases and tears in the carbon fibre panels behind the cabin area were also as a result of the ground impact (Figure 4).
No pre-impact defects were identified with the engine or aircraft structure. The internal cabin fuel tank had ruptured and a quantity of fuel had leaked into the ground. Fuel was observed in the fuel filter bowl, free of contamination. There was no post impact fire.
Figure 4: VH-XLK rear fuselage section showing compression damage to composite structure and creasing at empennage junction
Source: ATSB
Component examinations
Several components were taken from site for further examination by the ATSB, including:
airframe fuel filter
static system alternate air valve
stall warning vane and annunciator unit
horizontal stabiliser actuator.
Fuel supply to the engine is from the fuel tank located in the pilot and passenger seat back, via a ‘gascolator’ or airframe fuel filter assembly. The filter contained residual fuel with no blockages or inhibiting obstructions to prevent normal operation.
The alternate static air selector valve was found on the accident site to be in the ‘OFF’ or normal position and its function and sealing was checked for serviceability. Physical examination showed that the unit was intact, although had sustained some impact-related damage to the associated tubing. The unit was tested, and no faults were identified with its correct operation.
The stall sensor assembly was externally damaged with the mounting flange showing signs of significant distortion. However, the internal micro-switch operated correctly with a loud, audible response from the annunciator unit, indicating that the annunciator likely would have provided warning to the pilot if the lift switch was appropriately positioned.
It was not possible to confirm whether the lift switch was appropriately positioned, and this is not usually checked or required to be checked during periodic maintenance. However, pilots are required to confirm that the stall warning is working (will make a noise) prior to flight.
The stabilator trim actuator was identified on-site in the fully extended position (pitch-up trim), and free of external defects. However, due to the impact forces, continued electrical power post-accident, and the compressed cockpit area, it was not possible to confirm the pre-impact trim actuator position.
Recorded information
Engine data
An engine data storage card was retrieved from the aircraft’s engine control unit for examination. The memory card was designed to store all engine data between overhauls, and the data was ordinarily extracted with a card reader. The data recovered from the card installed in VH-XLK did not contain any valid date or time data, and it stored insufficient detail to identify the accident flight.
Electronic flight data
A damaged iPad was recovered from the accident site. The pilot utilised the iPad to run an electronic navigation program, but the damage to the device precluded any on-device data download. However, the software provider was able to supply remotely stored data. The recorded data included time, latitude, longitude and altitude, recorded at 5-second intervals.
The ATSB used the recorded data to derive a groundspeed, and then calculated the true airspeed (KTAS) using an estimated wind of 310° at 6 kt as witnessed by the previous landing pilot. Calibrated airspeed (KCAS) was then calculated by correcting true airspeed for pressure changes in altitude. The indicated airspeed (KIAS) was then calculated by applying the flight manual calibration differences at certain speeds for the Liberty XL-2, taking into consideration the position errors associated with installation. KIAS is the speed that would be indicated to the pilot in the aircraft.
The height above ground was calculated by comparing the recorded altitude at each position with the landing area elevation of 2,132 ft.
Figure 5 shows the derived airspeed and height above ground level for the last 3 minutes of the flight. However, constraints on the buffering of the in-flight data meant that the last 15 seconds of flight Figure 5 (data after 1126:51) were considered less reliable.
Figure 5: VH-XLK flight profile
Analysis of 5-second flight data with ground speed corrected for observed wind (6 kt). True airspeed corrected for elevation and indicated airspeed corrected for installation. Altitude was recorded to the nearest 100 ft, and this figure was subtracted from the elevation of the landing area (2,132 ft).
Source: ATSB
VH-XLK descended to fly overhead the landing area, and at 1125:21 the altitude stabilised at about 2,300 ft, which was about 170 ft above ground level. From 1125:21 to 1126:41 the altitude increased to about 2,400 ft, which was about 270 ft above ground level.
During the descent, at 1124:41, airspeed reduced below 80 KTAS (about 73 KIAS). After levelling out about 1125:21, the estimated speed was about 65 KTAS (about 58 KIAS), and it then increased up to 72 KTAS (65 KIAS) before decreasing to about 59 KTAS (51 KIAS) at 1126:21. It then increased to about 78 KTAS (70 KIAS) at 1126:46, but was decreasing again by the time of the last reliable data point (1126:51).
At 1126:21, VH-XLK commenced a left turn over the eastern end of the landing area. Based on the recorded and estimated parameters, this turn had an estimated bank angle of about 15–20°, which continued up until the last reliable data point (1126:51). At this point the recorded altitude was 2,500 ft (about 400 ft height above ground) and the estimated airspeed was 74 KTAS (66 KIAS). Based on witness reports, the aircraft continued the left turn after this point, which meant it would have been turning towards a downwind direction, with decreasing airspeed, when the loss of control occurred.
Survival aspects
Examination of the aircraft confirmed the correct function of the pilot’s safety harness. Although the harness was cut by emergency services, the belt tongues were secure in the belt buckle. The passenger seatbelt was found securely fastened.
The upward opening, gull doors on each side of the aircraft were open (gas strut operated), however the door locks were in the closed/locked position. The open doors were most likely due to airframe distortion during the accident sequence. The windscreen was broken with little remaining, the left gull door transparency was substantially damaged, and the right gull door transparency was intact.
The accident impact forces imparted on the aircraft cockpit was considered by the ATSB to be not survivable.
Weight and balance information
The standard empty weight of the XL-2 is about 1174 lbs (438.2 kg), however VH-XLK was fitted with a ‘factory rework kit’ which enabled the aircraft to be flown at the increased weight of 1750 lbs (793.8 kg) maximum take-off weight. Aircraft manuals, navigation equipment, travel bags and other personal items were located in the wreckage.
An assessment of the aircraft’s weight and balance during the flight was made based upon the aircraft’s basic weight, estimated fuel, the weight of the pilot and an estimate of the baggage carried. The weight of the aircraft was calculated to have been within weight and balance limits throughout the flight.
Aircraft landing area information
The landing area is located to the south-west of the homestead, in open undulating farmland running almost east-west in orientation. The landing area was freshly marked with painted tyres and had not previously been used by any aircraft prior to the day of the accident.
The landing area ran uphill to the east, with a southerly transverse (side) slope from left to right and was about 540 m long. It was unevenly sloped in the initial sections with a number of undulating steps. The landing area had an elevation of 2,132 ft, and the surrounding area varied by about 100 ft in altitude.
The surface contained depressions, grass tufts and rocks, and was not suited to smaller aircraft tyres, such as those fitted to the VH-XLK.
The landing area met the requirements of Civil Aviation Advisory Publication (CAAP) 92-1 (Guidelines for aeroplane landing areas) for the conduct of the operations of the Liberty XL-2 and was suitable in terms of runway distance required and landing area width.
Additional information
The aerodynamic stall
A wing generates lift when the airflow around the upper and lower surfaces results in a pressure difference between those surfaces. At a certain angle of attack,[8] which is a characteristic of the wing design, the flow over the upper surface of the wing separates from the surface (Figure 6). This condition is known as an aerodynamic stall (or simply a stall) and results in a rapid reduction in the lift generated.
Figure 6: Angle of attack increase to stall
Source: United States Federal Aviation Authority publication FAA-H-8083-3A – Critical angle of attack and stall, annotated by the ATSB
A wing drop occurs when an aircraft approaches the stall and one wing stalls before the other. This signals a loss of symmetrical lift across both wing surfaces, and can be exacerbated by unbalanced flight. The loss of lift on one wing will induce a rolling and pitching moment, that if not immediately addressed by the application of the appropriate recovery actions, will likely result in entry to a spin.
The US Federal Aviation Administration (FAA) Airplane Flying Handbook[9] provides guidance on basic pilot skills and knowledge essential for piloting aeroplanes. The handbook contains a section on stalls that states:
If an uncoordinated turn[10] is made, one wing may tend to drop suddenly, causing the airplane to roll in that direction.
The handbook also described aircraft behaviour during a cross-control stall, when aileron and rudder inputs are applied in opposite directions during a turn, as follows:
In a cross-control stall, the airplane often stalls with little warning. The nose may pitch down, the inside wing may suddenly drop, and the airplane may continue to roll to an inverted position. This is usually the beginning of a spin… It is imperative that this type of stall not occur during an actual approach to a landing, since recovery may be impossible prior to ground contact due to the low altitude.
Depending on timely action and pilot input, the aircraft may require several hundred feet of altitude to effect a safe recovery.
Spins and spin recovery
An aerodynamic spin is a sustained spiral descent, in which one or both aircraft’s wings are in a stalled condition.[11]
A spinning aircraft (Figure 7) will descend more slowly than one in a vertical or spiral dive and it will have a lower airspeed. The pitch angle can also vary considerably from significant pitch down, to a relatively flat attitude, depending on the aircraft type.
Spinning ceases only when opposing forces and moments overcome the rotation. The pilot must recover by applying the recommended spin recovery technique. Due to rotational inertia, spin recovery is not instantaneous. It may take several turns of the applied technique before the recovery technique is effective.
Spins are recoverable when correct recovery technique is taken and there is enough altitude and therefore time to recover.
Figure 7: Spin entry and recovery
Source: United States Federal Aviation Authority publication FAA-H-8083-3A– Spin entry and recovery
Aircraft flight manual procedures about spins
The Liberty XL-2 flight manual, section 3, described the recovery from unintentional spins as follows:
If an inadvertent spin occurs, use the following recovery procedure:
• Throttle - idle • Ailerons neutral • Rudder pedals – Apply and hold full opposite rudder • Control stick – forward to break stall • Neutralize rudder – make smooth pull-up from the resulting dive • Throttle – Adjust for straight and level flight
In addition to the inadvertent spin guidance, section 2 of the Liberty XL-2 flight manual (limitations) stated:
No aerobatic manoeuvres, including spins, are authorized.
Additional guidance material about spins and stalls
A large amount of guidance material has been published for pilots regarding the nature of spins and stalls, such as the guidance material provided by the US FAA mentioned above, a 2008 Civil Aviation Authority (NZ) publication titled Spin Avoidance and Recovery stated:
The majority of unintentional spins occur at altitudes too low for recovery.
The publication discussed how aircraft enter unintentional spins and how in a low-speed descending turn, the aircraft is vulnerable by being at low speed with a higher angle of attack and therefore closer to the stall. This coupled with a reducing or low airspeed can provide the conditions to start a spin.
In the event of a spin, pilots must immediately recognise the spin, its direction, know what to do in the correct order and correctly execute the procedure the first time. In most cases, there is only about 3 seconds to do all this. The minimum altitude loss for a text-book recovery will be about 1,000 to 1,500 ft. At low heights above ground level, there will be little opportunity to recover.
The criticality of immediate and correct pilot input will reduce recovery time and minimise the required altitude to recover, thereby reducing the risk of collision with terrain.
At the time of the accident, CASA had published some guidance material about stalls and spins in its Flight instructor’s manual, as well as educational articles in its Flight Safety magazine. However, it had not published an advisory circular or similar document on stalls and spins. It published an advisory circular on spin avoidance and stall recovery training in April 2020 (see Safety action).
Low flying
Flight below 500 ft above ground level is subject to different sets of visual cues and references, and therefore different techniques. Often slow flight can be involved in low level flight and, as a result, attitude, trim settings, control loads and aerodynamic control effectiveness, and power settings, may all be quite different to what the pilot is familiar with or has experienced before. Accordingly, sustained operational flight at low level requires specific training and testing for competence.
Related occurrences
The recent CASA advisory circular on spin avoidance and stall recovery training stated:
Stall - spin related accidents continue to account for approximately one-quarter of all fatal general aviation accidents worldwide, including many during dual flight training. Most unintentional spins other than during dual instruction, occur at altitudes too low for recovery, generally on climb after take-off and turns onto final approach.
The ATSB has investigated a number of accidents where light general aviation aircraft have stalled and impacted terrain. Each of these investigations identified that the stall condition is exacerbated through mishandling of the aircraft during the stall, which can result in entry into a spin. The stall/spin will result in a steep pitch down and rotation towards the stalled wing. Recovery from this condition will take a considerable amount of height, the magnitude of which is dependent on the reaction time of the pilot, and the use of appropriate recovery technique.
A summary of eight of these investigations, that have similar characteristics to the accident near Braidwood on 6 August 2019, is located in Appendix A.
Evidence from witnesses and the available flight data indicated that control of the aircraft was lost while the pilot was executing a slow speed turn downwind. The witnesses then observed the aircraft’s left wing drop and the aircraft enter an upright spin. The examination of the wreckage confirmed that the aircraft impacted terrain in a nose-down, left wing low attitude, consistent with the aircraft being in the early stages of a spin.
The local meteorological conditions around the time of the accident suggested that a meteorological event, such as a sudden and large wind gust that might contribute to a loss of control, was unlikely to have occurred. In addition, the available evidence indicated that the engine was operating at impact and there was no evidence to suggest any impediment to normal engine operation. There was also no evidence to indicate a problem with the aircraft’s flight controls or weight and balance leading to the loss of control.
This analysis will consider the circumstances that preceded the event, including navigation data and witness reports. It also considers some maintenance aspects associated with the aircraft.
Flight over the landing area
Aircraft handling
Flight profile data provided by the navigation software manufacturer indicated the aircraft’s height to be ranging from 200–400 ft above ground level (AGL) as the pilot circled the area prior to the loss of control. The aircraft’s speed and altitude fluctuated, commensurate with holding a reduced power setting and interchanging speed for altitude.
In slow speed situations, the selection of partial flap would allow the pilot to fly the aircraft at a lower airspeed, while maintaining a greater margin above the stall.[12] However, the flaps were confirmed to be in the retracted position at the accident site.
The stall handling characteristics of most light, general aviation aircraft suggest that a significant wing drop, as reported by the witnesses, may be due to an unbalanced turn at slow speed, leading to entry to a spin. In this case, the left wing most likely aerodynamically stalled, rolling the aircraft left and pitching the aircraft nose down. The aircraft then entered a left spin with a near vertical attitude and completed one rotation before impacting terrain.
Enabling a recovery from the stall
It has been highlighted in other accident investigation reports and guidance material that the height required to recover most light general aviation aircraft from a stall/spin condition is in the order of at least 400 ft. By operating the aircraft below 500 ft while circling the landing area, the pilot reduced an important safety margin.
It is also important that a pilot monitors and maintains an appropriate margin above the stall speed during a turn, is cautious with manoeuvring, and remains balanced with control inputs when flying at lower altitudes.
Pilot intentions
It is unclear what the pilot’s intentions were after arriving overhead the landing area. The pilot of the accompanying aircraft reported that they had advised the pilot of VH-XLK that the surface of the landing area was not suitable for VH-XLK to land. It is possible that the pilot of VH‑XLK was assessing the landing area to make up their own mind or was potentially just conducting an overflight of the property. In either case, flight below 500 ft above ground level, unless they were conducting a precautionary search and landing or were in the process of landing (after conducting a suitable circuit or approach), reduced the available time and altitude to recover from an emergency situation, such as a stall or spin.[13]
In addition, regardless of their intention, it is likely that the pilot’s focus of attention was looking outside the aircraft at the landing area. Accordingly, they may well have not been allocating sufficient attention to monitoring the aircraft’s airspeed and/or energy state and controlling the aircraft. A substantial body of research has shown the significant effects that distraction can have on pilot performance (ATSB 2005).
Effectiveness of the stall warning
A stall warning should provide adequate warning to the pilot prior to the onset of stall symptoms during flight. The stall warning system fitted to the XL-2 was designed to provide aural warning of impending stall conditions about 5 kt above the expected stall speed.
Analysis of the stall warning system components identified that it was most likely functional at the time of the accident. However, it is unknown if and for how long this warning may have sounded. Likewise, the pilot’s reaction to the warning before the aircraft stalled is also unknown.
Stall speed can be reduced by the application of flap and is recommended while conducting sustained slow speed flight. Although it is possible the pilot may have been using some flap during the early part of the circling, it is very unlikely any flap was selected prior to commencing the final turn (downwind), given that the flaps were retracted at impact.
Summary
The introduction of bank and/or unbalanced control inputs decreases the margin between slow flight and the stall. Maintaining adequate airspeed through appropriate power application during increased bank angles is essential to maintain a controllable airspeed and margin above the stall, especially in slow speed flight, without height loss.
If the pilot was evaluating the suitability of the landing area for their aircraft, the conduct of a precautionary search and landing by overflying the landing area at progressively lower heights, and then climbing back to circuit height each time, would have reduced the risk of a loss of control.
Taking into consideration the time required to recognise and react to a stall/spin event, and recovery height requirements, VH-XLK was most likely at an altitude that would have precluded a safe spin recovery prior to impacting terrain.
Maintenance overrun
VH-XLK departed Moruya with maintenance requirements that were due prior to the flight. This included an airworthiness directive (AD) specifying a muffler inspection, and an engine oil and filter change. The aircraft had been flown on 10 previous occasions with the muffler AD pending completion.
The operation of the aircraft beyond the maintenance requirements resulted in the maintenance release ceasing to be valid; this should have prevented further flight in the aircraft until the actions were completed (or an exemption obtained).
The overdue maintenance did not contribute to the accident. There was no indication of an engine problem. In addition, although the overdue muffler inspection increased the potential of carbon monoxide gas entering the cockpit, there was no indication that the pilot was affected by carbon monoxide.
ATSB investigation report findings focus on safety factors (that is, events and conditions that increase risk). Safety factors include ‘contributing factors’ and ‘other factors that increased risk’ (that is, factors that did not meet the definition of a contributing factor for this occurrence but were still considered important to include in the report for the purpose of increasing awareness and enhancing safety). In addition, ‘other findings’ may be included to provide important information about topics other than safety factors.
These findings should not be read as apportioning blame or liability to any particular organisation or individual.
From the evidence available, the following findings are made with respect to the collision with terrain involving Liberty Aerospace XL-2, VH-XLK, 9 km north-east of Braidwood, New South Wales, on 6 August 2019. These findings should not be read as apportioning blame or liability to any particular organisation or individual.
Contributing factors
After arriving at the landing area, the pilot circled the landing area at a height of 200–400 ft above ground level.
Soon after the pilot turned downwind at low airspeed with no flap selected, the aircraft’s left wing aerodynamically stalled. This resulted in the aircraft entering into an upright spin, at an altitude that limited an effective recovery.
Other factors that increased risk
An airworthiness directive requiring an inspection of the engine exhaust muffler had not been completed and the aircraft was overdue for an oil change. These overdue maintenance items rendered the maintenance release invalid, which should have prevented further flight until rectified.
Safety action
Whether or not the ATSB identifies safety issues in the course of an investigation, relevant organisations may proactively initiate safety action in order to reduce their safety risk.
CASA guidance on spin avoidance
Due to an increase in spin type accidents across a broad range of light aircraft types in the training environment, CASA released guidance material in the form of advisory circular (AC) 61-16 v1.0 (Spin avoidance and stall recovery training) in April 2020.
The AC provided detailed guidance for pilots, flight instructors, flight examiners and flight training organisations. Several of the key points for the safe conduct of advanced stalling and spinning exercises from the AC stated that all pilots should be aware of:
Training in spin avoidance must include the recognition of symptoms associated with slow flight and approach to the stall through to recovery from stall with a wing drop
Recognise and manage changes in aircraft energy state
Spin avoidance training where a wing may drop at the stall should be undertaken through scenario-based in-flight manoeuvres:
Approach configuration descending turns (base to final turn) …
Turns in slow flight.
Appendices
Appendix A – Related occurrences
The following ATSB accident investigations are drawn from investigation reports published between 2010–2019. The common theme from these fatal accidents is the loss of control of the aircraft following an aerodynamic stall, with a resultant steep pitch attitude and insufficient altitude to enable recovery before impacting terrain.
On 18 October 2010, a Cessna 172S aircraft, registered VH-VSK, was operating at low level near Durham Downs Homestead, Queensland. A pilot and one passenger were on board. The pilot was assisting a ground party locate two horses. The aircraft was seen manoeuvring at low level before radio and visual contact was lost. A search later found that the aircraft had impacted terrain near a dry creek bed. Both occupants received fatal injuries and the aircraft was seriously damaged.
The aircraft's impact attitude was consistent with a loss of control following aerodynamic stall. The operating status of the aircraft’s stall warning system could not be determined.
On the morning of 29 April 2012, the owner-pilot of a Cessna 150 aircraft, registered VH- UWR was aerial stock mustering on a cattle station about 55 km north-east of Bourke, New South Wales. The aircraft was observed circling over an area (where cattle were not moving) then in a steep descent followed by the sound of an impact. The aircraft was seriously damaged, and the pilot sustained fatal injuries.
The ATSB found that, while manoeuvring at low level, the pilot inadvertently allowed the aircraft to aerodynamically stall, resulting in a high rate of descent and collision with terrain. There was insufficient information about pilot control inputs to establish the factors that precipitated the stall.
On 9 November 2012, a student and instructor departed Gold Coast Airport, Queensland for a training flight in a SOCATA TB 20, registered VH-HBB, to Lismore Airport, New South Wales. On their fifth circuit, and while making a left turn from downwind to base, the left wing dropped steeply. A recovery was commenced, but the aircraft collided with terrain. Both occupants received fatal injuries.
The ATSB found that while making the left turn, an aerodynamic stall occurred, resulting in a significant left-wing low and nose-down attitude in close proximity to the terrain. The instructor was unable to prevent the stall from occurring due to either insufficient warning or available time to react. Although it appeared that a stall recovery was commenced, the aircraft stalled at an altitude from which they were unable to fully recover to controlled flight before the aircraft collided with the terrain.
On 17 March 2013, the owner-pilot of an amateur-built scale-replica Spitfire aircraft (VH-VSF) was participating in an air display at Parafield Airport, South Australia. The pilot completed the display with a slow speed pass at 400 ft with the landing gear and some wing flap extended. Towards the end of this pass the pilot radioed the tower to coordinate a landing and accepted runway 21 Left with an 11 kt crosswind.
By now the pilot had turned right and the Spitfire was near the extended runway centreline and 1 km from the runway threshold at a slow speed. A left turn was then observed and, soon after, a wing dropped, and the aircraft entered a steep descent. The aircraft crashed in a factory car park, fatally injuring the pilot and substantially damaging the aircraft.
The ATSB found that while coordinating a landing clearance with air traffic control and flying a low-level circuit with a close downwind and base in turbulent conditions, the pilot inadvertently allowed the airspeed to decay. In the subsequent turn (downwind) to adjust the circuit the aircraft aerodynamically stalled, descended steeply, and impacted the ground.
On 29 December 2014, a Cessna 172S aircraft, registered VH-PFT, departed Cambridge Airport, Tasmania to photograph yachts participating in the 2014 Sydney Hobart race. On board the aircraft were the pilot and a photographer.
At about 1815 the aircraft commenced low-level photographic runs on yachts to the east of Cape Raoul. Shortly after completing a run on one yacht at a height of about 50 ft, the aircraft entered a steep climbing turn. The aircraft had almost completed a 180° turn when the upper (right) wing dropped sharply while the aircraft’s nose pitched down to almost vertical. The aircraft impacted the water’s surface in an almost vertical nose down attitude with wings about level. Both aircraft occupants were fatally injured, and the aircraft was seriously damaged.
As a result of the steep climbing turn, the aircraft’s upper wing aerodynamically stalled, resulting in a rapid rotation out of the turn. The steep pitch attitude indicated that, because of the stalled upper wing, the aircraft entered a spin. There was insufficient height for the pilot to recover the aircraft.
On 12 July 2016, the pilot of a Cessna 150 aircraft, registered VH-RXU, was conducting cattle spotting operations at New Crown Station, about 270 km south-east of Alice Springs, Northern Territory. The aircraft was observed conducting turning manoeuvres over the cattle at a reported altitude of about 500 ft.
While conducting a right turn at low altitude, the pilot lost control of the aircraft and was unable to recover before impacting terrain. The pilot was the sole occupant on-board the aircraft and was fatally injured.
While the actual events preceding the loss of control could not be concluded, the aircraft was likely operated at a slow airspeed with reduced stall margins. In the absence of other physical evidence, it was possible that control inputs made by the pilot induced a stall and incipient spin at an altitude that was not recoverable.
The sources of information during the investigation included the:
Civil Aviation Safety Authority
New South Wales Police Service
aircraft manufacturer
maintenance organisation for VH-XLK
Bureau of Meteorology
witnesses to the accident (including pilot of the accompanying recreational aircraft)
recorded data from an electronic flight bag on the aircraft.
References
Australian Transport Safety Bureau 2005. Dangerous Distraction: An examination of accidents and incidents involving pilot distraction in Australia between 1997 and 2004. Aviation Research Investigation B2004/0324.
Submissions
Under section 26 of the Transport Safety Investigation Act 2003, the ATSB may provide a draft report, on a confidential basis, to any person whom the ATSB considers appropriate. That section allows a person receiving a draft report to make submissions to the ATSB about the draft report.
A draft of this report was provided to the:
Civil Aviation Safety Authority
Bureau of Meteorology
US National Transportation Safety Board (NTSB)
maintenance provider
the pilot of the accompanying recreational aircraft.
Submissions from those parties were reviewed and, where considered appropriate, the draft report was amended accordingly.
Purpose of safety investigations
The objective of a safety investigation is to enhance transport safety. This is done through:
identifying safety issues and facilitating safety action to address those issues
providing information about occurrences and their associated safety factors to facilitate learning within the transport industry.
It is not a function of the ATSB to apportion blame or provide a means for determining liability. At the same time, an investigation report must include factual material of sufficient weight to support the analysis and findings. At all times the ATSB endeavours to balance the use of material that could imply adverse comment with the need to properly explain what happened, and why, in a fair and unbiased manner. The ATSB does not investigate for the purpose of taking administrative, regulatory or criminal action.
Terminology
An explanation of terminology used in ATSB investigation reports is available here. This includes terms such as occurrence, contributing factor, other factor that increased risk, and safety issue.
Publishing information
Released in accordance with section 25 of the Transport Safety Investigation Act 2003
Ownership of intellectual property rights in this publication
Unless otherwise noted, copyright (and any other intellectual property rights, if any) in this report publication is owned by the Commonwealth of Australia.
Creative Commons licence
With the exception of the Coat of Arms, ATSB logo, and photos and graphics in which a third party holds copyright, this publication is licensed under a Creative Commons Attribution 3.0 Australia licence.
Creative Commons Attribution 3.0 Australia Licence is a standard form licence agreement that allows you to copy, distribute, transmit and adapt this publication provided that you attribute the work.
The ATSB’s preference is that you attribute this publication (and any material sourced from it) using the following wording: Source: Australian Transport Safety Bureau
Copyright in material obtained from other agencies, private individuals or organisations, belongs to those agencies, individuals or organisations. Where you wish to use their material, you will need to contact them directly.
Preliminary report
Report release date: 08/10/2019
What happened
On 6 August 2019, at 1103 Eastern Standard Time,[1] a Liberty XL-2, registered VH-XLK (XLK), departed Moruya Airport, for a rural property near Braidwood, New South Wales (Figure 1). The pilot was the sole occupant and had been flying in company with another pilot and his aircraft on a social, multi-day touring flight of the New South Wales hinterland, alpine and southern coast regions.
The accompanying pilot landed his aircraft on a private landing area at the Braidwood property about 15 minutes prior to the arrival of XLK. That pilot advised the pilot of XLK that the landing area was undulating and not suitable for his aircraft type. At about 1126, witnesses on the ground (which included the accompanying pilot) observed XLK circling the landing area. On the second orbit, the aircraft was observed to slow and begin to lose height. At about 500 ft above ground level, and after crossing the marked end of the landing area, the left wing dropped and the aircraft entered a steep rotating descent. The pilot was unable to recover control of the aircraft before it impacted terrain.
Figure 1: Aircraft’s flight path and accident site location
Source: Google Earth. Modified by the ATSB
The witnesses at the landing area were first to arrive at the scene, however the pilot had sustained fatal injuries. The aircraft was destroyed.
Site and wreckage examination
The accident site was located in relatively flat and open farmland, approximately 9 km north-east of Braidwood (Figure 2). The ATSB conducted an examination of the site and wreckage and identified that the:
ground impact marks indicated that the aircraft had impacted terrain nose‑down, upright, with counter‑clockwise rotation
left wing separated from the airframe on impact with the terrain
flaps were in the retracted position.
No pre-impact defects were identified with the engine, flight controls or aircraft structure. The internal cabin fuel tank had ruptured and a quantity of fuel had leaked into the soil. There was no fire.
A damaged electronic flight bag was recovered from the accident site and an engine control unit was removed from the aircraft and taken to the ATSB’s technical facility in Canberra for examination.
Figure 2: Accident site
Source: ATSB
Further investigation
The investigation is continuing and will include:
analysis of the downloaded data from the engine control unit and other electronic devices
examination of the aircraft flight instruments and a stabiliser trim component
examination of the pilot’s qualifications, experience and medical history
assessment of the aircraft’s flight performance characteristics
examination of aircraft maintenance and operational records.
The information contained in this preliminary report is released in accordance with section 25 of the Transport Safety Investigation Act 2003 and is derived from the initial investigation of the occurrence. Readers are cautioned that new evidence will become available as the investigation progresses that will enhance the ATSB's understanding of the accident as outlined in this update. As such, no analysis or findings are included.
Purpose of safety investigations
The objective of a safety investigation is to enhance transport safety. This is done through:
identifying safety issues and facilitating safety action to address those issues
providing information about occurrences and their associated safety factors to facilitate learning within the transport industry.
It is not a function of the ATSB to apportion blame or provide a means for determining liability. At the same time, an investigation report must include factual material of sufficient weight to support the analysis and findings. At all times the ATSB endeavours to balance the use of material that could imply adverse comment with the need to properly explain what happened, and why, in a fair and unbiased manner. The ATSB does not investigate for the purpose of taking administrative, regulatory or criminal action.
Terminology
An explanation of terminology used in ATSB investigation reports is available here. This includes terms such as occurrence, contributing factor, other factor that increased risk, and safety issue.
Publishing information
Released in accordance with section 25 of the Transport Safety Investigation Act 2003
Ownership of intellectual property rights in this publication
Unless otherwise noted, copyright (and any other intellectual property rights, if any) in this report publication is owned by the Commonwealth of Australia.
Creative Commons licence
With the exception of the Coat of Arms, ATSB logo, and photos and graphics in which a third party holds copyright, this publication is licensed under a Creative Commons Attribution 3.0 Australia licence.
Creative Commons Attribution 3.0 Australia Licence is a standard form licence agreement that allows you to copy, distribute, transmit and adapt this publication provided that you attribute the work.
The ATSB’s preference is that you attribute this publication (and any material sourced from it) using the following wording: Source: Australian Transport Safety Bureau
Copyright in material obtained from other agencies, private individuals or organisations, belongs to those agencies, individuals or organisations. Where you wish to use their material, you will need to contact them directly.
On the morning of 1 August 2019, an Airbus A320, registered VH-VFN, was being operated as a regular public transport flight by Jetstar Airways from Sydney, New South Wales to Gold Coast, Queensland. On departure the flight crew received multiple warnings of the undercarriage not retracting completely. Despite extending and retracting the undercarriage again, the issue remained.
Meanwhile, another aircraft identified an object on the ground while taxiing at Sydney Airport and reported the sighting to the Air Traffic Control (ATC) Ground controller. The controller arranged for the debris to be collected by an airport ground car. Upon retrieval, the object was determined to be an aircraft part that was subsequently identified as an A320 main landing gear component.
ATC notified the flight crew that an aircraft part had been found. In addition, Jetstar communicated to the flight crew that the part had not yet been positively identified and advised the crew to follow their procedures. When all appropriate checks were completed, the flight crew elected to return to land at Sydney.
When it was determined the part was an apex pin of a main landing gear torque link, Jetstar Line Maintenance was concerned about the aircraft landing with the defect and attempted to contact the aircraft via radio. However, by this time the aircraft was on final approach to land and therefore not monitoring the company radio frequency. While the landing was uneventful, further damage to the left main landing gear occurred including the loss of brakes and severing of electrical sensors.
What the ATSB found
The ATSB identified that the head of the apex pin on the left main landing gear torque link failed due to cyclic fatigue. This then allowed the shank portion of the apex pin to slide out of the torque link, permitting the main landing gear axle to rotate out of alignment. The misalignment stopped the undercarriage from retracting completely and caused further damage to main landing gear components and systems during the taxi, take-off, and landing. Despite this, the aircraft landed safely.
The fatigue failure of the apex pin was the result of a crack that initiated during the quench step of the heat treatment process at manufacture. The crack was not detected during the manufacturing inspections for reasons that could not be determined. It also remained undetected during subsequent maintenance, although cracking was not specifically inspected for.
The ATSB also identified that, despite the failed part and aircraft being positively identified by elements within Jetstar, a message was unable to be conveyed to the flight crew before they returned for landing. As such, they were unaware of the true nature of the undercarriage defect and the associated risks. The additional information would have improved crew decision making.
The investigation also found that the breakdown in communication was the result of localised factors specific to this occurrence and that Jetstar has procedures in place to ensure that accurate and timely information is passed to airborne flight crew.
Finally, to enable the aircraft to be moved on the ground after the occurrence, the failed apex pin was reinstalled and temporarily held in place. This had the potential to damage the material evidence and prevent identification of the failure mode.
What has been done as a result
Airbus issued an Alert Operator Transmission (AOT) requiring recall or inspection of 1,988 apex pins. As a result of these inspections, 19 pins were removed from service due to cracking. Additionally, EASA issued Airworthiness Directive 2020-0130 mandating AOT A32N018-20 Rev 1.
Safran Landing Systems revised the manufacturing process for the apex pin prior to this failure as a result of subsequent parts being found cracked. Furthermore, they generated a design guidance document related to undercuts in heat treated parts.
Jetstar clarified non-normal operational communication guidance for ground crews in the Airport Operations Manual. This included dedicated phraseology for gaining priority on airband frequencies to relay high priority messages.
Safety messages
In this incident, the flight crew made the decision to return and land after seeking and assessing information from ground personnel relating to the landing gear malfunction. However, additional information was still being gathered. This highlights the importance of ensuring that operational processes permit coordinated, accurate and timely flow of information between ground personnel and flight crew to assist airborne decision making.
For safety investigations, preservation of evidence is vital in determining the circumstances of the occurrence and identifying safety issues that may present a hazard to continued operations. Any person involved in aircraft operations are encouraged not to put evidence at risk of further damage.
The occurrence
On the morning of 1 August 2019, an Airbus A320, registered VH-VFN, was being operated as a regular public transport flight by Jetstar Airways (Jetstar) from Sydney, New South Wales to Gold Coast, Queensland. It was the first flight of the day for the flight crew and the third for the aircraft and cabin crew. The aircraft had previously been flown on a return flight between Sydney and the Gold Coast, landing in Sydney on runway 34R.[1]
At 1020 Eastern Standard Time,[2] the aircraft was pushed back and commenced taxiing to runway 34R (Figure 1). While the aircraft was taxied to the runway, the crew of a following aircraft reported to the Sydney East Ground Controller (Ground) that they had sighted an item on the ground at the intersection of taxiways B4 and C.[3] Ground then sent an airport ground car to investigate the item, who reported 3 minutes later that the foreign object debris (FOD)[4] had been retrieved. The FOD was a metallic component, later identified to be an apex pin of a main landing gear torque link (see the section titled Main landing gear strut and Figure 2).
Figure 1: Airport map – Sydney Kingsford Smith
Source: Airservices Australia, modified and annotated by the ATSB
At 1038, VH-VFN took off, and after retraction of the undercarriage, the flight crew received numerous messages on the electronic centralised aircraft monitoring (ECAM) system,[5] two of which were ‘L/G DOORS NOT CLOSED’ and ‘L/G GEAR NOT UPLOCKED’. The captain elected to continue the climb out over the sea. The flight crew informed air traffic control and requested vectors to an area where they could troubleshoot the problem. They then cycled the undercarriage to the extended and then retracted positions however, the issue remained.
At 1042, Ground simultaneously contacted two Jetstar aircraft taxiing for take-off. They were instructed to contact their engineering department as ‘one of the safety officers has found a large piece of metal at the juncture of Bravo 4 and Charlie and it is believed to be from a Jetstar 320…’.
Figure 2: Apex pin as recovered from taxiway
Source: Jetstar Safety Department, annotated by the ATSB
At the same time, the Sydney Departures controller (Departures) informed the flight crew of VH‑VFN of a ‘large piece of metal’ found on a taxiway. The flight crew then told Departures they required a return to the airfield. In a follow up discussion a minute later, Departures informed the flight crew ‘they believe it might be a part of the landing gear’ to which the captain responded, ‘that would make sense’. Shortly after the aircraft entered a holding pattern off the coast.
At around 1048, a ‘hard stop’[6] order was placed on departing Jetstar aircraft by the company as a result of the discovery of the apex pin on the taxiway.
At 1054, Departures advised VH-VFN to expect an approach to runway 25 when they were ready, but the first officer (FO) requested runway 34L because they were unsure about the serviceability of the brakes.[7] At this point, the FO confirmed that they had approximately 80 minutes of endurance.
In addition to the communication with Departures, the flight crew also contacted Jetstar’s Sydney line maintenance (Line Maintenance) via radio several times to discuss the landing gear issue. Around 1055, an engineer communicated to the flight crew that a part had been found but it had not been positively identified. They advised the crew to follow their standard operating procedures.
At 1059, believing there would be no further details from Line Maintenance, the aircraft left the holding pattern and was given vectors for an approach to land. The flight crew requested the airport’s emergency services be put on a local standby.[8]
Around this time, Line Maintenance concluded the part was an A320 main landing gear (MLG) torque link apex pin and the Line Maintenance Supervisor (LMS) raised their concern with the Maintenance Operations Centre (MOC)[9] about the aircraft landing with such a fault. The MOC sought more information from the LMS. However, by the time MOC agreed with the LMS’s concerns, the aircraft had safely landed.
At 1110, the aircraft landed and stopped on taxiway B9 (Figure 1) where it was inspected by the airport’s Aircraft Rescue and Fire Fighting service fire commander. During the radio conversation between the fire commander and the FO, the FO discussed having a landing gear issue and that the aircraft was pulling to the left. The fire commander indicated that from their position in the vehicle, there were no visible issues with the aircraft.
The aircraft was then taxied on taxiway B to just short of taxiway B4 where Line Maintenance personnel inspected the MLG. The inspection found the left MLG[10] torque link apex pin was missing along with two bolts from the associated damper unit (Figure 3). A brake hydraulic hose was also frayed to the point of allowing fluid to escape. The aircraft was then slowly towed to the gate.
Figure 3: Main landing gear torque link assembly upon landing
Source: Jetstar Safety Department, annotated by the ATSB
After passenger disembarkation, the aircraft was to be towed to a hangar for inspection and repair. To reduce the potential for further damage, and as no spare apex pin was available, the failed pin was reinstalled and temporarily secured in place to ensure the landing gear stayed correctly aligned.
The following afternoon, the missing head of the apex pin and one damper bolt (Figure 4) were found by airport staff adjacent to the T3 intersection of runway 34R. Fifteen days later the second missing damper bolt was found during a routine FOD inspection of runway 34R.
Figure 4: A damper bolt and head of apex pin retrieved from runway 34R
Source: Jetstar Safety Department, annotated by the ATSB
Quick Access Recorder (QAR) data (Figure 5) was retrieved from VH-VFN for the incident and prior flights. A review of the data from the previous two flights did not identify any anomalies.
Figure 5: Recorded data for the complete flight
During the initial climb on the incident flight, the aircraft did not successfully complete a full undercarriage retraction sequence, with the aircraft failing to sense the MLG up locks engaging and the gear doors closing. Approximately 90 seconds later the undercarriage extension/retraction was cycled with the landing gear being selected down successfully and then reselected up. Again, the aircraft failed to record a complete retraction of the MLG.
QAR data also showed that, on the taxi to the departure runway, left and right wheel brake applications were matched by temperature rises in the corresponding brakes. This was indicative of the brakes working correctly. On landing, despite application of both brakes, only the right wheel brake temperatures rose while the left brake temperatures continued to cool, implying the left wheel brakes were not functioning.
The aircraft manufacturer advised that an aircraft would remain directionally controllable at high speed due to the effectiveness of the fin and rudder, and at low speed with the nose wheel steering. With medium autobrake and the brakes of one wheelset failed, the calculated aircraft braking distance required increased from 1,360 m to 1,540 m. Sydney Kingsford Smith Airport runway 25 is 2,530 m and runway 34L is 3,962 m.
Electronic Centralised Aircraft Monitoring System data
The Electronic Centralised Aircraft Monitoring (ECAM) system displays messages to the crew via a dedicated interface and also sends the messages via the Aircraft Communications Addressing and Reporting System (ACARS)[11]to the operator’s Maintenance Watch.[12] The following ECAM messages related to the undercarriage were presented on the incident flight.
Table 1: ECAM Messages
Phase
Date & Time (Local)
Title
05 – Lift Off
01 Aug 19 – 1039
L/G DOORS NOT CLOSED
05 – Lift Off
01 Aug 19 – 1039
L/G GEAR NOT UPLOCKED
06 – Cruise
01 Aug 19 – 1039
BRAKES RELEASED
06 – Cruise
01 Aug 19 – 1106
BRAKES ALTN BRK FAULT
06 – Cruise
01 Aug 19 – 1106
BRAKES RELEASED
08 – Touch Down
01 Aug 19 – 1110
L/G SYS DISAGREE
09 – 80kts
01 Aug 19 – 1110
BRAKES – N/WS MINOR FAULT
Source: Jetstar Safety Department. Only messages relevant to the undercarriage and wheel brake systems are listed here. Other messages that are not of a consequence to this incident were removed for clarity.
‘L/G DOORS NOT CLOSED’ is a high priority message whereas ‘L/G GEAR NOT UPLOCKED’ is a low priority message. Higher priority messages are listed and actioned first. The order of messages may have reinforced to the flight crew that the landing gear door was at fault. Instead, the landing gear door fault was most likely a consequence of the MLG failing to uplock due to the wheels not being in proper alignment.
While not providing specific information about the nature of the fault to the flight crew, the ‘BRAKES ALTN BRK FAULT’ message reflected the system sensing the damage to the left wheel brakes.
Aircraft information
The Airbus A320 is a twin-engine, narrow body transport category aircraft that seats up to 186 passengers (depending on configuration). VH-VFN was manufactured in 2013 and had completed 21,256 flight hours and 11,687 flight cycles.
Main landing gear strut
The aircraft has a conventional tricycle undercarriage arrangement. Each retractable main landing gear (MLG) consists of two wheels and brake assemblies, on a common axle centreline, one each side of the landing gear strut (Figure 6). Rotation of the oleo-pneumatic strut is constrained by a torque link on the forward side between the two wheels.
The apex pin of the torque link connects the upper and lower torque link. This allows rotational torque loads to be transmitted between the landing gear strut and axle, while allowing free vertical movement of the shock absorber contained within the strut.
Figure 6: MLG assembly and exploded torque link assembly
Source: Airbus S.A.S. A320 series IPC Figure 32-11-11-52G (Sheet 1), modified by the ATSB
The apex pin also passes through a damper unit that attaches to the upper torque link. The head of the pin is protected from the environment by a rubber dust cap. The tail of the pin, nut, washer and locking pin assembly are protected by a coating of polysulfide sealant.
The upper and lower torque links also act as carriers for hydraulic brake hoses and an electrical harness connecting to equipment on the axles. Another link, known as the slave link, is fitted to the aft side of the strut and supports more hydraulic hoses and electrical wiring but is not designed to perform any anti-rotation function.
Aircraft damage
Detailed inspection of the aircraft MLG after the flight determined that, in addition to the failed apex pin, other items on the MLG were missing or damaged. These included:
three hydraulic hoses damaged or frayed by contact with the wheel rim, with one hose leaking
scoring damage to the apex damper unit following contact with the wheel rim and tyre, and two missing through bolts
scoring damage to wheels, tyres and brakes from contact with the upper torque link and damper unit
a cut wiring harness
bending of the slave link.
The tyre treads had evidence of diagonal scoring which indicated that the MLG had not remained aligned with the aircraft during the landing.
Apex pin
Manufacturing process
The apex pin was manufactured from high strength steel in 2012. During its manufacture, the pin was initially roughly machined to oversize, heat treated to improve mechanical properties, and then machined to final size. The final machining included providing an undercut relief radius between the shank and the head, and formation of the head shape. Subsequently, parts of the pin underwent plating and corrosion protection processes. The part was subject to various manufacturing inspections, including a magnetic particle inspection (MPI),[13]> which it passed (Manufacturer’s investigation).
Maintenance inspections
The MLG on the aircraft was last inspected in November 2017 as part of the aircraft’s maintenance program (AMP) 2C heavy maintenance inspection. During that assessment, the torque link was dissembled. The relevant inspection task required a check for excessive play in the hinge joints of the assembly, which it passed. The task did not require a visual or other non‑destructive inspection (NDI) of the apex pin. With Jetstar utilisation of VH-VFN, the 2C heavy maintenance inspections occurred approximately every 2.5 years and the pin had undergone this maintenance task twice.
The maintenance program also required the undercarriage to be overhauled every 10 years or 20,000 flight cycles (FC), whichever occurred first. The overhaul included disassembly of the undercarriage, with the apex pin inspected in detail and subject to an MPI if repaired. VH-VFN had yet to reach this overhaul requirement.
The apex pin had a life limit of 60,000 FC.
Pre-flight inspection
The first officer (FO) conducted the required pre-flight walkaround inspection for the incident flight which included the MLG wheels, tyres and strut. The FO did not report any anomalies with the inspection.
Licenced Aircraft Maintenance Engineers (LAME) were responsible for inspections of the aircraft on the first flight of every third day. The occurrence flight was the third flight of the day, so no formal inspection of the aircraft was carried out by a LAME.
Rectification action
Approximately two months prior to this occurrence, a European-operated A320 had an apex pin failure. Upon notification of both events, the landing gear manufacturer was advised, and an investigation launched. The pin was identified as being from the same manufacturing batch as the one installed on VH-VFN. This pin had accumulated 12,340 flight cycles. Due to the two pin failures, Airbus recalled the remaining 10 pins from this batch via individual contact with operators. Cracking was subsequently identified in five of those pins.
As a result, Airbus issued Alert Operators Transmission (AOT)[14] A32N018-20 to operators worldwide on 23 January 2020, which recalled two batches either side of the initial batch (48 pins). The affected pins were requested to be removed at the earliest opportunity. As a result of this action, 15 pins were found cracked.
On 27 April 2020, AOT A32N018-20 Rev 01 was issued to add inspections for a further 1,940 pins. Apex pins serial numbers added in this revision were requested to undergo an MPI at the operator’s maintenance facilities. This action was reviewed by the European Union Aviation Safety Agency (EASA), and on 8 June 2020 EASA issued Airworthiness Directive (AD) 2020‑0130, which mandated compliance with Airbus AOT A32N018-20 Rev 01.
In August 2020, as part of inspections required by EASA AD 2020-0130, Jetstar identified a total of 12 aircraft with apex pins, and one spare part, listed in the Airworthiness Directive that required inspection. Jetstar found one additional cracked apex pin during the conduct of these inspections. That pin had acquired 13,402 flight cycles and was listed in Appendix 4 of AOT A32N018-20 Rev 01. The serial number indicated it was manufactured prior to the other identified fractured pins.
The ATSB identified three other occurrences overseas where pins in service listed in Appendix 4 of AOT A32N018-20 Rev 01 had been found cracked and reported.
Manufacturer’s investigation
The failed apex pin shank and head from VH‑VFN, which had accumulated 11,687 flight cycles, were sent to the MLG manufacturer, Safran Landing Systems (Safran) for inspection and analysis.
Safran conducted an investigation that included a detailed examination of the fractured parts. It concluded the cracks were initiated during manufacture of the parts and the parts failed due to cyclic fatigue. The investigation reviewed both the manufacturing processes and inspections.
Manufacturing process
Safran determined that the small radius under the head of the initial machining introduced a stress concentration during a subsequent heat treatment quench hardening process,[15] that in some pins, resulted in the formation of a crack. The crack plane was found to align with the initial machined undercut (Figure 7). Despite a final machining process removing more material and providing a large relief radius under the head, some cracks were large enough so as not to be eliminated. Temper discolouration on the crack surface of some returned pins was indicative of the crack being initiated either during the quench process, or between the quench and temper steps of the heat treatment activities.[16]
In summary, Safran concluded the cracks were initiated during the manufacturing process and were not caused by environmental effects in service.
The vast majority of apex pins in service were inspected as part of the AD and found not cracked (Rectification action). Safran determined that this disparity was likely associated with manufacturing variations including tool sharpness, surface finish and quench bath temperature, even though those variations were within allowable limits.
In 2014, some apex pins were found cracked during a manufacturing inspection. With no evidence of prior inspection failures nor cracks being found in-service, no action was taken against parts already produced. However, in response to the defective batch, the initial radius under the head of the machined pin was increased.
Additionally, in 2018 the company generated a design guidance document for radii in high strength steel parts prior to heat treatment in response to inspection failures in different parts.
Figure 7: Crack location
Source: Airbus S.A.S. modified by the ATSB
Manufacturing inspection
In accordance with Safran manufacturing procedures, apex pins underwent inspections during, and after, manufacture but before being released to service to ensure the part conformed to design specifications. Because the component was heat-treated to improve mechanical properties, the pin underwent an MPI. All pins in the occurrence batch passed the MPI inspection. That batch contained both pins that failed in service and five others subsequently found cracked.
The manufacturer’s investigation found that the inspector who conducted the MPI inspection on the batch of parts met qualifications, performance reviews, audits, eyesight requirements and had demonstrated their ability via MPI rejection of other parts. No personal circumstances were identified that may have influenced the ability of the inspector to detect cracked components and the organisation’s on time performance, capacity and production changes were also assessed with no unfavourable results. Part‑specific NDT technique and MPI process controls were also checked and found to conform to specification requirements.
Communications during the flight
Jetstar Operations Control Centre (JOCC) was responsible for the coordination and day‑to‑day running of the aircraft fleet. The JOCC used company HF frequencies and satellite communications to pass updated weather and operational changes to aircraft in flight. These means of communication were also used by flight crew to seek engineering support from the Maintenance Operations Centre (MOC) who had a Duty Technical Manager (DTM) at the JOCC.
Jetstar also utilised company VHF airband frequencies at major airports to pass operational information to crews of aircraft on the ground as well as those airborne in the local vicinity. Flight crew could also use this local VHF frequency to advise engineers at the airport of maintenance issues with their aircraft. Jetstar policy was that for any abnormal operations or delays, the JOCC would coordinate communications and be responsible for the company response. Thus, the JOCC was the primary point of contact in the event of any abnormal operations.
Flight crew could use company frequencies at certain times of the flight, however, during take-off and approach to land, sterile flight deck procedures[17] were in place and flight crew did not monitor company radio frequencies, nor use ACARS.
Communication timeline
The following timeline of the occurrence and the communications during the incident was developed from multiple sources, mainly telephone calls and ATC VHF radio call records. As the Jetstar company VHF radio calls were not recorded, the times are approximate.
Table 2: Timeline
Event
Time (local) (hh:mm:ss)
Elapsed Time (mm:ss)
Time until Landing (mm:ss)
Apex pin detached from VH‑VFN
10:24:40 *
-
45:54
FOD reported on taxiway C by the crew of a following aircraft
10:25:59
1:19
44:35
FOD picked up by airport ground personnel (Car 4)
10:29:30
4:50
41:04
A Jetstar aircraft crew informed Jetstar Engineering of FOD report
10:30:00 *
5:20
40:34
VH-VFN take off
10:38:26
13:20
32:08
Car 4 informed ATC of the nature of part found on taxiway. First indication the FOD was an aircraft part
10:39:44
15:04
30:50
ATC asked taxiing aircraft JQ764 and JQ912 to contact their Engineering department
10:42:05
17:25
28:29
ATC informed the crew of VH-VFN of an aircraft part found on the taxiway
10:43:18
18:38
27:16
ATC informed the crew of VH-VFN that Qantas Engineering believed it was from the landing gear
10:44:50
20:10
25:44
Part arrived at Jetstar Line Maintenance
10:47:00 *
22:20
23:34
JQ912 indicated to ATC that they had been requested to return to the gate for an inspection
10:49:15
24:35
21:19
JOCC representative, Duty Captain, Safety and Maintenance Watch group call started
10:52:49
28:09
17:45
Jetstar Line Maintenance contacted Maintenance Operations Centre (separate to group call) to advise of part found and that the crew of VH‑VFN should be contacted
10:59:00 *
34:20
11:34
VH-VFN commenced approach
10:59:24
34:44
11:10
JOCC representative, Duty Captain, Safety and Maintenance Watch group call ended
11:00:14
35:34
10:20
At the direction of the JOCC, Line Maintenance attempted to contact VH‑VFN via company frequency.
11:05:00*
40:20
05:34
JOCC representative telephoned Sydney tower #1
11:08:01
43:21
02:33
JOCC representative telephoned Sydney tower #2
11:08:52
44:12
01:42
VH‑VFN landed
11:10:34
45:54
-
* estimated
Sydney Airports Corporation Limited (SACL) Car 4 retrieved the FOD and took the part to Qantas Engineering, as the majority of aircraft using taxiway C were Qantas operated. Qantas Engineering identified the part as from an A320. As Qantas did not operate that aircraft type, they redirected SACL to Jetstar Engineering. The part subsequently arrived at Engineering about 23 minutes before VH-VFN landed.
Linking the two events
The ATC centre in Sydney linked the FOD to VH-VFN as they received information directly on both events, albeit through different controllers. This meant the crew of VH-VFN was informed an unidentified aircraft part had been found on the taxiway less than 5 minutes after the aircraft took off and only 3.5 minutes after the FOD was reported to ATC.
Information related to the discovery of the apex pin on the taxiway and VH-VFN’s MLG retraction issues were received by separate parts of Jetstar. The organisation only had a limited time to link the two events given VH-VFN would turn off direct communication channels with the company during the approach which commenced 11 minutes before the landing.
Four Jetstar personnel (Jetstar Operations, Safety, Maintenance Watch and the Duty Captain) had a group call to brief and troubleshoot the reasons for VH-VFN returning to the airport. From the ECAM messages automatically relayed from the aircraft to Maintenance Watch, they correctly identified that the failure of the MLG leg to uplock was the primary issue and that the gear door not closing was a consequence.
Given it was the third flight of the day, they ruled out gear pins[18]still being installed as a cause. They concluded, at 1100, no action was required until the aircraft landed. At that stage, this key group was unaware that the apex pin remnant had been found and been with Jetstar Line Maintenance for 13 minutes.
Shortly after the group call ended, Jetstar representatives made multiple attempts to contact VH‑VFN via company frequency which was indicative of the organisation successfully linking the two separate events.
Communication with aircraft
While airborne, the flight crew contacted Line Maintenance on the company VHF frequency at least twice. Line Maintenance informed the flight crew that a part had been found but it had not been positively identified. They further advised the flight crew to follow their procedures to manage the situation, which was in line with multiple Jetstar procedures manuals. The captain reported to the ATSB that they were frustrated that the part could not be identified.
The flight crew, having completed all checks, thinking that no further information from Line Maintenance would be forthcoming and believing it was only a gear door issue, initiated an approach for a return landing at Sydney Airport.
It was reported that contact with VH-VFN on the company VHF frequency was delayed in part due to reluctance to broadcast details over an open radio frequency. This was due the media and external persons often monitoring exchanges. It was mentioned in the company’s administration manual for personnel to be mindful of this fact.
Direct radio contact with VH-VFN was additionally complicated when the company frequency became congested due to the ‘hard stop’ call by Line Maintenance going out to taxiing aircraft. Multiple taxiing aircraft were using the frequency to determine the reason for the call back and requesting gates to return to.
By the time the JOCC, MOC and Duty Captain contacted the flight crew via Line Maintenance on the company VHF frequency regarding the criticality of the now identified part, the aircraft was on approach to land. Due to sterile flight deck procedures, the flight crew was no longer monitoring the company radio frequencies or ACARS messages. As a result, the only effective means of contacting the aircraft at that time was via ATC. ATC procedures permitted the passing of messages from the operator to the aircraft during times of an emergency however, an emergency had not been declared by the flight crew. JOCC personnel twice phoned the Sydney ATC, but no requests were made by JOCC to pass on safety critical information to the aircraft.
In response to this event, the operator advised it had clarified non-normal operational communication guidance for ground crews in the Airport Operations Manual. This included dedicated phraseology for gaining priority on airband frequencies to relay high priority messages.
On departure from Sydney the Airbus A320 landing gear failed to completely retract. Faced with limited specific information on the nature of the malfunction, the flight crew made the decision to return to Sydney, landing safely. The ATSB found that the failure of the left main landing gear (MLG) torque link apex pin, which was found on a taxiway, allowed the wheels to rotate out of proper alignment. This stopped that landing gear from retracting and caused damage to other systems on the MLG.
This analysis will examine the reason for the apex pin failure along with the associated inspections and maintenance programs for identifying defects. In addition, it reviews the actions taken by the flight crew and ground-based support infrastructure during the incident.
The ATSB found the flight crew response to the incomplete undercarriage retraction and subsequent landing was conducted in a proficient manner.
Apex pin manufacturing
The apex pins were manufactured by initially machining an oversize profile, which was then heat treated and finally machined to size including a large relief radius under the pin head. The identification of temper scale on the crack face from the heat treatment was conclusive evidence that the crack found on the occurrence pin (and several others) was induced as part of the quenching process. The initiated cracks were large enough they were not completely removed by the subsequent machining process.
While it was established that the radius of the initial machining under the head was too small to prevent heat‑related cracking, most pins did not crack. It was concluded that another factor, or factors, were required, in combination with the size of the radius, to initiate a flaw. These factors included variations in cutting tool sharpness, undercut surface roughness and/or the quenching bath temperature, even though these features may have been within prescribed tolerances.
Manufacturing inspection
The manufacturer’s investigation of the post‑manufacturing inspections focused only on the initial batch of 12 pins, two of which had failed in service and five pins were subsequently found cracked. The review of the human factors and organisational elements of the company at the time could not determine why these cracks were not found in this batch during the routine non‑destructive testing (NDT) magnetic particle inspection (MPI).
Before the manufacturer’s investigation was completed, and as a result of the airworthiness directive, 15 pins were found cracked from adjacent batches and four pins found cracked from other batches. These additional pins indicate it was unlikely cracking in pins at manufacture was a one-off event. The identification of cracks in 2014 that resulted in a manufacturing change also indicates that it was possible for cracks to be identified at manufacture.
Torque link disconnect
Following initiation of a crack during manufacture, the head of the apex pin fractured from the shank due to cyclic fatigue. The exact time of this event could not be determined. This left the apex pin shank free to migrate from the MLG upper and lower torque links thereby allowing them to disconnect just after pushback from the gate. The apex pin shank was shed onto the taxiway approximately 250 m from the pushback position.
The consequence of the torque link disconnection during the taxi and take-off was the misalignment of the MLG. During the flight the MLG was retracted twice. In both cases, either the MLG failed to lock in the retracted position or the MLG did retract successfully but the aircraft failed to sense this, i.e. sensor failure. Given the potential for misalignment without the apex pin, incomplete retraction of the MLG was considered the most likely reason. That conclusion is reinforced by the Captain’s comment regarding the unusual airflow noise. Damage to other systems including the brake lines on the MLG was further evidence the wheel set rotated out of alignment, contacting the upper torque link and adjacent equipment.
Risk analysis conducted after the incident regarding the loss of brakes on one wheel set concluded that an aircraft would remain directionally controllable at high speed due to the effectiveness of the fin and rudder, and at low speed with the nose wheel steering. The braking distances were determined to have increased by approximately 10-15 per cent.
While the disconnected torque link reduced the directional stability and braking performance due to the misaligned axle and failed left brake set, the degradation was manageable, and the aircraft landed safely. The use of runway 25 would have been acceptable, however the crew’s choice to request and use the longer runway 34L was prudent.
Flight crew decision making
The failed apex pin was collected from the taxiway approximately 40 minutes prior to VH-VFN landing. Within 15 minutes of the part being collected from the taxiway, the crew were advised by ATC that the object was likely associated with an aircraft’s landing gear. At about this time, the pin was delivered to Jetstar Line Maintenance. While Line Maintenance were identifying the part, Jetstar Operations Control Centre (JOCC) was troubleshooting the reported landing gear ‘failure to uplock‘ issue with VH-VFN. Being unaware of the failed pin and based on information available to them, the JOCC determined the aircraft could be examined after landing.
After completing troubleshooting procedures, with no additional issues identified, the flight crew elected to return to Sydney Airport. During this time, the captain requested additional information on the part found on the taxiway from ATC and Jetstar however, at the time of those requests it had yet to be positively identified. While the flight crew perceived the issue to be associated with the landing gear door, they mitigated their limited information by requesting the longer runway and for emergency services to be on standby. In this instance, these measures were not required however, they were effective in enhancing safety for a landing with an unknown problem.
Communication
For airborne Jetstar aircraft, communication with the company was primarily received and coordinated by the JOCC through HF, ACARS or Satellite communication methods. For operational reasons, the company had a local company VHF frequency at many airports that flight crew could use to communicate with local ground and engineering staff for efficient running of the business.
While this was a valid and efficient secondary line of communication, the JOCC had no visibility of these communications. For this reason, Jetstar procedures required all entities of the company to inform the JOCC of diversions, delays, or defects. Any communications with airborne aircraft beyond normal routine operational messages were required to go through the JOCC/Duty Captain to ensure consistent and appropriate messages were passed to flying aircraft.
Messages to the flight crew before the formal identification of the part followed the operator’s procedures/policy of only passing factual information to the aircraft crew. Having considered the provided information, the crew elected to return to Sydney Airport. While that decision was reasonable in the context of what the crew knew, the aircraft had 80 minutes of fuel remaining and there was no immediate urgency to return to the airport. It also meant that JOCC and Line Maintenance had a significantly reduced timeframe to identify and determine the severity of the fault. As such, an opportunity was lost for the organisation to gain a more complete picture of the situation while the aircraft was still airborne.
The company procedures prevented troubleshooting advice and non-factual information being passed to the aircraft. The policy was based on prior experiences of non-standard technical advice and workarounds being passed to aircraft, sometimes with detrimental effect.[19] However, advice to the flight crew that people on the ground were working to identify the part and a suggestion that the aircraft continue to hold until that time, if able, would have been valuable to the crew on this occasion. The captain stated in an interview that had they known the identity of the part, they would have changed their approach to the landing preparations, including preparing the cabin for an emergency landing and enacting airport emergency procedures.
Jetstar policy and procedures required Line Maintenance to notify the JOCC when it was realised the part may be from an airborne aircraft despite Line Maintenance being in contact with the flight crew. As the aircraft was airborne, it was the JOCC’s responsibility to coordinate communication with VH-VFN. While that process was essential for ensuring accurate and coordinated information was passed to aircraft’s flight crew, on this occasion, a potential message to the aircraft was delayed while the part’s identity was clarified and confirmed by the JOCC.
Following positive identification that the detached pin created a potentially hazardous situation, ground personnel endeavoured to get a message to the flight crew. However, they were unable to contact them because the flight crew had started the approach to landing and, as per procedures, stopped monitoring the company frequency. Expeditious messaging to aircraft needs to be balanced with coordinated and accurate communication.
Failed apex pin temporarily reinstalled
Due to unavailability of spares, Jetstar temporarily reinstalled the failed apex pin shank into the torque link. This action was to enable safe towing of the aircraft to the maintenance hangar however, it had the potential to damage evidence on the fracture surface. At that time, the apex pin shank was the only piece of evidence available. Ultimately, the apex pin head was located, and analysis of both fracture surfaces determined the failure mechanism.
Notwithstanding unavoidable situations, where possible, preservation of evidence is vital in determining the circumstances of an occurrence and identifying safety issues that may present a hazard to continued operations.
ATSB investigation report findings focus on safety factors (that is, events and conditions that increase risk). Safety factors include ‘contributing factors’ and ‘other factors that increased risk’ (that is, factors that did not meet the definition of a contributing factor for this occurrence but were still considered important to include in the report for the purpose of increasing awareness and enhancing safety). In addition, ‘other findings’ may be included to provide important information about topics other than safety factors.
Safety issues are highlighted in bold to emphasise their importance. A safety issue is a safety factor that (a) can reasonably be regarded as having the potential to adversely affect the safety of future operations, and (b) is a characteristic of an organisation or a system, rather than a characteristic of a specific individual, or characteristic of an operating environment at a specific point in time.
These findings should not be read as apportioning blame or liability to any particular organisation or individual.
From the evidence available, the following findings are made with respect to the landing gear malfunction involving Airbus A320, VH-VFN that occurred on departure from Sydney Airport on 1 August 2019.
Contributing factors
During the manufacture of the apex pin, the initial machined profile led to unintended stress concentrations at the quench stage of the material heat treatment process that resulted in the part cracking. The crack was not removed by the final machining process. (Safety issue)
Despite apex pins being subject to magnetic particle non-destructive inspections during manufacture, for reasons that could not be identified, this inspection did not detect the crack that was present in the occurrence pin.
The head of the apex pin failed due to cyclic structural fatigue, which led to disconnection of the left main landing gear (MLG) torque link. This left the MLG strut free to rotate out of fore/aft alignment.
Other factors that increased risk
The MLG brakes failed due to the strut rotating and a wheel contacting and fraying a hydraulic hose. This most likely occurred during take-off.
Despite the failed part and aircraft being positively identified by elements within Jetstar, a message was unable to be conveyed to the flight crew who returned for landing unaware of the true nature of the undercarriage defect and the associated risks. The additional information would have improved crew decision making.
Other findings
The undercarriage failed to fully retract by not engaging the gear uplocks and not permitting the gear doors to fully close. This was likely due to the wheels and axle being out of alignment.
The torque link disconnect, the consequential landing gear misalignment and brake failure had the potential to reduce directional control and braking performance on touchdown. However, the degradation was manageable, and the aircraft landed safely.
The failed apex pin was temporarily reinstalled by engineers to enable the towing of the aircraft off the taxiway and back to a gate for disembarkation. This had the potential to damage evidence on the fracture surface. At that time, the pin shank was the only piece of evidence available to understand the failure mechanism as the pin head had not yet been located.
Safety issues and actions
Central to the ATSB’s investigation of transport safety matters is the early identification of safety issues. The ATSB expects relevant organisations will address all safety issues an investigation identifies.
Depending on the level of risk of a safety issue, the extent of corrective action taken by the relevant organisation(s), or the desirability of directing a broad safety message to the aviation industry, the ATSB may issue a formal safety recommendation or safety advisory notice as part of the final report.
All of the directly involved parties were provided with a draft report and invited to provide submissions. As part of that process, each organisation was asked to communicate what safety actions, if any, they had carried out or were planning to carry out in relation to each safety issue relevant to their organisation.
Descriptions of each safety issue, and any associated safety recommendations, are detailed below. Click the link to read the full safety issue description, including the issue status and any safety action/s taken. Safety issues and actions are updated on this website when safety issue owners provide further information concerning the implementation of safety action.
Safety issue description: During the manufacture of the apex pin, the initial machined profile led to unintended stress concentrations at the quench stage of the material heat treatment process that resulted in the part cracking. The crack was not removed by the final machining process.
Safety action not associated with an identified safety issue
Whether or not the ATSB identifies safety issues in the course of an investigation, relevant organisations may proactively initiate safety action in order to reduce their safety risk. The ATSB has been advised of the following proactive safety action in response to this occurrence.
Additional safety action Jetstar Airways
In response to this event, the operator advised it clarified non-normal operational communication guidance for ground crews in the Airport Operations Manual. This included dedicated phraseology for gaining priority on airband frequencies to relay high priority messages.
Glossary
ACARS
Aircraft communications addressing and reporting system
AD
Airworthiness directive
AMP
Aircraft maintenance program
AOT
Alert operator transmission
ARFF
Aircraft rescue and fire fighting
ATC
Air traffic control
DTM
Duty technical manager
EASA
European Union Aviation Safety Agency
ECAM
Electronic centralised aircraft monitoring
FC
Flight cycles
FO
First officer
FOD
Foreign object damage Foreign object debris
JOCC
Jetstar Operations Control Centre
LAME
Licenced aircraft maintenance engineer
LMS
Line maintenance supervisor
MJO
Manager Jetstar Operations
MLG
Main landing gear
MOC
Maintenance operations centre
MPI
Magnetic particle inspection
NDI
Non-destructive inspection
NDT
Non-destructive testing
SACL
Sydney Airports Corporation Limited
QAR
Quick access recorder
VHF
Very high frequency
Sources and submissions
Sources of information
The sources of information during the investigation included:
the captain of the incident flight
Jetstar Airways Pty Ltd
Airbus
Safran Landing Systems
Bureau d’Enquêtes et d’Analyses (France)
Airservices Australia
Sydney Airport Corporation Limited
recorded data from the Quick Access Recorder on the aircraft.
Submissions
Under section 26 of the Transport Safety Investigation Act 2003, the ATSB may provide a draft report, on a confidential basis, to any person whom the ATSB considers appropriate. That section allows a person receiving a draft report to make submissions to the ATSB about the draft report.
A draft of this report was provided to the following directly involved parties:
the flight crew
Jetstar Airways Pty Ltd
Airbus
Safran Landing Systems
Bureau d’Enquêtes et d’Analyses (France)
Civil Aviation Safety Authority
Submissions were received from:
a flight crew member
Jetstar Airways Pty Ltd
Airbus
Safran Landing Systems
Bureau d’Enquêtes et d’Analyses (France)
The submissions were reviewed and, where considered appropriate, the text of the report was amended accordingly.
Purpose of safety investigations
The objective of a safety investigation is to enhance transport safety. This is done through:
identifying safety issues and facilitating safety action to address those issues
providing information about occurrences and their associated safety factors to facilitate learning within the transport industry.
It is not a function of the ATSB to apportion blame or provide a means for determining liability. At the same time, an investigation report must include factual material of sufficient weight to support the analysis and findings. At all times the ATSB endeavours to balance the use of material that could imply adverse comment with the need to properly explain what happened, and why, in a fair and unbiased manner. The ATSB does not investigate for the purpose of taking administrative, regulatory or criminal action.
Terminology
An explanation of terminology used in ATSB investigation reports is available here. This includes terms such as occurrence, contributing factor, other factor that increased risk, and safety issue.
Publishing information
Released in accordance with section 25 of the Transport Safety Investigation Act 2003
Ownership of intellectual property rights in this publication
Unless otherwise noted, copyright (and any other intellectual property rights, if any) in this report publication is owned by the Commonwealth of Australia.
Creative Commons licence
With the exception of the Coat of Arms, ATSB logo, and photos and graphics in which a third party holds copyright, this publication is licensed under a Creative Commons Attribution 3.0 Australia licence.
Creative Commons Attribution 3.0 Australia Licence is a standard form licence agreement that allows you to copy, distribute, transmit and adapt this publication provided that you attribute the work.
The ATSB’s preference is that you attribute this publication (and any material sourced from it) using the following wording: Source: Australian Transport Safety Bureau
Copyright in material obtained from other agencies, private individuals or organisations, belongs to those agencies, individuals or organisations. Where you wish to use their material, you will need to contact them directly.


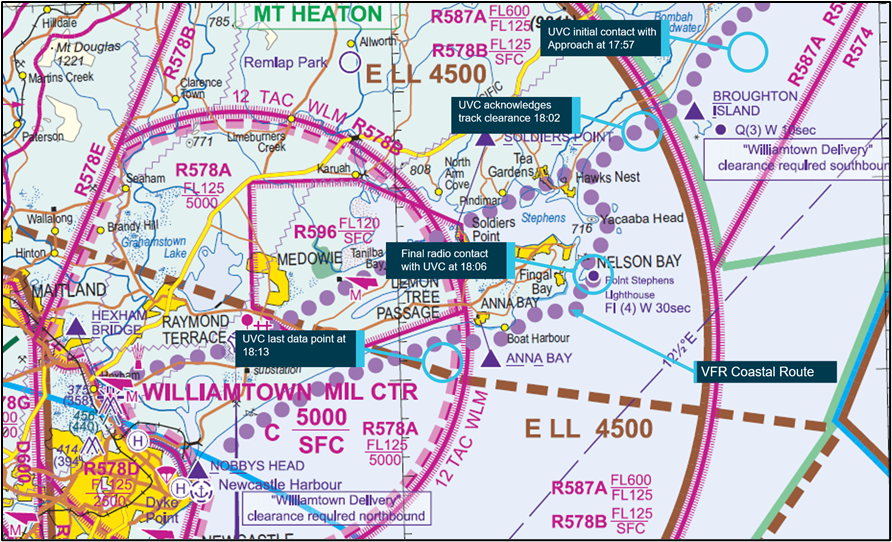
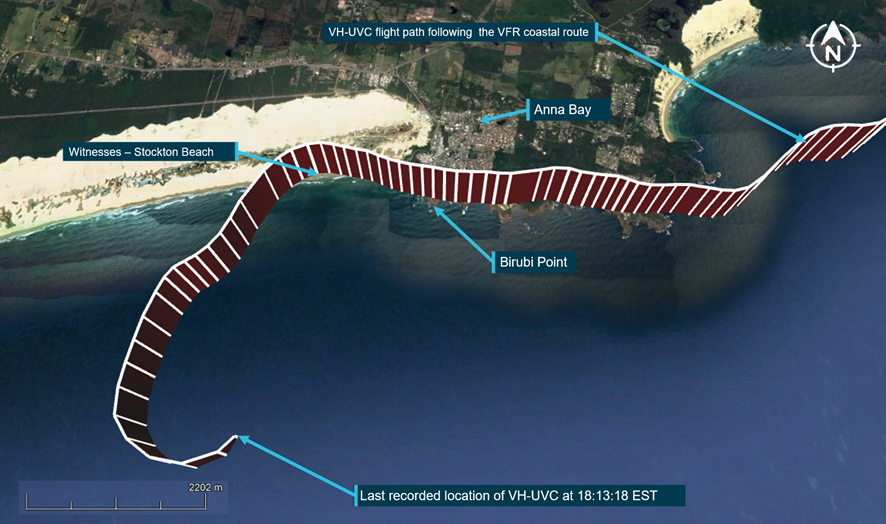
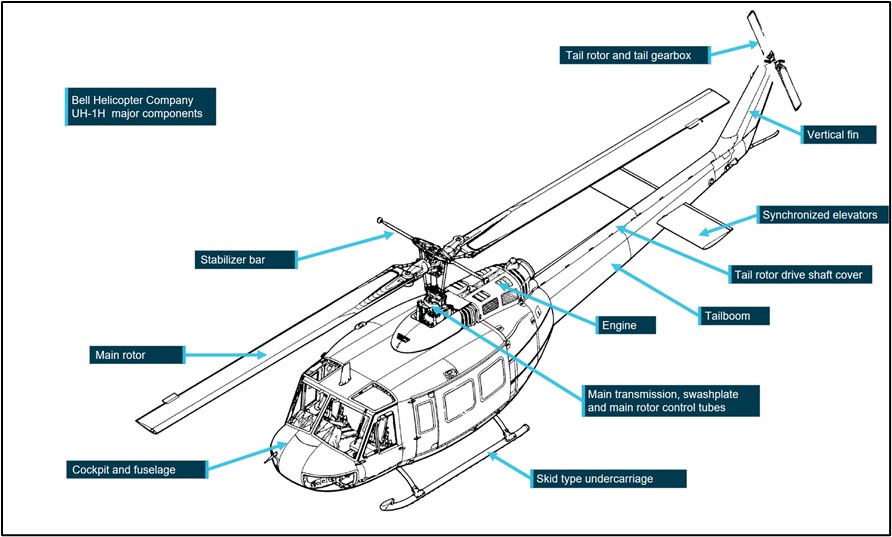
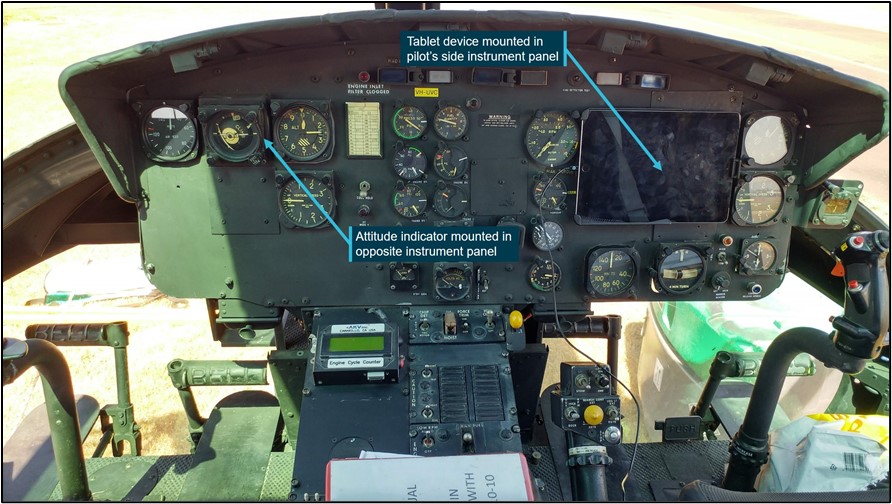
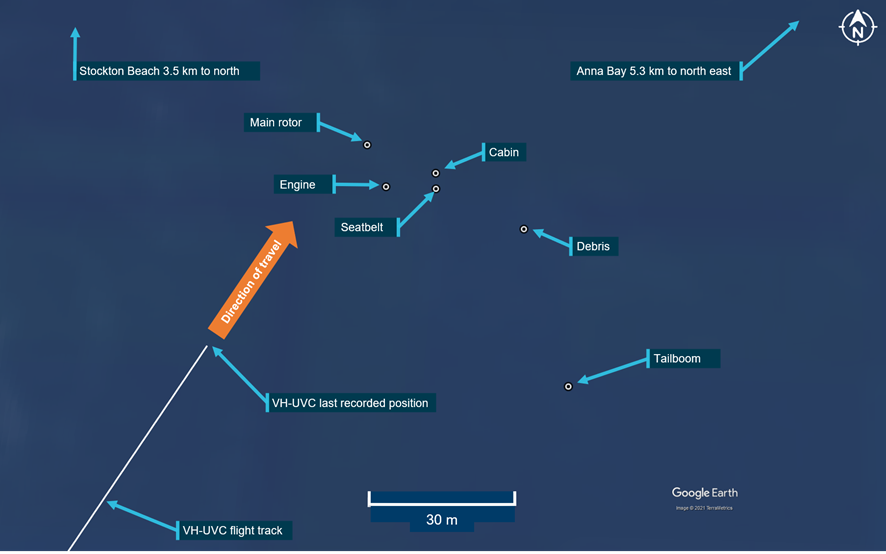
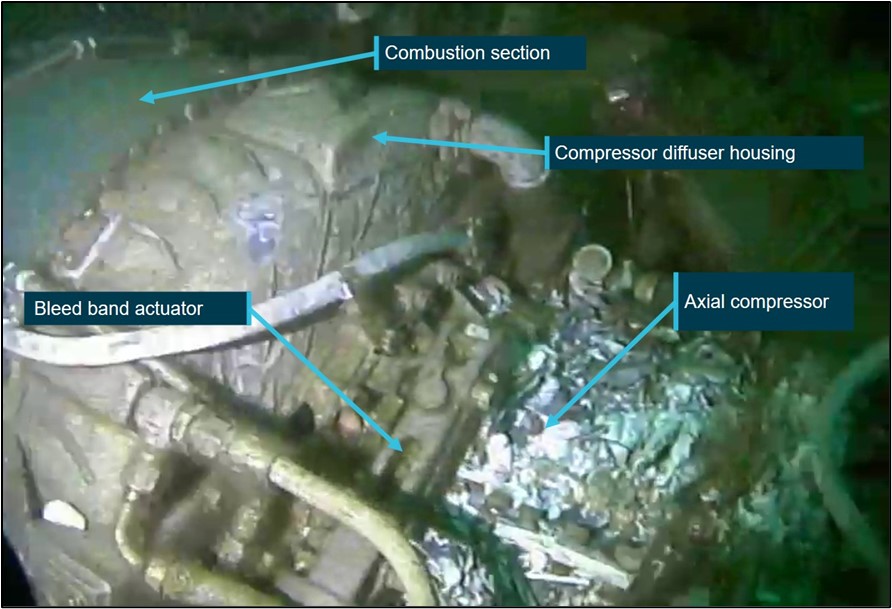
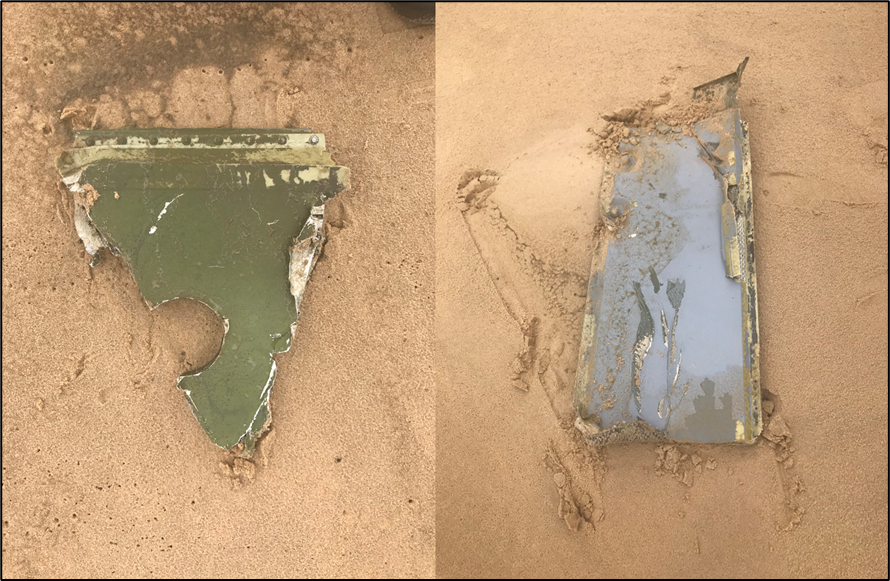
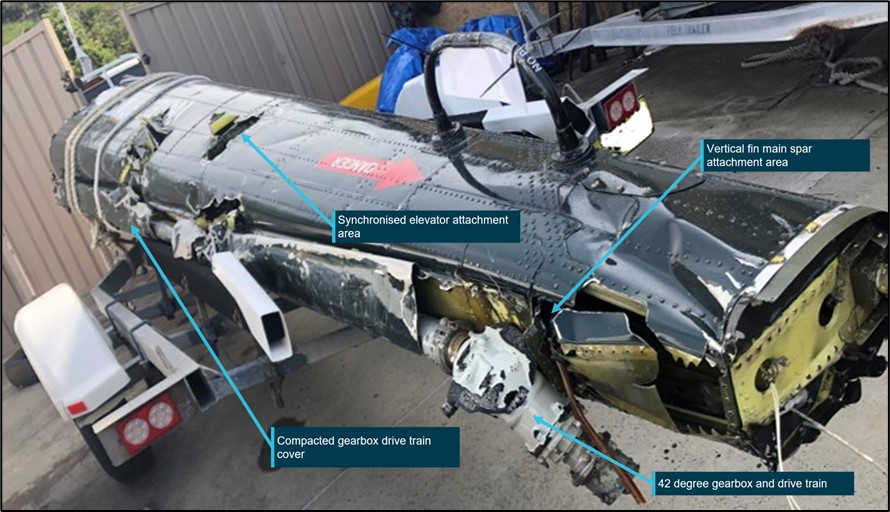
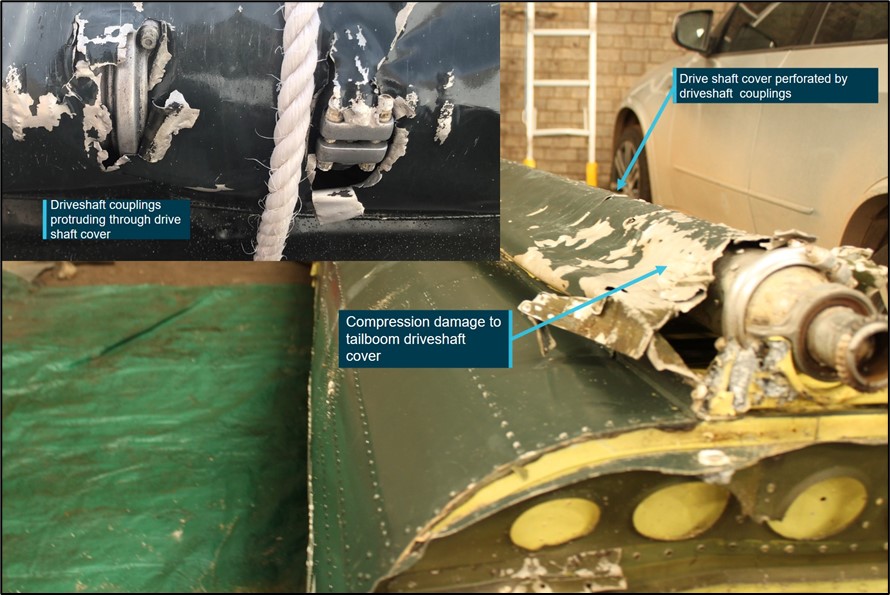
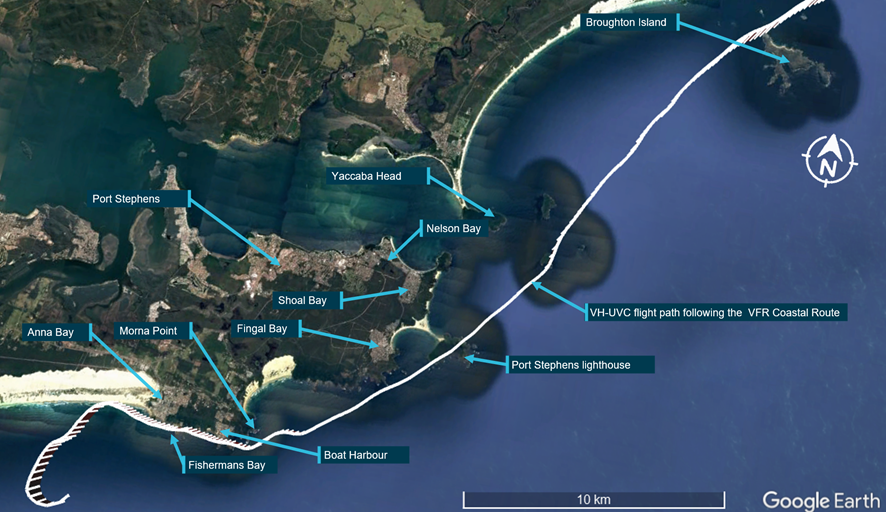
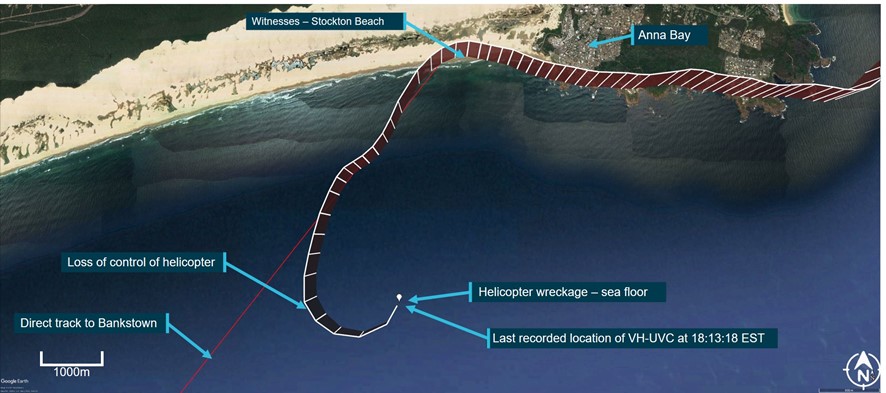
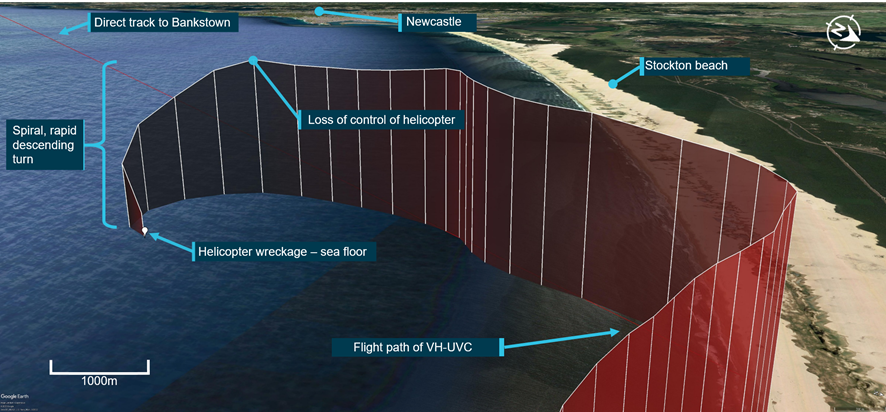
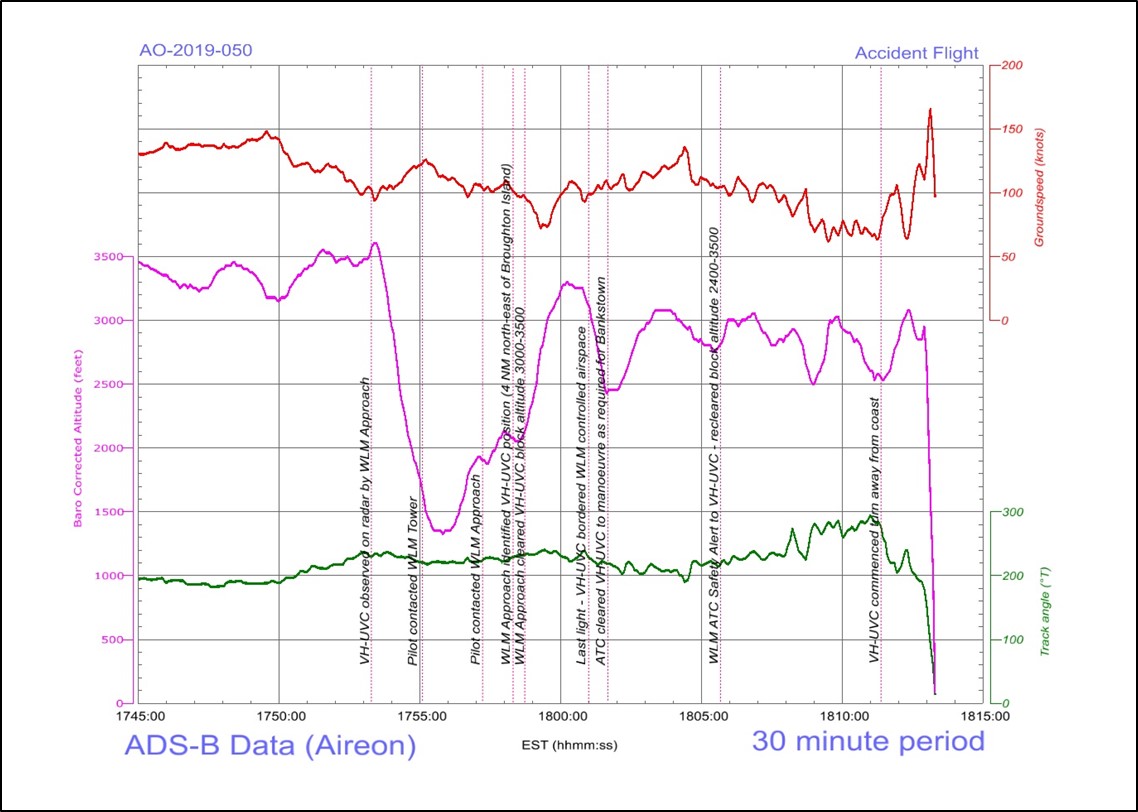
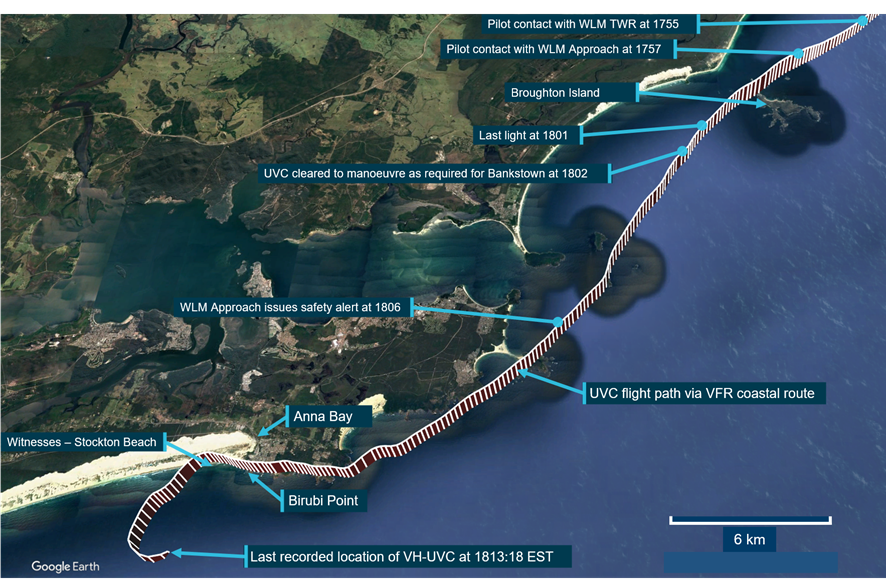
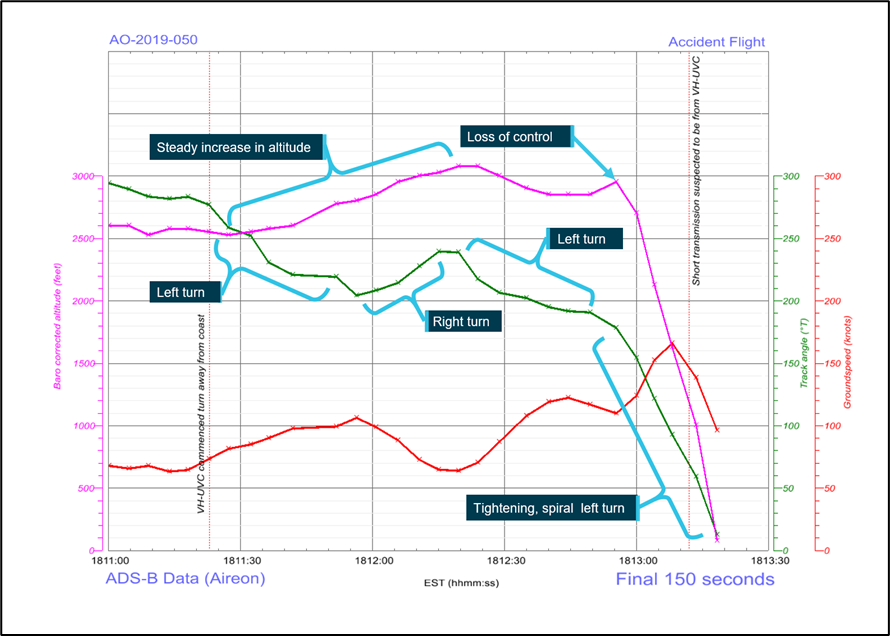
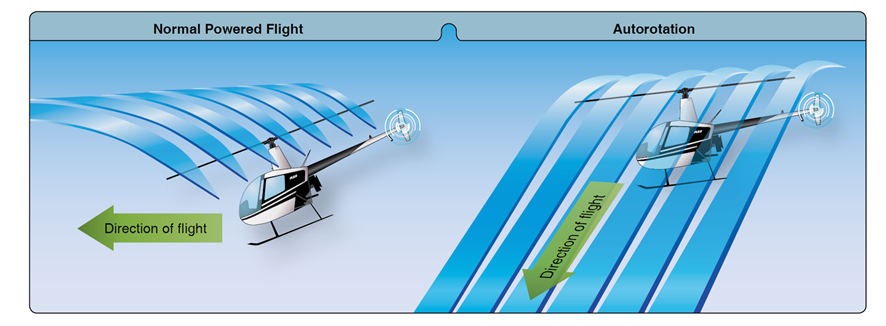

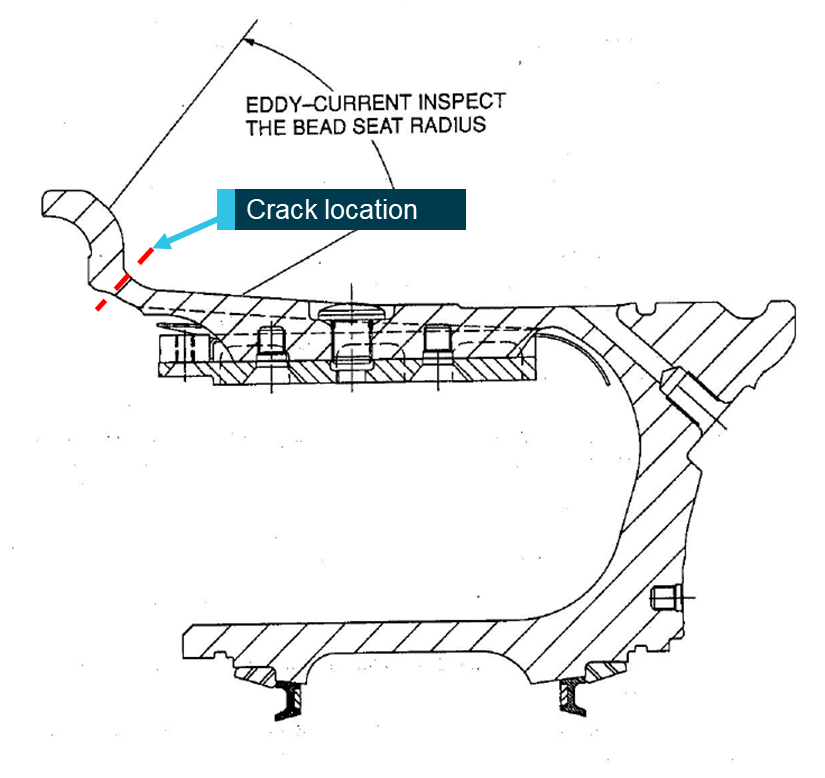
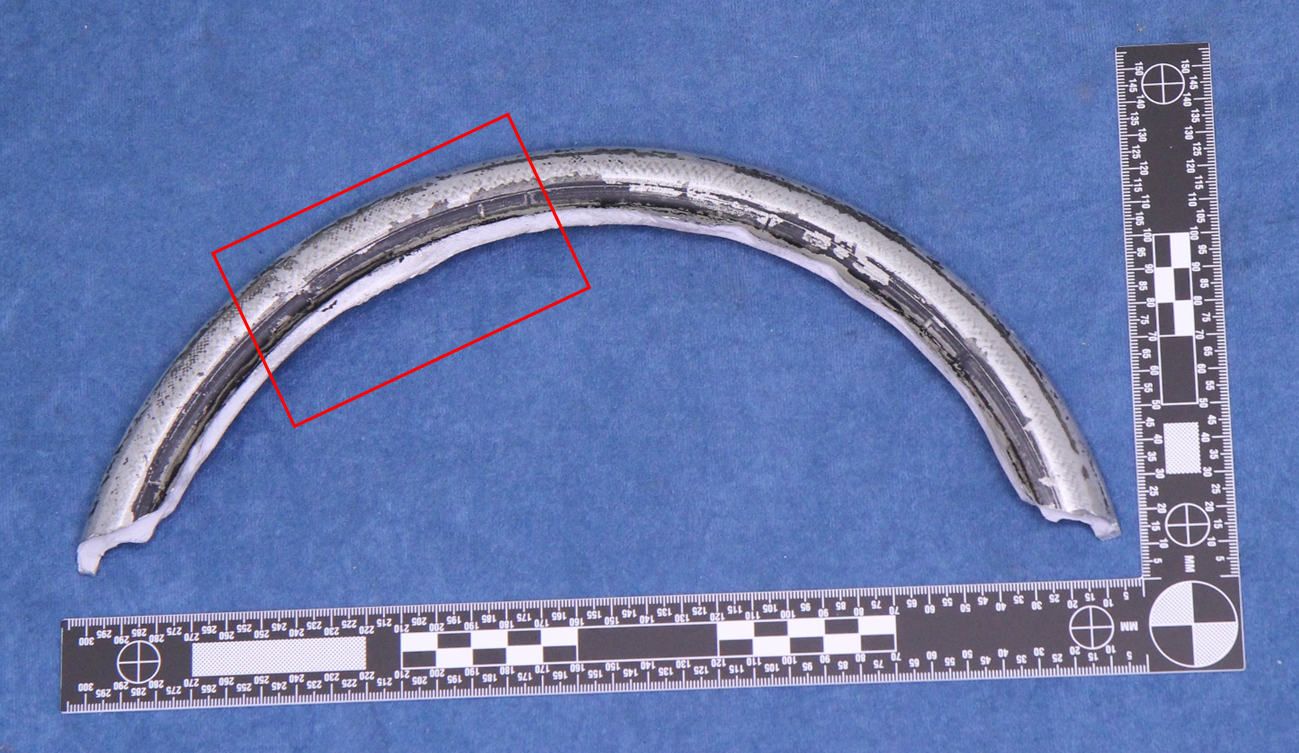
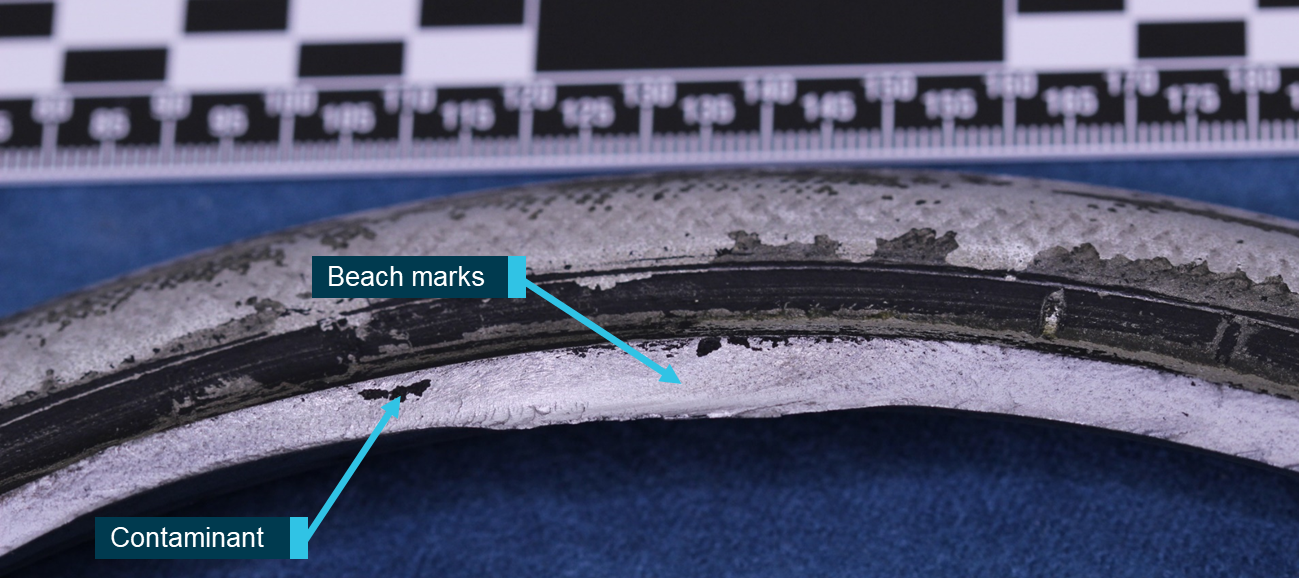
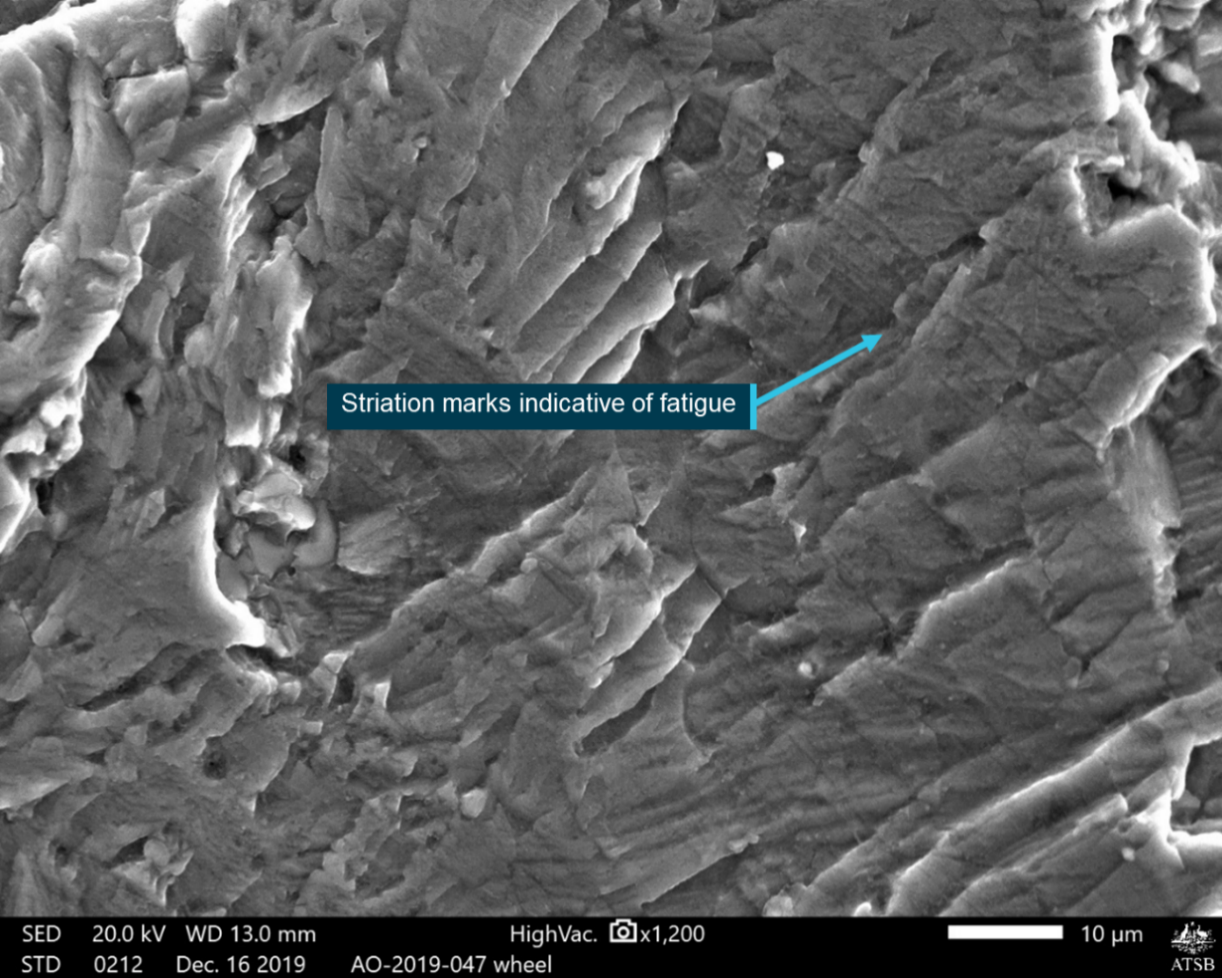
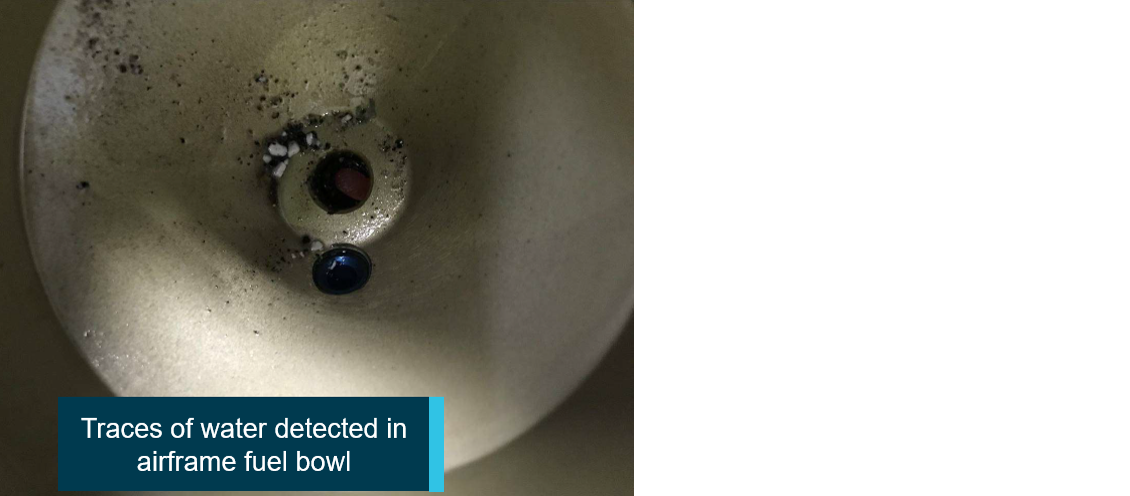
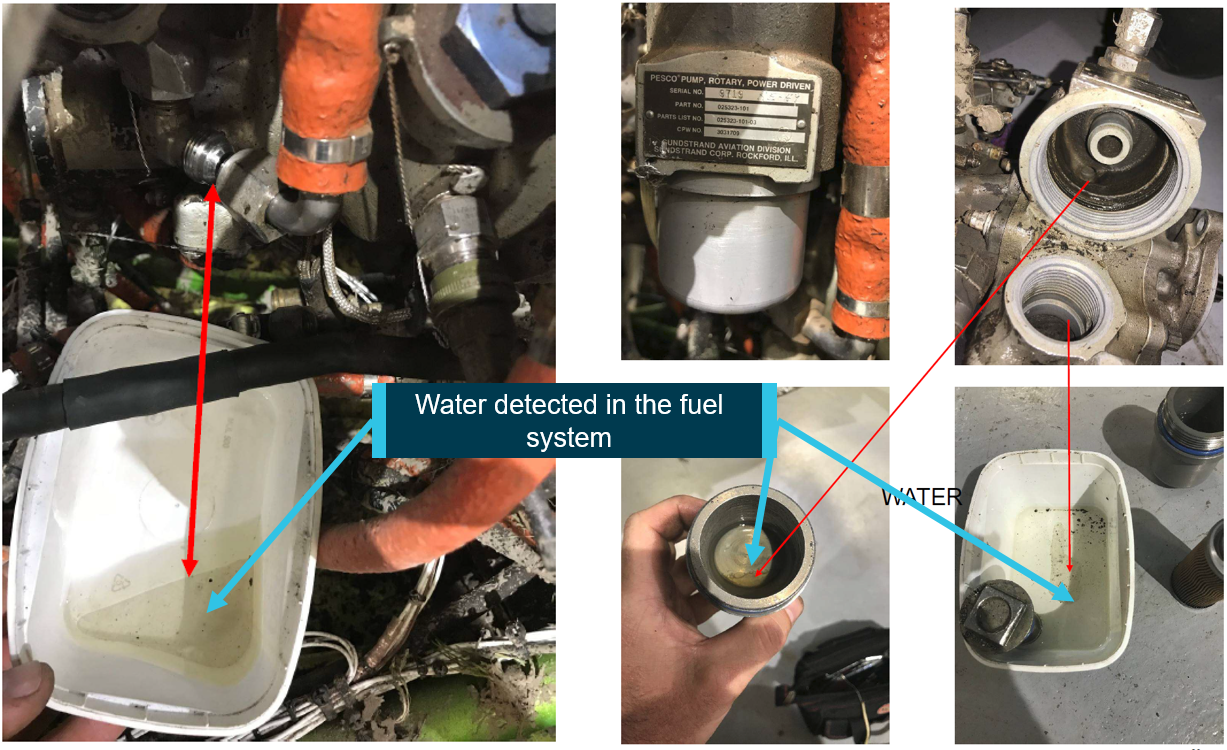
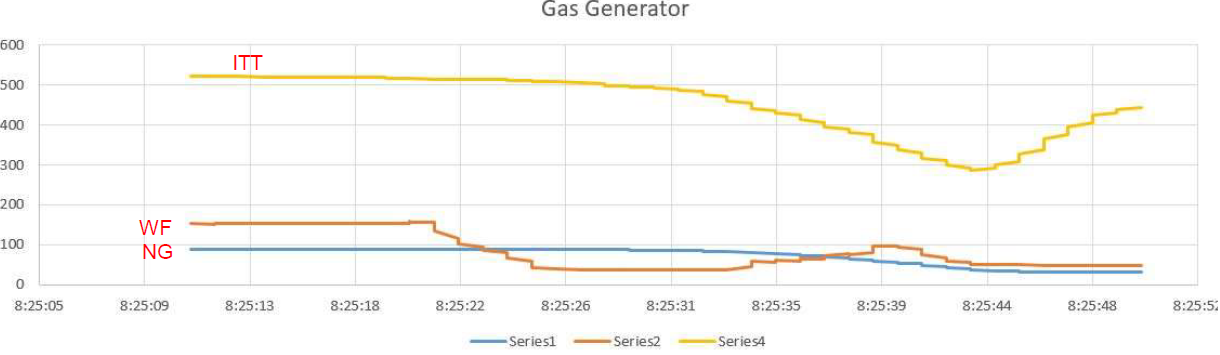
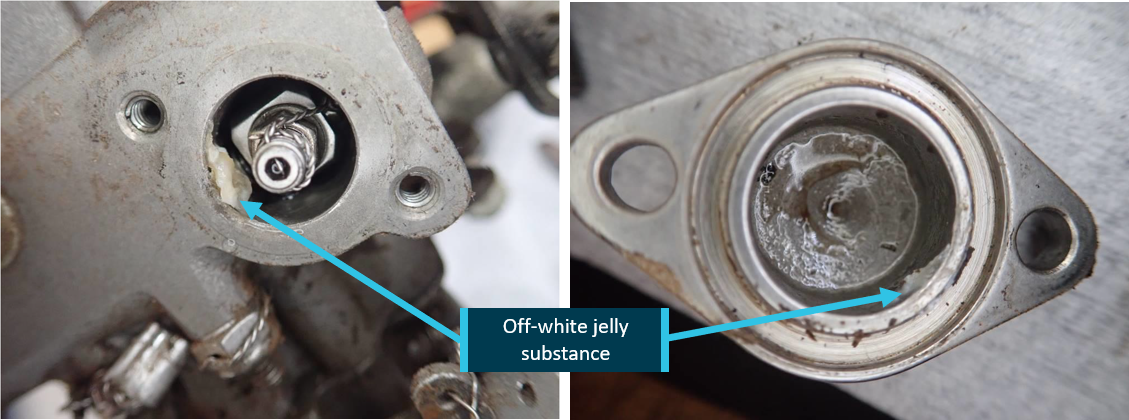
![Figure 5: Representation of an ATC display when the A330 crew was instructed to line up showing location of the A330, Dash 8 and 737 aircraft and an exemplar separation measurement (light yellow).[11]](/sites/default/files/inline-images/AO-2019-041%20Figure%205.jpg)