On the afternoon of 28 September 2021, a Fokker F100 aircraft, registered VH-FKD, departed Perth airport for a scheduled passenger flight to Laverton, Western Australia, with two flight crew, three cabin crew, and 75 passengers.
The aircraft landed uneventfully at Laverton, and the captain took control of the aircraft to taxi towards the end of the runway and complete the routine backtrack manoeuvre. The aircraft was positioned on the left-side at the end of the runway consistent with operator guidance, and the captain commenced a right turn by rotating the nose-wheel handwheel (tiller). The captain was unable to achieve full tiller rotation, even when using the force of both hands, and attempted to tighten the turn by applying the right inboard brake, and asymmetric thrust, but this did not have the desired effect. The crew decided to continue the turn, resulting in the aircraft nose-wheel briefly leaving the side of the runway, and onto the runway strip. The aircraft then returned to the runway and taxied to the terminal.
A post-flight inspection identified damaged insulation in the nose-wheel area and a torn universal joint boot on the tiller shaft.
What the ATSB found
The ATSB found that a torn boot on a universal joint probably restricted the operation of the aircraft’s nose-wheel steering system, preventing the aircraft from completing the turn on the runway. The flight crew decided to continue the turn, resulting in the nose-wheel leaving the runway surface, increasing the risk of damage to the aircraft.
What has been done as a result
The operator has commenced a fleet wide inspection of the tiller assembly universal joint boots which is expected to be completed by February 2022.
Safety message
The risk in this incident could have been reduced by availing options such as having airport staff inspecting the runway strip surface before turning onto it. When flight crews encounter such an unexpected event and there is sufficient time to assess available options, they should utilise available resources to determine the safest course of action.
The investigation
Decisions regarding whether to conduct an investigation, and the scope of an investigation, are based on many factors, including the level of safety benefit likely to be obtained from an investigation. For this occurrence, a limited-scope investigation was conducted in order to produce a short investigation report, and allow for greater industry awareness of findings that affect safety and potential learning opportunities.
The occurrence
At 1436 Western Standard Time (WST)[1] on 28 September 2021, a Fokker F100 aircraft, registered VH-FKD (Figure 1), operated by Alliance Airlines, departed Perth Airport for a scheduled passenger flight to Laverton, Western Australia, with 75 passengers on board. The crew comprised the first officer (pilot flying)[2], the captain (pilot monitoring) and three cabin crew.
Figure 1: VH-FKD
Source: Supplied
Following an uneventful landing at about 1536, the captain took control of the aircraft to taxi towards the end of the runway and complete the routine backtrack manoeuvre[3] (Figure 2). The aircraft was positioned on the left-side at the end of the runway consistent with operator guidance, and the captain commenced a right turn by rotating the nose-wheel handwheel (tiller). The captain was unable to achieve full tiller rotation, even when using the force of both hands, and attempted to tighten the turn by applying the right inboard brake, and asymmetric thrust, but this did not have the desired effect. During the turn, the aircraft nose-wheel briefly left the side of the runway, and onto the runway strip[4] – the ground area adjacent to the runway – before returning to the runway and taxiing to the terminal (Figure 3).
Figure 2: Laverton Airport
Source: Google Earth, annotated by ATSB
Figure 3: Nose-wheel tyre marks
Source: Operator, annotated by ATSB
After disembarking, the captain inspected the aircraft and nose-wheel, which appeared undamaged, and requested engineering support be flown into Laverton for a more detailed inspection. There were no injuries to passengers or crew, and subsequent inspection identified no damage to the aircraft.
Context
Captain
The captain held an Air Transport Pilot Licence (Aeroplane), and had 9,248 hours of flying experience, of which over 6,337 hours were on the Fokker F100. The captain made the following comments and observations about the incident.
The crew did not notice any nose-wheel steering issue while taxiing at Perth, but no tight turns were required.
Halfway through the turn at Laverton, the captain realised the aircraft would not make the turn on the runway but decided to continue for two reasons:
The airport had a single runway and no ground support equipment for the aircraft, so stopping on the runway would prohibit other aircraft from landing.
The ground next to the runway was compact dirt (based on knowledge of previous runway excursion incidents there).
The tiller resistance felt normal up until it could not be turned further, and then felt like pushing against a hard rubber wall. The two left turns (after the backtrack turn) during taxi back to the terminal felt normal.
The wind at the time of the runway excursion – south‑south‑east at about 8 kts – did not affect the aircraft’s turning ability as they successfully conducted tight turns in other Fokker F100 aircraft in stronger wind conditions.
Aircraft
The Fokker F100 aircraft was a regional jet produced by the Netherlands-based manufacturer, Fokker, until 1997. The Australian F100 fleet is currently the largest in the world, comprising some 66 aircraft operated by four high capacity or charter operators. The majority of the national fleet service the fly-in fly-out mining and resource industry.
Nose-wheel steering system
The aircraft’s nose-wheel steering system comprised various shafts, pulleys, and cables, which direct hydraulic pressure to turn the nose-wheel when the tiller is rotated, or when the rudder pedals are pushed. The rudder pedals provide a very limited turning angle, so the tiller is used when making most turns, and is located on the left side (captain’s side) of the aircraft cockpit (Figure 4). The tiller is connected to the steering system via a shaft fitted with two universal joints (upper and lower). The universal joints are covered by protective boots.[5]
Figure 4: Fokker 100 cockpit (exemplar)
Source: Joel Baverstock, annotated by ATSB
Post-flight repairs
The post-flight examination of the steering system at Laverton identified a correctly secured, but torn insulation blanket, which was contacting the nosewheel cable drum (Figure 5). A torn protective boot on the upper universal joint was also found (Figure 6). The insulation blanket was taped at the torn section and re-secured away from the cable drum, and the torn boot was removed. A taxi test was then successfully carried out before the return flight to Perth.
During subsequent maintenance, the torn blanket and handwheel assembly were replaced. The aircraft operator made the following findings with respect to the incident.
Based on torn insulation blanket’s inspection, the reinforcing strands of the blanket covering material were not considered to have sufficient strength to cause the tiller resistance felt by the captain.
The torn boot was suspected to have been caught in the joint universal joint, causing the resistance in the right turn and was subsequently freed during the two left turns while taxiing taxi to the terminal.
A fleet wide inspection of the handwheel assembly universal joint is expected to be completed by February 2022.
Figure 5: Torn insulation surrounding cable drum
Source: Operator, annotated by ATSB
Figure 6: Torn protective boot
Source: Operator, annotated by ATSB
Past maintenance
The nose-wheel area containing the cable drum is located behind access panels and is subject to a general zone inspection every 10,000 flight hours or 10 years, and this includes an inspection of insulation blanket condition. The aircraft last underwent this inspection in 2015. This nose-wheel area is also accessed for various other scheduled component inspections, most of which were completed in 2019. No maintenance findings in relation to insulation blankets in the cable drum area were recorded during those inspections.
The nose-wheel steering system is subject to a functional check every 5,000 flight hours, which includes a test of the torque required to turn the tiller, and steering angle achieved when turning the tiller full left and right. This check was successfully performed on the aircraft in 2019.
Safety analysis
The maintenance findings and the captain’s statement indicate that it’s likely the torn boot reduced the universal joint’s range of motion, restricting the operation of the aircraft’s nose-wheel steering. This restriction reduced the aircraft’s turning ability, preventing it from completing the turn on the runway. It could not be determined how or why the boot was torn.
Although runway strips are designed to reduce the risk of damage, there is no assurance that aircraft can safely manoeuvre on them. While the excursion onto the runway strip in this event did not result in aircraft damage, there was no assurance that the strip was clear of hazardous debris. However, had the aircraft remained on the runway, other aircraft would not have been able to land there safely, including delivery of ground support equipment to manoeuvre the aircraft along the runway. Nevertheless, options such as having the airport staff inspect the runway strip before turning on it were available.
Findings
ATSB investigation report findings focus on safety factors (that is, events and conditions that increase risk). Safety factors include ‘contributing factors’ and ‘other factors that increased risk’ (that is, factors that did not meet the definition of a contributing factor for this occurrence but were still considered important to include in the report for the purpose of increasing awareness and enhancing safety). In addition, ‘other findings’ may be included to provide important information about topics other than safety factors.
These findings should not be read as apportioning blame or liability to any particular organisation or individual.
From the evidence available, the following findings are made with respect to the taxiing excursion involving Fokker F100, VH-FKD, Laverton Airport, Western Australia, on 28 September 2021.
Contributing factors
A torn boot on a universal joint probably restricted the operation of the aircraft’s nose-wheel steering system, preventing the aircraft from completing the turn on the runway.
The flight crew decided to continue the turn, resulting in the nose-wheel leaving the runway surface.
Sources and submissions
Sources of information
The sources of information during the investigation included the:
the captain
Alliance Airlines
Bureau of Meteorology.
Submissions
Under section 26 of the Transport Safety Investigation Act 2003, the ATSB may provide a draft report, on a confidential basis, to any person whom the ATSB considers appropriate. That section allows a person receiving a draft report to make submissions to the ATSB about the draft report.
A draft of this report was provided to the following directly involved parties:
Alliance Airlines, including the aircraft captain
Civil Aviation Safety Authority.
Alliance Airlines provided a submission, which was reviewed and, where considered appropriate, the text of the report was amended accordingly.
Purpose of safety investigations
The objective of a safety investigation is to enhance transport safety. This is done through:
identifying safety issues and facilitating safety action to address those issues
providing information about occurrences and their associated safety factors to facilitate learning within the transport industry.
It is not a function of the ATSB to apportion blame or provide a means for determining liability. At the same time, an investigation report must include factual material of sufficient weight to support the analysis and findings. At all times the ATSB endeavours to balance the use of material that could imply adverse comment with the need to properly explain what happened, and why, in a fair and unbiased manner. The ATSB does not investigate for the purpose of taking administrative, regulatory or criminal action.
Terminology
An explanation of terminology used in ATSB investigation reports is available here. This includes terms such as occurrence, contributing factor, other factor that increased risk, and safety issue.
Publishing information
Released in accordance with section 25 of the Transport Safety Investigation Act 2003
Ownership of intellectual property rights in this publication
Unless otherwise noted, copyright (and any other intellectual property rights, if any) in this report publication is owned by the Commonwealth of Australia.
Creative Commons licence
With the exception of the Coat of Arms, ATSB logo, and photos and graphics in which a third party holds copyright, this publication is licensed under a Creative Commons Attribution 3.0 Australia licence.
Creative Commons Attribution 3.0 Australia Licence is a standard form licence agreement that allows you to copy, distribute, transmit and adapt this publication provided that you attribute the work.
The ATSB’s preference is that you attribute this publication (and any material sourced from it) using the following wording: Source: Australian Transport Safety Bureau
Copyright in material obtained from other agencies, private individuals or organisations, belongs to those agencies, individuals or organisations. Where you wish to use their material, you will need to contact them directly.
On the evening of 21 September 2021, a Boeing Company 787-9, registered VH-ZNJ and operated by Qantas Airways was prepared for a freight flight from Melbourne, Victoria, to Los Angeles, United States. This involved removing covers from the pitot probes and static ports, among other tasks, associated with restoring the aircraft to flight status following an aircraft ‘park’ procedure.
At about 0825 on 22 September 2021, a pre-flight exterior inspection was conducted by one of the flight crew, with no anomalies detected. The aircraft was also subject to a pre-departure exterior inspection by ground service dispatch personnel, before departing Melbourne at about 0900. The aircraft landed at Los Angeles about 14.5 hours later, following an uneventful flight. During the post-flight inspection, engineering identified that all 4 engine fan cowl static ports were covered with tape.
What the ATSB found
The ATSB found that tape covering the 4 fan cowl static ports was not removed by engineering, as per the manufacturer’s procedures, nor identified by flight crew or dispatch during pre‑departure checks. This resulted in the aircraft departing with reduced redundancy to the engine electronic control system. Despite that, the flight crew reported the flight was uneventful, and a review of the flight data confirmed there was no adverse effect to aircraft or its engine systems.
What has been done as a result
Following the occurrence, the operator distributed memos to engineering, flight and ramp crew, highlighting the location of the fan cowl static ports and that they may be covered when aircraft were parked for certain periods. The memos further reinforced the importance of following the documented engineering, pre-flight and dispatch procedures.
In addition, the operator has amended the aircraft ‘park’ and ‘restore’ engineering instructions to reference the manufacturer’s procedures. Further, these instructions will now identify the static port locations, to ensure consistency in maintenance practices.
Safety message
When performing safety‑critical tasks like aircraft maintenance, it is very important that procedures are clear and unambiguous to avoid misinterpretation and error such as occurred in this incident.
‘Remove before flight’ streamers are a reminder to remove covers, or lockout devices, prior to flight. Failure to remove these devices and covers can prevent the functionality of certain aircraft systems. In certain circumstances, the streamers may be fixed to the aircraft and not hang freely, which can reduce their visibility. Targeted inspection of locations and components, rather than relying on streamers, which can detach, can help to identify when these covers or devices have not been removed.
The investigation
Decisions regarding whether to conduct an investigation, and the scope of an investigation, are based on many factors, including the level of safety benefit likely to be obtained from an investigation. For this occurrence, a limited-scope investigation was conducted in order to produce a short investigation report and allow for greater industry awareness of findings that affect safety and potential learning opportunities.
The occurrence
Maintenance prior to the occurrence flight
On 20 September 2021, a Boeing Company (Boeing) 787-9, registered VH-ZNJ (ZNJ) and operated by Qantas Airways, was flown from Los Angeles, United States to Melbourne, Victoria, landing at 1727 Eastern Standard Time.[1] The aircraft was to remain parked at domestic Bay 11 until the next scheduled flight (the occurrence flight), about 39 hours later.
Where an aircraft was to be on the ground between 24 and 72 hours, Qantas required it to be subject to ‘normal’ parking procedures.[2] A licenced aircraft maintenance engineer (LAME 1) was tasked to park ZNJ. The park procedures included fitting pitot covers and covering the static ports, in accordance with Boeing recommendations. The 787 has 6 fuselage, 4 engine fan cowl and 4 vertical fin static ports (see the section titled Static ports). LAME 1 partially completed this task, at 1253 on 21 September 2021, fitting the pitot covers and covering the fuselage and engine fan cowl ports. Unavailability of an elevated work platform operator prevented the covering of the vertical fin ports however, LAME 1 noted this in the aircraft technical log.
Later that day, another LAME (LAME 2) was tasked to conduct the ‘restore’ procedure, to return the aircraft to flight status, along with some other scheduled maintenance. LAME 2, assisted by an aircraft maintenance engineer (AME), uncovered the pitot and fuselage static ports at about 2000. They then proceeded to complete the other maintenance tasks. Later that evening, LAME 2 noted the endorsement that the vertical fin static ports had not been covered and went back to the aircraft to conduct a precautionary check of the vertical fin. This was to ensure the ports had not been subsequently covered, but inadvertently not entered in the technical log. LAME 2 was unaware that the fan cowl ports had been covered, nor did they check.
Pre-flight ground operations
On the morning of 22 September 2021, ZNJ was prepared for a freight flight from Melbourne to Los Angeles. A third LAME (LAME 3) was tasked to complete the certificate of return to service (CRS). This included verifying all maintenance tasks had been completed and certified for. LAME 3 did not inspect the aircraft, nor were they required to as part of this procedure. The CRS was certified at about 0800, in readiness for the flight crew to arrive and commence their pre-flight checks. The flight crew consisted of the captain, two first officers and two second officers. The captain tasked one of the second officers to conduct the pre-flight exterior inspection.
At about 0825, the second officer (SO) commenced the exterior inspection at the aircraft nose, in line with standard procedures. The SO identified a pitot cover on the ground however, it could not be determined if it was from ZNJ or another aircraft. For the duration of the exterior inspection, the SO held the pitot cover, while trying to locate an engineer. Shortly after completing the exterior inspection, with no issues identified, the SO located an engineer and handed over the pitot cover. The SO returned to the flight deck and informed the captain the exterior inspection was completed, with the pitot cover the only anomaly. As the fifth crew member, the SO was seated in the cabin for take-off.
Dispatch for Qantas 787 aircraft in Melbourne was contracted to Dnata.[3] The dispatch crew member (dispatcher) conducted their walkaround inspection at about 0856, just prior to pushback. The dispatcher did not notice the fan cowl ports were covered and the aircraft subsequently departed Melbourne at about 0910.
Post-flight inspection
The aircraft landed at Los Angeles at about 0640 local time on 22 September 2021 (2340 EST), following an uneventful flight. During the post-flight inspection, a member of Qantas engineering identified that all 4 fan cowl ports were covered. The flight crew reported no abnormalities regarding aircraft performance were detected. A review of flight data confirmed that the covered ports had no effect on the operation of the aircraft during the flight.
Context
Static ports
The Boeing 787 has the following static ports:
6 fuselage, 3 each side
4 fan cowl, 2 per engine (located at approximately the 4 and 8 o’clock positions, with the fan cowl ground clearance between 68 and 80 cm)
4 vertical fin, 2 each side.
Figure 1: Static port locations (duplicated on the opposite side of the aircraft)
Source: Qantas, annotated by ATSB
Figure 2: VH-ZNJ pitot and static locations.
Source: Cooper Simmons
The fuselage static ports provide ambient air pressure data to the air data reference system (ADRS).[4] The ADRS provides primary, secondary and standby air data (airspeed, angle of attack and altitude) to the pilots' electronic flight instrument system displays, as well as other systems on the aircraft such as the engines, autopilot, aircraft flight control system. The vertical fin static ports form part of the ‘gust suppression’ system.[5]
The engine electronic control (EEC) uses the ambient air pressure data from the ADRS for engine control algorithms, engine thrust calculations and to optimise engine performance. The fan cowl static port air pressure data is only used when an EEC determines that the ADRS data is unreliable. Where no ambient pressure data is available, the EEC assigns a failsafe mode for continued engine operation.
Boeing ‘aircraft normal parking’ procedures
The Boeing aircraft maintenance manual (AMM) detailed the procedure ‘to park the airplane for less than seven days’. This procedure was to be completed within 3 days of the aircraft landing. Section B detailed the required steps, and included:
Install dedicated covers on the total air temperature (TAT) and pitot probes.
Cover the fuselage and vertical fin static ports and cover the fan cowl static ports. This step was to be completed referencing Probe locations (as noted in Figure 1) and the Static port cover procedure.
Additional covers (including engine covers) and other procedures (such as disabling electrical systems) were recommended, depending on various conditions, such as parking location and climate. Covering of static ports was to prevent the ingress of insects, dirt or other material that could affect operation of the ADRS.
A separate AMM procedure detailed the requirements to return the aircraft to operation.
Static port cover procedures
The Boeing procedure for covering all the static ports described placing one end of a metre-long piece of barricade tape[6] over the port (Figure 3). Adhesive tape sealed the top and sides of this end to the fuselage or cowl. Adhesive tape was then placed over the barricade tape at the bottom of the port, leaving an opening for moisture to drain. Finally, adhesive tape was to be applied to the barricade tape, about half length, and at the bottom end.
Boeing advised that, taping down the end of the barricade tape was intended to prevent it being torn from the fuselage by strong winds. The use of 1-metre-long red barricade tape, along with the yellow adhesive tape, was to enhance the visibility of the static port covers. Further, Boeing advised:
Covering the vertical fin and engine fan cowl static ports is recommended by Boeing. The procedures and timelines provided in the AMM are Boeing’s recommendations based on best practices. Operators can deviate from the AMM but it remains the operator's responsibility to ensure the aircraft and engine systems are adequately protected.
Figure 3: Boeing static port cover procedure
Source: Boeing and Qantas, modified and annotated by ATSB
The AMM also recommended placards[7] that stated pitot probes covered and static ports covered be fitted to the left (captain’s) control wheel. The placards were to be removed during the ‘restore’ AMM procedure however, they also alerted flight crew and maintenance personnel to the covered items should the aircraft be operated while ‘parked’, for example an engine run.
Qantas aircraft parking procedures
Qantas developed job instruction cards (JICs) for both parking, and then restoring the aircraft back to service.
The JIC for parking between 24 and 72 hours prioritised certain tasks from the Boeing procedure, including fitting landing gear downlock pins, setting flight controls to neutral selections and electrical power deactivation.[8] Pitot probe and static port covers were to be installed ‘as soon after arrival as possible’. The task ‘cover the static ports’ and ‘attach static ports covered tag’, referenced the applicable section of the AMM. Qantas utilised a locally manufactured sign for the flight deck, which combined the two tags into one placard (Figure 4).
Figure 4: Control column warning placard
Source: Qantas
The JIC also contained the following warning:
When there are covers on the [fuselage/ADRS] static ports, make sure that personnel can see that condition from the ground. Attach a tag to the left control wheel in the flight compartment to show that the static ports have covers. Covers on the static ports can cause large errors in airspeed and altitude signals. This is dangerous during flight’.
The JIC for restoring the aircraft included the tasks ‘remove all barricade tape and adhesive tape from all of the static ports’ and ‘remove the static ports covered tag. It also included a warning of adverse outcomes if these covers were not removed prior to flight. The AMM procedure for static port cover removal was not referenced in the JIC.
Maintenance on VH-ZNJ
The parking JIC was completed by LAME 1 about 17 hours after the aircraft landed, they made the following comments and observations:
prior to the parking JIC, they completed a Check 2, which included general visual inspection of the engine intake and cowling
they elected to cover the inboard fan cowl static ports with the barricade tape oriented ‘up’ as they believed orienting it down would have it positioned low under the fan cowl, reducing its visibility to someone walking around the aircraft.
Restoring the aircraft from the park configuration was completed by LAME 2 about 9 hours later in the evening. LAME 2 made the following comments and observations:
in Melbourne, prior to COVID-19, aircraft not flown for 4-5 days did not generally have pitot and static covers fitted. When aircraft were parked for longer periods, especially during the reduced flying throughout the early COVID-19 times, they were ‘parked’ with all covers fitted. Since operations started to ramp up again, they were tasked to ‘park’ aircraft within 24 hours of landing, only to reverse this procedure a short time later
the 787 is the only aircraft operated by Qantas with fan cowl ports on the outside of the engine cowl which require covering
they had rarely seen the vertical fin or fan cowl ports covered for the 24-72 hour parking and, as such, were not expecting them to be covered on ZNJ
engineering crew was reduced that night, due to illness, and the local conditions were cold, windy and rainy
when they noted the endorsement which stated the vertical fins had not been covered, they returned to the aircraft to ensure this was still the case.
Images of the covers on the 4 fan cowl static ports taken post-flight showed that while the ‘tail’ of the barricade tape was missing, the remaining adhesive tape was consistent with the Boeing static port cover procedure. The only exception being the inboard ports were covered with the tail oriented up, in line with LAME 1’s actions (Figure 5).
Figure 5: VH-ZNJ on arrival at Los Angeles, showing remains of fan cowl static port covers.
The static ports were still covered however, the remains of the ‘tail’ can be seen in the images. In addition, the images show that the inboard port covers had the tail oriented up with the outboard covers oriented down.
Source: Qantas, annotated by ATSB
Flight crew procedures
The Qantas flight crew operations manual (FCOM) described the requirements of the flight crew exterior inspection. It required that, ‘before each flight the captain or delegated flight crew member must verify that the airplane is satisfactory for flight’. The FCOM included a diagram of the inspection route (Figure 6) around the aircraft and a list of inspection items at each location. The introduction identified the overall inspection requirements including to check that:
there are no suspicious or unidentified objects.
the probes, vents and static ports are clear and not damaged.
The inspection requirements were the same for each engine and included the note to ‘check’ the ‘probes, sensors, ports, vents and drains (as applicable)’.
Figure 6: Exterior inspection route
Source: Qantas
A brief description of the major components of the ADRS was included in the FCOM. It identified that there were 6 static ports, 3 on the left and 3 on the right side of the airframe. The FCOM contained no reference to the vertical fin or fan cowl static ports.
Second officer comments
The second officer (SO) recalled that they had conducted 1 or 2 exterior inspections during their initial 787 training between December 2019 and March 2020, and then 4 or 5 since returning to flight operations in June 2021.[9] The SO reported that they were:
aware of the fan cowl ports but not that they could be covered by tape
somewhat distracted during the exterior inspection, trying to locate someone from engineering to hand the pitot cover to
of the belief that Qantas engineering conduct a pre-flight inspection prior to the flight crew arriving at the aircraft.
Dispatch procedures
Dnata had been contracted by Qantas to carry out receipt and dispatch procedures for the 787, since the aircraft’s introduction in 2017. All other Qantas aircraft types operating at Melbourne Airport had receipt and dispatch activities conducted by Qantas engineering. Dnata also provide ground services to other operators at Melbourne Airport, and on different aircraft types.
The Dnata ‘pre-departure walkaround inspection’ documentation included checking ground equipment was clear of the aircraft and all doors were closed. The inspection route was similar to that of the Qantas FCOM exterior inspection. Static port covers were not mentioned however, step 11 stated:
Pitot tubes and all other external sensors are undamaged, nor any other abnormalities on the aircraft observed (e.g. fluid leakage).
Qantas Ramp Operations Manual procedures were to be followed by Dnata staff, for receipt and dispatch of the 787. This manual identified the importance of removing the pitot covers however, there was no reference to any static covers, nor any guidance to ‘tape’ and what to do if it was observed.
Dnata dispatcher comments
The Dnata dispatcher reported that the COVID-19 pandemic had resulted in reduced crew experience level (particularly those who could dispatch aircraft) and regular roster changes. Two crews were operating that morning however reportedly, ‘it got quite busy’. Further, they advised that they:
Had been tasked to be part of the ground crew loading ZNJ, before moving to load the aircraft of another operator, with a different crew dispatching ZNJ. As they were moving to the other aircraft, they were directed to remain and dispatch ZNJ. Once ZNJ was dispatched, they were to proceed to the other operator’s aircraft.
Felt a degree of time pressure, to keep to various operator’s schedules and ‘may have failed to complete the [pre-departure] checks’.
Mostly just checked that doors and panels were closed, equipment out of the way, obvious damage etc.
Were not aware of the fan cowl static ports.
Might not necessarily question tape on the aircraft as ‘there are engineers there all the time, that is theirs, so we don’t even think to question it’.
Other information
CCTV footage
A review of CCTV footage of Bay 11 identified:
the fan cowl static port covers could be seen in certain views
overhead lighting was sufficient on both sides of the aircraft to enable LAME 2’s removal of the pitot probe and fuselage static port covers without the need for torches
no obvious interruptions while LAME 2 and the AME were removing the pitot and airframe static covers
LAME 2 and the AME walked past the engines several times while completing other maintenance tasks however, there was no indication either specifically looked at the engine fan cowls
the SO and the dispatcher did not conduct their exterior inspections in line with the documented procedures and exterior inspection route.
On 21 June 2021, a Boeing Company 787-9, registered VH-ZNH and operated by Qantas Airways, was prepared for a scheduled passenger flight from Sydney, New South Wales, to Perth, Western Australia. During initial climb, the flight crew selected the landing gear lever to UP. Shortly after, they received a warning, indicating that neither main landing gear had retracted to the ‘up and locked’ position. Despite consulting the aircraft’s electronic checklist, the flight crew were unable to resolve the retraction issue. The landing gear lever was then selected to DOWN, with positive gear extension indications, and the aircraft returned to Sydney for an uneventful landing.
The ATSB found that two of the five downlock pins, one in each main landing gear, had not been removed following towing of the aircraft to the domestic terminal aircraft bay. In addition, these gear pins were not identified during subsequent external inspections, prior to the departure. This resulted in the aircraft departing without the functionality to retract the main landing gear.
On 18 July 2018, Malaysia Airlines Airbus A330-300, registered 9M-MTK, was scheduled to operate on a regular public transport flight from Brisbane, Queensland to Kuala Lumpur, Malaysia.
Soon after landing at Brisbane Airport, covers were placed on the aircraft’s 3 pitot probes. Subsequent inspections during the turnaround did not identify the presence of the pitot probe covers and they were not removed prior to the aircraft’s departure.
After take-off, while following troubleshooting procedures for unreliable airspeed indications, the crew turned off the 3 air data reference systems (ADRS). This activated the aircraft’s backup speed scale. The flight crew also used groundspeed information from air traffic control and the aircraft’s radar altimeter to prepare for a return to Brisbane. Normal landing gear extension could not be accomplished with all three ADRs off.[10] The flight crew performed a landing gear gravity extension before conducting an overweight landing.[11]
A subsequent inspection identified that the pitot probe covers were still fitted to the aircraft’s 3 pitot probes after it landed.
Safety analysis
In this occurrence, multiple factors led to VH-ZNJ departing with the fan cowl static ports covered. Specifically:
Typical covers and lock-out devices incorporate a ‘streamer’ that hangs down and flap in the breeze. In contrast, the Boeing static port cover procedure, while including a 1 metre long tail, required this tail be taped down.
The fan cowl port covers were below eye level, making them more difficult to identify without specifically bending down to view under the engine.
While the Qantas documentation for parking the aircraft linked to the Boeing procedures, the restore instructions did not. This was a missed opportunity to assist engineers to readily access the current procedures and determine which ports were covered.
The Qantas maintenance procedures required the static ports to be covered but did not specify the locations, allowing potentially different interpretations of the procedure between LAMEs/engineers. In addition, the emphasis of the warnings was more in line with the fuselage (ADRS) static ports, rather than possible issues associated with the fan cowl or vertical fin covers not being removed. Further, as it was likely that different engineers would ‘park’ and ‘restore’ the aircraft, listing the static port locations with a separate endorsement for each, would have eased identification of which ports were covered.
The SO identified a pitot cover on the ground, at the beginning of their exterior inspection, and reported to continuing the inspection while trying to locate an engineer. It could not be determined if this distraction contributed to their non-normal exterior inspection.
The dispatcher did not conduct their exterior inspections as per the documented procedures, which reduced the effectiveness of this risk control.
Research has demonstrated that people are more likely to detect targets when they are expected and less likely to detect targets that are not expected (Wickens and McCarley 2008). In addition, bias can occur when prior knowledge, combined with an expected outcome, influences decision making. LAME 2 did not expect the fan cowl ports to be covered and, as such, did not specifically check them. In addition, the flight and dispatch crew inspections are carried out after engineering have released the aircraft for flight and typically no issues are identified. Further, the SO stated their expectation that engineering had completed an inspection. This likely led to their exterior inspections being conducted with no expectation of finding any anomalies.
Further, while not contributing to this occurrence, the dispatcher reported that, had they identified the tape covering the fan cowl ports, they may not have questioned this due to an assumption it was required.
Findings
ATSB investigation report findings focus on safety factors (that is, events and conditions that increase risk). Safety factors include ‘contributing factors’ and ‘other factors that increased risk’ (that is, factors that did not meet the definition of a contributing factor for this occurrence but were still considered important to include in the report for the purpose of increasing awareness and enhancing safety). In addition ‘other findings’ may be included to provide important information about topics other than safety factors.
These findings should not be read as apportioning blame or liability to any particular organisation or individual.
From the evidence available, the following findings are made with respect to the flight preparation event involving Boeing 787-9, registration VH-ZNJ, discovered at Los Angeles International Airport, United States on 22 September 2021.
Contributing factors
Tape covering the 4 engine fan cowl static ports was not removed by engineering, as per the manufacturer’s procedures, nor identified by flight crew or dispatch during pre-departure checks. This resulted in the aircraft departing with reduced redundancy to the engine electronic control system.
Qantas procedures did not identify all of the aircraft’s static ports and the procedure for restoring the aircraft back to service did not reference Boeing procedures. This allowed different interpretations of which ports would be covered.
Other factors that increased risk
Boeing's static port cover procedure involving the taping down of the ‘streamer’ tail, although intended to prevent it being torn from the fuselage in strong winds, likely reduced the visibility of the fan cowl static port covers.
Safety actions
Whether or not the ATSB identifies safety issues in the course of an investigation, relevant organisations may proactively initiate safety action in order to reduce their safety risk. All of the directly involved parties are invited to provide submissions to this draft report. As part of that process, each organisation is asked to communicate what safety actions, if any, they have carried out to reduce the risk associated with this type of occurrences in the future. The ATSB has so far been advised of the following proactive safety action in response to this occurrence.
Safety action by Qantas
Qantas advised of the following safety actions:
Engineering
Amended job instructions cards to link with Boeing maintenance procedures and identify static port locations.
Memo issued to engineering personnel highlighting the fan cowl static port location on the 787 aircraft.
Flight operations
Memo issued to flight operations detailing the fan cowl static ports, and that they may be covered during parking. In addition, the memo noted that engineering may not necessarily conduct an exterior inspection prior to dispatch and highlighted the importance of flight crew vigilance ‘to ensure they are an effective last line of defence in assessing the aircraft’s readiness for flight’.
Amended flight crew return to work training to include an exterior inspection video and briefing.
Ground support services
Memo issued to ramp operations staff reminding them of the importance of the pre-departure inspection and that it be conducted as per the procedures. In addition, the memo advised ramp personnel to immediately raise any concern with engineering or the flight crew.
Safety action by Dnata
Dnata advised they conducted an internal investigation. In addition, reminders have been issued to all staff during pre-shift briefings highlighting the importance of a thorough walkaround.
Safety action by Boeing
Boeing advised that, to increase visual awareness that that the fan cowl static ports have been covered, they will add a procedural requirement to maintenance manual procedures that a warning tag be added to the flight control wheel specifically stating, ‘engine static ports covered’. The revision is scheduled for release in June 2022.
Sources and submissions
Sources of information
The sources of information during the investigation included:
Under section 26 of the Transport Safety Investigation Act 2003, the ATSB may provide a draft report, on a confidential basis, to any person whom the ATSB considers appropriate. That section allows a person receiving a draft report to make submissions to the ATSB about the draft report.
A draft of this report was provided to the following directly involved parties:
Qantas, including the involved engineering and flight crew
Dnata, including dispatch crew
Boeing and the United States National Transportation Safety Board
A submission was received from:
Boeing
The submission was reviewed and, where considered appropriate, the text of the report was amended accordingly.
Purpose of safety investigations
The objective of a safety investigation is to enhance transport safety. This is done through:
identifying safety issues and facilitating safety action to address those issues
providing information about occurrences and their associated safety factors to facilitate learning within the transport industry.
It is not a function of the ATSB to apportion blame or provide a means for determining liability. At the same time, an investigation report must include factual material of sufficient weight to support the analysis and findings. At all times the ATSB endeavours to balance the use of material that could imply adverse comment with the need to properly explain what happened, and why, in a fair and unbiased manner. The ATSB does not investigate for the purpose of taking administrative, regulatory or criminal action.
Terminology
An explanation of terminology used in ATSB investigation reports is available here. This includes terms such as occurrence, contributing factor, other factor that increased risk, and safety issue.
Publishing information
Released in accordance with section 25 of the Transport Safety Investigation Act 2003
Ownership of intellectual property rights in this publication
Unless otherwise noted, copyright (and any other intellectual property rights, if any) in this report publication is owned by the Commonwealth of Australia.
Creative Commons licence
With the exception of the Coat of Arms, ATSB logo, and photos and graphics in which a third party holds copyright, this publication is licensed under a Creative Commons Attribution 3.0 Australia licence.
Creative Commons Attribution 3.0 Australia Licence is a standard form licence agreement that allows you to copy, distribute, transmit and adapt this publication provided that you attribute the work.
The ATSB’s preference is that you attribute this publication (and any material sourced from it) using the following wording: Source: Australian Transport Safety Bureau
Copyright in material obtained from other agencies, private individuals or organisations, belongs to those agencies, individuals or organisations. Where you wish to use their material, you will need to contact them directly.
On the afternoon of 16 September 2021, a Virgin Australia Airlines Boeing 737-8FE (B737) aircraft, registered VH-YIO, was conducting a scheduled passenger service from Sydney Airport, New South Wales (NSW), to Ballina Byron Gateway Airport (Ballina Airport), NSW. At the same time, a Cessna Caravan 208 (Caravan) aircraft, registered VH-YMV, taxied for a private instrument flight rules flight from Ballina Airport to Sunshine Coast Airport, Queensland.
While the B737 was on final approach to land on runway 24, the Caravan was taxied onto the runway and a take-off was commenced towards the approaching B737. The flight crew of the B737 conducted a missed approach to avoid the Caravan, during which they received a traffic collision avoidance system traffic advisory. At the closest point of approach, the lateral separation between the 2 aircraft decreased to approximately 0.9 NM with vertical separation reducing to about
700 feet. At the time of the incident, the aircraft were operating within the airport’s broadcast area and were both receiving a surveillance flight information service (SFIS).
What the ATSB found
The ATSB’s investigation identified that the Caravan pilot had an incorrect mental model of the traffic scenario, believing the B737 would land behind them on runway 06, rather than runway 24. The Caravan pilot had been provided with traffic information by the Ballina Airport SFIS controller, but the controller had not specified the landing direction of the B737 and the pilot had not sought this information.
The scenario was further compounded by the flight crew of the B737 not hearing the initial communications from the Caravan pilot, or the SFIS controller's response, and the flight crew remained unaware of the Caravan until just prior to it entering the runway. The Caravan pilot did not see the B737 approaching from the opposite direction and took-off directly towards it, resulting in the flight crew of the B737 to conducting a missed approach. No safety alert was issued by the SFIS controller as they were concerned that doing so would result in over transmitting communications from the aircraft in conflict.
The ATSB also found that the SFIS had been implemented in an area with known surveillance coverage limitations, resulting in the SFIS controller having no displayed positional information for the Caravan until it reached an altitude of about 1,500 feet. Consequently, the controller was solely reliant on radio communications for situation awareness during the period of conflict between the Caravan and B737, significantly reducing their ability to provide appropriate traffic and avoidance advice.
What has been done as a result
Although reportedly an outcome of a post‑implementation review, rather than a response to this occurrence, Airservices Australia (Airservices) advised that there was an intention to install additional technology to improve surveillance coverage in the vicinity of Ballina Byron Gateway Airport by March 2023, but that timeline was dependent on a number of factors.
Noting the indefinite timeframe, in order to support Airservices’ intended action, including complying with a related recommendation issued by the Civil Aviation Safety Authority in its Ballina airspace review, the ATSB issued a safety recommendation to Airservices to address this surveillance limitation in a timely manner.
Safety message
Safety around non-controlled airports is an area of focus for the ATSB and a SafetyWatch priority. Pilots can reduce the likelihood of similar incidents occurring by communicating directly with aircraft on the common traffic advisory frequency when services such as a surveillance flight information service are provided. Additionally, pilots and controllers alike should ensure critical information is communicated and understood in order to maintain the accuracy of shared mental models.
The ATSB also strongly encourages the fitment of ADS‑B transmitting, receiving and display devices as they significantly assist the identification and avoidance of conflicting traffic. The continuous positional information that ADS‑B provides can highlight a developing situation many minutes before it becomes hazardous – a significant improvement on both point‑in‑time radio traffic advice and ‘see‑and‑avoid’. The ATSB also notes that ADS‑B receivers, suitable for use on aircraft operating under both the instrument or visual flight rules, are currently available within Australia at low cost and can be used in aircraft without any additional regulatory approval or expense.
The occurrence
On the afternoon of 16 September 2021, a Virgin Australia Airlines Boeing 737-8FE (B737) aircraft, registered VH‑YIO (Figure 1), was conducting a scheduled passenger service from Sydney Airport, New South Wales (NSW), to Ballina Byron Gateway Airport (Ballina Airport), NSW. There were 2 flight crew, 4 cabin crew and 47 passengers on board. The captain was pilot flying (PF) and the first officer (FO) was pilot monitoring (PM).[1]
Figure 1: VH-YIO
Source: Supplied
At 1332:33 Eastern Standard Time,[2] when the B737 was approximately 44 NM to the south of Ballina Airport, the FO made an initial positional broadcast on the Ballina Airport common traffic advisory frequency (CTAF) [3] (see the sections titled Broadcast area and Common traffic advisory frequency). This broadcast was acknowledged by the Ballina surveillance flight information service (SFIS) controller (see the section titled Surveillance flight information service).
At 1335:15, the B737 FO made another broadcast on the Ballina CTAF advising that the aircraft was now 27 NM south of Ballina Airport and would land on runway 24 at an estimated time of 1345.
Meanwhile, the pilot of a Cessna Caravan 208 (Caravan) aircraft, registered VH-YMV prepared for a private instrument flight rules (IFR) flight from Ballina Airport to Sunshine Coast Airport, Queensland. The pilot was the only person on board and the purpose of the flight was to reposition the Caravan to the Sunshine Coast for parachute operations.
The Caravan pilot had flown a different aircraft from Sunshine Coast Airport to Ballina Airport earlier that day. On arrival at Ballina Airport, the pilot undertook a prefight inspection of VH-YMV and readied the aircraft for the flight.
At 1338:00, the B737 FO made a further broadcast on the Ballina CTAF advising that the aircraft was now 15 NM south‑east of Ballina Airport and would be positioned for a 10 NM final to land on runway 24 at a time of 1345.
At 1341:17, the Caravan pilot made a taxi broadcast on the Ballina CTAF advising that the aircraft would depart from runway 06 for an IFR flight to the Sunshine Coast. At the time, the weather recorded by the aerodrome weather information service (AWIS) indicated a few clouds at 2,600 feet above ground level, visibility greater than 10 km and a 12-17 knot wind from a 160-170° direction. The pilot recalled listening to AWIS and noting a crosswind. Although this wind direction favoured a departure from runway 24, the pilot recalled observing the windsock, assessing it favoured a departure from runway 06, and hence electing to do so. The aircraft was parked on the general aviation apron and the pilot chose to take-off from the intersection of taxiway A and runway 06, which involved a short taxi to the hold point with no backtracking along the runway.
At 1341:27, the SFIS controller responded to the Caravan pilot’s broadcast and provided the pilot with traffic information on the B737 and a Jetstar Airbus A320 (A320), registered VH-VQK, that was also inbound to Ballina Airport (Figure 2). The SFIS controller stated:
Yankee Mike Victor squawk 4547. Traffic [is] Velocity 1141, 737, shortly turning onto a 10 NM final, followed by Jetstar 464 an Airbus 320 currently 20 NM to the south-west and they're tracking for a right downwind runway 24. They'll be crossing centreline at about time four five.
Figure 2: At 1341:51, the pilot of the Caravan advised the SFIS controller that they had copied the traffic and correctly read back the transponder squawk code. Figure 2: A320 and B737 locations at 1341:27
Source: Google Earth, annotated by the ATSB
The flight crew of the B737 did not recall hearing the Caravan pilot’s taxi broadcasts or the SFIS controller’s responses to the taxi broadcast on the CTAF and were unaware of the presence of the Caravan. The SFIS controller noted that the B737 flight crew had not responded to the Caravan pilot’s taxi broadcast but did not confirm if they were aware of the Caravan (see the section titled SFIS procedures).
The B737 continued the approach for Ballina Airport and, at 1341:57, made a left turn onto a 10 NM final for runway 24.
Meanwhile, the Caravan pilot had formed the belief that the B737 would land on runway 06 based on their earlier observation of the runway windsock. The pilot had also misunderstood the traffic information provided by the SFIS controller as meaning that the B737 was on approach for runway 06, not runway 24, and hence believed that the Caravan could depart ahead of the arriving B737 without causing a conflict. The pilot recalled conducting a visual check for traffic before entering the runway but did not see the B737 that was on final approach to land on runway 24 (see the section titled Human factors).
At 1343:28, the pilot of the Caravan made a broadcast on the CTAF stating that the aircraft was entering and rolling runway 06 (Figure 3).
Figure 3: Caravan and B737 locations at 1343:28
Source: Google Earth, annotated by the ATSB
The SFIS controller heard the Caravan pilot’s ‘entering and rolling’ broadcast and was aware of the developing conflict between the Caravan and the B737. However, the SFIS controller elected not to issue a safety alert (see section titled Safety alert).
The ‘entering and rolling’ broadcast was the first transmission the flight crew of the B737 recalled hearing from the Caravan pilot and when they first became aware of the Caravan. At 1343:36, the B737’s FO made a broadcast on the CTAF stating that the B737 was on a 5 NM final approach for runway 24. Neither the Caravan pilot nor the SFIS controller responded to this broadcast.
At about 1344:00, the Caravan pilot commenced the take-off directly towards the approaching B737.
At 1344:15, the B737’s FO made a further broadcast on the CTAF querying the Caravan’s location. At 1344:19, the Caravan’s pilot responded stating that the aircraft had just become airborne from runway 06 (Figure 4). The B737’s FO immediately replied asking if the Caravan pilot could see the B737, which was now on a 3 NM final for runway 24. At 1344:36, the Caravan pilot confirmed sighting the B737, and its FO then requested the Caravan pilot to commence a turn. The Caravan pilot did not respond to the FO’s broadcast, but the pilot did initiate a turn to the right shortly after becoming airborne.
Figure 4: Caravan and B737 locations at 1344:19
Source: Google Earth, annotated by the ATSB
At 1345:06, the captain of the B737 initiated a missed approach and, a short time later, the flight crew sighted the Caravan ahead of their aircraft, travelling in a northerly direction. During the missed approach, the flight crew received a traffic collision avoidance system[4] traffic advisory[5] generated by the Caravan’s proximity. The flight crew maintained visual contact with the Caravan and repositioned the B737 for a left circuit to land on runway 24.
A review of recorded flight data indicated that the closest point of approach occurred at 1346:12 as the lateral separation between the 2 aircraft decreased to approximately 0.9 NM with vertical separation reducing to about 700 feet (Figure 5).
Figure 5: Caravan and B737 tracks and relative distances
Source: Google Earth, annotated by the ATSB
The Caravan pilot set course north for Sunshine Coast Airport and communications with the aircraft were transferred to the Brisbane Airport approach controller at 1349:26. The B737 landed at Ballina Airport at about 1359:00.
Context
Personnel information
B737 flight crew
The captain held an air transport pilot licence (ATPL) (aeroplane) and had a total flying time of 15,719 hours, having flown 25 hours in the previous 90 days. The captain was familiar with Ballina Airport and had operated there in both turboprop and jet aircraft over a 20-year period.
The FO held an ATPL (aeroplane) and a total flying time of 8,607 hours, having flown 72.3 hours in the previous 90 days. The FO was also familiar with Ballina Airport having operated there in both turboprop and jet aircraft throughout their career. The FO’s last flight to Ballina Airport took place on 11 May 2021.
Caravan pilot
The pilot held a commercial pilot licence (aeroplane) and a total flying time of 1,008 hours, having flown 50 hours in the previous 90 days. The pilot was familiar with Ballina Airport and had last flown into the airport approximately 3 months prior to the incident flight.
Controller
The surveillance flight information service (SFIS) controller had experience in both tower and en route air traffic environments prior to commencing in the SFIS controller role. The controller was based in the Airservices Australia Brisbane Centre and had undertaken SFIS endorsement training in August 2021, before the SFIS service commenced on 12 August.
Ballina Byron Gateway Airport
Ballina Byron Gateway Airport is situated approximately 3 NM from the city of Ballina, NSW. The airport has an elevation of 7 feet above mean sea level (AMSL) and a single sealed runway, orientated in a 062°-242° magnetic direction (Figure 6). The airport had global positioning system (GPS)‑based instrument approaches and a non-directional beacon ground-based navigation aid.
Figure 6: Ballina Byron Gateway Airport
Source: Airservices Australia
Airspace and traffic services
Ballina Airport was located within non‑controlled Class G airspace, which extended from the ground surface to 8,500 feet AMSL. The airport did not have a control tower and was not supported by an air traffic control separation or sequencing service (that is, a non-controlled airport).
Overlying the non‑controlled airspace was Class C controlled airspace which extended up to flight level (FL) 180,[6] and controlled Class A airspace above that. An air traffic information and separation service was provided within the Class C airspace and a separation service was provided within the Class A airspace. A restricted area existed approximately 5 NM south of the airport (the aircraft involved in this incident were clear of this area).[7]
The non‑controlled airspace surrounding Ballina Airport was available for use by aircraft operating under visual flight rules and instrument flight rules. The primary method of traffic separation at Ballina Airport was visual and relied on pilots using ‘alerted see-and-avoid’[8] practices.
A broadcast area (BA) was in place within an approximate radius of 15 NM from the airport and a surveillance flight information service (SFIS) was provided to aircraft operating within the BA during defined periods (see the section titled Surveillance flight information service).
Broadcast area
Surrounding Ballina Airport was a BA that mandated the carriage and use of radio equipment for aircraft operating within a radius of 15 NM of the airport, from surface level to 8,500 feet, excluding penetrating arcs of circles for Lismore Airport and Gold Coast control area steps (Figure 7).
Figure 7: Ballina Airport broadcast area
Source: Google Earth, annotated by the ATSB
The broadcast area was expanded from 10 NM to 15 NM on 28 January 2021 to ‘reduce residual airspace risk’. The expansion of the BA occurred following a separation incident involving a Jetstar A320 and a Jabiru aircraft that occurred about 13 NM from Ballina Airport on 28 November 2020 (see ATSB investigation AO-2020-062).
The broadcast area required all pilots to make mandatory positional broadcasts when entering or operating within the defined lateral and vertical limits of the BA on the Ballina Airport CTAF. Pilots were also required to acknowledge calls from aircraft departing or landing whose operations were in conflict with their own, and should announce when in receipt of a call indicating that their aircraft may be in conflict when operating outside of the circuit area.
Common traffic advisory frequency
The Ballina Airport CTAF was a designated radio frequency on which pilots made positional broadcasts when operating in the vicinity of the airport. The Ballina Airport CTAF was shared with neighbouring airports and aeroplane landing areas at Casino, Lismore and Evans Head.
A surveillance flight information service, detailed in the following section, was provided on the CTAF to aircraft operating within the Ballina Airport BA.
Surveillance flight information service
A surveillance flight information service (SFIS) was provided to aircraft operating within the Ballina Airport BA between 2200-0800 Coordinated Universal Time [9] (1 hour earlier during Eastern Daylight-saving Time[10]) or as notified by notice to airmen.
The SFIS utilised available surveillance data, and broadcasts on the airport’s CTAF, to provide all visual flight rules (VFR) and instrument flight rules (IFR) aircraft with a full traffic information and alerting service. The information provided by the SFIS controller contained advice on conflicting traffic. However, the SFIS was not a separation or sequencing service and pilots remained responsible for seeing and avoiding other aircraft.
The service was provided by a dedicated Airservices Australia air traffic controller located at the Brisbane Centre. Pilots made broadcasts and reported to the SFIS controller (callsign ‘Ballina Information’) on the Ballina Airport CTAF.
The SFIS commenced on 12 August 2021 and replaced the previously established certified air/ground radio service (CA/GRS).The CA/GRS was provided at Ballina Airport from March 2017 to the commencement of the SFIS service in August 2021 and was delivered by a certified air/ground radio operator (CA/GRO) located at the airport.
SFIS procedures
Airservices Australia procedures required the SFIS controller to communicate specific details when passing traffic information to aircraft. This information was to include the traffic’s intentions, the traffic’s reported position and estimate. The SFIS controller was also procedurally required to provide traffic information to aircraft in class G airspace when an aircraft was expected to arrive with less than 10 minutes separation time from aircraft departing from the same airport.
During this occurrence, the SFIS controller provided traffic information to the Caravan pilot that did not include the B737’s estimated landing time and runway number. The controller stated that as the pilot’s communications appeared to be ‘competent’ and ‘confident’, it had not been considered necessary to emphasise the B737’s landing direction. Similarly, when the B737’s flight crew did not respond to the Caravan pilot’s taxi broadcast, the controller did not consider it necessary to confirm they were aware of the Caravan because, according to their SFIS training, they were not required to follow-up communications for aircraft already on the CTAF (as was the case for the B737).
Safety alert
A safety alert comprises advice provided to a pilot when the SFIS controller becomes aware that an aircraft is in a position that places it in unsafe proximity to terrain, obstructions, active restricted or prohibited areas, or another aircraft. In cases where an aircraft is in close proximity to another, a safety alert should be issued by the controller unless the pilot had advised that action to resolve the situation was being taken, or the other aircraft was in sight. A safety alert could be issued in all classes of airspace both within and outside surveillance coverage.
However, on the day of the occurrence, the SFIS controller did not issue a safety alert to either the B737 or the Caravan after its pilot reported entering and rolling runway 06 although it was apparent to the controller that a conflict would result. The controller advised that their reason for not doing so was due to a concern that the alert could result in the over transmission of radio communications from either aircraft.
Technical systems
Secondary surveillance radar
Secondary surveillance radar utilises ground stations (interrogators) and transponders on board aircraft.
A transponder is a receiver/transmitter which transmits an automatic reply upon receiving an interrogation request. A manual ‘ident’ transmission can also be initiated by the pilot. The information that may be transmitted by a transponder is dependent on the ‘mode’ of equipment fitted to an aircraft:
Mode A transponders transmit an identifying code only
Mode C transponders transmit an identifying code and altitude (based on standard pressure)
Mode S transponders transmit an identifying code, altitude (based on standard pressure) and permit data exchange
The signal from the transponder is received by the ground station and combined with the aircraft’s position established via radar (range and bearing). This information is then relayed to air traffic control where it is displayed on the controller’s console screen.
Automatic dependant surveillance broadcast
Automatic dependent surveillance broadcast (ADS-B) utilises electronic equipment on board an aircraft to automatically broadcast the aircraft’s precise location, and other parameters, via digital data link (ADS-B OUT). The data is then used by air traffic control and other aircraft to depict the aircraft’s position, and other information, on a display without the need for radar.
The system uses GPS data to determine the aircraft’s position then transmits the position, and other parameters (such as identity, altitude and speed), at rapid intervals. These transmissions are received by dedicated ADS-B ground stations and the information is then relayed to air traffic control and displayed on the controller’s console screen.
The transmissions can also be received by other aircraft with the capability to receive and displayed this information (ADS-B IN). Both the B737 and Caravan were fitted with ADS-B OUT equipment. Neither aircraft was fitted with ADS-B IN equipment, nor were they required to be.
Surveillance coverage
The SFIS was a surveillance-based service that utilised secondary surveillance radar (SSR) and ADS-B information, in combination with pilot broadcasts made on the CTAF, to provide pilots with traffic information and alerts.
Documents developed by Airservices Australia before implementing the Ballina Airport SFIS contained a list of ‘critical components’ necessary for the service. Although ‘adequate surveillance coverage’ was one of these critical components, Ballina Airport had no ADS-B ground station and the surrounding area had significant limitations in SSR and ADS-B coverage. Surveillance coverage charts produced by Airservices Australia indicated that, near the airport, the SSR and ADS-B coverage did not commence until about 1,500 feet above ground level (Figure 8).
Figure 8: SSR and ADS-B coverage within the vicinity of Ballina Airport
Source: Airservices Australia, annotated by the ATSB
The hazards and risks associated with the surveillance coverage limitations were identified by Airservices Australia prior to the implementation of the SFIS and documented as:
Limited surveillance coverage may lead to unintended aircraft proximity (Airprox), inadequate separation assurance (ISA), or loss of separation (LOS) occurrence.
Airservices Australia conducted a risk assessment and rated the initial risk as moderate. However, its pre-implementation risk treatment did not reduce the risk any further. Residual risks associated with the surveillance coverage limitations were formally accepted and the SFIS was implemented with the risks unaddressed. These limitations meant the Caravan’s positional information was not displayed on the SFIS controller’s console screen until it reached an altitude of about 1,500 feet, which occurred about 100 seconds after take-off was commenced.
Previous events
A search of the ATSB occurrence database found that during the period from the implementation of the SFIS (12 August 2021) to the date of the incident (16 September 2021), there was one reported occurrence and no reported separation issues within 20 NM of Ballina Airport.
Regulatory oversight
The Airspace Act 2007 assigned the administration and regulation of Australian administered airspace to the Civil Aviation Safety Authority (CASA). As part of this function, CASA was required to undertake regular reviews of airspace to determine if existing classifications were appropriate, air navigation services and facilities were suitable, there was safe, efficient, and equitable use of airspace, and identify any associated risk factors.
On 15 December 2022, CASA publicly released a final Ballina airspace review. The review identified 3 areas of concern:
Frequency congestion
Heightened risk of separation incidents
Situational awareness
As a result, the review made 9 recommendations (Table 1).
Table 1: Ballina airspace review recommendations
No.
Recommendation
1
CASA should prepare a Request For Change (RFC) to separate the Lismore and Casino Common Traffic Advisory Frequency (CTAF) from the Ballina CTAF by 16 June 2022.
2
Evans Head Airport should be allocated the common CTAF (126.7 MHz) by 16 June 2022.
3
CASA should direct AA to install an Automatic Dependent Surveillance - Broadcast (ADS-B) ground station in the vicinity of Ballina to improve surveillance as soon as practicable but no later than April 2023. The ground station should, as far as is practical, provide ADS-B surveillance capability to the runway surface.
4
CASA should explore a suitable regulatory framework that can safely authorise sport and recreational aircraft and pilot certificate holders to operate in the controlled airspace associated with Ballina where pilot certificate holders meet CASA specified competency standards and the aircraft are appropriately equipped.
5
CASA’s Stakeholder Engagement Division (SED) should conduct additional safety promotion programs in relation to Ballina operations as soon as practicable. The programs should include, but are not limited to the following key elements:
a. reinforce the mandatory radio calls required when operating within the Ballina MBA in the interim, pending the establishment of controlled airspace, and
b. later, provide guidance as to how a Sport Aviation Body might develop a suitable scheme and make application to CASA for approval, under the regulatory framework identified in recommendation 4.
6
Uncertified aerodromes and flight training areas around Ballina should be promulgated in aeronautical publications to increase pilot situational awareness.
7
As an interim action pending the completion of Recommendation 8, CASA should make a determination to establish a control area around Ballina Byron Gateway Airport with a base which is as low as possible, and direct AA to provide services within the control area. The services should be provided during all periods of scheduled Air Transport Operations and include an Approach Control Service to aircraft operating under the Instrument Flight Rules (IFR), separation between IFR aircraft, VFR traffic information to all aircraft, and sequencing of all aircraft to and from the runway. CASA and AA should jointly explore opportunities to detect non-cooperative aircraft or vehicles in the immediate vicinity of the runway. The services should be established as soon as practicable but no later than 30 November 2023.
8
CASA should make a determination that Ballina Byron Gateway Airport will become a controlled aerodrome with an associated control zone and control area, and direct Airservices Australia (AA) to provide an Aerodrome Control Service1 to the aerodrome. That service should be established as soon as practicable but no later than 13 June 2024.
9
CASA should prepare and finalise an Airspace Change Proposal (ACP) for a control zone and control area steps in preparation for the implementation of Recommendations 7 and 8.
Source: Airspace Review of Ballina – 2022 with minor amendments by the ATSB
On 16 June 2022, recommendation 1 and 2 were implemented resulting in Lismore, Casino and Evans Head being separated from the Ballina Airport CTAF. Recommendation 3 was due for implementation by April 2023 and proposed the installation of an ADS-B ground station in the vicinity of Ballina Airport to provide surveillance coverage to the runway surface.
The ATSB undertook a detailed assessment of CASA’s role in the oversight of the airspace surrounding Ballina Airport following a separation occurrence involving an Airbus A320-232 and a Jabiru that took place on 28 November 2020 (see investigation AO-2020-062).
Human factors
The ATSB investigation considered a range of human factors that could have influenced the decisions and actions of the pilots and controller involved. No indicators that increased the risk of any of the individuals experiencing a level of fatigue known to influence performance were found. The following factors, however, were found to have possibly had an influence:
shared mental models
situation awareness
confirmation bias
Mental models
According to Methieu et al (2000), mental models are internally organised knowledge structures that allow individuals to understand and interact with their environment. Mental models are said to be ‘shared’ when the models of individuals overlap – the greater the overlap the greater the similarity of understanding.
In scenarios involving the movement of aircraft within the airspace system, it is anticipated that pilots and air traffic controllers will have a high degree of shared mental model overlap. However, when communication is ineffective, and critical information and assumptions are not shared, the degree of shared mental model overlap is decreased, coordinated decision making is degraded, and safety defences are eroded (Bearman et al 2010).
The mismatch of mental models was evident in the lead up to this incident. Critical traffic information and assumptions were not shared between the SFIS controller, the Caravan pilot, and the B737 flight crew. This resulted in each party holding a different mental model of the traffic scenario.
Situation awareness
Situation awareness (SA) is best conceptualised as a 3-stage process:
task related features or cues are acquired and interpreted by the individual
information is integrated and comprehended within the context of the task to derive meaning for the individual
the individual anticipates the future state of the system (Wiggins 2022)
The accuracy of an individual’s SA directly influences their decisions.
The SFIS controller, the Caravan pilot and the B737 flight crew all held incomplete information on the traffic scenario and the intended actions of the others involved. As a result, their capacity to accurately predict the future traffic state was compromised and their decision-making impacted accordingly.
Confirmation bias
Confirmation bias involves an individual seeking out information that confirms an assumption and rejecting, ignoring, or explaining away information that conflicts with the held assumption (Wiggins 2022). Based primarily on their assessment of the windsock, the Caravan’s pilot incorrectly believed that the B737 was on final approach for runway 06 and not runway 24. It is therefore possible that the pilot’s confirmation bias influenced the visual check before entering the runway with the B737 on final approach from the opposite direction going undetected.
Safety analysis
The incident
On 16 September 2021, a Boeing 737, VH-YIO (B737), was approaching runway 24 to land at Ballina Byron Gateway Airport when a Cessna Caravan 208, VH-YMV (Caravan), commenced a take-off on the reciprocal runway. The B737’s flight crew conducted a missed approach during which the lateral separation between the 2 aircraft decreased to approximately 0.9 NM with vertical separation reducing to about 700 feet. At the time of the incident, the aircraft were operating within the airport’s broadcast area, and both were receiving the associated surveillance flight information service (SFIS).
Communications
The SFIS controller had not included the B737’s estimated time of landing and runway direction when providing traffic information to the Caravan pilot. In addition, the Caravan pilot had formed the belief that the B737 would land on runway 06 (based on observing the runway windsock), and then interpreted the traffic information provided by the controller incorrectly as it confirmed their incorrect mental model. The pilot did not seek to validate this assumption by communicating directly with the B737’s flight crew or by querying the information provided by the controller.
The scenario was further compounded by the B737’s flight crew not hearing the Caravan’s taxi broadcasts or the SFIS controller’s responses. Those taxi transmissions commenced 40 seconds before the B737 turned onto final approach for runway 24. The ATSB was not able to determine why the flight crew did not hear the exchange. In any case, they were not aware of the Caravan until the ‘entering and rolling’ broadcast made by its pilot.
The SFIS controller knew the B737’s flight crew had not acknowledged the Caravan pilot’s taxi broadcast but recalled from SFIS training that follow-up communications were not necessary for aircraft already on the common traffic advisory frequency (CTAF). Consequently, the controller decided not to confirm that the flight crew were aware of the Caravan, and an opportunity to address the evolving situation was missed. This resulted in the B737’s flight crew remaining unaware of the Caravan and the latter’s pilot continued to incorrectly believe the B737 would land in the opposite direction.
The Caravan pilot’s incorrect mental model also led them to believe the Caravan could take-off ahead of the landing B737, using runway 06, without any conflict. The pilot recalled conducting a visual check prior to entering the runway; however, their likely confirmation bias and reduced situation awareness possibly resulted in not sighting the approaching B737. Consequently, the Caravan was taxied onto the runway and a take-off commenced directly towards the B737.
Safety alert
The SFIS controller recognised the impending conflict between the two aircraft after hearing the Caravan pilot’s ‘entering and rolling’ broadcast but decided not to issue a safety alert because of concerns of over transmitting communications from the Caravan or the B737. However, between the ‘entering and rolling’ broadcast and confirmation that the Caravan pilot had sighted the B737, there was a total of 53 seconds during which time no transmissions were made on the CTAF. A safety alert issued during this time would probably have ensured the pilots on both aircraft were fully aware of the conflict.
Surveillance coverage limitations
Prior to the implementation of the Ballina Airport SFIS, Airservices Australia had identified a hazard associated with a critical component of the service that could lead to unintended aircraft proximity events. As the secondary surveillance radar and automatic dependent surveillance broadcast (ADS-B) coverage near the airport did not commence until about 1,500 feet above ground level, ADS-B equipped aircraft operating below this height may not be displayed on the SFIS controller’s console screen. Airservices Australia formally accepted the risk associated with the surveillance coverage limitations and the SFIS was implemented with this critical component compromised.
The limitation in coverage resulted in the SFIS controller having no positional information on the Caravan during the period of conflict until the aircraft reached an altitude of about 1,500 feet about 100 seconds after taking off. During this period, the controller was solely reliant on radio communications for situation awareness and had reduced options for providing any avoidance advice necessitated by the situation.
The heightened risk of separation incidents in the vicinity of Ballina Airport was identified in the Civil Aviation Safety Authority’s (CASA’s) Ballina airspace review, which was published in December 2022. Recommendations contained in that review document included the installation of an automatic dependent surveillance broadcast (ADS-B) ground station in the vicinity of Ballina Airport to enable ADS-B surveillance capability to the runway surface. The review document contained 8 other recommendations designed to incrementally transition Ballina Airport to a controlled aerodrome service with an associated control zone and control area steps by 13 June 2024. Such an aerodrome control service would have prevented the traffic conflict between the B737 and the Caravan.
Both this separation occurrence and that detailed in AO-2020-062 involved high-capacity transport aircraft using the primary defence of alerted see‑and‑avoid. Noting the known limitations of this principle, and the increasing and complex mix of traffic, the ATSB considers that timely implementation of the recommendations detailed in CASA’s airspace review document would significantly improve safety at Ballina Airport.
Findings
ATSB investigation report findings focus on safety factors (that is, events and conditions that increase risk). Safety factors include ‘contributing factors’ and ‘other factors that increased risk’ (that is, factors that did not meet the definition of a contributing factor for this occurrence but were still considered important to include in the report for the purpose of increasing awareness and enhancing safety). In addition, ‘other findings’ may be included to provide important information about topics other than safety factors.
Safety issues are highlighted in bold to emphasise their importance. A safety issue is a safety factor that (a) can reasonably be regarded as having the potential to adversely affect the safety of future operations, and (b) is a characteristic of an organisation or a system, rather than a characteristic of a specific individual, or characteristic of an operating environment at a specific point in time.
These findings should not be read as apportioning blame or liability to any particular organisation or individual.
From the evidence available, the following findings are made with respect to the separation occurrence involving Boeing 737-8FE, VH-YIO (B737) and Cessna Caravan 208, VH-YMV (Caravan) at Ballina Byron Gateway Airport, New South Wales on 16 September 2021.
Contributing factors
Based on an assessment of the windsock only, the Caravan pilot wrongly assumed that the B737 would land behind them on runway 06 and not present a conflict for their departure. This incorrect mental model of the traffic was not corrected prior to the conflict as the surveillance flight information service controller did not specify that the B737 would land on runway 24 and the pilot did not confirm the runway direction with the controller or with the B737’s flight crew.
The B737’s flight crew did not hear the Caravan pilot’s taxi broadcast or the surveillance flight information service controller's response, who also did not confirm if the flight crew were aware of the Caravan. Consequently, the flight crew was unaware of the Caravan until its pilot made a broadcast before entering the runway.
The visual check by the Caravan’s pilot before entering the runway did not identify the B737 on final approach to land on runway 24, possibly due to confirmation bias and degraded situation awareness resulting from the pilot’s incorrect mental model of the traffic.
The Caravan’s pilot commenced a take-off directly towards the approaching B737 resulting in its flight crew conducting a missed approach to avoid the Caravan.
Other factors that increased risk
The surveillance flight information service controller did not issue a safety alert after the Caravan entered the runway and commenced taking off towards the approaching B737 due to concerns that issuing an alert would result in over transmitting communications from either aircraft.
The surveillance flight information service (SFIS) had been implemented in an area with known surveillance coverage limitations, resulting in the SFIS controller having no displayed positional information for the Caravan until it reached an altitude of about 1,500 feet. Therefore, during the period of conflict between the Caravan and B737, the controller was solely reliant on radio communications for situation awareness, reducing their ability to provide appropriate traffic and avoidance advice. (Safety issue)
Safety issues and actions
Central to the ATSB’s investigation of transport safety matters is the early identification of safety issues. The ATSB expects relevant organisations will address all safety issues an investigation identifies.
Depending on the level of risk of a safety issue, the extent of corrective action taken by the relevant organisation(s), or the desirability of directing a broad safety message to the aviation industry, the ATSB may issue a formal safety recommendation or safety advisory notice as part of the final report.
All of the directly involved parties are invited to provide submissions to this draft report. As part of that process, each organisation is asked to communicate what safety actions, if any, they have carried out or are planning to carry out in relation to each safety issue relevant to their organisation.
Descriptions of each safety issue, and any associated safety recommendations, are detailed below. Click the link to read the full safety issue description, including the issue status and any safety action/s taken. Safety issues and actions are updated on this website when safety issue owners provide further information concerning the implementation of safety action.
Safety issue description: The surveillance flight information service (SFIS) had been implemented in an area with known surveillance coverage limitations, resulting in the SFIS controller having no displayed positional information for the Caravan until it reached an altitude of about 1,500 feet. Therefore, during the period of conflict between the Caravan and B737, the controller was solely reliant on radio communications for situation awareness, reducing their ability to provide appropriate traffic and avoidance advice.
Glossary
ADS-B Automatic dependant surveillance broadcast
AMSL Above mean sea level
ATPL Air transport pilot licence
BA Broadcast area
CA/GRO Certified air/ground radio operator
CA/GRS Certified air/ground radio service
CTAF Common traffic advisory frequency
FO First officer
GPS Global positioning systems
IFR Instrument flight rules
KM Kilometres
NM Nautical miles
NSW New South Wales
PF Pilot flying
PM Pilot monitoring
SA Situation awareness
SFIS Surveillance flight information service
SSR Secondary surveillance radar
VFR Visual flight rules
Sources and submissions
Sources of information
The sources of information during the investigation included:
the flight crew of VH-YIO and pilot of VH-YMV
the SFIS controller
Virgin Airlines Australia
Avdata
OzRunways
Civil Aviation Safety Authority
Airservices Australia
Bureau of Meteorology
Experience Co Limited
References
Wiggins M 2022, Introduction to human factors for organisational psychologists, Taylor & Francis Group, Milton
Bearman C, Paletz S, Orasanu J & Thomas M 2010, The breakdown of coordinated decision making in distributed systems, Human factors, Vol. 52, pp. 173-188
Mathieu J, Heffner T, Goodwin G, Salas E & Cannon-Bowers J 2000, The influence of shared mental models on team process and performance, Journal of applied psychology, vol 85, pp. 273
Submissions
Under section 26 of the Transport Safety Investigation Act 2003, the ATSB may provide a draft report, on a confidential basis, to any person whom the ATSB considers appropriate. That section allows a person receiving a draft report to make submissions to the ATSB about the draft report.
A draft of this report was provided to the following directly involved parties:
the flight crew of VH-YIO and pilot of VH-YMV
the SFIS controller
Virgin Airlines Australia
Airservices Australia
Experience Co Limited
Civil Aviation Safety Authority.
Submissions were received from:
Airservices Australia
Experience Co Limited
Civil Aviation Safety Authority.
The submissions were reviewed and, where considered appropriate, the text of the report was amended accordingly.
Purpose of safety investigations
The objective of a safety investigation is to enhance transport safety. This is done through:
identifying safety issues and facilitating safety action to address those issues
providing information about occurrences and their associated safety factors to facilitate learning within the transport industry.
It is not a function of the ATSB to apportion blame or provide a means for determining liability. At the same time, an investigation report must include factual material of sufficient weight to support the analysis and findings. At all times the ATSB endeavours to balance the use of material that could imply adverse comment with the need to properly explain what happened, and why, in a fair and unbiased manner. The ATSB does not investigate for the purpose of taking administrative, regulatory or criminal action.
Terminology
An explanation of terminology used in ATSB investigation reports is available here. This includes terms such as occurrence, contributing factor, other factor that increased risk, and safety issue.
Publishing information
Released in accordance with section 25 of the Transport Safety Investigation Act 2003
Ownership of intellectual property rights in this publication
Unless otherwise noted, copyright (and any other intellectual property rights, if any) in this report publication is owned by the Commonwealth of Australia.
Creative Commons licence
With the exception of the Coat of Arms, ATSB logo, and photos and graphics in which a third party holds copyright, this publication is licensed under a Creative Commons Attribution 3.0 Australia licence.
Creative Commons Attribution 3.0 Australia Licence is a standard form licence agreement that allows you to copy, distribute, transmit and adapt this publication provided that you attribute the work.
The ATSB’s preference is that you attribute this publication (and any material sourced from it) using the following wording: Source: Australian Transport Safety Bureau
Copyright in material obtained from other agencies, private individuals or organisations, belongs to those agencies, individuals or organisations. Where you wish to use their material, you will need to contact them directly.
[1] Pilot Flying (PF) and Pilot Monitoring (PM): procedurally assigned roles with specifically assigned duties at specific stages of a flight. The PF does most of the flying, except in defined circumstances; such as planning for descent, approach and landing. The PM carries out support duties and monitors the PF’s actions and the aircraft’s flight path.
[2] Eastern Standard Time (EST): Coordinated Universal Time (UTC) +10 hours.
[3] A common traffic advisory frequency is a designated frequency on which pilots make positional broadcasts when operating in the vicinity of a non-controlled airport, or within a broadcast area.
[4] A traffic collision avoidance system (TCAS) interrogates the transponders of nearby aircraft and uses this information to calculate the relative range and altitude of this traffic. The system provides a visual representation of this information to the flight crew as well as issuing alerts should a traffic issue be identified.
[5] A traffic advisory (TA) is an alert issued when the detected traffic may result in a conflict (the closest point of separation is about 40 seconds away on the current projected flight paths). Pilots are expected to initiate a visual search for the traffic causing the TA.
[6] Flight level: at altitudes above 10,000 ft in Australia, an aircraft’s height above mean sea level is referred to as a flight level (FL). FL 180 equates to 18,000 ft.
[7] The restricted area was activated by a notice to airmen when military jet aircraft were operating within the area and/or live-firing exercises were taking place.
[8] Pilots are responsible for sighting conflicting traffic, and avoiding a collision, having been alerted to the presence of
traffic in their immediate vicinity. This is principally achieved via radio communications.
[9] Coordinated Universal Time (UTC): the time zone used for aviation. Local time zones around the world can be expressed as positive or negative offsets from UTC.
[10] Eastern Daylight-saving Time (EDT): Universal Coordinated Time (UTC) +11 hours.
On 3 September 2021, a Boeing Company 737-8FE (B737), registered VH-YIS and operated by Virgin Australia, was conducting a flight from Melbourne, Victoria, to Darwin, Northern Territory. During the pre-flight briefing, the flight crew planned the incorrect displaced threshold instrument approach into Darwin Airport. During the approach, air traffic control cleared the flight crew for a non-displaced threshold approach but the flight crew continued and conducted the pre‑planned displaced threshold approach and landing. The aircraft landed 1,153 m into the runway.
Separately, on 19 September 2021 a Boeing Company 737-81D (B737), registered VH-YFC and also operated by Virgin Australia, conducted a flight from Brisbane, Queensland to Darwin, Northern Territory. During the pre-flight briefing the flight crew similarly planned a displaced threshold approach into Darwin runway 11 instead of the non‑displaced threshold approach. The aircraft landed 932 m into the runway.
What the ATSB found
The ATSB found that the flight crew of VH-YIS misinterpreted the notice to airmen (NOTAM) information during the pre-flight briefing which led them to believe that runway 11 was displaced. As a result, they planned for the displaced threshold approach on runway 11. The flight crew continued the planned runway 11 VOR-T despite being cleared for the non‑displaced threshold runway 11 VOR-Z approach by air traffic control.
This resulted in reduced runway length being available for the landing roll. Air traffic control did not request the flight crew to correctly readback the VOR approach clearance resulting in a missed opportunity to identify the error and for the flight crew to reconsider their decision to continue the displaced threshold approach.
The flight crew of VH-YFC similarly misinterpreted the NOTAM during pre-flight briefing which led them to believe that both ends of 11/29 in Darwin were displaced. This resulted in the flight crew planning for and conducting the RWY 11 VOR-T displaced threshold approach instead of the RWY 11 VOR-Z non-displaced threshold approach.
Both flight crews misinterpreted the Darwin Airport recorded information prior to arrival, this also resulted in a missed opportunity to capture the misidentification of the displaced threshold information from the NOTAM.
What has been done as a result
After the first incident, Virgin Australia updated their Flight Crew Operational Notice to reflect that the Darwin Airport runway 11 works had been completed, and then subsequently modified it further after the second occurrence to specifically highlight the displaced thresholds.
Safety message
Operational information in a NOTAM, can have critical importance for the planning and conduct of a flight. As such, misinterpretation of this information can significantly affect flight safety.
Correct and complete readback of air traffic control clearances, are important to confirm that information has been received and understood and provide a valuable defence to detect and correct errors such as occurred during these incidents.
Finally, when there is uncertainty or ambiguity about the condition of a destination, such as a displaced threshold, flight crew are encouraged to seek clarification from air traffic control.
The investigation
Decisions regarding the scope of an investigation are based on many factors, including the level of safety benefit likely to be obtained from an investigation and the associated resources required. For this occurrence, a limited-scope investigation was conducted in order to produce a short investigation report, and allow for greater industry awareness of findings that affect safety and potential learning opportunities.
The occurrence
On 3 September 2021 at about 0945 Eastern Standard Time (EST)[1] the flight crew of a Boeing Company 737-8FE (B737), registered VH-YIS (YIS) and operated by Virgin Australia, were conducting their pre-flight briefing on the flight deck in preparation for flight VA1457 from Melbourne, Victoria, to Darwin, Northern Territory. The flight crew consisted of a captain and a first officer.
The flight crew reported that they both reviewed a NOTAM[2] for Darwin (Figure 1) during the pre‑flight briefing and acknowledged to each other that there were runway works in progress that reduced the available runway length. The flight crew also reviewed the Flight Crew Operational Notice (FCON)[3] for Darwin (Figure 4). The captain commented that they were aware of the reduced runway length for Darwin and the first officer commented that they were both under the impression that runway 11 had a displaced threshold and not runway 29 as the NOTAM stated.
The flight crew received the ATIS[4] (Figure 2) during cruise and then commenced an arrival brief 30 minutes before the planned top of descent. The flight crew planned to conduct the Darwin runway 11 VOR-T instrument approach associated with a displaced runway 11 threshold (Figure 7) and they calculated the landing distance based on that displacement.
At 1436 Central Standard Time (CST)[5] air traffic control instructed VA1457 to descend to 9,000 ft and they were subsequently cleared for the runway 11 VOR-Z instrument approach (Figure 6).The flight crew, cognisant that they had planned for the VOR-T in expectation of a runway 11 displaced threshold, discussed with each other that air traffic control had cleared them for the VOR-Z approach. The flight crew, believing that the VOR-T was safe and appropriate, elected to continue and not conduct the VOR-Z approach in accordance with their clearance.
The aircraft touched down 1,153 m into the runway and the aircraft decelerated to a stop before the displaced threshold cones that were present at the 29 displaced threshold. The aircraft backtracked on the runway and taxied to the terminal. Having recognised the error, the flight crew reported their misinterpretation of the displaced threshold to Virgin Australia.
On 19 September 2021, the flight crew of a Boeing Company 737-81D (B737), registered VH-YFC (YFC) and also operated by Virgin Australia, were conducting their pre-flight briefing for flight VA449 from Brisbane, Queensland to Darwin, Northern Territory. The flight crew consisted of a captain and a first officer.
During the pre-flight briefing, the flight crew reviewed the NOTAM (Figure 1) and the company supplied briefing pack. The captain commented that they believed the NOTAM and FCON were ambiguous regarding the displaced runway threshold and expected to acquire more information in flight when they received the ATIS (Figure 3). The flight departed at 0944 EST.
Prior to the top of descent into Darwin, the flight crew received the ATIS and commenced their arrival brief. They discussed that there was no information on the ATIS broadcast regarding displaced thresholds, and decided to conduct the displaced threshold VOR-T approach just in case the threshold was displaced. The flight crew also commented that if the PAPI[6] was operating that it would read high while on approach to runway 11.
The flight crew conducted the Darwin runway 11 VOR-T approach and touched down 932 m down the runway, decelerated, and proceeded to the terminal. During the taxi to the terminal, the captain noted the displaced threshold cones at the 29 end of the runway and realised that a misinterpretation of the NOTAM had occurred. The flight crew reported the occurrence to Virgin Australia.
Context
Information available to flight crew
Both flight crews conducted a briefing prior to dispatch from their departure airports. The information included in these briefings was provided to them by Virgin Australia in the FCON and in a pilot briefing pack that was prepared for each flight. The briefing packs contained information such as the flight plan, weather, and fuel requirements. They also contained the NOTAMs of the departure and destination airports, as well as information on en-route airports, in case a diversion was required. The briefing pack provided to the crew of YFC included a note from the Virgin Australia dispatcher indicating that Darwin runway 29 has a displaced threshold.
Notice to airmen
For both occurrences, information related to displaced thresholds in the Darwin NOTAM (Figure 1) was the same. The NOTAM stated that runway 29 had a displaced threshold of 765 m due to works in progress and that the eastern end of runway 11/29 was not available due to the works. The NOTAM also stated that the landing distance available on runway 11, with the runway 29 threshold displaced, was 2,670 m.
Figure 1: Darwin NOTAM, current at the time of both occurrences
Source: Virgin Australia, annotated by ATSB
The captain of YIS stated that when they reviewed the NOTAM during the pre-flight briefing the reduced length of the runway was all that they comprehended. The captain did not review the NOTAM again until after the occurrence. The first officer reviewed the NOTAM twice before departure, once at home and once during the pre-flight briefing with the captain. The first officer stated that, after the pre-flight briefing, they were both under the impression that the threshold of runway 11 was displaced.
The captain of YFC recalled that, after reviewing all the available information during the pre-flight briefing, their interpretation was that both thresholds of runway 11/29 were displaced. The captain stated that the 11 VOR-T was planned with an expectation to gather further information regarding the displaced thresholds when the ATIS was received in flight.
The flight crew of YIS, and the captain of YFC, recalled reviewing the NOTAM after their flights and realising that a misinterpretation of the displaced threshold had taken place.
Automatic terminal information service
In both occurrences the ATIS was received in flight via the ACARS[7] prior to the conduct of the arrival briefings. The ATIS received on 3 September (Figure 2) by the flight crew of YIS, stated that runway 11 and 36 was to be used for arrivals and departures. It also noted that runway 11 had a reduced runway length. The first officer commented that after reviewing the ATIS they conducted the arrival briefing with the impression that runway 11 had a displaced threshold rather than a section of the upwind end of the runway being unavailable.
Figure 2: ATIS utilised by flight crew of YIS on 3 September 2022
Source: Virgin Australia, annotated by ATSB
The ATIS received on the 19 September (Figure 3) by the flight crew of YFC, stated that runway 11 was in use and that runway 11 had a reduced runway length. The captain commented that the ATIS only mentioned a reduced runway length on runway 11 and not a displaced threshold, therefore they continued with the planned runway 11 VOR-T approach. No clarification was sought from air traffic control on either occasion.
Figure 3: ATIS utilised by flight crew of YFC on the 19 September 2022
Source: Virgin Australia, annotated by ATSB
Flight Crew Operational Notice
The FCONs were provided to both flight crews as part of the flight briefing pack. On the 3 September 2021 the FCON (Figure 4) provided the following information:
From 25 February 2021 until 30 September 2021, RWY 11/29 is undergoing works associated with upgrading the Aircraft Arrestor System.
During works, RWY 11 threshold and RWY 29 threshold will be displaced at separate times.
Actual date and time of works and threshold displacements will be advised by NOTAM.
The FCON also stated the specific VOR instrument approach chart to use
Figure 4: Flight Crew Operational Notice used by VH-YIS on the 3 September 2022
Source: Virgin Australia, annotated by Virgin Australia
Following the occurrence on the 3 September, the FCON (Figure 5) was updated by Virgin Australia on the 16 September with the following amendment:
During the works RWY 29 threshold will be displaced, and runway operational length of both RWY 11 and 29 will be reduced.
Figure 5: Flight Crew Operational Notice used by VH-YFC on the 19 September 2022
Source: Virgin Australia
VOR Approaches
Darwin runway 11 had 2 published VOR procedures current at the time of the occurrences. The VOR-Z (Figure 6) and the VOR-T (Figure 7).
The VOR-Z RWY 11 approach was used when the runway did not have a displaced threshold. The aircraft was to be flown down a 3° approach path from an 8 nm final approach fix, indicated by the Maltese cross, from an altitude of 1,880 ft to a touch down point 300 m past the runway threshold.
Figure 6: VOR-Z non-displaced threshold approach
Source: Airservices Australia, annotated by ATSB
The VOR-T RWY 11 approach was to be used when the threshold was displaced 723 m due to runway works. The VOR-T placed the aircraft 130 ft higher at the final approach fix, indicated by the Maltese cross, The aircraft was to be flown down a 3° approach path from an 8 nm final approach fix altitude of 2,010 ft to a touch down past the displaced runway threshold.
Figure 7: VOR-T displaced threshold approach
Source: Airservices Australia, annotated by ATSB
Air traffic control readback requirements
Aeronautical Information Package Australia ENR 1.1-15, 2.11.2.5 stated:
The full chart title of the instrument approach procedure, as described at the top of the relevant chart, must be used in all clearances, coordination and readbacks relating to the procedure, including entry procedures. However, with the exception of circling approaches, the suffix may be omitted if there is no possibility of confusion. Where multiple approach procedures are on the same chart, only the approach procedure being conducted shall be referred to.
On the 3 September occurrence, air traffic control (ATC) cleared the crew of YIS to conduct the VOR-Z approach. The captain responded ‘cleared the 11 VOR but did not use the suffix of Zulu or Tango. ATC did not request the captain to readback the suffix.
For the 19 September occurrence, the captain reported that air traffic control only cleared YFC for the 11 VOR with no suffix. This could not be verified as the ATC recording was not available.
Recorded information
Flight parameters for the approach were recorded by both aircraft and were provided to the ATSB. This data included the:
aircraft height above the airfield
ground speed
rate of descent in feet per minute
angle of descent in degrees
touchdown point of aircraft
brake pressure
engine settings.
On the 3 September 2021, the flight data indicated that:
YIS touched down 1,153 m into the runway at a groundspeed of 139 kt
1.25 seconds later the auto brakes activated (1,256 m into the runway)
7 seconds after the touchdown, reverse thrust was selected (1,606 m into the runway)
reverse thrust was active until a groundspeed of 43 kt
peak manual braking occurred from a groundspeed of 37 kt to 19 kt.
YIS turn around on the runway prior to the unusable area and taxied to the terminal
On the 19 September 2021, the flight data indicated that:
YFC touched down 932 m into the runway at a groundspeed of 137 kt
auto braking was active until a groundspeed of 98 kt
reverse thrust was active until a groundspeed of 58 kt
YFC exited via a taxiway and taxied to the terminal.
Safety analysis
Introduction
In September 2021, on 2 separate occasions, Virgin Australia flight crews planned and conducted a displaced threshold approach and landing on runway 11 at Darwin Airport. At the time of the occurrences runway 11 was not subject to a displaced threshold, although, at the opposite end on runway 29, a displaced threshold was in place due to works being undertaken.
Flight information
NOTAM information indicated that the eastern end of runway 11/29 was not available due to the works and, as a result, the threshold of runway 29 was displaced. The flight crew of YIS misinterpreted this section of the NOTAM and concluded that runway 11 had a displaced threshold and planned the VOR-T displaced threshold approach for runway 11.
The flight crew of YFC similarly misinterpreted the NOTAM, concluding that both ends of the runway were simultaneously displaced. As a result, they planned for a displaced threshold on runway 11, with an intention to await further information contained in the ATIS.
The FCON used by the flight crew of YIS stated that the runway 11 threshold and runway 29 threshold were displaced at separate times. The FCON also directed the flight crew to refer to NOTAM information to identify which runway threshold was displaced during flight planning. The FCON detailed the correct VOR chart to use when the thresholds were displaced. The flight crew, with this information from the FCON, in conjunction with a misinterpretation of the NOTAM that runway 11 threshold was displaced, planned the runway 11 VOR-T displaced threshold approach.
An updated version of the FCON, which contained information that the threshold of runway 29 was displaced, was provided to the flight crew of YFC. As the threshold of runway 11 was not displaced at the time, the FCON did not provide any information on runway 11 other than stating that the operational length of both runway 11 and 29 was reduced. The flight crew did not identify that the reduced length of runway 11 was due to the works underway at the upwind end of the runway. As a result, the flight crew planned the displaced threshold approach to runway 11 with an intention to await the reception of the ATIS for further information.
Due to the succinct nature and purpose of an ATIS, the Darwin ATIS only referenced the runway in use at the time, which was runway 11. As runway 11 was not subject to a displaced threshold, the ATIS only informed of its reduced length.
The flight crews of YIS and YFC continued with their plan to conduct the VOR-T displaced threshold approach in both instances. The captain of YFC commented that the ATIS was expected to provide further information in flight on the status of the runway, but no further information was obtained from the ATIS. There was no attempt by the flight crews to contact ATC for clarification on either occasion.
ATC cleared the flight crew of YIS to conduct runway 11 VOR-Z, non-displaced threshold approach. This approach clearance was unexpected by the flight crew as they had planned the VOR-T displaced threshold approach. The flight crew decided to continue with their planned displaced threshold approach without advising ATC. The captain responded to ATC with ‘cleared runway 11 VOR’ but omitted the suffix ‘Zulu’. ATC did not request the flight crew to read back the suffix as required. A readback request by ATC may have presented an opportunity for the flight crew to identify the error.
It is likely that, due to both flight crew’s initial misinterpretation of a displaced threshold from the NOTAM information, any further information that was provided by the FCON and the ATIS was viewed with a perception that the threshold of runway 11 was displaced. As a result, the flight crew of YIS did not realise the misinterpretation until ATC cleared them for the VOR-Z approach. The flight crew of YFC did not realise their misinterpretation until after landing.
Findings
ATSB investigation report findings focus on safety factors (that is, events and conditions that increase risk). Safety factors include ‘contributing factors’ and ‘other factors that increased risk’ (that is, factors that did not meet the definition of a contributing factor for this occurrence but were still considered important to include in the report for the purpose of increasing awareness and enhancing safety). In addition ‘other findings’ may be included to provide important information about topics other than safety factors.
These findings should not be read as apportioning blame or liability to any particular organisation or individual.
From the evidence available, the following findings are made with respect to the NOTAM misinterpretations at Darwin Airport on the 3 and 19 September 2021.
Contributing factors
The flight crew of VH-YIS misinterpreted Darwin airport information during pre-flight briefing, which resulted in them believing that the threshold of runway 11 in Darwin was displaced. This subsequently resulted in the flight crew planning for and conducting the RWY 11 VOR-T displaced threshold approach instead of the RWY 11 VOR-Z standard approach.
The flight crew of VH-YIS continued the planned runway 11 VOR-T approach despite being cleared for the runway 11 VOR-Z approach by air traffic control. This resulted in reduced runway available for the landing roll.
The flight crews of VH-YIS and VH-YFC misinterpreted, or did not comprehend, the information on the ATIS prior to arrival. This resulted in a missed opportunity to capture the misidentification of a displaced threshold and the continuation of the VOR-T approach.
The flight crew of VH-YFC misinterpreted Darwin Airport information during pre-flight briefing which led them to believe that both ends of 11/29 in Darwin were displaced. This resulted in the flight crew planning for and conducting the RWY 11 VOR-T displaced threshold approach instead of the RWY 11 VOR-Z standard approach.
Other factors that increased risk
Air traffic control did not request the flight crew of VH-YIS to fully readback their VOR approach clearance. This was a missed opportunity for the error to be identified and the flight crew to reconsider their decision to continue with the planned VOR-T approach.
Safety actions
Whether or not the ATSB identifies safety issues in the course of an investigation, relevant organisations may proactively initiate safety action in order to reduce their safety risk. The ATSB has been advised of the following proactive safety action in response to this occurrence.
Safety action by Virgin Australia
Following the occurrence on the 3 September 2022, Virgin Australia modified their Flight Crew Operational Notice (FCON) for Darwin Airport to remove the runway 11 displaced threshold information, and then subsequently modified the FCON further after the second occurrence to specifically highlight the displaced thresholds.
Sources and submissions
Sources of information
The sources of information during the investigation included:
Virgin Australia
the flight crews of VH-YFC and VH‑YIS
RAAF air traffic control
Airservices Australia
Civil Aviation Safety Authority
Submissions
Under section 26 of the Transport Safety Investigation Act 2003, the ATSB may provide a draft report, on a confidential basis, to any person whom the ATSB considers appropriate. That section allows a person receiving a draft report to make submissions to the ATSB about the draft report.
A draft of this report was provided to the following directly involved parties:
Virgin Australia
the flight crews of VH-YFC and VH-YIS
RAAF air traffic control
Civil Aviation Safety Authority
No draft report submissions were received.
Purpose of safety investigations
The objective of a safety investigation is to enhance transport safety. This is done through:
identifying safety issues and facilitating safety action to address those issues
providing information about occurrences and their associated safety factors to facilitate learning within the transport industry.
It is not a function of the ATSB to apportion blame or provide a means for determining liability. At the same time, an investigation report must include factual material of sufficient weight to support the analysis and findings. At all times the ATSB endeavours to balance the use of material that could imply adverse comment with the need to properly explain what happened, and why, in a fair and unbiased manner. The ATSB does not investigate for the purpose of taking administrative, regulatory or criminal action.
Terminology
An explanation of terminology used in ATSB investigation reports is available here. This includes terms such as occurrence, contributing factor, other factor that increased risk, and safety issue.
Publishing information
Released in accordance with section 25 of the Transport Safety Investigation Act 2003
Ownership of intellectual property rights in this publication
Unless otherwise noted, copyright (and any other intellectual property rights, if any) in this report publication is owned by the Commonwealth of Australia.
Creative Commons licence
With the exception of the Coat of Arms, ATSB logo, and photos and graphics in which a third party holds copyright, this publication is licensed under a Creative Commons Attribution 3.0 Australia licence.
Creative Commons Attribution 3.0 Australia Licence is a standard form licence agreement that allows you to copy, distribute, transmit and adapt this publication provided that you attribute the work.
The ATSB’s preference is that you attribute this publication (and any material sourced from it) using the following wording: Source: Australian Transport Safety Bureau
Copyright in material obtained from other agencies, private individuals or organisations, belongs to those agencies, individuals or organisations. Where you wish to use their material, you will need to contact them directly.
[1] Eastern Standard Time (EST): Universal coordinated Time (UTC) + 10 hours.
[2] Notice To Airmen (NOTAM): A notice distributed by means of telecommunication containing information concerning the establishment, condition or change in any aeronautical facility, service, procedure, or hazard, the timely knowledge of which is essential to personnel concerned with flight operations.
[3] Flight Crew Operational Notice (FCON): A notice from Virgin Australia to their flight crews containing relevant information about airports and operational aspects of a flight.
[4] Automatic Terminal Information Service (ATIS): The provision of operational information required by aircraft for take-off or landing that is broadcast on a dedicated frequency and/or on the voice channel of radio navigation aids.
[5] Central Standard Time (CST): Universal Coordinated Time (UTC) + 9.5 hours.
[6] Precision Approach Path Indicator (PAPI): A visual aid located next to the runway that provides guidance to a pilot in maintaining the correct approach path by a series of lights.
[7] Aircraft Communications Addressing and Reporting System (ACARS): a digital datalink system for transmission of short messages between aircraft and ground stations via VHF radio.
On 17 September 2021, intermodal freight train 8796, operated by Aurizon, was en route from the Stuart terminal (near Townsville) to Brisbane, Queensland. One of the wagons was loaded with a flat rack carrying a heavy road vehicle tipping trailer that was out of gauge (over the permissible height for the route).
During the journey, the trailer’s hydraulic lifting post collided with the overhead structure of Alexandra Bridge in Rockhampton, causing damage to the bridge and trailer. There were no injuries and no damage to the train.
What the ATSB found
The Stuart terminal was an intermodal freight facility that was cooperatively operated between Linfox and Aurizon. Linfox was responsible for the movement of road freight to and from the terminal, and owned the wagons. Aurizon conducted the loading of rail wagons at the terminal and was responsible for rail operations and rail safety, including the safety and integrity of loads.
The tipping trailer was a Linfox asset rather than customer freight. As such, it was not managed through Linfox’s normal process, which required any non-standard loads to be referred to management for approval. The Linfox capacity officer who entered the load into the freight management system was not advised that the trailer was a tipping trailer and, as a result, it was entered into the system with generic, incorrect dimensions and with no indication of it being potentially out-of-gauge. In addition, unlike at other terminals where Linfox was directly involved in loading trains, Linfox did not have a process for internal, non-standard freight movements at the Stuart terminal to be reviewed and approved for conformance to the permissible loading profile for transport via rail.
The tipping trailer was secured onto a flat rack by Linfox staff, and then lifted onto the wagon by an Aurizon heavy lift operator. The heavy lift operator misjudged the height of the freight when loading the wagon, likely associated with the heavy lift operator not having any nearby reference objects and having a high level of expectancy that the load would not be out of gauge (given that non-standard loads were rarely encountered and there had been no prior indication that this load would be out of gauge).
Later, while conducting a walking inspection of the completed consist, the heavy lift operator did not detect the over-height load, probably due to expectancy and being focussed on checking that the loads were secure rather than their height. Similarly, the out-of-gauge load was not detected during 2 subsequent roll-by inspections (one at Stuart and one at Merinda).
At the Stuart terminal, Aurizon did not routinely apply a process to verify that the dimensions of non-standard loads were within the permissible loading profile. Aurizon had previously had a tool for measuring the height of loads at the terminal. However, at the time of the occurrence, it did not have any measuring equipment available to identify freight loads that were outside the permissible loading profile for transport via rail.
What has been done as a result
Aurizon reported that it carried out a range of safety actions as a result of this occurrence, including:
installing a passive over-height warning device (jangle bar) as temporary corrective action, and initiating assessment in relation to automated controls
updating its freight management system and booking system and implementing procedures for the identification of non-standard freight
revising competency assessments for forklift and reach stacker operators
reviewing its loading and securing training and standards.
Linfox advised that it would train forklift and operations staff in Aurizon loading and securing and produce a quick reference guide for loaders, and it arranged for non-standard items to be referred to and approved by the capacity and rail network manager.
Safety message
In the absence of measuring equipment, or nearby objects of a known and relevant height, it is difficult to accurately estimate the dimensions of loaded freight, especially when judging the height of tall freight from ground level. Tools to alleviate this limitation will be significantly more accurate and come with minimal cost and should be available to personnel involved in loading non-standard loads.
The occurrence
Freight arrangements
Intermodal freight train 8796, operated by Aurizon, was a regular service between Stuart (near Townsville) to Acacia Ridge (in Brisbane), Queensland on the North Coast Line (Figure 1). At the Stuart terminal, Aurizon was responsible for the loading of freight onto wagons and Linfox was responsible for the movement of road freight to and from the terminal. Queensland Rail (QR) was the rail infrastructure manager for most of the North Coast Line.
Figure 1: Shipping route
Source: Queensland Rail, annotated by ATSB
On 15 September 2021, the Linfox warehouse supervisor at the Stuart terminal made a request (via phone) to a Linfox capacity officer at Acacia Ridge for a (heavy road vehicle) trailer to be transported via rail from Stuart to Brisbane.
The trailer was a tipping skeletal trailer (Figure 2) that was designed to be towed by a prime mover for transporting shipping containers via road, with the capability of raising one end to unload its contents. It had an incorporated hydraulic lifting post to facilitate the tipping process. The height of the tipping trailer, including the hydraulic lifting post, was 3.070 m. The trailer was a Linfox asset based at the Stuart terminal and it was being transported to be used by Linfox at the Acacia Ridge terminal.
Figure 2: Tipping skeletal trailer dimensions
All measurements are in mm. Shown attached to a prime mover and loaded with a 20-foot container.
Source: Aurizon
The Linfox capacity officer entered the trailer into Aurizon’s A2B freight management system for rail transport. It was entered in the system as a flat rack unit,[1] with a length of 12.192 m and height of 2.743 m, which was the default height in the A2B system. It was classified as ‘general domestic’ freight.
The flat rack type used for the trailer was common to the freight operation, and it had a height 0.260 m. The total height above the wagon floor of the tipping trailer’s hydraulic lifting post on a flat rack was therefore 3.330 m. This was 0.590 m above the maximum permissible height of a load on the QR network.
In their conversation with the capacity officer, the Linfox supervisor did not describe the trailer as a tipping trailer and did not provide (and was not asked to provide) its dimensions. The capacity officer later stated that they were aware that the tipping version of the trailer was probably out of gauge,[2] but they had not been advised that this particular trailer was the tipping version. Accordingly, they thought they were arranging to transport a normal (non-tipping) trailer. They did not change the default dimensions of the load in the freight management system and the consignment note did not include an out-of-gauge warning or indication.
Loading and departure
At about 1150 local time on 16 September, Linfox personnel reversed the trailer with a prime mover onto a flat rack at the Stuart terminal and secured it for transport. A closed-circuit television (CCTV) recording showed that several Linfox personnel were involved in the loading process (Figure 3). The dimensions of the loaded flat rack were not measured during this process.
Figure 3: Loading and securing the tipping trailer on to a flat rack at Stuart Yard
Source: Aurizon
After the trailer was secured onto the flat rack, the Linfox supervisor notified an Aurizon heavy lift (forklift) operator that the trailer was ready to be loaded. At 1347, the heavy lift operator lifted the flat rack with the tipping trailer by forklift onto a flat rail wagon (number BCZY 46459). The load’s dimensions were not verified, and the heavy lift operator did not identify that the load was potentially out of gauge.
The wagons were then shunted onto the train. From 1740 to 1805, the heavy lift operator completed a test and inspection of the completed rail consist, including the wagon with the loaded trailer, checking for container and load security. The inspection was from an area beside the track with eye height below the top of the trailer. They did not identify that the load was potentially out of gauge during this process.
At 1912, train 8796 departed the Stuart terminal as a driver-only operation with a 2800 class locomotive. During the departure of the train, a roll-by inspection[3] was conducted by Aurizon personnel, which did not identify the over-height wagon.
At 2240, additional wagons were added at Merinda. A roll-by inspection at that location did not identify any problems.
A driver crew change occurred at Mackay and the train departed Mackay at 0225 on 17 September. On this section of the journey it had 26 container wagons and was 526 m long with a total weight of 1,164 t, and the consist was predominantly containerised freight and empty flat-bed wagons. The wagon carrying the trailer was the 23rd wagon.
Collision with Alexandra Bridge
At about 0723 on 17 September, the train entered the Alexandra Bridge structure, just outside of Rockhampton Yard, travelling at approximately 25 km/h. The Alexandra Bridge is a concrete pillar and steel truss bridge over a river located in the centre of Rockhampton, serviced by a single rail line and a pedestrian pathway.
Approximately 2 minutes later, the hydraulic lifting post on the trailer impacted the entry crossbeam of the bridge as its wagon passed onto the bridge (Figure 4). A CCTV recording showed the impact with the crossbeam at the northern end of the bridge causing damage to the girder and buckling of bridge braces. Additionally, the bracing rails on the trailer bent under the impact, forcing the hydraulic lifting post to bend backwards. This gave the trailer clearance under the bridge structure for the rest of its journey across the bridge.
Train 8796 continued to Rockhampton, with the driver unaware that the collision had occurred. At 0734 the train entered Rockhampton Yard.
Figure 4: Trailer collision with bridge
Source: Rockhampton Regional Council
Identification of the damaged trailer
The damaged tipping trailer was observed at Rockhampton Yard (Figure 5). The wagon was removed from the consist and QR was notified of the damage at about 1020.
At 1230, the rail traffic crew of Aurizon train 8798 reported damage to the overhead structure on Alexandra Bridge. QR track workers conducted an inspection of the rail corridor between Stuart and Rockhampton, and they determined that only Alexandra Bridge had been damaged (Figure 6). Rockhampton Regional Council confirmed the impact of the bridge through the review of a CCTV recording.
The bridge was deemed fit for the return of services by QR engineering personnel and reopened to rail traffic at 1530 on 17 September with a 10 km/h speed restriction, pending further assessment.
Source: Aurizon (upper), Linfox (lower), annotated by the ATSB
Figure 6: Alexandra Bridge girder damage
Source: Queensland Rail, annotated by the ATSB
Context
Track and network information
The North Coast Line consists of 1,680 km of railway between Cairns and Brisbane. Queensland Rail (QR) was the rail infrastructure manager for about 1,567 km, including the section from Townsville to Rockhampton.
The maximum permissible load height on the on the North Coast Line from Townsville to Brisbane was 3.820 m above the rail, or 2.740 m above the wagon floor with a standard 1.080-m high wagon. Therefore, with a total height of 4.410 m, the wagon with the flat rack and tipping trailer was 0.590 m above the maximum permissible load height.
Following the accident, QR measured the clearance between rail and the structure of Alexandra Bridge to be 4.312 m, which was 12 mm more than the bridge’s design clearance. Figure 7 compares the outline of a standard shipping container with the height of the Alexandra Bridge and the height of the tipping trailer’s hydraulic lifting post.
Figure 7: North Coast Line standard container loading outline[4] with overlays of tipping trailer and Alexandra Bridge beam heights
All measurements are in mm. The added Alexandra Bridge and tipping trailer height overlays are for illustrative purposes only.
Source: Aurizon, modified by ATSB
The track south of Rockhampton was electrified with sections of overhead contact wires as low as 4.349 m above the track level.
Stuart terminal
The Stuart terminal was an intermodal freight facility about 11 km south of Townsville that was cooperatively operated between Linfox and Aurizon. Linfox was responsible for the movement of road freight to and from the terminal and owned the wagons, with a ‘hook and pull’ (wagon hauling) agreement in place with Aurizon. Aurizon conducted the loading of rail wagons and was responsible for rail operations and rail safety, including the safety and integrity of loads. This arrangement meant that there was a combination of both Linfox and Aurizon personnel working at the terminal.
Most of the freight passing through Stuart Yard was in 20-foot or 40-foot containers, though occasionally non-containerised freight was also transported.
At the time of the occurrence, Aurizon was responsible for loading trains at Stuart and one other terminal on the North Coast Line. At other terminals (such as Acacia Ridge), Linfox was responsible for the loading.
Freight booking information
Aurizon and Linfox used a freight management system called A2B to coordinate the movement of items.
Provisions were in place where freight known to be exceeding the standard outline could be transported. In those circumstances, when freight was known to be out of gauge, an authority to travel (ATT) authorisation was required to be obtained with specific restrictions (for example, only to travel through certain tracks or not to pass other rail traffic in certain areas). Even with an ATT in place, there was still maximum limitations due to various factors, such as tunnel sizes, overhead electrical equipment and bridges. Where an ATT was approved, the freight terminal would be advised directly, and a notation made on the consignment note applicable for the freight being transported, warning the loading operators of the oversized item.
Linfox reported that clients normally booked freight through its customer service team. Any non-standard freight bookings (or freight that did not fit into standard containers) would be referred to a manager for approval. In this case, however, the tipping trailer was an internal asset that was already in the yard at Stuart and the booking process bypassed this process.
The Linfox warehouse supervisor at the Stuart terminal had only recently (within 3 months) commenced work at that terminal. They reported that they had arranged for the transport of tipping trailers by rail when working at another depot in another state, but had not previously arranged for transport of a tipping trailer from the Stuart terminal or on the North Coast Line.
Linfox advised that it had processes for checking the dimensions of freight at terminals where Linfox were involved in loading freight onto trains. However, since Linfox did not load freight onto rolling stock at the Stuart Terminal, there was no procedure in place for measurement of the dimensions of any non-standard freight received at the Stuart terminal prior to requesting Aurizon personnel to load the freight onto a train. The warehouse supervisor also advised that they were not aware of the specific dimensions of loads that were allowable on the North Coast Line. They were relying on the Aurizon personnel at the terminal to check the load and determine whether the load was suitable for rail travel. This was consistent with the process they were familiar with when working at other terminals.
Freight loading information
Aurizon’s Loading and Securing Standard provided instruction on the safe transport of different types of freight by rail or road throughout Australia. It noted that a rail infrastructure manager (RIM) was responsible for defining freight outlines and for the authorisation of out-of-gauge loads, and a rolling stock operator was responsible for ensuring freight complied with the RIM’s instructions. It also stated that, for rail transport, the rolling stock operator (in this case Aurizon) was responsible for ensuring:
Loading that exceeds or infringes the permissible outlines applicable to the type of loading and the routes over which it will travel is not transported, unless it has a valid out of gauge certificate
All loading that is suspected of being close to or outside the applicable outline is referred to the RIM for investigation
Aurizon’s Loading and Securing of Freight Manual emphasised that out-of-gauge loads were not allowed to travel on Aurizon trains without an ATT. It also stated that the workers responsible for loading and securing freight were responsible for (among other things) ensuring that freight was loaded so that its overall size was within the (specified) standard loading outlines. Aurizon provided such personnel with a checklist for loading and securing flat racks, which included the loading outline and maximum allowed dimensions.
The Aurizon heavy lift (forklift) operator had worked in that role at the Stuart terminal for about 10 years, and they had undertaken the organisation’s online loading and securing training within the required time period. The heavy lift operator could not recall loading any out-of-gauge loads in the last 5 years. They stated they had knowledge of other (heavy road vehicle) trailers being transported on flat racks without any problems, and they also thought (but were not sure) that tipping trailers had been transported before. At the time they loaded this specific tipping trailer, they did not consider the height to be an issue. They had received no indication through the consignment note, their supervisor or the Linfox warehouse supervisor that the load was actually or potentially out of gauge. Other personnel who saw the loaded flat rack also indicated that they did not consider the height to be an issue.
Personnel reported that shipping containers were sometimes used as a general indication of the allowable freight envelope. On this occasion, although a 20-foot shipping container[5] was near the tipping trailer when it was loaded onto the flat rack by Linfox personnel, there was no container on the ground near the flat rack when it was lifted onto the wagon. The heavy lift operator also stated that there were no other containers on adjacent wagons at that time. There were containers loaded on the adjacent wagons when the completed rail consist was inspected at the Stuart terminal and at Merinda.
Aurizon advised the ATSB that pre-loaded flat racks that arrived at the terminal needed to pass an incoming inspection at the terminal’s entrance gate. However, it rarely received loaded flat racks via the entrance gate. Aurizon also advised that it was not a routine or consistent practice for the documented dimensions of non-standard freight to be physically verified, or for the train’s loading outline to be measured, during the loading process.
In addition, there were no tools or equipment provided for checking the dimensions of non-standard freight. Aurizon previously had a load height-measuring staff at Stuart to gauge a train’s height. This L-shaped staff or pole was held next to a wagon, and if the total load exceeded its height, that wagon would not be allowed to travel. This staff was a locally-implemented risk control; Aurizon’s safety management system did not specifically require it to be in place. After moving from previous facilities to the current Stuart terminal, the staff was no longer available to loading personnel.
The Stuart terminal did not have a viewing platform to assist with identifying out-of-gauge loads. There were also no other devices installed at the terminal to verify that loads were below the maximum permissible height or indicate over-height loads.
The ATSB has previously investigated a number of other occurrences involving loads out of gauge or not effectively secured. Some recent investigations include:
On 15 June 2020, a wagon body became dislodged from the bogie during unloading at Coopers Plains, Queensland.[6] As part of the consist of train 2BW4, the wagon body later contacted and caused damage to platforms at Grafton, Coffs Harbour, Taree, Wingham and Dungong, New South Wales. The train had been inspected before departure, and again after damage to the Grafton platform was identified.
On 18 August 2018, a collapsible rear end wall of a flat rack raised up en route and contacted an overpass on approach to Cooroy, Queensland, pulling down 1.3 km of high voltage overhead line equipment.[7] The ATSB found that personnel at the Acacia Ridge terminal did not check the collapsible end walls of the flat racks were secured on arrival at the terminal and after the flat racks were loaded. In addition, Aurizon, did not have an effective system in place for ensuring personnel required to check the securing of unusual loads (such as empty flat racks) prior to departure had sufficient knowledge of their responsibilities, and had ready access to relevant procedures, guidance and checklists.
On 16 January 2018, an incorrectly-secured container on freight train 2BM9 collided with station infrastructure at Maitland, New South Wales, causing damage to gutter retaining brackets.[8] The investigation found that the departing train inspection did not detect the incorrectly-secured container, and that the collision with infrastructure was also partially due to raised track height at the station relative to the documented design.
Safety analysis
Out-of-gauge load
The total height of the wagon, flat rack container and tipping trailer’s hydraulic lifting post was 4.410 m, which exceeded the maximum allowable height for the North Coast Line by 0.590 m. The clearance for Alexandra Bridge was 4.312 m from the top of the rail, which meant the load was about 0.1 m too high for the bridge.
The driver was unaware of the collision due to the train’s low speed and the location of the wagon near the rear of the consist. Instead, the damage was identified by personnel at the Rockhampton yard, which ensured the out-of-gauge load did not continue further on the network. Had the trailer not been damaged by the collision with the bridge, it would have also exceeded the clearance height of the electrical overhead lines in various locations between Rockhampton and Brisbane, posing a significant hazard.
Processes for detecting out-of-gauge loads during freight booking
A large proportion of freight passing through the Stuart terminal was in shipping containers and therefore fitted within the required dimensions to be transported by rail. Freight that did not fit in a container still had to remain inside the maximum permissible outline for transportation to avoid collision with trackside objects and other rail traffic.
The potential for a non-standard load to be out of gauge should be evaluated during the booking process. In this case, as the tipping trailer was a Linfox asset being moved from one freight terminal to another, it was not managed through the organisation’s normal process for client bookings, which required any non-standard loads to be referred to relevant management personnel for approval when the load was being entered into the freight management system.
Instead, an informal process was used on this occasion, which involved the Linfox warehouse supervisor at Stuart requesting a capacity officer to make a booking. Because of the incomplete way the trailer was described to the Linfox capacity officer (that is, as a trailer, which would normally fit well within the required dimensions), there was limited opportunity for that officer to identify that the load was potentially out of gauge.
Accordingly, the consignment information for the trailer did not identify it as at out-of-gauge load, which would have triggered a process to determine whether it could be given an authority to travel (ATT) authorisation. The consignment information also did not contain any indication that the load could potentially be out-of-gauge. It specified the trailer as a generic flat rack container with default and therefore incorrect dimensions and an incomplete description of the item (that is, it was not specified as a tipping trailer). This limited the opportunity for personnel at the terminal to determine its suitability for the rail corridor.
The trailer was loaded onto the flat rack by Linfox personnel at the Stuart terminal and observed by multiple Linfox personnel at the time. However, these personnel were responsible for providing the load from the road interface, and not with rail shipment. Consequently, they had no specific knowledge of the dimensional requirements of non-standard freight and routinely did not measure such freight to ensure it was within the required dimensions before handing it over to Aurizon personnel for loading onto a wagon.
Ideally all out-of-gauge loads will be identified prior to the freight being transferred to the organisation responsible for loading it onto the wagon or train. In this case, the problem associated with Linfox transporting an internal asset appeared to be a relatively rare event, and there were processes for checking the dimensions of freight at other terminals. Nevertheless, there can be a variety of reasons why potentially out-of-gauge loads may occasionally be received for transport, or loads may become out-of-gauge during the preparation and loading process. Accordingly, the organisation preparing freight for loading onto a train should ensure it has robust processes to identify such loads.
Processes for detecting out-of-gauge loads during freight loading
The Aurizon heavy lift operator had not recently encountered any out-of-gauge loads and was aware of many other trailers having travelled along on the North Coast Line. It is likely that most (if not all) of the other trailers were not the tipping type, and therefore fitted within the required dimensions.
Expectations based on past experience strongly influence where a person will search for information and what they will search for (Wickens and McCarley 2008), and they also influence the perception of information (Wickens and others 2013). In simple terms, people are more likely to see what they expect to see, and less likely to see what they do not expect to see. Accordingly, the heavy lift operator’s low frequency of encountering out-of-gauge loads and expectancies regarding the size and nature of previous trailers probably influenced their ability to identify the height problem associated with the hydraulic lifting post on this occasion. The absence of any information in the consignment note to indicate that the load was potentially problematic would have reinforced these expectations.
The perception of heights, lengths and distances can be subject to many biases, and are more accurate when there are known reference objects to use in close proximity. In this case, when the heavy lift operator lifted the load onto the flat rack with the tipping trailer onto the wagon, there were no useful reference objects (such as shipping containers) next to the trailer.
The heavy lift operator later conducted a walking inspection of the consist. When conducting this inspection from ground level, the view to the top of the hydraulic lifting post would have been affected by parallax error, which would have made identification of the over-height load more difficult. Although there were containers on adjacent wagons at that stage, the over-height lifting post was not identified. At that time, the heavy lift operator (and other personnel) probably had a high level of expectancy that all of the freight they loaded was within the required dimensions and they were focussed on checking that the loads were secure.
The out-of-gauge load was not detected during 2 subsequent roll-by inspections (one at Stuart and one at Merinda). This may have been associated with a similar expectancy that loads would be within the required dimensions.
Aurizon did not have a routine process in place at the terminal to measure the dimensions of non-standard loads, and there was also no equipment available to easily check the dimensions of loads. Aurizon previously used an L-shaped staff (or pole) to estimate the height of out-of-gauge or potentially out-of-gauge loads at the Stuart terminal, but this tool was no longer available at the time of the occurrence, so estimation of the height was left to the judgement of individuals. The tool had been developed locally at the freight operator’s previous facilities and it was not a requirement or formally recognised part of the rolling stock operator’s safety management system.
Inherent problems associated with relying on informal risk controls and then managing change have been noted in previous ATSB investigations.[9] A detailed review of the change management process in this case was considered beyond the useful scope of the present investigation.
Given the various factors that can influence the ability of personnel to correctly perceive the dimensions of loads, organisations involving in the loading and dispatch of freight trains therefore need to ensure they have suitable equipment, processes and practices for confirming or checking the dimensions of all non-containerised loads on wagons. Such risk controls would ideally include the equipment to automatically detect out-of-gauge loads. Alternatively, the use of equipment to make it easier and more reliable for relevant personnel to inspect loads and confirm that they are within permissible limits should be considered.
Findings
ATSB investigation report findings focus on safety factors (that is, events and conditions that increase risk). Safety factors include ‘contributing factors’ and ‘other factors that increased risk’ (that is, factors that did not meet the definition of a contributing factor for this occurrence but were still considered important to include in the report for the purpose of increasing awareness and enhancing safety). In addition ‘other findings’ may be included to provide important information about topics other than safety factors.
Safety issues are highlighted in bold to emphasise their importance. A safety issue is a safety factor that (a) can reasonably be regarded as having the potential to adversely affect the safety of future operations, and (b) is a characteristic of an organisation or a system, rather than a characteristic of a specific individual, or characteristic of an operating environment at a specific point in time.
These findings should not be read as apportioning blame or liability to any particular organisation or individual.
From the evidence available, the following findings are made with respect to the collision with infrastructure involving freight train 8796 at Rockhampton, Queensland, on 17 September 2021.
Contributing factors
The dimensions of the tipping trailer were not entered correctly into the freight management system when the shipment was being arranged, and there was no indications that the trailer was potentially out of gauge.
Linfox did not have a process for internal, non-standard freight movements at the Stuart terminal to be reviewed and approved for conformance to the permissible loading profile for transport via rail.
Judging the load’s height without a reference, the heavy lift operator did not detect the over-height load when loading the wagon or later when conducting a walking inspection of the consist from ground level. This allowed the over-height wagon to enter the rail corridor.
At the Stuart terminal, Aurizon did not routinely apply a process to verify that the dimensions of non-standard loads were within the permissible loading profile, and it did not have measuring equipment available to identify freight loads that were outside the permissible loading profile for transport via rail. (Safety issue)
Safety issues and actions
Central to the ATSB’s investigation of transport safety matters is the early identification of safety issues. The ATSB expects relevant organisations will address all safety issues an investigation identifies.
Depending on the level of risk of a safety issue, the extent of corrective action taken by the relevant organisation(s), or the desirability of directing a broad safety message to the rail industry, the ATSB may issue a formal safety recommendation or safety advisory notice as part of the final report.
All of the directly involved parties were provided with a draft report and invited to provide submissions. As part of that process, each organisation was asked to communicate what safety actions, if any, they had carried out or were planning to carry out in relation to each safety issue relevant to their organisation.
Descriptions of each safety issue, and any associated safety recommendations, are detailed below. Click the link to read the full safety issue description, including the issue status and any safety action/s taken. Safety issues and actions are updated on this website when safety issue owners provide further information concerning the implementation of safety action.
Safety issue description: Aurizon did not have measuring equipment available at its Stuart Yard to identify freight loads that were outside the permissible loading profile for transport via rail.
Safety action not associated with an identified safety issue
Whether or not the ATSB identifies safety issues in the course of an investigation, relevant organisations may proactively initiate safety action in order to reduce their safety risk. The ATSB has been advised of the following proactive safety action in response to this occurrence.
Additional safety action by Linfox
Linfox advised that it would train forklift and operations staff in Aurizon loading and securing and produce a quick reference guide for loaders.
Linfox also advised:
An awareness campaign has been completed so that all non-standard items are to be referred to and approved by the QLD Capacity and Rail Network Manager. This is regardless of its nature as customer freight or internal shipments.
Linfox are also considering the feasibility of making alterations to the WAVE software system (which has replaced the previous A2B system) to provide a systematic prompt for dimensions when non-standard containers types (flat racks or open top container) are lodged.
Glossary
ATT Authority to travel
CCTV Closed-circuit television
Out of gauge Exceeding the limits of the approved kinematic envelope, or outline, of the rail corridor to remain clear of obstructions
QR Queensland Rail
RIM Rail infrastructure manager
Sources and submissions
Sources of information
The sources of information during the investigation included:
Aurizon
Linfox
Queensland Rail
Rockhampton Regional Council
the heavy lift operator, capacity officer and freight supervisor.
References
Wickens CD, Hollands JG, Banbury S and Parasuraman R (2013) Engineering psychology and human performance, 4th edition, Pearson Boston, MA.
Under section 26 of the Transport Safety Investigation Act 2003, the ATSB may provide a draft report, on a confidential basis, to any person whom the ATSB considers appropriate. That section allows a person receiving a draft report to make submissions to the ATSB about the draft report.
A draft of this report was provided to the following directly involved parties:
Aurizon
Linfox
the Office of the National Rail Safety Regulator (ONRSR)
Queensland Rail
the heavy lift operator, capacity officer and freight supervisor.
Submissions were received from Aurizon, Queensland Rail and ONRSR and additional information was received from Linfox. The submissions were reviewed and, where considered appropriate, the text of the report was amended accordingly.
Purpose of safety investigations
The objective of a safety investigation is to enhance transport safety. This is done through:
identifying safety issues and facilitating safety action to address those issues
providing information about occurrences and their associated safety factors to facilitate learning within the transport industry.
It is not a function of the ATSB to apportion blame or provide a means for determining liability. At the same time, an investigation report must include factual material of sufficient weight to support the analysis and findings. At all times the ATSB endeavours to balance the use of material that could imply adverse comment with the need to properly explain what happened, and why, in a fair and unbiased manner. The ATSB does not investigate for the purpose of taking administrative, regulatory or criminal action.
Terminology
An explanation of terminology used in ATSB investigation reports is available here. This includes terms such as occurrence, contributing factor, other factor that increased risk, and safety issue.
Publishing information
Released in accordance with section 25 of the Transport Safety Investigation Act 2003
Ownership of intellectual property rights in this publication
Unless otherwise noted, copyright (and any other intellectual property rights, if any) in this report publication is owned by the Commonwealth of Australia.
Creative Commons licence
With the exception of the Coat of Arms, ATSB logo, and photos and graphics in which a third party holds copyright, this publication is licensed under a Creative Commons Attribution 3.0 Australia licence.
Creative Commons Attribution 3.0 Australia Licence is a standard form licence agreement that allows you to copy, distribute, transmit and adapt this publication provided that you attribute the work.
The ATSB’s preference is that you attribute this publication (and any material sourced from it) using the following wording: Source: Australian Transport Safety Bureau
Copyright in material obtained from other agencies, private individuals or organisations, belongs to those agencies, individuals or organisations. Where you wish to use their material, you will need to contact them directly.

[1] Flat racks are a type of shipping platform designed for oversized loads that do not fit inside a standard shipping container.
[2] Out of gauge: exceeding the limits of the approved kinematic envelope, or outline, of the rail corridor to remain clear of obstructions.
[3] Roll-by inspection: an inspection conducted by a qualified worker to identify issues with the rail consist, normally for wheel lockups or dragging equipment. It was conducted while standing at ground level adjacent to the train as it slowly ‘rolls’ past the worker under locomotive power.
[4] The loading outline is a 2-dimensional cross-section of the maximum permissible envelope or shape of a rail vehicle at rest.
[5] The height of a standard 20-foot shipping container is about 2.6 m.
[6] ATSB investigation RO-2020-009, Wagon out of gauge on freight train 2BW4, Main North rail line, New South Wales, on 16 June 2020.
[7] ATSB investigation RO-2018-011, Dewirement involving freight train YC77, Cooroy, Queensland, on 18 August 2018.
[8] ATSB investigation RO-2018-003, Loading irregularity on train 2BM9, Maitland, NSW on 16 January 2018.
[9] For example, ATSB Occurrence Investigation AO-2009-072 (reopened), Fuel planning event, weather-related event and ditching involving Israel Aircraft Industries Westwind 1124A, VH-NGA, 6.4 km WSW of Norfolk Island Airport, 18 November 2009.
Section 21 (2) of the Transport Safety Investigation Act 2003 (TSI Act) empowers the ATSB to discontinue an investigation into a transport safety matter at any time. Section 21 (3) of the TSI Act requires the ATSB to publish a statement setting out the reasons for discontinuing an investigation. The statement is published as a report in accordance with section 25 of the TSI Act, capturing information from the investigation up to the time of discontinuance.
Overview of the investigation
The ATSB commenced an investigation into a flight control issue involving a Virgin Australia Boeing 737-8FE aircraft, registered VH-VIE, which occurred near Perth Airport, Western Australia (WA) on the afternoon of 31 July 2021. The flight was a scheduled passenger service from Perth WA to Brisbane, Queensland.
During initial climb, the crew detected that the aircraft had commenced an uncommanded descent. The Captain disconnected the autopilot, leaving the autothrottle engaged while descending through 1,536 ft and manually trimmed the aircraft using the electrical stabiliser trim. Shortly afterwards, the crew received an enhanced ground proximity warning system (EGPWS) ‘DON’T SINK’ alert. The aircraft was re-established in a climb configuration.
At 2,144 feet, the Captain re-engaged the autopilot. Six minutes later, at 17,888 feet, the autopilot automatically disengaged. The autothrottle then also disengaged for reasons undetermined. To test if there was a problem with the A system autopilot, the crew engaged the B system autopilot and re-engaged the autothrottle. Shortly afterwards, air traffic control (ATC) queried the crew if their operations were normal. While responding to ATC, the crew detected the ‘STAB OUT OFF TRIM’ light illuminated and advised ATC to standby for further details. The crew then began the associated Quick Reference Handbook Non-Normal Checklist and while doing so, the B system autopilot automatically disengaged. The crew followed the checklist by not re-engaging the autopilots and autothrottle, and continued to manually fly the aircraft.
Once in cruise, the crew contacted ATC advising that they were unable to fly at reduced vertical separation minima (RVSM)[1] and requested a block level [2] clearance of flight level (FL) 380 to FL400 due to stable atmospheric conditions. The crew then discussed the risks of continuing the flight to Brisbane. After liaising with company engineers, referring to company documentation and examining the weather at the departure, alternate and arrival airports, the crew decided to continue to Brisbane. The crew also assessed their fitness to fly, and distributed different phases of flight to each other to manage workload and fatigue. They communicated with their Chief Pilot and requested an off-duty company pilot, who was flying to Brisbane as a passenger, to join them in the cockpit to provide additional support if required.
A post-flight engineering inspection found that the circuit breaker for the automatic flight control system (AFCS) stabiliser trim was in the tripped position and the STAB OUT OF TRIM light was faulty. Engineers reset the circuit breaker, but were unable to replicate the fault during testing. The faulty light was replaced, but was considered unrelated to the tripped circuit breaker. The reason for the tripped circuit breaker was not established. A verification flight ensured that the AFCS was commanding the stabiliser without any issues. No further faults were detected.
As part of the investigation the ATSB:
interviewed the flight crew
examined the recorded flight data and the operator’s and aircraft manufacturer’s procedures
examined the crew’s in-flight decision making.
The ATSB found that at all stages of the flight, the flight crew acted in accordance with operator’s and aircraft manufacturer’s procedures, and had considered and managed the risks associated with continuing the flight.
Reasons for the discontinuation
Based on a review of the available evidence, the ATSB considered it was unlikely that further investigation would identify any systemic safety issues or important safety lessons. Consequently, the ATSB has discontinued this investigation.
The evidence collected during this investigation remains available to be used in future investigations or safety studies. The ATSB will also monitor for any similar occurrences that may indicate a need to undertake a further safety investigation.
On the afternoon of 18 August 2021, an Airbus Helicopters Deutschland BO105 CBS‑5 helicopter registered VH-NVH and operated by Surf Life Saving Queensland, departed Archerfield Aerodrome, Queensland to conduct aerial work operations. There were 3 crew on board.
During initial climb, the pilot noticed the onset of abnormal airframe vibration, which became more severe as airspeed increased. The pilot returned the helicopter to Archerfield, where it was landed without incident. The pilot subsequently identified a crack in one of the main rotor blades.
What the ATSB found
The main rotor blade crack was consistent with the in-flight vibration experienced. The crack originated at the location of a previous blade repair, and minor damage was also present in the same location on the other 3 rotor blades. There were no manufacturing or operational factors identified for the blade damage.
Decisions regarding whether to conduct an investigation, and the scope of an investigation, are based on many factors, including the level of safety benefit likely to be obtained from an investigation. For this occurrence, a limited-scope investigation was conducted in order to produce a short investigation report and allow for greater industry awareness of findings that affect safety and potential learning opportunities.
After a normal start, the pilot brought the helicopter into a hover with no issues. However, during initial climb through about 40 kts, the pilot noticed the onset of abnormal airframe vibration. The vibration worsened through 60 kts, where the pilot likened it to a significant rotor track-and-balance issue. The pilot reduced power, levelled off at about 500 feet and returned the helicopter to Archerfield, where it was landed without incident.
After landing the pilot examined the rotor head and found no defect. The pilot then spoke with the operations officer, who had been on the most recent flight for VH-NVH, the previous day. They discussed that the helicopter had developed a very mild vibration towards the end of that flight. The occurrence pilot also spoke with the previous day’s pilot, regarding the minor change in vibration levels. That pilot reported to the ATSB that the vibration was noticeable, but they had observed similar vibrations previously, and it was not at all concerning. In addition, the change in vibration had been attributed to additional payload that the helicopter was carrying, and nothing was identified in the post-flight inspection. The occurrence pilot subsequently returned to the helicopter and identified a crack in one of the main rotor blades.
The BO105 is a light, twin engine, 4 blade helicopter. VH-NVH was airframe serial number S 923, which was manufactured in 1996 and first registered in Australia in 2012. The helicopter employs a rigid rotor head, with flexible main rotor blades of glass fibre-reinforced composite construction. VH-NVH was fitted with ‘Type 2’ blades, part number 105-15108V001, which had a rectangular blade planform and a tapered tip.
Main rotor blade examination
ATSB investigators visually inspected the blades at the operator’s facility.
Blade serial number 783 was cracked approximately 1,700 mm from the blade root. The visible crack on the underside of the blade extended from the trailing edge of the blade for approximately 160 mm. The first part of the crack was parallel to the blade chord, before deviating at an angle towards the blade tip (Figure 1). On the upper blade surface, the crack extended chordwise for approximately 140 mm from the trailing edge.
The remaining 3 blades from VH-NVH (serial numbers 780, 786 and 787) had visible indications of damage in the form of paint cracking or wrinkles, measuring 20-30 mm in length, at the same location along the blade (approximately 1,700 mm) from the inboard end. An example is shown in Figure 2.
Underside of main rotor blade S/N 780, 1,700 mm from the inboard end, showing paint wrinkles indicative of underlying damage.
Source: ATSB
Manufacturer’s examination
Blade 783 was shipped to Airbus Helicopters Deutschland (AHD) where it was examined in July 2022, under the supervision of the German Federal Bureau of Aircraft Accident Investigation (BFU) on behalf of the ATSB.
Following initial visual examination and measurement, the paint layers were scraped back to examine the cracked area further. The cracked portion of the blade was also subjected to computerised tomography (CT) scan to examine for internal abnormalities. The examination found that the crack on the underside of the blade went through the middle of a previous repair. The repair had been conducted in accordance with the applicable blade repair instruction and there were no anomalies noted. No specific reason for the blade cracking was identified, although it was noted that cracks at repair sites were not unusual. It was also determined that the cracked blade, in its post-occurrence condition, was within repair limits.
Main rotor blade maintenance history
The main rotor blade set, part number 105-15107V001, serial numbers 780, 783, 786 and 787 fitted to VH-NVH were manufactured in 2004. At the time of the occurrence, the blades had accrued 6,412.8 hours since new. When fitted with inner balance weight repaired to a specific procedure, the main rotor blades had a service life of 2,500 flight hours. However, the blade set fitted to VHNVH did not have the repaired inner weights and therefore did not have a defined service life. A record for the structural repair to blade 783 that was identified during AHD’s inspection was not located.
The main rotor blades were required to be removed from the helicopter for detailed inspection every 1,200 flight hours. Additionally, inspection of the blade root fitting and blade thimble was required initially at 3,600 hours and then every 1,200 hours thereafter. The blade set had most recently been removed and sent to an approved overhaul facility for detailed inspection and maintenance, including the 3,600-hour inspection, in June 2020. The blades were then fitted to VH-NVH in September 2020 and had accrued 891.8 hours since that time.
The most recent 600-hourly airframe periodic inspection, which required detailed visual examination of the main rotor blade, including for cracks and damage at the trailing edge, was carried out in April 2021, 382 hours prior to the occurrence. AHD indicated that the periodical inspection had a high probability of detection of blade cracks and skin anomalies.
An airframe supplementary inspection was carried out in July 2021, 66 hours prior to the occurrence. However, that inspection only specifically required a check of the upper and lower blade surfaces for ‘bulging’ in the vicinity of the balance weights, which was not applicable to this blade set. The main rotor blade leading-edge polyurethane erosion protection strips were replaced during both of those inspections. No other repairs or defects were noted.
Aside from the scheduled inspections, the helicopter flight manual included a pre-flight check of the main rotor blades ‘for condition’. Both the occurrence pilot and the previous day’s pilot indicated that this check was carried out, however they reinforced that it was not a detailed inspection that was unlikely to identify relatively minor cracks and defects. AHD advised that the pre-flight item prior to the blade check was a check for rotor hub oil level on top of the main rotor head, which requires the individual to stand sufficiently high on the helicopter that they could also see both blade surfaces. However, AHD similarly commented that smaller cracks or skin defects further away from the rotor head, such as those seen on the uncracked blades, would probably not be detectable.
The operator commented that they had flown BO105 helicopters for over 18,000 hours and had not previously experienced any issues with the main rotor blades. They were unaware of any operational factors that may have contributed to the cracking.
Similar occurrences
AHD indicated they were not aware of any instances of similar BO105 blade cracking in the past 10 years. This was also the first occurrence with damage to all 4 blades that AHD was aware of. They commented that the damage was unlikely to have resulted directly from flight manoeuvre loads but raised the possibility of previous blade damage and/or a similar repair to that identified on the cracked blade.
The rigid rotor head and composite blades employed by the BO105 were similarly used in the BK117 helicopter. The EC135 helicopter also has a similar main rotor blade design and structure. As such, the ATSB asked AHD about the cracking and failure history regarding helicopter blades with similar construction.
In response, AHD indicated that the EC135 fleet has had a significant number of blade cracks that have occurred for various reasons. Cracks have also been experienced on the BK117, which have been attributed to a trailing edge repair process and manufacturing anomalies. Blade damage in these cases was identified either by visual inspection or by abnormal in-flight noise and vibration. The blade crack characteristics were consistent with this occurrence. The cracks progressed either chordwise or diagonally from the trailing edge, before transitioning to spanwise upon reaching the rear of the blade spar. The presence of the spar acts to arrest any further crack progression towards the leading edge.
AHD advised that in all cases of blade cracking, a safe landing was achieved. They also provided examples of BK117 occurrences involving blade strikes with loose cowlings and foreign objects, where large sections of blade rear of the spar, around 2 metres in length, had separated in flight. One example resulted in a safe landing from 2,000 ft. Another occurred at 120 kts and the flight was continued for 1-2 minutes before a safe landing was carried out. AHD attributed this to the internal design of the blade spar, which results in a solid load carrying element. The spar has shown to be unaffected by cracks developing in the skin and core material of the rear section of the blade, and therefore does not lose the main functionality of carrying the centrifugal, in-plane (lead-lag) and out of plane (flap) forces. As a result of AHD’s analysis of these events, they considered the cracking to be a failure mode with low probability of a hazardous outcome.
Safety analysis
The main rotor blade crack found post-flight by the pilot was consistent with the in-flight vibration experienced. Considering the damage to all four blades, there were no reported operational conditions, including blade strikes or ground handling events that might have directly damaged or placed excessive stress on one or all of the rotor blades.
There were also no blade material or manufacturing defects identified in the cracked blade, with the exception that the crack passed through the centre of a prior blade repair. The fact the blade was previously repaired in this location, in addition to the concurrent damage on the other 3 blades in the same location, suggested it was probably a region of high blade stress. The manufacturer also indicated that cracks at prior blade repair sites was not unusual and therefore, the blade repair probably influenced to some extent, the rate of cracking compared to the other blades. Despite this, there were no common factors identified outside of normal operation that likely contributed to the damaged blade set.
No vibration was noted during the take-off phase of the previous flight, and the onset of mild vibration was only observed towards the end of that flight. This indicated not only that the blade crack was present to some degree at the conclusion of the previous flight, but that it then progressed rapidly to produce the severity of vibrations experienced on the occurrence flight. This meant that, compared to the size of the post-occurrence crack, the crack present at the commencement of the occurrence flight would have been comparatively smaller and less conspicuous to the ‘general condition’ pre-flight check. In addition, the period of operation since the most recent, detailed, periodic inspection, meant it was unlikely that cracking or damage existed at that time to be identified.
In the absence of crack detection through inspections, the most likely avenue for crack detection was for the mild vibration on the previous flight to be brought to the attention of maintenance personnel. However, the vibration was below that pilot’s threshold for concern and was coupled with an association of the helicopter loading condition. Even so, the mild deviations from normal flight conditions were an indication of a developing technical issue. Communication of the same, may have resulted in additional inspections or pilot awareness ahead of the occurrence flight.
Despite not being recognised ahead of the occurrence flight, blade cracking of this type was considered unlikely to result in a significant flight risk. The failure mechanism is progressive, with significant, abnormal airframe vibration accompanying a crack beyond a certain size, providing a warning to the pilot. Transitory continued flight with severely damaged blades has also been demonstrated, where a safe landing has been achieved in each occurrence.
Findings
ATSB investigation report findings focus on safety factors (that is, events and conditions that increase risk). Safety factors include ‘contributing factors’ and ‘other factors that increased risk’ (that is, factors that did not meet the definition of a contributing factor for this occurrence but were still considered important to include in the report for the purpose of increasing awareness and enhancing safety). In addition, ‘other findings’ may be included to provide important information about topics other than safety factors.
These findings should not be read as apportioning blame or liability to any particular organisation or individual.
From the evidence available, the following findings are made with respect to the Main rotor blade cracking, involving Airbus Helicopters Deutschland BO105 CBS-5, registered VH-NVH.
A cracked main rotor blade caused abnormal airframe vibrations and resulted in a precautionary landing. The reason for the blade cracking was not determined.
Other findings
There were no manufacturing or operational factors identified to explain concurrent damage across the main rotor blade set, and which likely led to the blade cracking on one blade.
Sources and submissions
Sources of information
The sources of information during the investigation included the:
Pilot of the occurrence flight
Pilot of the previous flight
Airbus Helicopters Deutschland
Operator of VH-NVH
Submissions
Under section 26 of the Transport Safety Investigation Act 2003, the ATSB may provide a draft report, on a confidential basis, to any person whom the ATSB considers appropriate. That section allows a person receiving a draft report to make submissions to the ATSB about the draft report.
A draft of this report was provided to the following directly involved parties:
Pilot of the occurrence flight
Pilot of the previous flight
Operator of VH-NVH
Airbus Helicopters Deutschland
German Federal Bureau of Aircraft Accident Investigation (BFU)
Civil Aviation Safety Authority (CASA)
Submissions were received from:
Airbus Helicopters Deutschland.
The submission was reviewed and, where considered appropriate, the text of the report was amended accordingly.
Purpose of safety investigations
The objective of a safety investigation is to enhance transport safety. This is done through:
identifying safety issues and facilitating safety action to address those issues
providing information about occurrences and their associated safety factors to facilitate learning within the transport industry.
It is not a function of the ATSB to apportion blame or provide a means for determining liability. At the same time, an investigation report must include factual material of sufficient weight to support the analysis and findings. At all times the ATSB endeavours to balance the use of material that could imply adverse comment with the need to properly explain what happened, and why, in a fair and unbiased manner. The ATSB does not investigate for the purpose of taking administrative, regulatory or criminal action.
Terminology
An explanation of terminology used in ATSB investigation reports is available here. This includes terms such as occurrence, contributing factor, other factor that increased risk, and safety issue.
Publishing information
Released in accordance with section 25 of the Transport Safety Investigation Act 2003
Ownership of intellectual property rights in this publication
Unless otherwise noted, copyright (and any other intellectual property rights, if any) in this report publication is owned by the Commonwealth of Australia.
Creative Commons licence
With the exception of the Coat of Arms, ATSB logo, and photos and graphics in which a third party holds copyright, this publication is licensed under a Creative Commons Attribution 3.0 Australia licence.
Creative Commons Attribution 3.0 Australia Licence is a standard form licence agreement that allows you to copy, distribute, transmit and adapt this publication provided that you attribute the work.
The ATSB’s preference is that you attribute this publication (and any material sourced from it) using the following wording: Source: Australian Transport Safety Bureau
Copyright in material obtained from other agencies, private individuals or organisations, belongs to those agencies, individuals or organisations. Where you wish to use their material, you will need to contact them directly.
Between 1 July 2014 and 31 August 2022, 24 rail or road users were fatally or seriously injured in collisions between trains and heavy vehicles at Australian level crossings. The ATSB conducted this safety study to improve understanding of the risks associated with level crossing collisions involving heavy vehicles. The goals of this study were to:
Compare the severity of level crossing collisions involving heavy vehicles to collisions involving light road vehicles.
Provide a statistical description of level crossing collisions involving heavy vehicles.
Identify common contributing factors associated with level crossing collisions involving heavy vehicles.
Identify systemic safety issues associated with the safety system for level crossings, including the design of level crossings used by heavy vehicles.
To accomplish these goals, the ATSB used quantitative and qualitative methods to analyse data collected by rail regulators in Australia and the United States. The ATSB also reviewed all reported level crossing collisions involving heavy vehicles in Australia from July 2014 to August 2022 (49 collisions), and collected records from rollingstock operators, rail infrastructure managers, police, and other organisations for each of these accidents.
What the ATSB found
The annual number of level crossing collisions between road vehicles and trains remained relatively constant between July 2014 and June 2022.
Data from Australian and United States rail regulators showed that level crossing collisions involving heavy vehicles were more likely to lead to injuries to the occupants of rail vehicles, to damage to rail vehicles and track, and to derailment of rail vehicles. Derailment of rail vehicles was also more likely to occur in level crossing collisions in which the road vehicle struck the train, compared to those where the train struck the vehicle. Comparison of records of the number of total road vehicles registered in Australia, and records to the number of kilometres travelled by different road vehicle types, showed that heavy vehicles had a higher rate of level crossing collisions. As a result, heavy vehicles present a greater risk of level crossing collision as a function of both likelihood (per road vehicle and road kilometres travelled) and consequence compared to light road vehicles.
The majority of level crossing collisions arose from heavy vehicle drivers entering the level crossings following some form of unintentional error or omission. In at least 14 accidents, it was likely the heavy vehicle driver intentionally entered the level crossing in a manner contrary to road rules, however even in these instances the intention was to proceed through the crossing prior to the arrival of a train.
The review of level crossing collisions identified common factors which may have contributed to the actions of heavy vehicle drivers. These included:
In at least 12 collisions the heavy vehicle driver had regularly used the level crossing prior to the collision with the train. The drivers' previous experience at the level crossings may have led to a low expectancy for trains and contributed to them not detecting a requirement to stop and give way.
In at least 14 collisions, the heavy vehicle driver’s view of the track or level crossing protection equipment was obstructed by vegetation, the design of the heavy vehicle cab, poor crossing lighting, or sun glare.
Consistent with prior research showing that train horns have limited effectiveness for alerting road vehicle drivers approaching level crossings, in at least 25 accidents the horn was not effective at alerting the heavy vehicle driver to the presence of the train.
These observations were based on a partial set of the 49 collisions involving heavy vehicles, since in many instances information about the actions of heavy vehicle drivers and the factors which influenced these actions was not available from operator or police reports. The review identified that such information is typically only available when an independent no-blame transport safety investigation is conducted.
The collisions reviewed in this study mostly occurred at level crossings designed according to the required standards. However, this study identified one systemic safety issue with level crossing design standards. Of 6 collisions where the heavy vehicle driver did not identify the presence of activated flashing lights, 5 occurred on crossings with curved road approaches, all of which were right curves. Following a review of the applicable standards for designing and assessing level crossings (AS1742.7:2016 Manual of uniform traffic control devices, Part 7: Railway crossings), and research literature concerning visual attention in curved driving, the ATSB determined that methods used to calculate safe stopping distances (and determine the need and location of active advanced warning signs) for road approaches to level crossings did not account for the likelihood of detecting the level crossing ahead based on the normal visual focal points of road drivers negotiating a curved road.
The collisions primarily resulted from level crossing warnings or the presence of trains not being detected, being detected late, or being perceived incorrectly. Many of the errors and omissions which lead to level crossing accidents reflect the inherent variability of human performance.
The review identified that passively controlled level crossings, in particular, rely on the road vehicle driver visually detecting the presence of a train and identifying a requirement to stop and give way, they are susceptible to situations where drivers do not look for, or detect the presence of, a train, and there are limited effective recovery controls to prevent a collision when this occurs. The use of redundant controls, and particularly fail-safe engineering controls, improve the safety at passively controlled level crossings. The study considered one such form of control (in-vehicle alerting systems for level crossings), however there are significant barriers to the implementation of such systems.
What has been done as a result
Standards Australia reported they will review the standard AS1742.7 and determine if additional information or guidance may be provided to manage risks associated with curved road approaches to level crossings.
Safety message
This study highlights the increased risk posed by level crossing collisions with heavy road vehicles. Interventions which target these vehicles are likely to provide significant leverage in improving the overall safety at level crossings.
The accidents reviewed in this study demonstrate the potential for driver errors at level crossing to cause significant harm. As also demonstrated in this study, the performance of road vehicle drivers is inherently susceptible to unintentional errors. While the level crossing safety systems rely on road vehicle drivers always detecting a level crossing (and at passive crossings, the presence of trains) it is certain that this will fail from time to time and result in accidents in the future. The possibility of the future use of engineering controls which alert road users to a requirement to stop will almost certainly provide an enhanced level of safety at level crossings, by reducing the reliance on road vehicle drivers to attend to and detect the presence of trains.
Introduction
Background
The Australian rail network comprised about 46,000 km of track and had an annual throughput of approximately 250 million km of combined passenger and freight journeys in 2021.[1] Across this network, records from the Office of the National Rail Safety Regulator (ONRSR) indicated there were almost 11,000 operational[2] level crossings where there is an interface between rail traffic and road vehicles.[3] At these interfaces there is a risk of collision, which is managed using different forms of traffic control equipment and associated procedures.
Relative to the volume of traffic conveyed across the rail network, collisions between trains and road vehicles at level crossings are rare. Rail safety data produced by ONRSR showed that for every million km travelled by freight trains between 2016 and 2021, there was an average of about 0.18 collisions with road vehicles at level crossings. The rate for passenger trains was about 0.10 per million km.
Though rare, level crossing collisions can have severe consequences. Collisions between passenger cars, motorcycles or bicycles often result in tragic consequences for road users. Where a heavy vehicle is involved in a level crossing collision, the rail system risks associated with the collision are much greater, including the increased potential for multiple fatalities onboard the train. In recent decades, several collisions between heavy vehicles and trains have resulted in multiple fatalities of train occupants:
On 27 November 2008, 2 train drivers were fatally injured when a B-double combination truck collided with a passenger train in Rungoo, Queensland.[4]
On 5 June 2007, 11 train passengers were fatally injured when a semi-trailer hit a train at a level crossing in Kerang, Victoria.[5]
On 13 October 2002, 3 people in the cabin of a steam train were fatally injured when it collided with a B-double combination truck at a level crossing in Benalla, Victoria.[6]
To understand the trends and characteristics of level crossing collisions involving heavy vehicles requires sufficient information to enable detailed analysis. The ATSB, as the national independent investigator of rail safety occurrences, investigated about 20% of these occurrences between July 2014 and July 2022.
Safety study goals
This safety study aimed to improve understanding of the risks of level crossing collisions involving heavy vehicles. The goals of this study were to:
Compare the severity of level crossing collisions involving heavy vehicles to level crossing collisions involving other road vehicles.
Provide a statistical description of level crossing collisions involving heavy vehicles.
Describe common themes associated with level crossing collisions involving heavy vehicles.
Identify systemic issues associated with the safety system for level crossings, including the design of level crossings used by heavy vehicles.
Level crossing safety systems: an overview
Level crossings are the physical interface between road and rail traffic. Both modes of transport are operated as entirely separate entities and have different rules, procedures, characteristics and operational limitations. Trains are typically significantly larger than road vehicles, and when a road vehicle enters a level crossing in the path of a train, the only action that a train driver can take is to try to alert the road vehicle driver with the train horn and apply train braking. The train may not slow significantly, if at all, before the collision occurs.
Given the limitations on braking and accelerating trains, by necessity, road vehicle drivers must give way to trains at level crossings. Road traffic law codifies the right of way of rail traffic, with the Australian road rules (model law) stating:
A driver at a level crossing with a stop sign must… give way to any train or tram on, approaching or entering the crossing…
A driver at a level crossing with a give way sign or give way line must give way to any train or tram on, approaching or entering the crossing.
A driver must not enter a level crossing if: (a) warning lights (for example, twin red lights or rotating red lights) are operating or warning bells are ringing; or (b) a gate, boom or barrier at the crossing is closed or is opening or closing…[further conditions where a road vehicle driver must not enter a level crossing are described]
Level crossing traffic control systems use various signs, lights and other devices (level crossing protection equipment) to firstly alert an approaching road vehicle driver to the presence of the level crossing, and secondly instruct the road vehicle driver to take appropriate action to give way to trains.
Passive control level crossings control the movement of road traffic using signs and devices (including Give Way or Stop signs). Passive level crossing equipment is functionally static, meaning that there is no change to the equipment when a train is approaching compared to when no train is approaching. As such, passive control level crossings rely on road vehicle drivers (and pedestrians) detecting both the sign itself and then the approach or presence of a train by direct observation.
Active control level crossings control the movement of road traffic using devices such as flashing light signals, gates or barriers, or a combination of these. Active level crossing devices are activated prior to, and during, the passage of a train through the crossing. If the crossing devices are activated (level crossing lights are flashing and/or boom gates are down), then road vehicle drivers' attention should be drawn to their active status, and road rules require the road vehicle driver to stop and wait until the crossing devices are no longer active, removing the need for the road vehicle driver to detect the presence of a train.
Methods and sources
Overview
To analyse trends and characteristics (including accident severity) of level crossing accidents in Australia, this study used records of level crossing collisions and near misses in the national rail safety data collected by the Office of the National Rail Safety Regulator (ONRSR).
The study also used data from the United States Federal Railroad Administration (FRA) to support analyses of level crossing accident severity. The road and rail systems in the US are broadly equivalent to those in Australia.[7] Both jurisdictions (Australia and the United States) use similar forms of level crossing protection mechanisms, and the fundamentals of level crossing collisions are unlikely to be significantly different; level crossing collisions involve relatively small road vehicles colliding with comparatively larger trains. The ATSB considered that level crossing accident data from the United States provided valid data for the purpose of the analyses.
Australian level crossing collision data
Office of National Rail Safety Regulator national rail safety database
The Rail Safety National LawAct2012 required railway operators report all notifiable occurrences to ONRSR or another authority specified by ONRSR. The Rail Safety National LawRegulations2012 specified that collisions between trains and vehicles at level crossings were Category A occurrences, whereas near misses at level crossings were Category B occurrences.[8] The Rail Safety National Law does not require road vehicle operators to report level crossing accident information to ONRSR.
The national rail safety database recorded information provided to ONRSR under the reporting requirements specified in the Rail Safety National Law. This database commenced with the establishment of ONRSR on 20 January 2013, however coverage of different Australian jurisdictions (States) occurred gradually. ONRSR advised the dataset for level crossing occurrences was reliable from 1 July 2014 onwards. The ATSB analysis used occurrences from the national rail safety database between 1 July 2014 and 30 June 2022.
The national occurrence database recorded:
a narrative description of the collision or near miss, which typically recorded the initial wording of the notification provided by the operator and sometimes included follow-up information
the date, time and location of the level crossing collision or near miss
the operator and rail infrastructure manager involved
the primary level crossing protection equipment (flashing light, boom gate, stop sign or give way sign) at the level crossing
the type of rollingstock and road vehicle involved in the collision or near miss
fatalities and injuries sustained by rail passengers, rail operating crew and road vehicle occupants.
For the time period analysed, the national rail safety database did not record:
the level of damage sustained by road vehicles, and rail and road infrastructure
the speed, direction, mass and length of rail or road vehicles
the actions of the road user.
The national rail safety database recorded 283 level crossing collisions with vehicles between 1 July 2014 and 30 June 2022. Of these, 220 were collisions with light passenger vehicles, with 44 collisions involving heavy freight vehicles.[9] The remaining 20 collisions involved buses (4), special purpose machinery (5), bicycles (5), motorcycles (1), a dangerous good vehicle (1) and other vehicles (4). To analyse the severity and characteristics of occurrences involving heavy vehicles, the ATSB identified the level crossing collisions involving heavy vehicles recorded in the ONRSR national rail safety database for additional evidence collection.
A set of 47 collisions was identified in the national rail safety database, which comprised:
42 collisions with vehicles recorded as heavy freight vehicles[10]
one collision each with vehicles coded special purpose machinery,[12] and dangerous goods vehicles.
Of the remaining collisions in the national rail safety database, the ATSB identified a subset of 216 level crossing collisions involving light road vehicles for comparative analyses. Light vehicles were defined as passenger cars and motorcycles, but not bicycles or farm or roadwork equipment. The comparative analysis also excluded collisions with hi-rail/road-rail vehicles.[13]
In July 2022, ONRSR introduced new requirements for operators submitting notifiable occurrence reports. Under the new requirements, rail operators reporting level crossing collisions and near misses were required to report the damage sustained by rail vehicles and infrastructure, whether a derailment occurred, and the cause of the collision.
ATSB finding
Prior to July 2022, the national rail safety database did not include sufficient information to enable detailed analysis of level crossing collision characteristics (Other finding).
Additional information collection
Between July and August 2022, the ATSB commenced 2 investigations into level crossing collisions involving heavy vehicles, these collisions were added to the 47 heavy vehicle level crossing collisions identified from the national rail safety database.
For each of the 49 in-scope collisions, the ATSB sought information from rail operators, rail infrastructure managers, police, state road authorities and other parties. These records included investigation reports and level crossing assessments. Follow-up enquires were made to enhance the dataset. However, in many instances important information was not recorded in investigation reports and was not available for follow-up enquiry due to the passage of time from the events. As such, some of the information presented in subsequent sections is drawn from a partial sample of the identified level crossing collisions.
Level crossing accident data collected in United States
To support analysis of level crossing collision severity, the ATSB obtained records from the United States Federal Railroad Administration (FRA). Due to greater rail and road traffic volumes, there were about 60 times more recorded level crossing collisions in the United States than Australia, and the FRA datasets provided additional statistical power for the ATSB analyses. Regulations in the United States required that collisions between railway equipment and vehicles at level crossings (referred to as ‘grade crossings’ in the United States) were reported to the FRA. The regulations required that reports of level crossing collisions included the:
type of road user involved
speed, direction and position of the road user
environmental temperature, light and weather conditions
train type, consist length and speed
level crossing equipment
actions of the road user.
In addition, for accidents exceeding a threshold damage value (about A$16,000 in 2022), operators were required to report the:
mass of the train consist
cost of rail equipment and track damage
number of derailed train cars.
These data were contained in two databases. The Highway-Rail Grade Crossing Accident (HRA) database contained data for all level crossing accidents, and the Rail Equipment Accident/Incident (REA) database contained data on accidents exceeding the damage cost threshold.
ATSB analysed data from both datasets from 2012 to 2021. After data cleaning and removal of irrelevant collisions, there were 19,495 collisions in the HRA dataset, and 2,283 records of highway rail collisions (level crossing collision) in the REA dataset. There were about 700 duplicate records in the REA dataset. The ATSB identified a final sample of 1,901 unique HRA records with matching REA records.
Descriptive statistics
Australian level crossing statistics
ONRSR provided the number of road crossings, based on information reported by rail operators. ONRSR stated that while the number of road crossings had been validated by reasonability checks, it was not possible to determine the accuracy of the data reported by operators.
The ONRSR database showed that in December 2023, there were almost 11,000 operational level crossings which managed traffic between trains and road traffic. This included almost 3,000 active control crossings, and almost 7,000 passive control crossings (there were about 1,500 operational crossings which were recorded as unprotected). ONRSR advised it was not possible to disaggregate their data on the basis of whether level crossings were on public or private roads. Table 1 shows the distribution of operational level crossings by protection type in each Australian state and territory.
Table 1: Counts of road level crossings, by primary protection type and jurisdiction
Active – Boom gates and flashing lights
Active – Flashing lights, no boom gates
Passive – Stop sign
Passive – Give Way sign
Unprotected
Total
New South Wales
299
142
1,420
138
667
2,666
Victoria
516
214
514
378
144
1,766
Queensland
288
274
1,667
256
553
3,038
South Australia
193
107
428
49
97
874
Western Australia
249
279
1,346
112
59
2,045
Tasmania
0
109
148
12
9
278
Northern Territory
20
14
176
1
0
211
Source: ONRSR
During the development of the safety study, the ATSB received submissions from stakeholders in some jurisdictions which identified that the number of level crossings presented in Table 1 were not consistent with other records, including those stored in the Australian Level Crossing Assessment Method dataset. ONRSR also identified that there were known differences between the number of crossings identified in the ONRSR database and the ALCAM dataset, and the data had not been cross-validated between the datasets.
Australian level crossing collisions
Characteristics of all level crossing collisions and near misses
There were 283 collisions and 4,319 near misses between trains and road vehicles recorded in the Australian national rail safety database. These totals included collisions involving hi-rail vehicles, bicycles, and farm and roadwork equipment.
Key statistics involving the type of train included:
There were 120 collisions and 1,801 near misses involving freight trains.
122 collisions and 1,895 near misses involved regular passenger services.
Key statistics involving the type of crossing included:
160 collisions and 3,133 near misses occurred at active control crossings.
115 collisions and 1,086 near misses occurred at passive control crossings.
Other descriptive statistics for collisions and near misses are described in Appendix A.
Characteristics of level crossing collisions involving heavy vehicles
Environmental conditions
Of the 49 collisions reviewed in the safety study, 3 occurred in dark conditions (after astronomical twilight).[14] There were a further 7 collisions when the sun’s elevation was between -18° and 6°, meaning the sun was low in the sky and twilight conditions were apparent.
Information about the road conditions was recorded for 40 of the collisions. In 37 collisions the road was reported to be dry, and in 3 collisions the road was reported to be wet. Thirty-three of the 49 collisions occurred in rural locations, and 16 collisions occurred in built-up or urban areas.
Train characteristics
More than two-thirds of level crossing collisions with heavy vehicles involved freight rail operations (Table 2).
Table 2: Operation category of trains involved in level crossing collisions with heavy vehicles
The maximum reported train mass was 10,109 tonnes, with 18 collisions involving trains with a reported mass of over 1,000 tonnes. The maximum train length was 2,964 m, with 6 collisions involving trains 1,000 m or longer. Thirteen collisions involved driver only operations. Where the number of passengers was recorded, the maximum was 250 (Table 3).
Table 3: Maximum and average train mass, length and passenger numbers
Train mass
Train length
Train passengers (passenger train only)
Number of records
42
40
11
Maximum
10,109 t
2,964 m
250
Average
1,606 t
557 m
95
Information about the time and distance of emergency braking prior to collision was available for 36 collisions (Table 4). In 13 instances, the train crew either did not brake, or braked at about the point of impact (2 seconds or less prior to impact). These included instances where the train crew saw the road vehicle slowing or stopped for the crossing, and therefore did not anticipate that a collision would occur. These instances also included situations where the train crew’s vision of the level crossing was blocked by curved track and vegetation, preventing the train crew from identifying the potential collision earlier.
In 4 instances, train crew made emergency brake applications for 10 or more seconds prior to the collision, including up to 213 m braking distance prior to the collision. Three of these collisions involved instances were at level crossings controlled by boom gates, and involved heavy vehicles stopped on the crossing. The other instance involved a very large freight train (5,330 tonnes) which was unable to stop after a truck driver stopped then proceeded from a Stop sign. Due to the train braking over a long distance, the collision speed in these occurrences was significantly reduced, probably leading to reduced consequences (injuries and damage) to the train and road vehicle occupants than if braking had been applied at a shorter distance to the collision point.
The average reported speed of the trains prior to braking for the collision was 62 km/h, with a maximum of 160 km/h reported. The average reported collision speed was about 51 km/h, with a maximum reported speed of 110 km/h.
Table 4: Train speed and braking prior to level crossing collisions
Max. speed
Collision speed
Braking time
Braking distance
Stopping distance
Number of records
43
39
36
36
35
Maximum
160 km/h
110 km/h
19 s
213 m
1,312 m
Average
62 km/h
51 km/h
5 s
74 m
314 m
Heavy vehicle information
Over half (28) of the heavy vehicles involved in level crossing collision were articulated vehicles (semi-trailers or trucks with trailers). Seventeen vehicles were unarticulated vehicles (garbage trucks, flat-bed and box trucks) and 3 were buses. In terms of the classes of heavy vehicles described by the National Heavy Vehicle Regulator,[15] there were 27 General Access Vehicles, 14 Restricted Access Vehicles, and there was insufficient information to classify 8 vehicles.
The maximum recorded gross mass was 148 tonnes, and 6 vehicles had a recorded mass of 70 tonnes or greater. The greatest number of occupants recorded was 20 (a passenger bus), with the next highest being 3. Thirty-seven collisions involved single-occupant vehicles, and 3 collisions involved circumstances where the occupants had vacated the vehicle prior to the collision.
Table 5: Mass, length and occupant numbers for heavy vehicles involved in level crossing collisions
Mass
Vehicle length
Occupants
Number of records
28
10
45
Maximum
148 t
36.5 m
20
Average
36 t
22.0 m
1.5
Reported mechanical problems were associated with 4 of the collisions identified in this study. In 2 instances, post-accident assessments identified problems with truck braking systems which may have contributed to the trucks failing to stop ahead of the crossing. In 2 other collisions, the heavy vehicles stalled on the level crossing and were unable to clear the crossing prior to the train arriving.
Police records indicated that one heavy vehicle driver was affected by alcohol or other drugs, and was reported to be fatigued/drowsy prior to the collision.
Level crossing characteristics
There was a relatively even distribution of collisions involving heavy vehicles at passive control crossings and collisions at active control crossings. Considering that heavy vehicles accounted for about 18% of level crossing collisions recorded in the national rail safety occurrence database, heavy vehicles were significantly under-represented for collisions occurring at Boom gates, and over-represented for collisions at Give way signs (Table 6).
Table 6: Level crossing collisions by protection equipment type
Heavy vehicles
Light vehicles
Total collisions[1]
Proportion, heavy
Boom gates
11
80
91
12%
Flashing lights
12
48
60
20%
Stop sign
20
66
86
22%[2]
Give way sign
6
15
21
29%[2]
None
0
7
7
0%
All crossing types
49
216
265
18%[2]
‘Total collisions’ only includes collisions with Heavy and Light vehicle types, and excluded collisions with rail vehicle types such as hi-rail vehicles. These are summarised inAustralian level crossing collision data.
Collisions occurring after 1 July 2022 were not included when calculating the proportion of collisions involving heavy vehicles, as the national rail safety data only covered until this date. As such, the proportion of collisions occurring at Stop signs involving heavy vehicles was 19 of 85, the proportion of collisions at Give way signs was 5 of 20, and the proportion of accidents at all crossing types was 47 of 263
Most occurrences (39) occurred on sealed roads, with 10 collisions occurring on unsealed roads. The average road speed limit, where recorded, was 77.1 km/h, and 15 collisions occurred on roads where the speed limit was 100 km/h or greater. Where recorded, the average track speed at the level crossing locations of the occurrences was 82.6 km/h, with a maximum track speed of 160 km/h.
Problems with level crossing design and maintenance
There are several standards applicable to the design and maintenance of level crossings in Australia. These include:
Australian Standard AS 7658:2020Level Crossings: Rail Industry Requirements. This standard was developed and maintained by the Rail Industry Safety and Standards Board (RISSB). It describes minimum operational and engineering requirements of the life cycle of a level crossing.
Australian Standard AS 1742.7(2016), Manual of uniform traffic control devices. Part 7: Railway crossings. This standard was developed by the Australian Standard Committee MS‑012. It described design guidance for the installation of level crossing protection equipment, including methods for assessing the sighting distances required at different level crossings. Additional discussion of AS 1742.7 is provided in Standards and other guidance relevant to placement of crossings on curved road approaches, and the formula used to calculate sighting distances for level crossings are described in Appendix B.
Key aspects of these standards include that:
AS 7658 required that rail infrastructure managers establish and maintain procedures for the rail portion of the level crossing, and that an interface agreement exists with the road manager to ensure that ‘all facets of the monitoring and maintenance of the level crossings is undertaken’. This includes procedures for inspection and testing and vegetation management. The standard further required that ‘removal of plant growth shall be required to ensure retention of sighting distance’.
AS 7658 stated that whistle boards may be installed on the approach to level crossings.
AS 7658 stated that that ‘Adequacy of street lighting at a level crossing shall be assessed against the requirements in AS/NZS 1158 [Road lighting] during a level crossing risk assessment. Street lighting provided for level crossings shall comply with AS/NZS 1158 and impacts on train drivers, road users and pedestrians shall be evaluated, and outcomes documented.’
AS1742.7 stated that level crossings should be located so that there is sufficient distance between the crossing and a downstream intersection to accommodate the road design vehicle[16] and a safety factor of 5 m. The intent of these provisions is to prevent so-called ‘short stacking’, where a long vehicle stops across a crossing while queueing for another intersection.
The safety study considered evidence of problems with the design or maintenance of the level crossing locations of the 49 collisions reviewed in this study. Analysis of the design of AS1742.7 is described in Analysis of level crossing safety systems. Two ATSB investigations, 4 rail infrastructure manager reports and one State government investigation identified problems with the design or maintenance the level crossing:
ATSB investigation RO-2014-024 identified that a stand of trees had self-sown within the rail reserve. When a truck approached the level crossing, the driver’s view was partially obscured by this vegetation. The investigation noted that previous inspections had recorded the presence of the trees, but this had not led to the removal of the trees.
ATSB investigation RO-2016-009 identified that the Stop sign level crossing required road vehicle drivers sight approaching rail traffic at an obtuse angle (greater than 90° but less than 180°). When a semi-trailer truck stopped at the crossing, the driver’s view of an approaching train was restricted and they did not identify the risk of collision.
A rail infrastructure manager report noted that a Stop sign level crossing was located in a dark industrial area. There was poor lighting on the crossing itself and contrasting high levels of lighting in the background and foreground. In these dark conditions, a truck driver approaching the Stop sign level crossing did not detect that a rail safety worker was controlling the crossing or that a freight train was indexing in reverse over the crossing.
A rail infrastructure manager and operator report noted that a temporary Stop sign level crossing had been installed without other approach signage, and with no whistle board installed for approaching trains. A train driver approaching the crossing did not sound the train horn until they identified a truck, which had stopped at the level crossing. The truck driver did not hear the horn and proceeded into the path of the train.
A state government investigation report identified that a level crossing protected by flashing light signals was designed with a stop line placed too close to the lights assembly. When a bus stopped at the crossing while waiting for traffic to clear, the driver’s view of the near-side lights was obstructed. When traffic cleared, the bus driver, who had an unobscured view of the far-side flashing lights, proceeded into the crossing against the flashing lights.
A rail infrastructure manager report identified that the road configuration near a Stop sign level crossing was not appropriate for some heavy vehicle classes as there was insufficient room to clear the crossing when queued at an intersection beyond the crossing. There was no signage or pavement markings to discourage road users from queuing across the crossing. A heavy vehicle driver approaching the crossing did not stop at the Stop sign (causing the train drivers to apply emergency brakes), then was unable to clear the crossing before the train arrived.
A rail infrastructure manager and operator report identified that a level crossing flashing light assembly did not face towards a side road approaching the crossing. A heavy vehicle driver approaching from the side road did not detect the requirement to stop at the level crossing.
In total, there were at least 7 collisions between heavy vehicles and trains where problems with the design or maintenance of the level crossings were probably contributory to the collisions. Reports from a further 2 collisions identified that the sighting provided to road users was insufficient considering the requirements of Australian Standards AS1742.7. In these instances, the sighting deficiencies were for rail or road approaches other than those involved in the collisions, so were not contributory to the collision. Reports for 8 other occurrences identified various other minor problems, including faded signs and minor discrepancies between the signage provided and the requirements of AS1742.7.
In summary, the evidence available to this review did not indicate significant problems with the design or maintenance of most level crossings where collisions between heavy vehicles and trains occurred, in terms of compliance with applicable design standards. The absence of such evidence, however, is not necessarily evidence that no problems with the design and maintenance of crossings existed. As described further in Study limitations, this review did not involve site inspections of level crossings (other than those previously investigated by the ATSB), and the ATSB did not seek to otherwise audit the compliance of the level crossings with relevant standards.
ATSB finding
Of the 49 level crossing collisions involving heavy vehicles, at least 7 partially involved problems with the design or maintenance of the level crossings. Concerning compliance with applicable design standards, no significant issues were identified with the design or maintenance of most crossings (factor that increased risk)
Level crossing collisions in the United States
Collisions and fatalities by vehicle types
The number of level crossing collisions and fatalities recorded in the US Federal Railroad Administration (FRA) Highway-Rail Grade Crossing Accident (HRA) dataset is summarised by vehicle type (Table 7). The vehicle type variable was then categorised as Heavy (bus, truck or truck-trailer) and Light (all other vehicles), with the number of collisions and collision fatalities for each category shown in Table 8.
Table 7: Level crossing collision statistics by road vehicle type, FRA (HRA) data, June 2012 to June 2021
Vehicle type
Collisions
Proportion of collisions
Fatalities
Proportion of fatalities
Auto [1]
9,515
48.8%
811
45.5%
Truck
1,366
7.0%
103
5.8%
Truck-Trailer
3,475
17.8%
121
6.8%
Pick-up truck
2,610
13.4%
308
17.3%
Van
562
2.9%
83
4.7%
Bus
37
0.2%
6
0.3%
Other
1,930
9.9%
349
19.6%
Total
19,495
100.0%
1,781
100.0%
[1] This category describes passenger vehicles such as sedans, but does not include motorcycles
Table 8: Level crossing collision statistics for 'Heavy' and 'Light’ vehicles (excluding pedestrian collisions)
Vehicle type
Collisions
Proportion of collisions
Fatalities
Proportion of fatalities
Heavy
4,886
25.1%
233
13.1%
Light
14,609
74.9%
1548
86.9%
Total
19,495
100.0%
1,781
100.0%
Types of trains involved
Concerning all road vehicles, 74% of level crossing collisions involved freight trains. Collisions involving heavy vehicles accounted for about 25% of all collisions with freight trains, and about 16% of collisions with passenger trains.
Table 9: Level crossing collisions by train type and vehicle type, FRA HRA data
Train type
Heavy vehicles
Light vehicles
Total
Freight
3,648
10,691
14,339
Passenger
303
1,640
1,943
Other
935
2,275
3,210
Total
4,886
14,606
19,492
Level crossing protection equipment
More than half (56%) of level crossing collisions were recorded at active control level crossings. Heavy vehicles were involved in about 25% of all level crossing collisions (active and passive controlled crossing combined). They were over-represented in collisions at passive control crossings, and under-represented for collisions at active control crossings (Table 10).
Table 10: Level crossing collisions by crossing level crossing protection equipment type and vehicle type
Primary protection equipment
Heavy vehicles
Light vehicles
Total
Proportion heavy
Level crossing gates
1,525
6,989
8,514
17.9%
Flashing light signals
392
1,494
1,886
20.8%
Stop sign
1,297
2,208
3,505
37.0%
Crossbucks only (give way)
1,283
3,298
4,581
28.0%
Note: ‘Proportion heavy’ describes the proportion of accidents at each level crossing type which involved heavy vehicles. For example, 37% of accidents at Stop sign crossings involved heavy vehicles.
Road vehicle driver actions associated with level crossing collisions
The most common road vehicle driver action associated with level crossing collisions was a failure to stop prior to a level crossing, accounting for 40% of collisions (Table 11). Heavy vehicles were proportionately more likely to be involved in collisions where:
The road user did not stop at the level crossing (1.3 times more likely).
The road user stopped at the crossing then proceeded into the path of an oncoming train (1.6 times more likely).
Table 11: Level crossing collisions by road vehicle driver actions and vehicle type
Road vehicle driver actions
Heavy vehicles
Light vehicles
Total
Did not stop
2,261
5,063
7,234
Stopped and then proceeded
435
777
1,212
Stopped on crossing
1,309
3,932
5,241
Went around the gates
257
2,160
2,417
Other
624
2,676
3,300
Total
4,886
14,608
19,494
The road user action attributed to level crossing collisions varied significantly as a function of the type of level crossing protection equipment in use. Table 12 describes the proportion of collisions attributable to different motorist actions, by crossing and vehicle type.
Table 12: Motor vehicle actions by crossing and road vehicle type
ALL VEHICLE DRIVER ACTIONS
Did not stop
Stopped and proceeded
Stopped on crossing
Went around gates
Other
Boom gates
2%
1%
33%
28%
36%
Flashing light signals
67%
9%
21%
0%
3%
Stop sign
59%
13%
26%
0%
2%
Give way sign
70%
8%
19%
0%
2%
HEAVY VEHICLE DRIVER ACTIONS
Did not stop
Stopped and proceeded
Stopped on crossing
Went around gates
Other
Boom gates
1%
2%
43%
17%
37%
Flashing light signals
64%
10%
24%
0%
3%
Stop sign
62%
15%
22%
0%
1%
Give way sign
73%
10%
16%
0%
2%
LIGHT VEHICLE DRIVER ACTIONS
Did not stop
Stopped and proceeded
Stopped on crossing
Went around gates
Other
Boom gates
2%
1%
30%
31%
35%
Flashing light signals
68%
9%
20%
0%
3%
Stop sign
58%
11%
28%
0%
3%
Give way sign
69%
8%
21%
0%
2%
Note: Percentages shown in this table describe the proportion of accidents for each crossing type associated with each action type. For example, 22% of Heavy vehicle collisions at Stop sign controlled crossings involved the motor vehicle driver stopping on the crossing.
Vehicle speed
Most collisions recorded in the FRA HRA dataset involved trains colliding at speed with stopped or slow-moving road vehicles. The mean recorded train speed was 47 km/h, with a maximum reported speed of 177 km/h. The mean estimated collision speed for road vehicles was about 11 km/h for heavy vehicles and about 14 km/h for other road vehicles.
Comparison of Australian and United States Level Crossing collision data
There were consistent characteristics in the level crossing collision data for Australia and the United States. There was a similar proportion of level collisions involving heavy vehicles, with 18% of collisions in Australia involving heavy vehicles, compared to 25% in the United States. Similarly, data for both countries showed that heavy vehicles were under-represented in accidents occurring at crossings protected by boom gates, and over-represented in accidents occurring at passively controlled crossings.
The FRA data showed that the most common road user action associated with level crossing collisions was a failure to stop. As described in Errors and violations associated with level crossing collisions, this action was also the most common road user action identified in the 49 collisions involving heavy vehicles in Australia.
Analysis of heavy vehicle collision severity and frequency
Severity of level crossing collisions involving heavy vehicles
that summarised the findings from 15 level crossing collisions investigated by the ATSB and other Australian authorities between April 2006 and December 2007, of which 12 involved heavy vehicles. These collisions resulted in over 60 injuries, including 19 fatalities, and an estimated damage bill of over $100 million. Noting the increasing severity of collisions involving heavy vehicles, the ATSB bulletin summarised that:
with the increased size (of a heavy road vehicle) comes an increased consequence in the event of a level crossing collision. It used to be somewhat rare to hear of a train derailing or of significant casualties on board the train as a result of a collision with a road vehicle. This is not the case today.
Analyses of US level crossing collision datasets have previously shown that when heavy vehicles were involved in a collision, there was a much greater likelihood of a derailment occurring (Chadwick, Saat and Barkan, 2012).[17] Other research noted that the damage costs of level crossing collisions involving commercial vehicles (which includes heavy vehicles) are 3-4 times greater than collisions involving other road vehicles (Hellman and Poirier, 2019).
Injuries and fatalities to rail passengers and crew
Australia
The ATSB’s analysis of the national rail safety database identified 47 injuries to rail passengers and crew in 285 level crossing collisions with road vehicles,[18] 7 of these injuries were classified by the ATSB as serious as they resulted in hospital admission. The majority of injuries to rail occupants (7 serious and 34 minor) resulted from 49 reported collisions involving heavy vehicles, this included 18 passengers and a conductor who sustained injuries after a collision between a passenger train and a truck on 15 July 2016 at Phalps Road, Victoria.
There were no fatalities of railway employees or passengers resulting from a level crossing collision in the period July 2014 to August 2022.
United States
In the collisions recorded in the FRA HRA dataset, there was an average of 25 rail injuries (injuries to rail passengers or staff) per 100 collisions involving a heavy vehicle, compared to 3.5 per 100 collisions involving light vehicles. A Mann-Witney U test[19] found that the difference in average rail injuries by vehicle type was statistically significant (p<.005).
Fatalities to rail occupants were extremely rare, with 7 collisions (out of 19,495) resulting in 11 rail fatalities. There were 5 separate collisions involving heavy vehicles which each caused one rail fatality, whereas one collision involving a light vehicle resulted in 5 fatalities[20] (another collision with a light vehicle resulted in one fatality). Table 13 shows the total number of fatalities and injuries of rail and road users recorded in the FRA datasets.
Table 13: Fatalities and injuries by road user type in US level crossing collisions, 2011 to 2021
Total collisions
Rail fatalities
Rail injuries
Road fatalities
Road injuries
Heavy vehicles
4,886
5
1,230
228
1,143
Light vehicles
14,609
6
504
1,542
5,249
Fatalities and injuries to road users
Australia
There were 23 road fatalities from 283 level crossing collisions recorded in the national rail safety database, with 5 fatalities resulting from collisions involving heavy vehicles and 17 resulting from collisions with non-heavy vehicles (one fatality involved a collision with a cyclist). The average number of road fatalities per collisions involving heavy vehicles (0.11 fatalities per collision) was greater than collisions involving non-heavy vehicles (0.08 fatalities per collision), however the difference was small.
The ATSB review of 49 heavy vehicle collisions identified that road vehicle drivers and passengers sustained 33 injuries from level crossing collisions with heavy vehicles (0.67 injuries per collision), including 12 serious injuries. This included 17 injuries (6 serious) sustained by the occupants of a passenger bus which was struck by a train at Draper Street in Brisbane in 2015.[21] The national rail safety database showed that there were 60 injuries to road users in the 216 collisions involving light vehicles (0.28 injuries per collision).
United States
Analysis of the FRA HRA dataset (19,495 collisions) showed there were 1,770 total road fatalities. A Mann-Witney test showed that the average number of road fatalities per collision was statistically significantly lower for collisions involving heavy vehicles (0.05 fatalities per collision), compared to collisions involving light vehicles (0.11 fatalities per collision; p<.001).
Similarly, there were fewer injuries to road users for collisions involving heavy vehicles (0.23 per collision), compared to collisions involving light vehicles (0.36 per collision; p<.001).
Rail damage
Australia
The national rail safety database did not record estimated damage for level crossing collisions. As such it was not possible to compare the damage sustained in Australian level crossing collisions involving heavy vehicles, compared to collisions involving light vehicles. For the 49 collisions reviewed in this study, there was typically insufficient information to quantify the damage sustained by rail vehicles, road vehicles or infrastructure in most collisions.
The ATSB reviewed the damage reported in various sources, and identified that:
11 collisions resulted in the derailment of at least 1 rail car.
In 16 instances the rail vehicle sustained substantial damage, which required major repairs or significantly affected the performance of the vehicle. In 31 instances rail vehicles sustained only minor damage such as scratches or small dents.
In 33 instances the road vehicle sustained substantial damage, including several collisions where the vehicle was destroyed. In 13 instances the road vehicle sustained minor damage.
In 23 collisions there was no reported damage to infrastructure. In 10 instances there was minor infrastructure damage reported, and in 7 instances there was substantial infrastructure, such as large sections of destroyed track.
The following examples illustrate the significant rail damage resulting from collisions with heavy vehicles:
A collision between a truck, trailer and dog combination with a grain train resulted in extensive damage to the locomotive, with total repair costs estimated at $480,000.
A collision between a prime mover and trailer with a freight train resulted in damage to 20 m of track, 1,250 sleepers and 90 tonnes of ballast, with an estimated repair cost for infrastructure assets of over $300,000.
A collision between a prime mover and a grain train led to the derailment of the train, resulting in significant damage to two locomotives and multiple wagons.
United States
The FRA Rail Equipment Accident/Incident (REA) dataset recorded the estimated rail equipment (rollingstock) and track damage for accidents which exceeded the damage threshold (about A$16,000). Of 1,901 level crossing collisions recorded in this dataset, the average equipment damage for collisions involving heavy vehicles was around USD$78,000, compared to USD$31,000 for collisions involving light vehicles. The average track damage for level crossing collisions involving heavy vehicles was USD$31,000, compared to USD$19,000 for collisions involving light vehicles. Mann-Witney tests showed both of these differences were statistically significant (p<.001).
Derailment
Australia
A mixed-methods approach was used to identify the number of derailments resulting from heavy vehicle and light vehicle level crossing collisions:
All level crossing collisions (heavy and light road vehicles) in the national rail safety database were cross referenced with those also classified as derailments and/or identified as a derailment in the accident description field.
For collisions involving heavy vehicles, operator and rail infrastructure manager reports were used to supplement the data from the nation rail safety database. Combined these methods identified that 11 of the 49 collisions resulted in derailment (9 of 47 collisions prior to July 2022).
For collisions involving light vehicles, there was only one of 216 collisions that resulted in derailment. This was a collision between a passenger train and an abandoned light vehicle.
Fisher’s exact test was conducted to examine the relationship between road vehicle type and derailment for the 283 heavy and light vehicle collisions in the national rail safety database. The relationship was significant (one-tailed p<0.001), showing that collisions involving heavy vehicles were more likely to lead to derailment.
United States
The FRA data showed that there were 141 derailments in 4,886 collisions involving heavy vehicles, compared to 43 derailments in 14,609 collisions involving light vehicles.[22] Fisher’s exact test was showed that the difference in distribution between derailments and vehicle type was also significant in the FRA data (one-tailed p p<.001).
Summary of analysis of accident severity
Consistent with previous research, level crossing accident data from Australia showed that collisions involving heavy vehicles were more likely to result in injury to rail and road vehicle occupants, and more likely to cause derailment of rollingstock. Due to limitations in the available data, it was not possible to compare the accident damage sustained to rollingstock, infrastructure and road vehicles in level crossing collisions involving heavy vehicles and light vehicles, for collisions occurring in Australia.
The data from the US was broadly consistent with the analysis of the Australian data, showing that collisions involving heavy vehicles resulted in more frequent injury to rail occupants and more frequent derailments. The data also showed that rail damage was significantly greater for collisions involving heavy vehicles.
In contrast to the Australian data, the US data showed there were significantly more injuries to the occupants of light road vehicles involved in level crossing collisions, compared to occupants of heavy road vehicles. The difference between these data sources is probably explained by the small number of collisions in the Australian sample, and thus the influence of a single multi-injury accident in the Australia data, which substantially increased the average number of road vehicle injuries in heavy vehicle collisions.
ATSB finding
Level crossing collisions between trains and heavy vehicles were associated with greater levels of rail injuries and rail damage than collisions involving light vehicles (Factor that increased risk).
Over-representation of heavy vehicles in level crossing collisions
Previous research and reviews
The Independent Transport Safety Regulator for New South Wales (ITSR) described level crossing statistics for Australia from 2000 to 2009 (ITSR, 2011). The ITSR report showed that heavy vehicles were over-represented in level crossing collisions, accounting for 20% of collisions and 23% of fatal collisions while making up only 2.5% of vehicle registrations and 6% of kilometres travelled. The report also showed that level crossing collisions involving heavy vehicles had double the fatality rate per collision as collisions involving light vehicles.
The industry body Austroads (2010) reviewed level crossing collisions occurring in Australia and New Zealand from 2003 to 2007. This report found that of 405 total collisions, 20% involved heavy vehicles, with 14% being articulated heavy vehicles.
Analysis of level crossing collisions in Canada showed that occupants of heavy vehicles accounted for 40% of all level crossing collision fatalities from 1983 to 2001 (Caird, 2002). This review noted that light trucks, accounting for 27% of fatalities, typically operated in rural and industrial urban areas where there are more level crossings. A later analysis of Canadian accident records found heavy vehicles were overrepresented in level crossing collisions at rural, passive level crossings where the driver of the vehicle did not stop (Rudin-Brown et al., 2014).
Data used to normalise collision numbers by vehicle type
The Bureau of Infrastructure and Transport Research Economics (BITRE) Australian Infrastructure and Transport Statistics - Yearbook 2022 provided estimates of the number of kilometres travelled by vehicle type, by financial year. This data showed that between the financial years 2014-15 and 2021-22, heavy vehicles travelled on average 21.65 billion km each year and light vehicles travelled on average 1.83 trillion km.
The Australian Bureau of Statistics Motor Vehicle Census provided estimates of the total number of registered motor vehicles by vehicle type, by calendar year. This data showed that from 2015 to 2021, there were on average 707,000 heavy vehicles registered in Australia,[23] and about 18.47 million light vehicles.
Comparison of heavy vehicle and light vehicle level crossing collision rates
As described in Australian level crossing collision data, from 1 July 2014 to 30 June 2022, there were 47 level crossing collisions involving heavy vehicles, and 216 collisions involving light vehicles. As shown in Table 14, heavy vehicles were over-represented in level crossing collisions as a function of both the number of collisions per vehicle (around 2 times greater), and the number collisions per kilometre travelled (around 4 times greater).
Table 14: Ratios of collisions by vehicle type to distance travelled and number of registered vehicles
Heavy
Light
Ratio of collisions to billion km travelled
Ratio of collisions to million registered vehicles[2]
Ratio of collisions to billion km travelled
Ratio of collisions to million registered vehicles
Median
0.25
6.04
0.12
1.52
Mean
0.27
7.97
0.12
1.47
Std. deviation
0.13
3.87
0.02
0.24
There was an imperfect overlap between the coverage of the collisions recorded in the safety study from July 2014 to August 2022, and the Motor Vehicle Census which produced estimates on an annual year basis. Collisions occurring in the calendar years 2014 and 2022 were not included in this analysis.
Caution should be exercised in making inferences regarding whether the over-representation of heavy vehicles in level crossing collisions necessarily indicates a greater level of risk. It may also reflect a greater likelihood of encountering level crossings, or a greater likelihood of encountering crossings of higher risk. It is plausible that heavy vehicles are more likely to be operated on rural roads, which are less likely to have level crossings removed through grade separation or be protected by higher level active controls (boom gates). There are no known data describing the rate at which different types of vehicles encounter and traverse level crossings of different types and characteristics, and thus this explanation could not be tested.
ATSB finding
Heavy vehicles are involved in level crossing collisions at a greater rate per road kilometre travelled than light vehicles (Factor that increased risk).
Number of level crossing collisions over time
Prior to the establishment of the Office of the National Rail Safety Regulator (ONRSR) in 2013, records of the number of level crossing collisions in Australian jurisdictions were collected by state and territory regulators. The ATSB collected rail collision information from these regulators, and published various statistics including the number of level crossing collisions. The ATSB publication Australian Rail Safety Occurrence Data 1 July 2002 to 30 June 2012 showed that in the decade to July 2012, there was a notable drop in the number of level crossing collisions with vehicles. The number of collisions declined from 82 in the year to July 2002 to 49 in the year to July 2012.
As described in Australian level crossing collision data the national rail safety database was reliable from 1 July 2014 onwards. As such, there was a transitional period from the discontinuation of reporting of state and territory regulator collision statistics in July 2012, to the availability of annual totals commencing 1 July 2015.
There was a substantial drop in the number of level crossing collisions from 49 in the year to July 2012, to 30 in the year to July 2015. From July 2014, the number of level crossing collisions has remained relatively constant, at around 30 to 40 per year (Figure 1). A Mann-Kendall test was conducted on the number of collision per financial year between July 2014 and June 2022 (Figure 2), the test did not identify any statistically significant trend (p = 0.61).
Figure 1: Level crossing collision with vehicle, Financial year totals 2002 to 2022
Figure 2: Monthly level crossing collisions, July 2014 to June 2022, with regression line
ATSB finding
The annual number of level crossing collisions between road vehicles and trains remained relatively constant between July 2014 and June 2022 (General finding).
Level crossing collision sequence and derailment
Level crossing collisions can either involve the train striking a vehicle (TSV) or a vehicle striking the train (VST). In TSV collisions the impact involves the front of the train striking either a moving or stationary road vehicle, whereas in VST collisions the impact involves a road vehicle striking the side of a moving or stationary train. These different scenarios generally produce significantly different physical forces on the train, affecting the likelihood of derailment (Cherchas et al., 1982). Chadwick (2017) found that VST collisions were disproportionately more likely to result in derailment.
In addition to different direction of the physical forces exerted upon the trains in these scenarios, there is also an expected difference in the speed of the road vehicle at the time of the collision. For instance, in 13 collisions which involved a heavy vehicle stopping foul of the level crossing, the road vehicle was stationary. In many of these collisions, the train drivers identified the stationary vehicle and commenced braking, and the train speed was thus also reduced.
The national rail safety database did not include information about whether road vehicle struck, or was struck by, the train. Of the 49 collisions between trains and heavy vehicles reviewed in this study, there were at least 39 TSV collisions of which 7 (17.9%) resulted in derailments. Of 7 VST collisions, 4 (57.1%) resulted in derailment. Fisher’s exact test showed a significant association between collision sequence and derailment (one-tailed p= 0.046), such that VST collisions were more likely to lead to derailment.
Of 4,886 collisions involving heavy vehicles recorded in the US FRA dataset there were 4,354 TSV collisions, of which 110 (2.3%) resulted in derailment. Of 532 VST collisions, 31 (5.8%) resulted in derailment. Fisher’s exact test showed that VST collisions were significantly more likely to result in derailment (one-tailed p<.001).
ATSB finding
Although level crossing collisions between heavy vehicles and trains were more likely to involve the train striking the heavy vehicle, accidents where the heavy vehicle struck the train were more likely to cause a derailment (Factor that increased risk).
Analysis of heavy vehicle level crossing collisions in Australia
The ATSB reviewed various sources of evidence to determine the circumstances which led to the road user entering the level crossing and not giving way to the train. There were 3 main types of road vehicle actions which precipitated level crossing collisions:
- Did not stop. These instances involved a road vehicle not stopping and entering the level crossing. This includes instances where the driver commenced braking late and was unable to stop in time to prevent entering the crossing.
- Stopped and proceeded. These instances involved a road vehicle stopping prior to the level crossing, then proceeding into the crossing.
- Stopped on the crossing. These instances involved the road vehicle stopping foul of the level crossing while waiting for traffic ahead to clear, and instances when the vehicle was stopped on the crossing due to a road accident or other event (mechanical problem of the road vehicle).
Unsurprisingly, the different actions associated with level crossing collisions varied depending on the type of level crossing protection equipment in use. There was one collision where there was insufficient information to determine the action of the road vehicle driver. The number of collisions associated with each action and the distribution by crossing type is shown in Table 15Table 15: Heavy vehicle driver actions preceding level crossing collisions, by level crossing primary protection type
Did not stop
Stopped and proceeded
Stopped on crossing
Total, all actions
Boom gates
0
0
11
11
Flashing lights only
8
3
1
12
Stop sign
11
7
1
20[1]
Give way
5
1
0
6
Total, all crossing types
24
11
13
49
[1] There was insufficient evidence to identify the road user action for one accident at a Stop sign level crossing.
ATSB finding
All level crossing collisions involving heavy vehicles resulted from the heavy vehicle driver not giving way to trains. There were three actions associated with the collisions:
There were at least 24 collisions where the heavy vehicle did not stop prior to entering the crossing.
There were at least 11 collisions where the heavy vehicle stopped at the crossing then proceeded into the path of a train.
There were at least 13 collisions where the heavy vehicle entered a level crossing and stopped foul of the train line. (Factor that increased risk).
Collisions at boom gate crossings
All 11 collisions at crossings protected by boom gates involved the road user stopping foul of the crossing. In at least one of these collisions, the driver was unintentionally foul of the crossing due to misjudging the length of their vehicle relative to the available distance on the far side of the crossing.
In 3 collisions, records indicated that the heavy vehicle driver had been unable to exit the level crossing due to unanticipated events. In 2 of these collisions, the heavy vehicle was involved in a collision or near collision with another road vehicle and became stuck. In the other collision, the heavy vehicle reportedly entered the crossing while queueing for an adjoining road, but encountered a mechanical problem and was unable to move from the crossing.
Collisions at flashing light crossings
Most collisions at crossings protected by flashing light signals (8 of 12) involved circumstances where the heavy vehicle driver did not stop before entering the crossing. In 6 of these cases, the heavy vehicle driver observed the flashing lights late on the approach and braked and skidded into the crossing. This meant that at the time of collision, most of the road vehicles were either travelling at a very slow speed or had in fact come to a stop foul of the crossing. In one of the cases, the driver detected the crossing and braked, however records indicated that the vehicle had defective brakes.
In 3 of the 12 collisions the heavy vehicle driver stopped at the crossing and inadvertently proceeded into the path of a train. Various unique factors contributed to each of these collisions:
In one accident the stop lines at the level crossing were placed too close to the primary level crossing flashing light assembly. This meant that the driver of a passenger bus, who was seated very close to the front of the vehicle, was unable to see the flashing level crossing lights. In that instance, the level crossing also included a secondary flashing light assembly at far side of the crossing, however the bus driver did not look at those lights and inadvertently proceeded into the crossing just before the arrival of a train.
In another accident, the truck driver heard the train driver sound the train horn and mistakenly thought this was an invitation to enter the crossing ahead of the train.
In another accident, the truck driver was distracted by something related to the performance of their vehicle and did not pay attention to the level crossing.
One collision involved a heavy vehicle stopping on the crossing (prior to the activation of the flashing lights) and being unable to clear the crossing prior to the arrival of a train due to another heavy vehicle being stuck on the road ahead.
Collisions at Stop sign crossings
In 11 instances, the heavy vehicle driver did not stop at the Stop sign crossing. In 3 cases, the driver braked too late and inadvertently entered the crossing, indicating the crossing was not detected in time to stop. In 4 collisions the drivers attempted to conduct a ‘rolling stop’[24] and thus intentionally did not stop prior to entering the crossing, and probably failed to detect the presence of a train. In one collision, the truck driver reportedly stated they had not stopped or looked for trains before proceeding through the crossing.
In 7 of the 19 collisions at Stop sign level crossings, the heavy vehicle driver stopped their vehicle at the crossing and inadvertently proceeded into the path of an oncoming train.
There was one reported collision where the heavy vehicle driver detected the train and mistakenly determined it was safe to enter the crossing. As such, the other accidents probably indicated problems with either the sighting at the level crossing, the drivers’ behaviour when looking for trains, or the conspicuity of the trains, all of which may have led to the heavy vehicle drivers entering the crossing without identifying a train was approaching.
Collisions at Give way sign crossings
In 5 of the 6 collisions at Give way crossings, the road vehicle driver either did not see the train until they were on the crossing or did not see the train at all. This included one collision where a truck driver did not stop at a level crossing ahead of an approaching train, causing the train drivers to apply emergency brakes. The driver then stopped at an intersection ahead of the crossing, while still foul of the train line.
Inadvertent failure to detect level crossing equipment
Research and background
In order to give way to trains at level crossings, road vehicle drivers must first identify that they are approaching a level crossing. The level crossing safety system provides information to drivers about the presence of an upcoming level crossing using roadside signs and roadway pavement markings. In the case of active level crossings, the presence of the crossing is also indicated by boom-gates across the roadway and/or flashing light beacons.
Yeh and Multer (2008) note that some road vehicle drivers inadvertently miss cues relating to the presence of a crossing, reducing their ability to stop in time. The section Factors affecting heavy vehicle driver provides discussion about some of the reasons for these errors.
Analysis of heavy vehicle level crossing collisions
As identified in Actions of heavy vehicle drivers there were 24 collisions in which the heavy vehicle driver did not stop prior to entering the level crossing. One plausible reason for these collisions was that the drivers did not detect they were approaching a level crossing until it was too late.
To identify the instances where level crossing equipment was not detected, records including police reports, train driver statements, rail infrastructure manager reports and ATSB investigation interviews were reviewed. The ATSB identified:
There were no instances of heavy vehicle drivers not detecting the presence of a boom-gate controlled active level crossing.
There were at least 6 collisions where the heavy vehicle driver did not detect that they were approaching an active flashing lights-controlled level crossing until it was too late to stop. In several of these instances, braking occurred before the crossing, however due to the speed and mass of the heavy vehicles there was insufficient distance for them to stop. In one example, an ATSB investigation identified that the road-train truck driver commenced braking at about 180 m from the crossing while travelling at 90 km/h but was unable to stop.
There were at least 3 collisions at Stop sign level crossings where the heavy vehicle driver did not identify the level crossing until it was too late to stop. In one of these collisions, the heavy vehicle driver reported to police that they were completely unaware of the crossing, and a rail infrastructure manager report identified that sun glare obscured the driver’s vision of the crossing. In the other 2 collisions, the driver identified the level crossing too late to stop.
There were 5 collisions where the heavy vehicle driver did not stop prior to entering a level crossing controlled by Give way signs. The road rules for Give way sign-controlled crossings do not require a vehicle driver to come to a complete stop, except to give way to trains if one is approaching the crossing. Due to this, the failure of the drivers to stop may have resulted from a failure to detect the presence of the level crossing, or a failure to detect the presence of trains. There was insufficient evidence to determine which of these ‘failures’ contributed to the 5 accidents at Give way sign crossings.
This analysis indicates that in a subset of collisions, heavy vehicle drivers did not detect the presence of the upcoming level crossing. While only a minority of instances, these collisions reflect a dangerous state in the level crossing system. If a driver does not identify the presence of a Passive control crossing, they will not be looking for trains, and there are limited redundant controls to alert them of the requirement to stop. AS1742.7 states that Stop sign crossings are required to be installed when visibility on the road approach to a crossing does not provide adequate visibility for a road vehicle driver to see an approaching train, and this poor visibility will further reduce the likelihood of the train being detected visually by opportunistic (rather than deliberative) scanning. The train horn may provide an aural indication of a requirement to stop, however there are known limitations with the audibility of train horns (see Train horn audibility).
Concerning collisions at active level crossings, the errors were mainly a failure to detect that the crossing was activated, rather than not detecting the crossing. This also presents a highly dangerous condition, since a driver approaching an active control level crossing and perceiving the crossing as not active (lights not flashing), will parse that information as indicating the crossing is safe and no train is approaching. This highlights the importance of ensuring that the signal produced by active level crossings are conspicuous.
Deliberate violation of level crossing rules
Research and background
Part of the safety system for level crossings are the procedural risk controls for level crossing users, including road rules applicable to road vehicle drivers. When road vehicle drivers intentionally disobey the requirements of road rules at level crossings, they greatly reduce the effectiveness of the safety system.
Research has identified that some road vehicle drivers deliberately violate road rules requiring them to stop at level crossings. For example, one study showed that of 22 drivers, 3 did not stop at rural Stop sign level crossings (Beanland and colleagues, 2017). These drivers noted trains were infrequent and suggested there was ample sight distance to look for trains (Stop sign crossings are often installed where there is not adequate distance to look for trains while approaching the crossing).
Gou and Bellavigna-Ladoux (2003) noted that a common form of deliberate non-compliance at level crossings is conducting a ‘rolling stop’. This involves slowing the vehicle until a decision is made to proceed into the crossing, without coming to a complete stop. When conducting a ‘rolling stop’ a road vehicle driver will necessarily spend less time at the stop point for a passive level crossing and therefore will probably conduct less time scanning for oncoming trains, increasing the likelihood of an incorrect decision to proceed into the crossing when it is not safe.
Heavy vehicle drivers may be more likely to engage in ‘rolling stop’ behaviour when approaching a Stop sign level crossing. As described in the ATSB investigation RO-2007-001, Level crossing collision at Back Creek, NSW:
Stresses on driveline components (engine, transmission etc) are generally highest on large vehicles when starting from rest, increasing the risk of a failure under some conditions (inappropriate driving or clutch operation). Consequently, heavy road vehicle drivers will, at times, attempt to avoid a complete stop and execute what is commonly referred to as a ‘rolling stop’. A rolling stop is where a driver slows their vehicle such that they can make the decision to proceed without coming to a complete stop, that is, without having to depress and release the clutch.
The design standards for level crossings (Appendix B) include a variable for the acceleration capabilities of the design vehicle, and in doing so provide allowance for the increased time required by heavy vehicle drivers to depress and release clutch and engage the required gears to proceed from a stop and through the crossing. This may not, however, translate to heavy vehicle drivers always ensuring their vehicles come to a stop at Stop sign controlled crossings, since they may seek to avoid placing stresses on drivetrain components or simply prefer to maintain forward movement.
Another common violation occurs when road vehicle drivers enter a level crossing and stop foul of the rail tracks. A common scenario is the driver entering the crossing while the road ahead was blocked by other traffic, mistakenly anticipating traffic ahead would clear and they will be able to proceed through. This is contrary to road traffic laws. For example, the Australian road rules (model law) states:
A driver must not enter a level crossing if: …the driver cannot drive through the crossing because the crossing, or a road beyond the crossing, is blocked.
These violations have been attributed to various factors; road vehicle drivers may perceive there to be a low level of risk associated with entering a crossing and waiting for traffic to clear. These actions may also be influenced by social pressure and perceived social norms (Yeh and Multer, 2008). In one study, 30% of drivers reported that they would violate boom gate crossing rules if they did not detect a train and they saw another driver do so (Witte and Donohue, 2000).
Analysis of heavy vehicle level crossing collisions
In at least 4 collisions, the heavy vehicle drivers engaged in deliberate non-compliance with level crossing rules for Stop signs by conducting a ‘rolling stop’ on approach to the crossing. In another collision, the heavy vehicle driver did not stop at a Stop sign and did not look for trains. These actions increased the risk of collision by reducing the likelihood that the drivers would identify the presence of trains.
There were at least 6 collisions where the heavy vehicle driver intentionally entered the level crossing when traffic or another blockage prevented them from proceeding clear of the train lines. This did not include instances where the driver mistakenly thought their vehicle was clear of the crossing, or instances where the driver had an accident or breakdown on the crossing.
In an additional 3 collisions, the heavy vehicle driver intentionally entered and stopped foul of the crossing, but did not exit the crossing in time to prevent a collision. In these 3 accidents there was no evidence of a blockage preventing the heavy vehicle from clearing the crossing and were considered intentional non-compliance with level crossing rules for the purpose of this analysis.
In addition, there were 2 collisions where the driver of the heavy vehicle was engaged in high-risk behaviour prior to unintentionally entering the level crossing or unintentionally stopping foul of the crossing. In one instance, the driver was distracted by their mobile phone, and in another the driver was found to be drug affected. These accidents were not considered intentional violations of level crossing rules in this analysis; these drivers did not intentionally enter the level crossing.
ATSB finding
In at least 14 collisions it is likely that the heavy vehicle driver intentionally entered the level crossing in a manner which was contrary to road rules. These included 6 collisions where the driver intentionally entered the crossing without being able to drive clear of the crossing, 4 collisions where the driver engaged in a 'rolling stop' while approaching a Stop sign level crossing, 3 collisions where the driver remained stopped foul of the crossing while there was no obstacle preventing them from exiting, and one collision where the driver did not stop or look for trains at a Stop sign crossing (Factor that increased risk).
Failure to detect trains at passive control crossings
Research and background
At passive control crossings, road vehicle drivers must visually search for and detect the presence of a train to determine when they can and cannot proceed through a crossing. There are no recovery controls to prevent a collision if a road vehicle driver does not detect that a train is approaching.
Road vehicle drivers sometimes do not look for oncoming trains when approaching a passive control crossing. Research using head movement measurements of heavy vehicle drivers found that less than 60% looked in at least one direction of the train line when approaching a passive control level crossing (Ngamdung and da Silva, 2012). Failure to look for trains may be associated with a number of factors, including not identifying the presence of a crossing, distraction or preoccupation, or a low expectancy of the presence of a train at the crossing.
Even when road vehicle drivers look in the direction of approaching train, they may not detect the train nor identify a requirement to stop. Rudin-Brown and colleagues (2014) identify that many level crossing collisions result from so-called ‘Looked But Failed to See’ errors.
Analysis of heavy vehicle level crossing collisions
As identified in Actions of heavy vehicle drivers there were 26 collisions at passive control level crossings. Of these collisions, at least 2 involved the heavy vehicle driver detecting the train before entering the crossing:
In one instance, the driver of the heavy vehicle stopped for a Stop sign level crossing and identified that a train was nearby. The train’s lead locomotive cab was unoccupied, and was conducting an indexing movement across the crossing at low speed. The truck driver incorrectly determined that they could transit the crossing safely, and the train scraped the side of the truck prior to it clearing the crossing.
In one instance, the driver approached a Stop sign level crossing and, according to the rail operator report for this collision, the truck was unable to stop for the crossing due to a mechanical problem.
Concerning the other collisions at passive control level crossings, there was limited information to determine whether the heavy vehicle driver looked for trains and detected the presence of a train before proceeding into the crossing. Heavy vehicle drivers were almost never interviewed, except in collisions which were investigated by the ATSB. Driver statements were sometimes included in police reports; however drivers may be disinclined to inform the police if they had not looked for trains.
While there was very limited direct evidence concerning whether a heavy vehicle driver looked for trains, the ATSB considered that an indirect indicator of heavy vehicle drivers attempting to comply with the requirement to look for and give way to trains was whether the heavy vehicle slowed or stopped during the approach to the crossing. However, it is acknowledged that this indirect evidence cannot rule out the possibility that some drivers may have slowed when approaching the level crossing due to other factors, such as the road condition near the crossing, or to accommodate the type and weight of their load.
The ATSB reviewed rail operator, rail infrastructure manager and police reports to classify the braking behaviours of heavy vehicles approaching passive control crossings.
In at least 12 collisions, the driver either slowed or stopped while approaching passive control crossings but either did not detect the train, or deliberately entered the crossing ahead of the train.
In at least 4 collisions, the driver did not slow or stop for the crossing until too late. In one of these collisions, the ATSB report found the driver did not approach the crossing with sufficient caution to stop after noticing the train. In another collision, the rail infrastructure manager report stated the vehicle was travelling too fast to stop at the crossing. In another collision, the driver stated they did not detect the presence of the crossing, and only commenced braking after seeing the train shortly before the collision.
In one collision, the rail operator report stated that the heavy vehicle driver reported that they had not slowed or looked for trains at the Stop sign crossing.
In 7 collisions, there was insufficient evidence available to determine whether the heavy vehicle slowed on approach to the passive control level crossing.
The analysis therefore identifies that in at least 46% (12 of 26) of collisions the observed braking behaviour indicated that the heavy vehicle drivers made some attempt to comply with the requirement to look for and give way to trains, however probably did not detect the presence of the train.
An alternative explanation in these cases was that some the heavy vehicle drivers who slowed or stopped when approaching passive control level crossings did identify the presence of a train, but elected to enter the crossing, in an attempt to ‘beat the train’ through the crossing. There was no direct evidence of any heavy vehicle drivers deliberately proceeding in front of an approaching train, although drivers may be unlikely to make admissions of such behaviours to police or to rail operator investigations. In 2 cases, the heavy vehicle driver was fatally injured in the accident and there was limited information concerning whether they had observed the train prior to entering the crossing. In 4 cases, the heavy vehicle drivers stated that they had looked for trains prior to entering the crossing. In other cases, other circumstances related to the accident indicated it was unlikely the heavy vehicle driver had deliberately entered the crossing. Considering all the available evidence of the 12 cases where heavy vehicle drivers slowed or stopped while approaching passive control crossings, the ATSB determined the drivers had probably not detected the presence of a train.
ATSB finding
Of 26 collisions at passive control crossings, there were at least 12 collisions where the heavy vehicle driver slowed or stopped but probably did not detect the train, and entered the crossing into the path of the approaching train (Factor that increased risk).
The analysis of level crossing collision data showed that collisions typically occurred in fine weather, in daylight, on dry, sealed roads. Previous analysis found that most level crossing accidents did not involve alcohol or excessive speed (ATSB, 2002), which are common causes for other road accidents (OECD, 2021).
The majority of collisions probably involved some form of unintentional lapse, where the heavy vehicle driver did not identify a train was approaching the crossing. Even in the subset of collisions where a deliberate violation of road rules was identified, the heavy vehicle driver probably intended and expected to clear the crossing safely.
The safety systems approach to accident analysis seeks to understand the contextual factors associated with individual errors and violations. This involves identifying factors that exist within the system which increase the likelihood of errors and other failures (latent conditions). For the level crossing safety system, this includes considering how the experiences and tasks of road users shape their performance at level crossings. It also includes considering the design of vehicles, trains and level crossing equipment, and whether these support the tasks of the human operators at level crossings (road vehicle and train drivers).
Familiarity and expectancy
Research
When drivers become familiar with a particular crossing or a particular type of crossing, and when the driver has previously not observed trains at that crossing (or type of crossing), an unconscious expectancy for no trains at that crossing or that type of crossing may form (Rudin-Brown and colleagues, 2014). Researchers have argued that drivers generally expect there to be no trains present at level crossings (Eck, 2002), and that these expectations are ‘the greatest challenge’ in overcoming safety problems at passive level crossings (Salmon and others, 2013) and the ‘root of unintentional noncompliance at…level crossing’ (Eck, 2002).
Research has shown that drivers familiar with a level crossing are more frequently involved in level crossing collisions than drivers unfamiliar with an area (Abraham and colleagues, 1998). A coronial investigation into 12 fatal level crossing collisions in Victoria found that all except 3 drivers were very familiar with the crossing and all but one never or rarely saw a train at the level crossing (Coroner’s Court of Victoria, 2013).
There are several ways that this low expectancy of trains can contribute to level crossing collisions. Low expectancy for trains may influence deliberative, planned behaviour where a driver enters a level crossing contrary to the requirements of road rules. Reason (1990) identifies that routine violations of rules are often the product of environments where violations are infrequently punished, which may be taken to mean formal punishment in the case of law enforcement, or other negative consequences such as collisions. As Yeh and Multer (2008) summarise, a low expectancy and low frequency of trains at level crossings may cause drivers to simply disregard crossing protection equipment.
The other way low expectancy for trains can influence level crossing collisions is at the unconscious level, affecting how road vehicle drivers scan for and detect important information about the crossing and the presence of trains. Reason (1990) identifies that people engaged in well-practiced, routine tasks are vulnerable to unintentional slips of attention. In these contexts, attention and behaviour is highly influenced by the ‘motor schema’ or ‘script’ for the task, and there is a high likelihood that an operator will miss cues which indicate a need to divert from the typical routine.
The task of driving a road vehicle is generally highly-practiced, and occurs in roadway environments where other demands and distractions are often prevalent. In this context, road vehicle drivers are required to depart from the active and dominant motor schema of continuing to drive along the road, and adopt a motor schema of looking and preparing to stop for trains. For motorists with a low expectancy for encountering a train at a crossing, there is a high likelihood that they may miss cues which identify they need to stop for trains.
Other psychological theories identify that experiences form the basis for ‘schemas’ or ‘mental models’ of the task environment. These mental models influence where a person will search for information, what they are looking for, and which information they will detect (Wickens and McCarley 2008; Wickens and others 2013). Drivers with a low expectancy of trains may therefore be less likely to look for trains, or look for activated flashing lights. Even in situations where a driver looks directly at a train or flashing light assembly, they may not detect the requirement to stop and proceed into the crossing, reflecting a so-called ‘looked-but-failed-to-see’ error.
Analysis of heavy vehicle level crossing collisions
As described in Errors and violations associated with level crossing, 9 accidents were due to the heavy vehicle driver intentionally stopping foul of a level crossing. There was insufficient evidence to establish whether any of these drivers were familiar with the level crossing, or what expectancy they had when entering the crossing. It is possible, however, that some or all these drivers previously queued over the same crossing or other intersections, with no negative consequences. It is also possible that these drivers had observed other drivers queueing over level crossings, normalising the behaviour and reducing the expectancy of negative consequences.
There were 12 collisions where the ATSB identified that the heavy vehicle driver was familiar with the level crossing prior to the collision with the train, and all of these involved the driver either not stopping at the crossing or stopping and proceeding into the path of the train. There were 6 collisions where the heavy vehicle driver was familiar with a passive control level crossing and did not detect the presence of the train. In 5 collisions, the heavy vehicle driver was familiar with a crossing protected by flashing lights and did not detect that the lights were activated.
The heavy vehicle drivers were typically engaged in driving for business or employment, and the collisions often occurred on routes they traversed several times a day or week. Some examples included:
One driver reported that they travelled across the same level crossing about 20 times per day for work, and was not expecting a train.
One driver reported they had been driving the same route for 2 months and the train they collided with was the first train they had seen at the level crossing.
It was not possible to precisely describe the effects of familiarity for each of these 12 collisions. However, it is highly likely that in some collisions the drivers’ familiarity with the level crossings and low expectancy for encountering trains affected their attention to and perception of the crossing environment. With a low expectancy of trains, the drivers may have either not allocated sufficient attention to the crossing or have looked but not detected a requirement to stop.
In one collision the heavy vehicle driver entered a level crossing after identifying that the level crossing lights were flashing and detecting the train. The driver heard the train driver sound the train horn and mistakenly thought this was an invitation to enter the crossing ahead of the train. They reported to police that they had previously been ‘let through’ the crossing in similar circumstances, and therefore had an expectancy that they could cross ahead of the train.
ATSB finding
There were at least 12 level crossing collisions where the driver of the heavy vehicle had regularly used the level crossing prior to the collision with a train. This included 6 collisions where the heavy vehicle driver proceeded into a passive control crossing without identifying the presence of a train, and 5 collisions where the heavy vehicle driver did not identify activated flashing level crossing lights. The drivers' previous experience at the level crossings likely led to a low expectancy for trains and, in at least some collisions, contributed to them not detecting a requirement to stop and give way. (Factor that increased risk).
Distraction and divided attention
Research
Distraction occurs when a driver’s attention (meaning where the driver is looking, what they are manipulating/touching, and what they are thinking about) is diverted from activities critical for safe driving towards a competing activity (Parnell and others, 2016). There is a significant body of evidence demonstrating that distraction impairs driving performance and contributes to accidents (Young and others, 2007).
The task of driving a road vehicle often requires attending to complex road environments. Due to a limited ability to attend to multiple sources of information at once, road vehicle drivers operating in complex or cluttered areas (such as where there are multiple intersections, signs, or road users) may be less likely to attend to and detect trains (Rudin-Brown and others, 2014).
Reviews of level crossing collisions have identified that distraction can be a contributory factor to driver non-compliance (Rudin-Brown and others, 2014). In-cab studies of heavy vehicle drivers have shown that drivers sometimes attend to other tasks (including texting or eating) while negotiating level crossings (Ngamdung and da Silva, 2012), or may be distracted by factors at the crossing such as poor surface conditions (Eck, 2002).
Analysis of heavy vehicle level crossing collisions
Records indicated that at least 6 of the heavy vehicle drivers were probably distracted prior to the collision, or were dividing their attention between driving the vehicle and another task or thought. In some of these instances, the driver was reportedly focussed on other traffic or complicated road signage, and did not detect the level crossing flashing lights or the approaching train. In one example, an ATSB investigation obtained in-vehicle video footage which showed the truck driver was distracted by re-affixing a mobile phone mount which had fallen from the truck windscreen. The truck driver did not notice the flashing active crossing warning lights and proceeded into the crossing, colliding with a freight train.
Obstructed vision due to vegetation, sun glare and poor crossing lighting
Research
For a road vehicle driver to detect an oncoming train at a passive level crossing, the train needs to be visible within their field of view. In some instances, however, the design and maintenance of level crossings is such that the driver’s view is obstructed.
Another visual problem encountered by road vehicle drivers approaching a level crossing is disabling sun glare. Disability glare occurs when light enters the eye and ‘washes out’ the image being perceived (Sanders and McCormick, 1993). The disabling effect of glare is greatest when the sun is in the direct line of sight of the driver. Thus, sun glare is greatest at the times just before sunset and just after sunrise, when the sun is low in the sky and thus objects which are being viewed at ground level fall in a narrower angle relative to the sun.
After sunset, night-time darkness affects the ability of drivers to safely negotiate level crossings by reducing the availability of visual cues, particularly for passive control crossings. Where level crossings are unlit, level crossing signage may be difficult to detect. Yeh and Multer (2008) note that illumination of level crossings improves the detection of the crossings at night.
Analysis of heavy vehicle level crossing collisions
In at least 9 collisions reviewed by this study, the view of the heavy vehicle driver was probably obstructed by nearby vegetation. In at least 8 instances, vegetation probably obstructed visibility of the rail track, which may have reduced the ability of the driver to detect oncoming trains. In one instance, vegetation obstructed the visibility of the rail track and the level crossing protection equipment.
In one collision, the rail infrastructure manager and police reports identified that the driver of the heavy vehicle was probably unable to detect the presence of the level crossing due to sun glare.
In another collision, the rail infrastructure manager identified that a Stop sign was located in a dark industrial area, with poor lighting on the crossing itself and contrasting bright lights from surrounding industrial installations and other road traffic. The infrastructure manager report found that when a heavy vehicle approached the crossing at night, the poor lighting conditions reduced the driver’s ability to detect an approaching train.
Obstructed visibility due to vehicle design
Context
In addition to environmental obstructions, the visibility of trains and level crossing equipment may be affected by vehicle design characteristics. Heavy vehicles often have large ‘A’ and ‘B pillars, planar mirrors, and other structures like exhaust snorkels. Research has shown that restricted fields of view in heavy vehicles are a common cause of other road accidents (Blower, 2007; Niewoehner and Berg, 2005).
The Australian Design Rule 93/00 – Forward Field of View specified the allowable restrictions within the drivers’ forward 180° field of view for passenger and heavy vehicles supplied to the Australian market.[25] The regulations did not prescribe any requirements for field of view behind the driver.
The design standards for level crossings (Australian Standard AS1724.7:2016) required that the sighting opportunity available to road users is provided at visual angles which do not require excessive head movement or sight obstruction by the vehicle itself. The standard states that for the sighting distance when stopped at a level crossing, the maximum allowed viewing angles are 110° to the left and 140° right.
The combination of vehicle design which does not prohibit restricted visibility behind the driver seated position, and crossing design which allows for rail traffic to approach from obtuse angles (greater than 90°), leads to a potential zone of restricted visibility where the driver may need to lean forward to view along the train track.
Analysis of heavy vehicle level crossing collisions
In at least 5 collisions reviewed in this safety study, the design of the heavy vehicle cab probably restricted the driver’s view of the crossing equipment or train. These included 3 collisions which had previously been investigated by the ATSB:
RO-2015-016: The ATSB found that the truck ‘A’ pillar and air snorkel probably restricted the driver’s view of the flashing lights as the truck approached the crossing.
RO-2016-009: The ATSB found that the truck driver’s view of the track when looking left was restricted by the structure of the cab and the absence of windows behind the driver. When seated in an upright position, the viewable area was limited to 90°, meaning only 29 m of track was visible. This could be extended by up to 104° (60 m) by hunching forward.
RO-2017-011: The ATSB found that the truck driver would not have been able to see the approaching train from their stopped position, due to their line of sight being obscured by the truck’s B-pillar.
In another collision, the shallow-nosed design of the bus cab meant that when the driver was stopped at the stop line, they were very close to the stop line and had a restricted view of the flashing crossing lights on the near-side of the crossing, contributing to them entering the crossing into the path of a train. In the other collision, the driver identified that large air cleaners on their vehicle may have obstructed vision of the train at the passive control level crossing.
This analysis demonstrated that the visibility of some heavy vehicle drivers was restricted by objects around the level crossings, the design of the heavy vehicle and the crossing, and the environmental conditions at the time of the collisions.
ATSB finding
Of the 49 level crossing collisions involving heavy vehicles, there were at least 14 collisions where the heavy vehicle driver’s view was obstructed by vegetation, the design of the heavy vehicle cab, poor crossing lighting, or sun glare (Factor that increased risk).
Train horn audibility
Australian Standards and other requirements
Locomotives operating in Australia must be equipped with train horns, which are used to ensure individuals in and around the rail corridor are aware that rail traffic is approaching. The Rail Industry Safety Standards Board (RISSB) Code of Practice for Rail Traffic Horn Use stated that:
For the rail traffic horn to achieve its intended purpose, it shall be designed to be audible and distinctive (i.e., from road vehicle horns) and to a level where the intended receiver can hear it and understand its meaning. The rail traffic horn is intended to be heard above the general background noise and other potential distractions, such as: a) plant and machinery at worksites and depots; and b) personal devices and background noise at level crossings.
The Australian Standard for Railway Rolling Stock Audible Warning Devices (AS 7532:2016) described requirements for the audibility of train horns:
The country warning device must produce at least 88 dB at 200 m ahead of the rolling stock, and at least 106 dB at 30 m ahead of the rolling stock.
The town warning device must produce at least 90 dB at 100 m from the rolling stock and 101 dB at 30 m from the rolling stock.
AS 7532:2016 did not specify the types of train horns accepted for use, or the frequencies at which the train horn must produce sound.
The RISSB Code of Practice for Rail Traffic Horn Use stated that activating the train horn was a requirement at passive control level crossings, and optional at active control crossings. The code of practice also required that the train horn must be sounded at the whistle board, where placed, and may be sounded at other locations including during the approach to and on the crossing.
Research on effectiveness of train horns
Research examining level crossing collisions in the US between December 1995 and August 1996 found that 55 of 60 train drivers sounded the locomotive horn prior to the collision, but only 4 of 14 road vehicle drivers reported hearing the horn (described in Yeh and Multer, 2008). In a 2013 coronial review of 12 fatal level crossing accidents in Victoria, the Coroner noted that none of the drivers had heard the locomotive horn (Coroner’s Court of Victoria, 2013). These reviews highlight that in many collisions it is evident that train horns were unreliable for alerting road users to the presence of a train.
Supporting the utility of train horns, Yeh and Multer (2008) identified that initiatives prohibiting the use of train horns (whistle bans) in US jurisdictions have led to increased rates of level crossing collisions. For example, they report analysis conducted by the FRA in 1995 was reported:
An “Accident Prediction Formula” that calculated the likelihood of an accident at a grade crossing based on its physical characteristics (e.g., the number of tracks and highway lanes, types of warning devices, rural or urban location, road condition) and operational aspects (e.g., number of highway vehicles and train volume, speed, type, and schedule) found that the risk of a grade crossing accident was 84 percent higher when the train horn was silenced (FRA, 1995).
Follow-up analysis conducted by the FRA (2000) found that:
Consistent with the results of the previous study, the analysis showed that the whistle ban impacted safety, with a 62 percent increase in accidents at whistle-ban crossings protected with gates, 119 percent increase at whistle-ban crossings protected by flashing-lights only or another type of active warning device, and a 27 percent increase at whistle-ban passive crossings.
Several laboratory studies have investigated the acoustic qualities of train horns, and the audibility of train horn sound in simulated conditions. Findings from this research include:
Different types of train horns produce different patterns of sound. 5-chime horns were found to produce a much greater volume of sound at higher frequencies (above 800 Hz) than 3-chime horns (Rapoza and Raslear, 2001).
Train horn sound is attenuated as a function of the distance of the train from the vehicle, consistent with the inverse square law for sound. Because a vehicle travelling at a greater speed will need to detect the train from further away in order to stop, the train horn must be proportionally louder (proportional to the square of the distance between the train and road vehicle).
The level of sound available to road vehicle drivers is affected by the sound-attenuating properties of the vehicle body, referred to as insertion loss.
Train horn sound is also attenuated by whether the road vehicle windows are open or closed, whether the engine is running, and whether the radio and/or fan is on (Rapoza and Raslear, 2001; Casali and others 2002; Dolan and Rainey, 2005).
There were mixed findings regarding the detectability of train horns.
Raslear and Rapoza (2001) used a probability model to predict the likelihood that road vehicle drivers would detect an approaching train in time to prevent collision. The model predicted that a road vehicle driver approaching a passive control level crossing would almost always detect a 5-chime warning horn. However, a 3-chime warning horn would only be detectable 75% of the time when the train was travelling at 32 km/h, dropping to 25% of the time when the train was travelling at 64 km/h.
Dolan and Rainey (2005) conducted a laboratory study which involved producing simulated train horn sounds at different volumes, along with simulated background noises to replicate different vehicle conditions. They found that 50% of participants could detect the simulated train horn sound at a volume of 10 dB below the simulated background noise. One limitation of the applicability of this research is that the participants were not driving a vehicle and were primed to listen for the train horn signal.
Casali and others (2002) measured the sound produced by a 5-chime train horn, and the sound attenuating properties of a sample of 1990s model trucks under different operational conditions (engine on/off, windows up/down, radio on/off). This research concluded that the noise produced by the train horn only exceeded the ‘masked threshold’ (being 13 dB louder than background noise) when the engine was at idle and the windows were down.
In summary, there is no known research which has examined how frequently real drivers respond to train horns in real driving conditions. Consolidation of the research indicates that the requirement to use a train horn improves the safety of level crossings overall, however collision case-studies indicate that there are numerous instances where the train horn is not effective for alerting drivers to the presence of a train. There is a research gap, therefore, in identifying the circumstances in which train horns are not effective, and how often train horns are not effective for preventing collisions.
Analysis of heavy vehicle level crossing collisions
Records indicated that in at least 44 of the 49 level crossing collisions reviewed in the study the train crew sounded the horn as required prior to the collision. There were at 2 instances where the horn was not sounded as required at the whistle board, and 3 instances where there was insufficient information to determine whether the horn had been sounded.
Considering the effectiveness of the train horn for alerting heavy vehicle drivers to the presence of trains, the ATSB noted that:
There were 13 collisions which involved the heavy vehicle driver stopping foul of the crossing. In most of these, the heavy vehicle driver was not able to exit the crossing due to being blocked by traffic or another form of impediment, and thus detecting the train via the train horn was unlikely to have prevented these collisions. In 3 of the collisions the ATSB did not identify evidence of a blockage preventing the heavy vehicle from clearing the crossing.
In 3 collisions, the heavy vehicle driver had identified the presence of a train but did not stop. These included 2 collisions where the heavy vehicle driver encountered a mechanical problem and was unable to stop, and one collision where the truck driver heard the train horn and mistakenly interpreted this to be permission to entering the crossing. The detectability of the train horn was not considered to have affected these collisions.
There were 3 additional collisions where there was insufficient information to determine whether the vehicle driver detected the presence of the train.
Excluding these instances, the ATSB identified 25 collisions where the train horn was sounded and not detected by the heavy vehicle driver. The heavy vehicle drivers, not detecting the presence of a train, proceeded into the path of the train resulting in collision. It is possible that had the train horn, or another warning, been more conspicuous to the heavy vehicle drivers, then these 25 collisions may not have occurred.
The safety study reviewed collisions only, and did not examine the number of near misses and other instances where heavy vehicle drivers were alerted to the presence of the train by the train horn.
Other audible warning devices
Australian Standard AS1742.7 (Railway level crossings) states that flashing light signals may include the provision of audible warning devices. Further, the standard requires that where active control of pedestrian traffic is provided (red flashing man signal), an audible signal shall be provided. The safety study did not analyse the effectiveness of other audible level crossing warning devices, such as audible ‘bells’ provided at some level crossings. The ATSB observes, however, that such audible warnings are produced at a much lower volume than locomotive horns, and thus are likely to be less audible to approaching road vehicles. Audible level crossing signals are primarily engineered to be effective for alerting pedestrians.
ATSB finding
Previous research and review of collisions has identified that train horns are sometimes not effective for alerting road vehicle drivers to the presence of trains. Consistent with this, in at least 25 collisions, the horn was not effective at alerting the heavy vehicle driver to the presence of the train (Factor that increased risk).
Visual conspicuity of trains
Research
Due to the safety system for passive control level crossings relying on road vehicle drivers visually detecting the presence of a train in order to identify a requirement to stop and give way, there has been substantial interest in the extent to which the visual characteristics of trains make them difficult to detect. The concept of conspicuity refers to the material characteristics of an object which affect the likelihood it will be detected. The greatest determinant of visual conspicuity is the level of contrast between the object and its surrounding environment.
Trains are often constructed with dark colours, and may be poorly lit, reducing their conspicuity for road vehicle drivers, particularly at night (Rudin-Brown and others., 2014; Yeh and Multer, 2008). A review conducted by the Australian Centre for Rail Innovation (ACRI) identified Australian case studies where factors such as dull colour schemes, dirty train exterior and low contrast between the train colour and the surrounding environment may have reduced the conspicuity of freight trains (ACRI, 2022). The ACRI freight train visibility review identified 30 opportunities to increase the conspicuity of trains, of which 2 were carried forward to field testing (flashing train beacons and conversion of headlights from halogen to LED). The results of this testing showed that LED conversion of locomotive headlights resulted in improved visibility in misty conditions only, with insignificant improvement in clear weather conditions. The beacon light was only effective at improving visibility in situations where the train and observer were close to the crossing, and the level crossing angle was obtuse (between 90° and 180°) (Kassa, Wan and White, 2023). Other research has examined the effects of some common treatments for improving train conspicuity:
Studies have shown that trains equipped with auxiliary alerting lights (additional to the train headlight) are detected at greater distances (Carroll et al 1995).
Trains which have reflectorised markings installed on freight cars (wagons) are detected at greater distances than unmarked cars (see Edquist and others (2009), for a review).
Several studies have examined the benefits of strobe lighting on trains, however only small effects have been observed (Cairney, 2003).
In addition to poor illumination, the visual image of a freight train available to a road vehicle driver approaching a level crossing may provide a low likelihood of detection. When a driver is approaching a level crossing and attending to the road, an approaching train will be in the driver’s peripheral field of view. There will often be no visual cues indicating the presence of a train in the driver’s central (foveal) field of view, where detection of objects is most likely (Edquist and others, 2009; Yeh and Multer, 2008).
The human perceptual system is particularly adapted to detecting movement, and vision in the peripheral field of view is particularly sensitive to movement. Unfortunately, due to the geometry of a collision, a train will typically present as an unchanging retinal image to the driver. That is, the train will not appear to move across the driver’s retina when it is on a collision course with the road vehicle driver (Rudin-Brown and others, 2014). These perceptual challenges are similar to those described in the ATSB report
, which provides additional discussion of visual performance limitations in the aviation context.
Relevant industry standards
Australian Standard AS 7531:2015 Lighting and Visibility described the requirements for rolling stock lighting and visibility. This standard required that all locomotives and self-propelled passenger rolling stock have at least one white headlight on each leading end. For new and modified rolling stock, the standard required locomotives and self-propelled rolling stock have active visibility lights, which were required to flash for at least 15 seconds after the horn is sounded. The standard stated that the primary purpose of these lights was to enhance the visibility of the train from the perspective of a driver of a road vehicle approaching a crossing.
AS7531:2015 also required all new and modified locomotives and lead vehicles of passenger trains to have high-visibility colour livery applied. Under this requirement, at least one square metre of the forward-facing area of locomotives and passenger rolling stock was required to be yellow, orange, red or white.
In December 2023 (after the study period of 1 July 2014 to 31 August 2022), the Rail Industry Safety and Standards Board approved AS7531:2023. This version of the standard included additional rolling stock lighting and visibility design principles, and provided additional requirements for high-visibility livery. The lighting and visibility design principles added to the standards in the 2023 revision included the following:
…The overall design for conspicuity of the rolling stock shall be effective to allow for rail traffic crew, track workers and interfacing road and pedestrian users to identify oncoming rolling stock with sufficient time to respond and avoid an incident.
In January 2024, ONRSR announced that it would develop a Code of Practice for train visibility in Australia, with a final draft expected by mid-2024. The intent of this code was to ‘assist rail transport operators to strengthen the overall safety management systems that underpin their operations where trains interact with people, drivers and vehicles - with an emphasis on risk controls for train visibility’. ONRSR stated that it would consider the Code of Practice when conducting compliance activities, and that the code would be admissible to proceedings related to compliance with the Rail Safety National law.
Analysis of heavy vehicle level crossing collisions
The ATSB reviewed operator reports and other records to identify how conspicuity equipment such as headlights, visibility (ditch) lights and livery had been utilised for the trains involved in the 49 collisions with heavy vehicles reviewed in this study. Overall, this information was reported infrequently, with key observations being:
In 24 collisions, the records indicated that the train headlight was on prior to the collision with the vehicle, while in one collision, records indicated the headlight was off. In 24 collisions there was insufficient evidence to establish status of the headlight.
For 8 collisions, records indicated that the train had visibility (ditch) lights installed, whereas in 4 collisions the train did not have visibility lights. There were 37 collisions where information about the train visibility lights was not reported.
In 10 collisions, operators reported on the installation of reflective delineators. Four trains had reflective delineators installed on rollingstock, and 6 did not.
Of the 26 collisions at passive control level crossings, 2 occurred at night and in both of these cases the train had its headlights activated. In one of these collisions, the train was being operated in the reverse direction, meaning the train headlights were not effective at illuminating the train in the direction of travel towards the crossing.
In summary, due to limitations in available data from operator reports and other documents, this study was not able to evaluate whether trains involved in level crossing collisions were equipped with the lighting and other visibility equipment required by Australian standards. Furthermore, since this study only examined trains which were involved in collisions, it was not possible to identify factors associated with greater of poorer conspicuity, or for that matter the effectiveness of different types of equipment used to enhance train conspicuity. This is discussed further in Study limitations.
Other observations which may be useful for further analysis of train conspicuity include:
Very few of the collisions reviewed in this study occurred at night, when problems associated with conspicuity are probably greatest.
The majority of collisions (at least 39 of 49 collisions) involved the train striking the heavy vehicle, indicating that problems associated with train conspicuity are more likely to involve the conspicuity of the locomotive, rather than the other rollingstock.
Analysis of level crossing safety systems
Curved road approaches
Standards and other guidance relevant to placement of crossings on curved road approaches
Australian Standard for level crossing design
The criteria for the placement of level crossing protection equipment were described in Australian Standard AS 1742.7:2016 Manual of uniform traffic control devices. AS 1742.7 stated that level crossings:
should be located to avoid sub-standard geometric features of the road, such as sub-standard curves…. If this cannot be avoided, special attention should be given to the signing and marking of these features as well as the railway crossing itself. Sub-standard geometric features can lead to increased numbers of crashes not involving trains as well as having an effect on the incidence of vehicle/train collisions.
The standard required that if a level crossing was located on a curved road, then appropriate curve signs were to be used, or alternatively additional level crossing warning signage may be placed along the curve. The standard further stated that:
Where a crossing is located on a curve it may be necessary to adjust the orientation of the primary control device so that it is visible to approaching drivers from any point along the SSD [safe stopping distance] sight line. It may also be necessary to repeat the control device in advance. Where a curved approach leads to an active level crossing, an RX-11 [railway crossing flashing lights active advance warning signal] assembly may also be used to provide additional visual warning to road users.
AS 1742.7 sought to ensure that the placement of the primary active level crossing control device (such as the flashing light assembly) provided sufficient time and distance for the road user to identify a crossing ahead and stop after identifying the control device is activated. This distance was referred to as S1 or the safe stopping distance (SSD).
Sighting distances described in AS 1742.7, and shown in Figure 3, were defined as:
S1, the minimum road distance which must be available to the road design vehicle, at the point the driver is able to detect a requirement to stop prior to the nearest rail.
S2, the minimum distance of a train from the crossing at which a road vehicle driver at distance S1 from the crossing can proceed at speed and safely clear the crossing ahead of the train.
S3, the minimum distance of an approaching train from the centre of the crossing, when the driver of the road vehicle, stopped at the crossing, must first see an approaching train in order to safety cross the tracks.
XL, sighting angle (left).
Figure 3: Sighting distances for level crossings described in Australian Standard AS 1742.7:2016
Source: Image created by ATSB, illustrating concepts described in AS 1742.7:2016
AS 1742.7 provided guidance ‘in order to ensure that a motor vehicle driver can see along the prescribed sight triangles without excessive head movement’. This was achieved through the provision of maximum sighting angles for the S2 and S3 distances.
AS 1742.7 provided instructions for calculating S1 at each crossing, considering various factors related to the expected road user and the road construction (the formula for calculating S1 is provided in Appendix B). The standard did not require additional S1 distance for crossings placed on or after curved road approaches.
Procedural guidance for level crossing sighting surveys
Level crossing sighting surveys are conducted to determine if level crossings comply with requirements including those described in AS 1742.7. The Australian Level Crossing Assessment Model (ALCAM) Level Crossing Assessment Handbook was produced by the National ALCAM Committee as a guide for trained surveyors, providing methods for carrying out ALCAM surveys of level crossings in Australia and New Zealand. These procedures stated that to measure the available sighting distance for primary level crossing protection equipment (S1), surveyors should:
Drive all approach roads in the vicinity of the crossing to obtain the maximum sighting distance when the crossing control can be clearly seen, and record the available sighting distance available for each approach.
Calculate the required safe stopping distance position for the roads passing through the crossing. If there are side roads turning towards the crossing or if the crossing is approached from a nearby intersection, safe stopping distances for these roads were also to be determined.
Compare the available and required (calculated) safe stopping distances.
The handbook also identified that additional warning signs may be installed where the road approach to level crossings is curved, observing that ‘duplicated advance warning signs are generally placed on curved road approaches where visibility to the left-hand sign assembly is restricted by roadside vegetation, terrain or structures’.
Level crossing collisions
Of 6 collisions where the road driver braked too late to stop at a flashing light level crossing, 5 occurred at crossings on or following a curved road approach. All 5 were right curves. None of these collisions occurred at crossings with active advanced flashing lights (RX-11) installed. Three of the collisions had previously been investigated by the ATSB:
Figure 4: Image showing overhead and driver view of level crossing relative to vehicle line of travel, from ATSB investigation RO-2021-003
Source: ATSB investigation RO-2021-003, Level crossing collision between freight train 2C74 and road-train truck Yarri Road, Parkeston, Western Australia, on 22 February 2021.
Records from ALCAM surveys showed the recorded S1 distances for the road approaches travelled by the heavy vehicles, for the 5 collisions in this study which occurred on curved road approaches to flashing light level crossing (no boom gates installed). The ATSB reviewed satellite imagery to identify the position of the road vehicle at the point at which the S1 distance was identified, and the visual angle from that position to the level crossing protection equipment (flashing lights). These distances and angles are shown in Table 16.
Table 16: Visual angle identified for sighting of flashing lights at selected level crossing collisions at crossings with curved road approaches
Collision number
Curvature
Measured S1 distance
Angle to lights at S1 sighting
Road approach speed limit (km/h)
Collision 1
Right
250 m
24.5°
100
Collision 2
Right
275 m
24.5°
80
Collision 3
Right
220 m
20.2°
80
Collision 4
Right
120 m
16.0°
100
Collision 5
Right
274 m
2.8°
100
Level crossing collisions investigated in other jurisdictions have also been attributed to the effects of curved road approaches, with examples including:
Canadian Transportation Safety Board Railway Investigation Report R13T0192, Crossing collision involving passenger train and double decker bus on 18 September 2013. This collision occurred at a level crossing protected by flashing lights and boom gates. The investigation identified that ‘while negotiating the … [left] curve on the approach to the crossing, the [bus] driver would have generally gazed toward the tangent point at the centreline of the road and made anticipatory glances toward the occlusion point where the view of the road ahead was obstructed by trees, shrubs, foliage, and roadway signage. In addition to distractions that likely influenced the driver, the additional driver workload associated with negotiating the left-hand curve[26] on approach to the crossing likely decreased the driver’s ability to detect the activated (flashing lights)’.
Canadian Transportation Safety Board Railway Investigation Report R16D0092, Crossing collision involving passenger train and tractor-trailer 20 September 2016. The collision occurred at a crossing protected by flashing lights and boom gates. The investigation noted that the left curve approaching the crossing obstructed visibility of the level crossing equipment, and the crossing only became completely visible at 730 ft (223 m) from the crossing. The report found that ‘While the tractor-trailer driver was negotiating the curve, his visual attention was probably focused more on the outside of the curve rather than far ahead. Therefore, the driver did not immediately notice that the warning system was activated.’ The investigation noted that once the curve straightened, the driver had only 500 ft (152 m) to sight the crossing, which was insufficient distance to stop the heavy vehicle.
During vision, light energy passes through the eye and is focussed by specialised anatomy onto photoreceptor cells at the back of the eye. The centre of the focussed image falls upon the centre of the retina (the fovea) where there is the greatest concentration of photoreceptors, and particularly cone photoreceptors which are used for detail and colour vision. In combination with head and eye movements which bring objects into the centre of the field of view, this is referred to as visual fixation, and can be colloquially understood of as the process of looking at something.
Visual acuity (the ability to perceive detail) is greatest for objects which are directly fixated upon, and acuity declines as objects become more eccentric to the centre of the fixation point. When objects are more peripheral to the field of view, they will be less likely to be detected, and perceived less accurately with longer reaction times (see Carrasco and others, 1995 for example). Wolfe and colleagues (2019) found that drivers were more likely to detect brake lights of vehicles on the road straight ahead, and were slower and less accurate when detecting brake lights of vehicles which were in more peripheral locations.
There are no known standards for the visual angle provided for roadside signs and signals.
Research on visual fixations during curved road driving
When navigating straight roads, drivers primarily focus on the straight-ahead position the vehicle will be in the future, with experienced drivers focusing on the visual focus of expansion (which corresponds to the horizon straight ahead) (Underwood, 2007). The visual information about the vehicle’s current and future positions are located within the same field of view, so the driver is not required to look outside their straight-ahead orientation to steer the vehicle.
Scanning behaviour on curved roads is significantly more complex, since a driver must intermittently look towards the vehicle’s current and future positions to steer the vehicle (Transportation Safety Board of Canada, 2015).
Research shows that during driving on curved roads, visual attention is primarily focussed on the 1–2 second headway position of the vehicle, and these ‘guiding fixations’ are thought to provide the driver with just-in-time information to control steering in the curve (Lehtonen and others, 2014). Due to the geometry of a curve, drivers must look at more obtuse visual angles to observe locations further along the roadway, with such glances described as ‘look ahead’ fixations.
Shinar and others (1977) found that the mean fixation for drivers was straight ahead for right curves, and 3.6° to the left for left curves,[27] with only 5% of the time directed at the opposite side of the road for left curves and 24% for right curves. This was similar to the result found by Cohen and Studach (1977), they showed that when approaching and travelling through a left curve, drivers fixated on the left side of the road and to a lesser extent the middle of the road. Further, when navigating a right curve, drivers fixate on both sides and the middle of the road.
Olsen and others (1989) also examined driver fixation through left and right curved roads during day-time driving (Figure 5). They found that for left curves, the drivers’ fixation was primarily on the left and centre of the road between 100 and 300 ft (30–91 m) in front of the vehicle. With the opposite result (right and centre) for right curves.
Figure 5: Percentage of drivers’ fixation time per road region for left and right curved rural roads during daytime
Researched was conducted in a region where driving is on the right-side of the road. Directions have been reversed for Australian conditions.
Source: ATSB, based on Olson and others (1989). Driver eye fixations under different operating conditions. The University of Michigan Transportation Research Institute.
Lehtonen and others (2014) used eye-tracking methods to measure the distribution of drivers’ visual attention while negotiating a curved road. This research showed that the majority of drivers’ fixations were within 3–4° of the 2-second headway position of the vehicle. Between 65–85% of fixations during curved driving were ‘guiding fixations’ (5° either side of the 2-second headway position), while 2–28% of fixations were ‘look ahead’ fixations (more than 5° either side of the 2-second headway position). The distribution of fixations by angular eccentricity from the 2-second headway position resembled a normal distribution, such that look-ahead fixations with smaller angular eccentricity were much more common than fixations at greater visual angles.
Another study (Lehtonen and others, 2013) showed that while driving along a curved rural road, drivers typically fixated within 6° either side of the future position of the vehicle, although look-ahead fixations (more than 6° of the headway position of the vehicle) were frequent. Between 8–33% of fixations were categorised as look ahead fixations. Under higher cognitive load look-ahead fixations were shorter and directed closer to the position of the vehicle. The average look-ahead fixation was made 8.0 seconds and 112 m prior to the fixation point under lower workload conditions, and 6.9 seconds and 95 m prior under higher workload conditions.
Lehtonen, Lappi and Summala (2012) found that drivers navigating curved roads regularly glanced towards the furthest visible point on a roadway prior to an obstruction (occlusion point). These fixations on the ‘occlusion point’ were interpreted as visual anticipation of potential hazards and the upcoming road alignment. Fixations on this occlusion point were significantly less frequent for right curves27 and in conditions where the driver was under increased cognitive load. Drivers were also less likely to fixate on the occlusion point over consecutive runs, although this effect was not statistically significant.
This research was conducted in Finland (where road vehicles drive on the right side of the road and the driver sits on the left side of the vehicle). Explaining the much lower rates of occlusion point fixation for (Finnish) left curves, Lehtonen and others (2012), suggested:
The difference might be related to physical differences in the curves. The left hand curve had a smaller radius and greater inclination than the right hand curve. In the left hand curve the occlusion point was located at an angle of 25 degrees left in the beginning of the straight road section, compared to 12 degrees in the right hand curve. Inspection of video recordings suggests that in the left hand curve the occlusion point had such a high eccentricity that drivers were not able to fixate it without a head turn which might explain the smaller amount of looking time.
Notably, each of the 5 level crossing collisions on curved roads identified in the safety study occurred on right curved road (again noting that in Finland vehicle driver on the opposite side of the road). There is no known dataset which describes the number of left and right curved roads approaching level crossings in Australia.
In summary, research has found that while most fixations are focussed on the immediate future position of the vehicle on curves, drivers do engage in scanning of locations further along a curve including at locations which are eccentric in visual angle to the driver. Some of this behaviour is thought to be anticipatory searching along the most distant viewable part of the curve, to identify upcoming hazards.
The degree of the curve, however, may affect the rate at which these anticipatory glances occur. The results reported by Lehtonen and others (2014) indicate that where the occlusion point of the curve required the driver to turn their head to fixate upon it, anticipatory glances were less frequent. This may also have an adverse implication for fixation upon objects as drivers proceed along a curve (and towards an upcoming level crossing), as an object will become more obtuse to a vehicle travelling a curve until the vehicle reaches the maximum turning point.
The observation that anticipatory scanning is reduced under increased workload may have implications for heavy vehicle drivers. Case study examples suggest that driving a heavy vehicle along a curved road requires focussed attention towards vehicle handling, particularly in degraded road conditions such as uneven road surface and worn shoulders[28] or wet roads.
The implication for road vehicle drivers approaching a level crossing along a curved road approach is that they will rely on these anticipatory look-ahead fixations to identify level crossing protection equipment, as this equipment will often not fall within the normal focal point of their guiding fixations. This provides a lower opportunity for drivers to detect level crossings and advanced warning signs compared to when navigating a straight road, when the future position of the vehicle will fall within the guiding fixations. To the extent that look-ahead fixations are constrained by factors such as workload, or do not capture particularly eccentric locations on a curved road, there is an increased likelihood that level crossing protection equipment will not be detected.
It was not possible to determine to what extent roadside and pavement signage warning drivers of the presence of an upcoming level crossing affects the frequency and eccentricity of their look ahead fixations for a level crossing. Drivers may slow their vehicle or engage in more conscious scanning when they encounter such warning signs. This behaviour would reduce the risk of level crossing protection equipment not being detected.
Prior investigations and changes to Australian Standards
In July 2016, the ATSB published an investigation report into a level crossing collision between a road-train truck and a freight train, which occurred on a flashing lights-controlled level crossing with a curved road approach in Narromine, NSW. The report identified that the then-current version of AS 1742.7 (2007 version):
(did) not provide guidance for assessing stopping sight distance for active railway crossings, in particular the standard requires additional considerations for curved approaches.
Then, in March 2018, the ATSB published a report into a similar accident at Ivanhoe, NSW. This report identified that AS 1742.7 had been updated to the 2016 revision, including providing consideration to the treatment of crossings with curved road approaches. The ATSB report stated that:
In response to the ATSB findings, Standards Australia commenced a review of AS 1742.7:2016, with respect to railway crossing approaches, in particular curved approaches, and the location signage.
Standards Australia received the project proposal for a Revised Text Amendment (RTA) to AS 1742.7:2016 in early 2017. The committee met on 9 August 2017 to initiate the project and established a working group to commence drafting the RTA. It is anticipated the standard will be published in the last quarter of 2018 subject to Standards Australia standards development process. The committee reviewed a draft of the ATSB investigation report for the 11 July 2017 occurrence and concluded there was no need to carry out any further amendment for update to AS 1742.7 beyond the scope of the current revision.
In January 2019, AS 1742.7(2016) was updated. Prior to the revised text amendment, the standard included the following paragraph:
Where a crossing is located on a curve it may be necessary to adjust the orientation of the primary control device so that it is visible to approaching drivers from any point along the SSD [safe stopping distance] sight line. Some duplication of devices may be needed.
The revised text amendment replaced this paragraph with:
Where a crossing is located on a curve it may be necessary to adjust the orientation of the primary control device so that it is visible to approaching drivers from any point along the SSD sight line. It may also be necessary to repeat the control device in advance. Where a curved approach leads to an active level crossing, an RX-11 assembly may also be used to provide additional visual warning to road users.
Additional evidence from Standards Australia
In July 2023, the ATSB met with representatives from the Standards Australia technical committee responsible for AS 1742.7: 2016. The committee provided advice about how the standards should be applied in the case of curved road approaches, with observations including:
The standards are expected to be applied by trained and competent surveyors.
The inclusion of text stating that level crossing owners may use active advanced warnings is significant, since crossing owners will need to justify why they have not utilised this form of protection equipment.
The signage and pavement markings required and recommended in the standard would affect the behaviour of road drivers. For example, a road driver who is alerted to the presence of an upcoming crossing may expect and search for a crossing. This means crossing equipment located outside a primary field of view may be detected more readily.
Standards Australia provided additional analysis in September 2023, which stated:
AS 1742.7 provides sufficient information for practitioners to assess and implement appropriate traffic control devices for traffic approaching a railway level crossing, including a crossing on a curve.
It is noted that Australian Standards provide principles and minimum requirements. In practice, when assessing and installing traffic control devices at a railway level crossing, experienced practitioners are expected to consider not only the relevant Australian Standards, but also other factors and State/Territory jurisdictional guidelines to ensure the risk of a crash is reduced so far as is reasonably practicable. Engineering judgements are often required leading to a solution which may be above what Australian Standards require/specify.
Summary
Research has shown that when driving on a curved road, road vehicle drivers mainly fixate on the immediate headway position of the vehicle and rely on anticipatory look-ahead fixations to observe objects further ahead. This provides less opportunity to detect level crossing protection equipment, compared to driving on a straight road, especially on right curved roads where an advanced warning sign is located not duplicated on the right side.
Standards and guidance for designing and assessing level crossings do not identify the difference in driver sighting behaviour while navigating curved roads. The treatment of curved roads in the standards indicates that road designers and assessors must primarily consider if there is a clear line of sight through a curve. The standards do not convey that while there may be a line of sight through a curve, if this occurs through a large visual angle then there is an increased chance of drivers not sighting the level crossing.
The standards include the provision of active advanced warning on locations along a curved approach road, which would provide a mechanism of locating the crossing warnings within drivers’ central fields of view on curved roads. However, there was no guidance which indicates under what conditions the placement of advanced warning signs is necessary, and the use of these warnings is not mandatory.
This review identified that of 6 collisions which involved a heavy vehicle driver not stopping at a level crossing protected by flashing lights, 5 occurred following a right curved approach road and none of these locations had active advanced flashing light warnings. In 4 of these cases, the assessed available sighting distance was measured from a location where the sighting of the level crossing was from a large visual angle.
The ATSB considers that the absence of procedures or guidance which account for the normal sighting behaviour of drivers on curved roads for determining safety stopping distances and location of advanced warning signs reflects a condition of significant risk.
ATSB finding
The methods used in the Australian Standard AS 1742.7:2016 to calculate safe stopping distances, and determine the need and location of advanced warning signs for road approaches to level crossings, did not account for the likelihood of detecting the level crossing ahead based on the normal visual focal points of road drivers negotiating a curved road. While the standards included guidance for the use of active warning signs for curved road approaches to flashing light controlled crossings, this was not mandatory. There were 6 collisions in which driver of a heavy vehicle did not detect that level crossing flashing light signals were activated until it was too late to stop. In 5 of these collisions, the drivers approached the crossing along a right curved approach road and none of these crossings had active advance flashing light signals (Factor that increased risk, Safety issue)
Safety systems at passive controlled level crossings
Safety system theory and level crossings
This report has described the development of level crossing collisions involving heavy vehicles, including describing the actions of the heavy vehicle drivers which led to the collisions with trains.
The systems safety approach identifies that rather than being the product of individual actions and events, safety is an emergent property of a system. While individual errors and violations affect the development of adverse events, these actions and omissions typically occur in a context where they ‘made sense at the time’. The systemic approach seeks to understand the latent conditions which shaped the behaviour of individual operators and contributed to the conditions at the time of an accident.
The systemic approach also seeks to understand the redundancies available in the system, with the concept of ‘defences-in-depth’ referring to the use of multiple, overlapping risk controls to prevent catastrophic accidents. Administrative controls, such as procedural rules, provide the weakest form of protection against the likelihood and consequence of individual errors by frontline personnel. In contrast, engineering controls provide the greatest level of protection through providing a physical fail-safe barrier which prevents or reduces harm.
The safety system at passive controlled level crossings does not include any engineering controls to alert road vehicle drivers (or pedestrians) about the presence of a train. At passive control crossings, road vehicle drivers must visually search for and detect the presence of a train in order to identify when they can or cannot proceed through a crossing. As such, the design of passive controlled level crossings is primarily dependent on the actions of road vehicle driver to detect both the crossing and detect the presence of trains. If a road vehicle driver does not look for trains, or looks for trains but does not detect that one is approaching, there are limited effective recovery controls to prevent a collision from occurring. The driver may be alerted to the presence of a train by the train horn, however in many instances this is not effective (see Train horn audibility).
With no limited effective recovery controls for instances where the road user does not attend to the crossing or does not detect the presence of a train, the safety system for passive level crossings inherently relies on the road user always attending to upcoming crossings, and always detecting trains.
A human-centred approach to level crossing errors
A large subset of heavy vehicle drivers involved in level crossing collisions were aware that they were approaching or proceeding through a level crossing. The breakdown in safety predominantly occurred due to the drivers not detecting that a train was approaching a crossing. This study identified that of 26 accidents at passively controlled crossings:
In at least 20 collisions the heavy vehicle driver probably did not detect the presence of the train, or detected the train when it was too late to stop.
In at least 1 collision the heavy vehicle driver detected the train but incorrectly determined that they could transit the crossing safely.
In 1 collision the heavy vehicle driver detected the train but records indicated the truck had defective brakes and could not stop.
In 4 collisions there was not sufficient evidence to determine whether the heavy vehicle driver had detected the presence of a train.
Overall, in a large majority of the 26 collisions at passive controlled level crossings, the heavy vehicle driver unintentionally proceeded into the crossing without detecting the presence of the train. These collisions reflected unintentional slips and lapses, where the drivers unintentionally deviated from the intended course of action (to give way to trains).
Reason (1990) notes that such errors typically occur in the context of a routine, well-practiced task where behaviour is largely automatic. Attention is captured by a distraction or other demand, and the operator misses the cues to depart from the ‘normal’ routine.
Applying this conceptual framework to level crossing collisions, driver errors take place in the context of the highly-practiced task of road vehicle driving, in roadway environments where other demands and distractions are often prevalent. Road vehicle driving can become highly automatic, and many road vehicle drivers will recall the experience of arriving at a common destination without a recollection of the journey. The phenomenon of ‘highway hypnosis’ or ‘driving without attention mode’ describes the degradation of vigilance towards the roadway associated with factors including monotonous driving conditions (Karrer and colleagues, 2005). In the context of a potential level crossing collision, drivers are required to depart from the current (and often automatic) schema of continuing to drive the motor vehicle along the road, and adopt a schema of looking and preparing to stop for trains.
The task of approaching a passive control level crossing is thus consistent with the conditions described by Reason (1990) as being conducive to the development of errors involving inattention. Road vehicle drivers are vulnerable to becoming ‘captured’ by focus on other aspects of road vehicle driving, and not attend to the roadside or the rail track to detect level crossings and trains.
As described in Factors affecting heavy vehicle driver behaviour at level crossings above, there are various factors which may contribute to road vehicle drivers not looking for, or detecting the presence of, a train at a passive control level crossing. As highlighted by Edquist and others (2009), when considering the perceptual and cognitive factors inherent in the task of approaching a passive control level crossing:
Alerting the road user to the presence of a crossing is therefore unlikely to be sufficient to avoid all potential collisions. The optimal approach is to provide some form of active warning of train approach for road users at all crossings. …When there is sufficient information about the presence of a crossing, safety can still be significantly improved by providing information about the presence of a train. This information is more targeted to the needs of the road user (i.e., ‘can I safely traverse this crossing NOW?’). Information about train presence can be provided by the crossing infrastructure, or by an in-vehicle system, or from the train itself.
Safety defences at passive railway crossings do not always function as intended. In the absence of low-cost alert systems, the risk of accidents at passive crossings will continue.
The US National Transportation Safety Board (NTSB) safety study of collisions at passive control level crossings[30] made a similar conclusion, arguing that the long-term objective to reducing collisions at level crossings should be to eliminate passive control crossings.
In summary, many of the collisions and near misses identified in this study speak to the inherent variability of human performance, in the context of a system which is conducive to unintentional errors. Level crossing safety may be improved by the introduction of other risk controls to reduce the frequency of level crossing collisions or reduce their consequences.
Potential safety improvements for passive control crossings: the case for in-vehicle warning systems
Background
One proposed method for improving the safety of passive level crossings is using in-vehicle alerting technology to alert road vehicle drivers of a requirement to stop and give way to an approaching train. Such applications would reduce the safety system’s reliance on the driver to search for and detect the presence of a train, by attracting the driver’s attention and thereby providing a salient cue to the driver to stop.
In-vehicle alerting systems for level crossings have been proposed by previous investigations and reviews of level crossing collisions. Following a review of collisions at passive control level crossings, the NTSB (1998) noted:
The Safety Board concludes that in-vehicle safety advisory and warning systems and other intelligent transportation systems applications proposed have the potential to reduce accidents and injuries at passive grade crossings by alerting drivers to an oncoming train.
Reporting on an accident at a passive control level crossing, the Canadian TSB found:
the development and use of low-cost advance active warning devices to alert drivers of a train's presence may present a more effective alternative defence for passive level crossings [than ensuring there is adequate sightlines at all crossings and trains are highly conspicuous].
In the Australian context, a 2009 Parliamentary committee Level crossing safety recommended that:
the Australian Government support the ongoing research into Intelligent Transport Systems to speed the implementation of this important new technology
the Government, through the Australian Transport Council, encourage further research into the feasibility of a cut-in warning system which would warn motor vehicle drivers of on-coming trains as they approach a level crossing.
Then, in 2013, the Coronial inquest into multiple fatal level crossing collisions (including the collision at Kerang, Victoria) recommended rail operators, infrastructure managers and regulators:
… cooperate with each other to implement innovative in-vehicle warning systems as the next stage of warning road vehicles who fail to respond to existing level crossing paraphernalia that a train is approaching.
In summary, there is broad agreement among informed stakeholders both within Australia and internationally on the inherent challenges of relying on road users to attend to and detect the presence of trains at passive control crossings. Multiple stakeholders have endorsed the development of in-vehicle alerting technology for level crossings to improve the safety at passive control level crossings.
Current maturity of in-vehicle level crossing warning systems
The ATSB sought information about the development and trial of level crossing alerting technology following the recommendations made in the Coroners Court of Victoria’s Coronial Investigation of Twenty-six Rail Crossing Deaths in Victoria, Australia (2013). The Victorian Government Department of Transport and Planning advised that trials had been conducted, however the technologies were found to be unreliable. The Department further advised that the development of technology was being monitored, with a 5- to 10-year timeframe expected for a viable technology. Trials of level crossing technology cited by the Department included:
In 2013, the La Trobe University Centre for Technology Infusion reported on the development and evaluation of 5.9 GHz Dedicated Short Range Communication (DSRC) system which provided audio and visual alerts to road users approaching a crossing. Field trials were conducted in rural and urban locations, involving 124 participants over 4.5 months. The trials included variants where trains and vehicles communicated directly, and variants where the vehicles communicated through a roadside unit intermediary. The results of the field trials showed that connectivity between vehicles was dependent on there being a clear line of sight between receiving units, and that the system provided much less connectivity range when no roadside unit was deployed.
The Collaborative Research Centre for Rail Innovation (2014) reported on a separate trial of the La Trobe University DRSC system. This report noted that ‘drivers experienced a high number of hardware issues with the Latrobe system: display falling off, warning messages when no train was approaching. Further, participants had to start the system manually every time they started driving, which was found annoying. All of this resulted in a low usage of the system during the trial’.
A review of international research into level crossing warning systems identified the US Federal Railroad Administration Rail-Crossing Violation Warning (RCVW) project (Withers and Utterback, 2021). This RCVW detects the status of active control level crossings. This system would produce in-vehicle messages for all vehicles approaching an active crossing of the requirement to stop (inform message), and an alert if the vehicle is not predicted to stop based on its speed (warning message). Field testing has shown that system provided a reliable warning system for active control level crossings, using currently available technology. Notably, this technology does not detect whether a train is approaching the crossing (relying on existing active crossing equipment), and thus does not provide a solution for passive controlled crossings.
In summary, there is no known research which has demonstrated a proof-of-concept for a system for providing alerts to road vehicle users when approaching level crossings. Research conducted at Australian level crossings indicated that the available technology was not reliable. Given this research is a decade old, additional research is now required to determine whether technological advancement will now provide a useable platform for providing warnings to drivers approaching level crossings.
Human factors considerations for in-vehicle level crossing warning systems
In addition to the absence of mature technology for providing in-vehicle level crossing warnings, there are potentially significant implications for how such warnings would affect the behaviour of road vehicle drivers at level crossings. The phenomenon of behavioural adaptation has been observed in response to other changes to the road traffic system, where there is an observed aggregate change in the behaviour of road users following system changes, often resulting in the estimated benefits of the changes to be under-achieved. For example, research has identified that drivers presented with adaptive cruise control attended more frequently to a secondary task and had lower reaction times (Rudin-Brown and Parker, 2004). Similar results have also been observed in studies of adaptation to forward collision warning systems (Reinmueller and others, 2010).
In the case of in-vehicle level crossing warnings, it is possible that road vehicle drivers may adapt to the presence of the warnings, and that this may affect their attention to traditional level crossing control equipment (Wullems and others, 2014).
Simulator research showed that participants who drove a vehicle equipped with an in-vehicle alerting system were less likely to comply with level crossing rules when there were no trains present. Drivers also approached the crossings at faster speeds and glanced less frequently at the rail track (Larue and others 2015). These changes were only observed when the driver was presented with a visual warning, and driving behaviour improved when an aural warning was presented.
As identified by Wullems and others (2014), the potential for over-reliance on in-vehicle warnings and changes to driving behaviour at level crossings presents potential hazards, unless the systems are perfectly reliable. Any failure of the system would produce a potentially very hazardous system state, particularly if the road user does not identify the failure.
It may also be hazardous to incrementally introduce the equipment necessary to provide in-vehicle warnings. If road vehicle drivers were to come to expect in-vehicle warnings for potential level crossing collisions, then level crossings and/or trains which were not equipped with the equipment required to produce these warnings would potentially become less safe than they are currently.
Other barriers to the implementation of in-vehicle level crossing warning systems
Any foreseeable system for providing in-vehicle level crossing warnings requires road vehicles be equipped with devices for receiving and displaying warnings, and the potential benefit of any warning system would depend on the installation uptake of such equipment. Considering the size of the road vehicle fleet (over 20 million road vehicles were registered in Australia in 2022), this could be a complex and costly exercise, requiring the co-ordination of stakeholders outside the rail industry. However, with advancements in navigation systems in many on-road vehicles today that allow for software updates, this is likely to be less complex in the future.
A final barrier to the implementation of in-vehicle level crossing warning systems relates to the ownership of risk at level crossings, and how responsibility for in-vehicle warnings could be managed. The existing regime for level crossing safety includes shared responsibility between rail and road infrastructure managers (as reflected in level crossing interface agreements), and with railway operators and road vehicle drivers for complying with relevant rules and procedures. Wullems and others (2014) identified that the introduction of in-vehicle level crossing warning systems would pose unresolved questions relating to where responsibility lies for ensuring that warnings are produced by rail vehicles and/or infrastructure, and being received by road vehicles. The ongoing monitoring, management and maintenance of such a system may require significant cost for rail industry organisations.
Wullems and others (2014) further identified that failures in the system which led to collision may produce a liability for rail operators or infrastructure managers, whereas in the existing regime these stakeholders can discharge their responsibility by providing compliant level crossing infrastructure and operating rollingstock correctly.
Whereas the use of in-vehicle warnings has been mooted as a low-cost method for improving safety at passive control crossings, there are significant changes required to implement such technology which may involve significant cost. The size of these costs is unknown, and will need to be more precisely understood to evaluate the safety case of potential alerting technologies, should fit-for-purpose technologies emerge.
ATSB Finding
Of 26 collisions at passive control level crossings, a large majority involved the heavy vehicle driver not detecting the presence of the train. These crossings rely on the road vehicle driver detecting the presence of a train and identifying a requirement to stop and give way, and are susceptible to situations where motorists do not look for, or detect, the presence of a train. There are limited effective recovery controls to prevent a collision when this occurs (Factor that increased risk).
Discussion
Study limitations
This study reviewed level crossing collisions involving heavy road vehicles, to understand their characteristics and trends, and in turn to identify risk factors and opportunities for safety action. This study did not review the characteristics and trends of heavy vehicle movements across level crossings which did not result in a collision. This limited the inferential capability of the study, such that it was not possible to quantify how specific characteristics of the vehicles, crossings, or other variables identified in the study contributed to the development of collisions.
Similarly, the study did not conduct an in-depth review of the characteristics and trends of level crossing collisions involving other road vehicles. As such, it was not possible to quantify how the different characteristics of heavy vehicles, or the different road and crossing conditions they may be exposed to, contributed to the observed differences in collision frequency and consequence. A richer dataset for all level crossing collisions would support such analysis.
Another limiting feature of this study was that the information used to understand the characteristics of level crossing collisions involving heavy vehicles was primarily drawn from investigation reports produced by rollingstock and infrastructure managers, and from police reports. These reports were produced in the context of the operator and infrastructure managers’ specific interests and/or legal requirements, and not with a view to support broader analysis such as this.
The data used in this study was obtained from sources that included either live databases where the data can be updated through additional data gathering or data cleaning exercises. For one level crossing accident reviewed in this study, the source material included an Office of the Chief Investigator investigation that was ongoing at the time the study was published.
The ATSB did not conduct any site inspections or audits against relevant standards of the level crossings involved in the occurrences in this safety study. Previous ATSB investigations of level crossing collisions have included site inspections and other analyses of the crossings, and the safety study utilised records from these observations. Otherwise, the safety study relied on observations of level faults or deficiencies recorded in rail infrastructure manager reports and other documents.
Information about the factors which affected the performance of heavy vehicle drivers was infrequently reported in operator and police reports. In most instances, these reports only identified that the road vehicle driver failed to give way, and these records rarely assessed human factors causes which could explain the drivers' errors.
In contrast with operator and police reports, investigations conducted by the ATSB seek to understand the operation of the overall safety system, and to identify opportunities to improve that system. The objective is not to attribute blame or liability. The ATSB also has strict limitations on how information collected from involved parties can be used outside of the no-blame investigation process, which probably increases the likelihood of obtaining evidence such as statements from heavy vehicle drivers.
The independent no-blame investigations conducted by the ATSB were much more likely to provide sufficient information to describe the actions of the heavy vehicle drivers, and to provide information which explained these actions. As shown in Table 17, the proportion of collisions where the ATSB was unable to code key details about the heavy vehicle driver’s actions or the factors associated with those actions was much greater for collisions not investigated by the ATSB.
Table 17: Counts of collisions where road vehicle driver actions and related variables could not be coded due to missing information
Variable
Unable to code variable, investigated by ATSB (n=10)
Unable to code variable, not investigated by ATSB (n=39)
Driver action
0
1 (2.4%)
Driver detected crossing
1 (10%)
7 (17.9%)
Driver slowed for passive control crossing
0
5 (12.2%)
Driver detected train
0
13 (31.7%)
Driver familiarity with crossing
1 (10%)
31 (79.5%)
Driver restricted vision of train/crossing
1 (10%)
18 (46.2%)
There are some important caveats in drawing conclusions based on these differences. Most importantly, the collisions not investigated by the ATSB were different events, and may not have involved the factors identified in the collisions investigated by the ATSB. Also, the ATSB typically allocates more time and resources to conducting an investigation than a rail organisation would, and it is difficult to distinguish the effects of this resourcing with the benefits of conducting no-blame investigations.
Nonetheless, the ATSB considered that the information obtained in this study demonstrated that meaningful understanding of why heavy vehicle drivers enter level crossings contrary to the road rules was typically only available following an independent no-blame investigation. As these actions represent the fundamental breakdown of safety at level crossings, this supports the benefit of regularly investigating significant collisions at level crossings.
ATSB Finding
Information which supports an understanding of the factors associated with heavy vehicle drivers entering a level crossing without giving way to trains is typically only available when an independent no-blame transport safety investigation is conducted (General finding)
Overall observations as to heavy vehicle level crossing risk
The information reviewed in this safety study indicated that heavy vehicles pose a greater risk at level crossings than light vehicles, as a function of greater accident consequence for rail users. The collisions involving heavy vehicles resulting in more significant consequences was consistent with the observations of previous research, and can be easily understood as a simple reflection of the increase in physical forces imparted on a rail vehicle as the mass of the road vehicle involved in a collision increases (for a fixed speed).
Also consistent with previous analyses, this study identified that heavy vehicles are more likely to be involved in level crossing collisions, compared to light vehicles, per road distance travelled. The increase in level crossing collision frequency for heavy vehicles may be partially explained by a greater exposure to level crossings, and in particular greater exposure to level crossings with lower levels of protection (especially in rural areas). The study was unable to test the extent to which different exposure to level crossing hazards explained the difference in collision rates.
Nonetheless, the over-representation of heavy vehicles in level crossing collisions is likely to be due, in some part, to the fundamental physical property of heavy vehicles: that they are larger and take longer to stop prior to a crossing, and clear a crossing, as a function of both time and distance. Although the design of level crossings seeks to accommodate the stopping limitations of heavy vehicles (see Appendix B), it is inevitable that a heavier vehicle will be less likely to stop within a specific distance and time, all other factors being equal. Stated alternatively, all safety improvements at level crossings seek to increase the margins available for a road vehicle to stop and give way to trains, and any improvements which increase the ability of heavy vehicles to stop at level crossings will have a greater benefit to smaller vehicles whose braking capabilities are generally greater. As such, it is likely that heavy vehicles will continue to be over-represented in level crossing collisions.
The characteristics of heavy vehicle driving may also represent systemic risk factors which partially account for the over-representation of heavy vehicles in level crossing collisions. Plausible mechanisms for such systemic effects include:
The handling characteristics of heavy vehicles may contribute to a greater tendency of heavy vehicle drivers to engage in ‘rolling-stop’ violations at level crossings, compared to the drivers of other road vehicles.
The louder operating noises produced by heavy vehicle engines and heavier cab construction may result in heavy vehicle drivers being less likely to hear train horns, compared to the occupants of other road vehicles.
The construction of heavy vehicle cabs may also provide more visual obstructions, making it more difficult for heavy vehicle drivers to detect trains and level crossing equipment.
The nature of heavy vehicle driving is often one of repeated journeys along the same route. This familiarity can contribute to the expectancy that level crossings along the route will not be occupied by trains.
As identified in Study limitations, this study did not include data from heavy vehicle movements across level crossings that did not result in a level crossing collision, and did not conduct a thorough review of collisions involving non-heavy road vehicles. Due to this, it was not possible to accurately determine the characteristics of heavy vehicles that contributed to the greater frequency of level crossing collisions (per road distance travelled).
Overall observations as to level crossing collision characteristics
Of the 49 level crossing collisions involving heavy vehicles, at least 7 were partially attributable to problems with the design or maintenance of the level crossings. Generally, however, the collisions reviewed in this study occurred at level crossings designed according to the required standards. Also, there were no collisions attributed to the crossing providing insufficient sighting for a stopped heavy vehicle to start up and clear the crossing prior to a train arriving.
However, the study identified one systemic problem with the design criteria for level crossings. The methods used to calculate safe stopping distances for road approaches to level crossings did not account for the effect on sighting a level crossing from the normal focal points of drivers negotiating a curved road. While this problem did not only relate to heavy vehicles for the design of level crossings, heavy vehicle drivers are likely to be particularly affected in situations where insufficient sighting distance is provided.
The majority of level crossing collisions arose from heavy vehicle drivers entering the level crossings following some form of unintentional error or omission. Even in the case where heavy vehicle drivers deliberately engaged in actions contrary to the road rules, the intention was to proceed through the crossing prior to the arrival of a train. The collisions were primarily caused by level crossing warnings or the presence of trains not being detected, being detected late, or being perceived incorrectly. This form of omission or misperception can also affect other road users, and the forms and causes of errors observed in heavy vehicle drivers were consistent with the errors made by the drivers of other road vehicles, both at level crossings and in other areas of the road network.
As described in A human-centred approach to level crossing errors, many of the errors and omissions which lead to level crossing accidents reflect the inherent variability of human performance. While the level crossing safety system continues to heavily rely on road vehicle drivers adhering to the administrative controls of road rules and other procedures to prevent collisions between vehicles and trains, it is a certainty that from time to time, this will not occur and so collisions will continue to occur. However, the use of engineering controls which alert road users to a requirement to stop will almost certainly provide an enhanced level of safety at level crossings, by reducing the reliance on road users to attend to and detect the presence of trains.
Findings
ATSB investigation report findings focus on safety factors (that is, events and conditions that increase risk). In safety studies, these are referred to as ‘factors that increase risk’. In addition ‘other findings’ may be included to provide important information about topics other than safety factors.
Safety issues are highlighted in bold to emphasise their importance. A safety issue is a safety factor that (a) can reasonably be regarded as having the potential to adversely affect the safety of future operations, and (b) is a characteristic of an organisation or a system, rather than a characteristic of a specific individual, or characteristic of an operating environment at a specific point in time.
These findings should not be read as apportioning blame or liability to any particular organisation or individual.
From the evidence available, the following findings are made with respect to the review of level crossing collisions between trains and heavy road vehicles.
Factors that increased risk
Of the 49 level crossing collisions involving heavy vehicles, at least 7 partially involved problems with the design or maintenance of the level crossings. Concerning compliance with applicable design standards, no significant issues were identified with the design or maintenance of most crossings.
Level crossing collisions between trains and heavy vehicles were associated with greater levels of rail injuries and rail damage than collisions involving light vehicles.
Heavy vehicles are involved in level crossing accidents at a greater rate per road kilometre travelled than light vehicles.
Although level crossing collisions between heavy vehicles and trains were more likely to involve the train striking the heavy vehicle, accidents where the heavy vehicle struck the train were more likely to cause a derailment.
All level crossing collisions involving heavy vehicles resulted from the heavy vehicle driver not giving way to trains. There were three actions associated with the collisions:
There were at least 24 accidents where the heavy vehicle did not stop prior to entering the crossing.
There were at least 11 accidents where the heavy vehicle stopped at the crossing then proceeded into the path of a train.
There were at least 13 accidents where the heavy vehicle entered a level crossing and stopped foul of the train line.
In at least 14 collisions it is likely that the heavy vehicle driver intentionally entered the level crossing in a manner which was contrary to road rules. These included 6 collisions where the driver intentionally entered the crossing without being able to drive clear of the crossing, 4 collisions where the driver engaged in a 'rolling stop' while approaching a Stop sign level crossing, 3 collisions where the driver remained stopped foul of the crossing while there was no obstacle preventing them from exiting, and one collision where the driver did not stop or look for trains at a Stop sign crossing.
Of 26 collisions at passive control crossings, there were at least 12 accidents where the heavy vehicle driver slowed or stopped but probably did not detect the train, and entered the crossing into the path of the approaching train.
There were at least 12 level crossing collisions where the driver of the heavy vehicle had regularly used the level crossing prior to the collision with a train. This included 6 accidents where the heavy vehicle driver proceeded into a passive control crossing without identifying the presence of a train, and 5 accidents where the heavy vehicle driver did not identify activated flashing level crossing lights. The drivers' previous experience at the level crossings likely led to a low expectancy for trains and, in at least some collisions, contributed to them not detecting a requirement to stop and give way.
Of the 49 level crossing collisions involving heavy vehicles, there were at least 14 collisions where the heavy vehicle driver’s view was obstructed by vegetation, the design of the heavy vehicle cab, poor crossing lighting, or sun glare.
Previous research and reviews have identified that train horns have limited effectiveness for alerting road vehicle drivers to the presence of trains. Consistent with this, in at least 25 collisions, the horn was not effective at alerting the heavy vehicle driver to the presence of the train.
The methods used in the Australian Standard AS 1742.7:2016 to calculate safe stopping distances, and determine the need and location of advanced warning signs for road approaches to level crossings, did not account for the likelihood of detecting the level crossing ahead based on the normal visual focal points of road drivers negotiating a curved road. While the standards included guidance for the use of active warning signs for curved road approaches to flashing light controlled crossings, this was not mandatory. There were 6 collisions in which driver of a heavy vehicle did not detect that level crossing flashing light signals were activated until it was too late to stop. In 5 of these collisions, the drivers approached the crossing along a right curved approach road and none of these crossings had active advance flashing light signals(Safety issue).
Of 26 collisions at passive control level crossings, a large majority involved the heavy vehicle driver not detecting the presence of the train. These crossings rely on the road vehicle driver detecting the presence of a train and identifying a requirement to stop and give way, and are susceptible to situations where motorists do not look for, or detect, the presence of a train. There are limited effective recovery controls to prevent a collision when this occurs.
Other findings
Information which supports an understanding of the factors associated with heavy vehicle drivers entering a level crossing without giving way to trains is typically only available when an independent no-blame transport safety investigation is conducted.
The annual number of level crossing collisions between road vehicles and trains remained relatively constant between July 2014 and June 2022.
Prior to July 2022, the national rail safety database did not include sufficient information to enable detailed analysis of level crossing collision characteristics.
Safety issues and actions
Central to the ATSB’s investigation of transport safety matters is the early identification of safety issues. The ATSB expects relevant organisations will address all safety issues an investigation identifies.
Depending on the level of risk of a safety issue, the extent of corrective action taken by the relevant organisation(s), or the desirability of directing a broad safety message to the rail industry, the ATSB may issue a formal safety recommendation or safety advisory notice as part of the final report.
All of the directly involved parties were provided with a draft report and invited to provide submissions. As part of that process, each organisation was asked to communicate what safety actions, if any, they had carried out or were planning to carry out in relation to each safety issue relevant to their organisation.
Descriptions of each safety issue, and any associated safety recommendations, are detailed below. Click the link to read the full safety issue description, including the issue status and any safety action/s taken. Safety issues and actions are updated on this website when safety issue owners provide further information concerning the implementation of safety action.
Standards and guidance for placement of crossing equipment on curved road approaches
Safety issue description: The methods used in the Australian Standard AS 1742.7:2016 to calculate safe stopping distances, and determine the need and location of advanced warning signs for road approaches to level crossings, did not account for the likelihood of detecting the level crossing ahead based on the normal visual focal points of road drivers negotiating a curved road. While the standards included guidance for the use of active warning signs for curved road approaches to flashing light controlled crossings, this was not mandatory. There were 6 collisions in which driver of a heavy vehicle did not detect that level crossing flashing light signals were activated until it was too late to stop. In 5 of these collisions, the drivers approached the crossing along a right curved approach road and none of these crossings had active advance flashing light signals.
Sources and submissions
Sources of information
The sources of information during the investigation included the:
Office of the National Rail Safety Regulator
Rail operators
Rail infrastructure managers
Australian Level Crossing Assessment Model Committee
Federal Railroad Administration
Rail Industry Safety and Standards Board
New South Wales Police
South Australia Police
Victoria Police
Queensland Police Service
National Heavy Vehicle Regulator
References
Abraham, J., Datta, T. K., & Datta, S. (1998). Driver behavior at rail-highway crossings. Transportation Research Record, 1648(1), 28-34.
Australian Centre for Rail Innovation (2022). Freight train visibility review.
Australian Transport Safety Bureau (2002). Monograph 10: Level Crossing Accidents. Canberra.
Austroads (2010). Measures for Managing Safety of Heavy Vehicles at Passive and Active Railway Level Crossings
Austroads (2017). Improved Railway Road Design for Heavy Vehicles
Beanland, V., Salmon, P. M., Filtness, A. J., Lenné, M. G., & Stanton, N. A. (2017). To stop or not to stop: Contrasting compliant and non-compliant driver behaviour at rural rail level crossings. Accident Analysis and Prevention, 108C, 209-219. doi: 10.1016/j.aap.2017.09.004
Blower, D. F. (2007). Truck mirrors, fields of view, and serious truck crashes. University of Michigan, Ann Arbor, Transportation Research Institute.
Caird, J. K. (2002). Human factors analysis of highway-railway grade crossing accidents in Canada.
Carrasco, M., Evert, D. L., Chang, I., & Katz, S. M. (1995). The eccentricity effect: Target eccentricity affects performance on conjunction searches. Perception & psychophysics, 57, 1241-1261.
Carroll, A. A., Multer, J., & Markos, S. H. (1995). Safety of highway-railroad grade crossings: use of auxiliary external alerting devices to improve locomotive conspicuity (No. DOT-VNTSC-FRA-95-10). United States. Federal Railroad Administration. Office of Research and Development.
Casali, J. G., Robinson, G. S., & Lee, S. E. (2002). Masked thresholds and predicting the audibility of auditory displays: An example for long-haul trucks. In Proceedings of the Human Factors and Ergonomics Society Annual Meeting (Vol. 46, No. 19, pp. 1697-1701).
Chadwick, S. (2017). Quantitative analyses of train derailment probability at highway-rail grade crossings.
Chadwick, S. G., Saat, M. R., & Barkan, C. P. (2012). Analysis of factors affecting train derailments at highway-rail grade crossings. In Proceedings of the Transportation Research Board 91st Annual Meeting.
Cherchas, D. B., English, G. W., Ritchie, N., McIlveen, E. R., & Schwier, C. (1982). Prediction of the probability of rail vehicle derailment during grade crossing collisions.
Cohen, A. S., Studach, H. (1977). Eye movements while driving cars around curves. Perceptual and Motor Skills, 44, 683-389.
Coroner’s Court of Victoria. (2013). Coronial Investigation of Twenty-six Rail Crossing Deaths in Victoria, Australia
Dolan, T. G., & Rainey, J. E. (2005). Audibility of train horns in passenger vehicles. Human factors, 47(3), 613-629.
Eck, R. W. (2002). A context-sensitive approach to improving safety at passive crossings. In international symposium on railroad-highway grade crossing research and safety, 7th, 2002, Melbourne, Victoria, Australia.
Edquist, J., Stephan, K., Wigglesworth, E., & Lenne, M. (2009). A literature review of human factors safety issues at Australian level crossings.
Federal Railroad Administration (1995). Nationwide Study of Train Whistle Bans. U.S. Department of Transportation, Federal Railroad Administration, Office of Safety: Washington, D.C.
Federal Railroad Administration. (2000). Updated Analysis of Train Whistle Bans. U.S. Department of Transportation, Federal Railroad Administration, Office of Safety: Washington, D.C.
Gou, M., & Bellavigna-Ladoux, O.(2003). Impact of heavy vehicles on crossing safety – Development of an adapted design tool. Transport Canada.
Hellman, A. D., & Poirier, P. J. (2019). Highway-Rail Intersection Crash Taxonomy for Connected Vehicle Safety Research: 2008–2017–Ten Year Trend (No. DOT/FRA/ORD-19/25). United States. Department of Transportation. Federal Railroad Administration. Office of Research, Development, and Technology.
House of Representatives Standing Committee on Infrastructure, Transport, Regional Development and Local Government. (2009). Level crossing safety. Australian Government, Canberra.
Independent Transport Safety Regulator. (2011). Transport Safety Bulletin: Level crossing accidents in Australia. New South Wales Government.
Karrer, Briest, Vohringer-Khunt, Baumgarten and Schleicher (2005). ‘Driving without awareness’ in Underwood (ed) Traffic and Transport Psychology: Theory and Application.
Kassa, E., Wan, I., & White, J. (2023). Assessment of Trials to Improve Train Conspicuousness Approaching Passive Level Crossings, Report No: Monash/RT/2023/1742, Monash Institute of Railway Technology.
Larue, G.S., Filtness, A.J., Wood, J.M., Demmel, S., Watling, C.N., Naweed, A. and Rakotonirainy, A., (2018). Is it safe to cross? Identification of trains and their approach speed at level crossings. Safety science, 103, pp.33-42.
Larue, G., Kim, I., Rakotonirainy, A., Haworth, N., Fereira, L. Driver’s behavioural changes with new intelligent transport system interventions at railway level crossings - A driving simulator study. Accident Analysis and Prevention, 81, pp. 74-85.
Lehtonen, E., Lappi, O., Kotkanen, H., & Summala, H. (2013). Look-ahead fixations in curve driving. Ergonomics, 56(1), 34-44.
Lehtonen, E., Lappi, O., Koirikivi, I., & Summala, H. (2014). Effect of driving experience on anticipatory look-ahead fixations in real curve driving. Accident Analysis & Prevention, 70, 195-208.
Lehtonen, E., Lappi, O., & Summala, H. (2012). Anticipatory eye movements when approaching a curve on a rural road depend on working memory load. Transportation research part F: traffic psychology and behaviour, 15(3), 369-377.
Mok, S. C., & Savage, I. (2005). Why Has Safety Improved at Rail‐Highway Grade Crossings?. Risk Analysis: An International Journal, 25(4), 867-881.
Ngamdung and da Silva. (2012). Driver Behaviour Analysis at Highway-Rail Grade Crossings using Field Operational Test Data – Heavy Trucks. US Department of Transportation, Federal Railroad Administration.
Niewoehner, W., & Berg, F. A. (2005). Endangerment of pedestrians and bicyclists at intersections by right turning trucks. Statistics, 1-15.
Olsen, P. L., Battle, D. S., Aoki, T. (1989). Driver eye fixations under different operating conditions. The University of Michigan Transportation Research Institute.
Organisation for Economic Cooperation and Development. (2021). Road Safety Report 2021 – Australia. Presented at the International Transport Forum.
Parnell, K. J., Stanton, N. A., & Plant, K. L. (2016). Exploring the mechanisms of distraction from in-vehicle technology: The development of the PARRC model. Safety science, 87, 25-37.
Proctor, R.W. and Proctor, J.D. (2021). Sensation and perception. In Handbook of Human Factors and Ergonomics (eds G. Salvendy and W. Karwowski).
Rapoza, A. S., & Raslear, T. G. (2001). Analysis of railroad horn detectability. Transportation research record, 1756(1), 57-62.
Read, Beanland, Lenne, Stanton, Salmon, Mulvihill, Walker and Cornellison (2017). A systems analysis of rail level crossings. In Integrating Human Factors Methods and Systems Thinking for Transport Analysis and Design. CRC press.
Reason, J. (1990). Human error. Cambridge university press.
Reason, J. (1995). Understanding adverse events: human factors. BMJ Quality & Safety, 4(2), 80-89.
Reinmueller, K., Kiesel, A., & Steinhauser, M. (2020). Adverse behavioral adaptation to adaptive forward collision warning systems: An investigation of primary and secondary task performance. Accident analysis & prevention, 146, 105718.
Rudin-Brown, C. M., & Parker, H. A. (2004). Behavioural adaptation to adaptive cruise control (ACC): implications for preventive strategies. Transportation Research Part F: Traffic Psychology and Behaviour, 7(2), 59-76.
Rudin-Brown, C. M., George, M. F. S., & Stuart, J. J. (2014). Human factors issues of accidents at passively controlled rural level crossings. Transportation research record, 2458(1), 96-103.
Sanders, M. S., McCormick, E. J. (1993). Human factors in engineering and design. United States: McGraw-Hill.
Salmon, P. M., Read, G. J., Stanton, N. A., & Lenné, M. G. (2013). The crash at Kerang: Investigating systemic and psychological factors leading to unintentional non-compliance at rail level crossings. Accident Analysis & Prevention, 50, 1278-1288.
Shinar, D., McDowell, E. D., Rockwell, T. H. (1977). Eye movements in cure negotiation. Human Factors, 19(1), 63-71.
Sun, D., El-Basyouny, K., & Kwon, T. J. (2018). Sun glare: network characterization and safety effects. Transportation research record, 2672(16), 79-92.
Transportation Safety Board of Canada (2015). Railway Investigation Report R13T0192, Crossing collision involving passenger train and double decker bus on 18 September 2013.
Underwood, G. (2007). Visual attention and the transition from novice to advanced driver. Ergonomics, 50(8), 1235-1249.
Wickens CD, Hollands JG, Banbury S & Parasuraman R. (2013), Engineering psychology and human performance, 4th edition, Pearson Boston, MA.
Withers, J., & Utterback, J. (2021). Rail Crossing Violation Warning Application-Phase II [Research Results] (No. RR 21-12). United States. Department of Transportation. Federal Railroad Administration.
Witte, K., & Donohue, W. A. (2000). Preventing vehicle crashes with trains at grade crossings: the risk seeker challenge. Accident Analysis & Prevention, 32(1), 127-139.
Wolfe, B., Sawyer, B. D., Kosovicheva, A., Reimer, B., & Rosenholtz, R. (2019). Detection of brake lights while distracted: Separating peripheral vision from cognitive load. Attention, Perception, & Psychophysics, 81, 2798-2813.
Wolfe, B., Dobres, J., Rosenholtz, R., & Reimer, B. (2017). More than the Useful Field: Considering peripheral vision in driving. Applied ergonomics, 65, 316-325.
Wullems, C., Wayth, R., Galea, V., & Nelson-Furnell, P. (2014). In-vehicle railway level crossing warning systems: can Intelligent Transport Systems deliver?. In Proceedings of the 2014 Conference on Railway Excellence: Rail Transport for Vital Economy (pp. 1-12). Railway Technical Society of Australasia (RTSA).
Yeh, M., & Multer, J. (2008). Driver behavior at highway-railroad grade crossings: A literature review from 1990-2006. Report published by the Federal Railroad Administration.
Young, K., Regan, M. and Hammer, M., 2007. Driver distraction: A review of the literature. Distracted driving, 2007, pp.379-405.
Submissions
Under section 26 of the Transport Safety Investigation Act 2003, the ATSB may provide a draft report, on a confidential basis, to any person whom the ATSB considers appropriate. That section allows a person receiving a draft report to make submissions to the ATSB about the draft report.
A draft of this report was provided to the following directly involved parties:
Office of the National Rail Safety Regulator
Australian Standards technical committee MS-012
Australian Level Crossing Assessment Model committee
Austroads
Rail Industry Safety and Standards Board
The submissions were reviewed and, where considered appropriate, the text of the report was amended accordingly.
Glossary
Active protection level crossing
Uses either flashing lights and/or booms gates to warn motorists that a train is approaching the level crossing
ALCAM
Australian Level Crossing Assessment Model
AS 1742.7:2016
Australian Standard AS 1742.7:2016, Manual of uniform traffic control devices. Part 7: Railway crossings
AS 7531:2015
Australian Standard AS 7531:2015 Light and Visibility
AS 7532:2016
Australian Standard AS 7532:2016 Railway Rolling Stock Audible Warning Devices
AS 7658:2020
Australian Standard AS 7658:2020 Level Crossing: Rail Industry Requirements
ACRI
Australian Centre for Rail Innovation
BITRE
Bureau of Infrastructure and Transport Research Economics
B-double combination trucks
Heavy vehicle combination consisting of a prime mover towing 2 semi-trailers with the first semi-trailer attached directly to the prime mover and the second semi-trailer attached to the first semi-trailer
FRA
US Federal Railroad Administration
Heavy vehicle
Road vehicle with a gross vehicle mass or aggregate trailer mass greater than 4.5 tonnes, includes: semi-trailer; road trains; buses and b-double combination trucks
HRA
Highway-Rail Grade Crossing Accident
ITSR
Independent Transport Safety Regulator
NTSB
US National Transportation Safety Board
ONRSR
Office of the National Rail Safety Regulator
Passive protection level crossing
Uses signs (stop or give way) to warn motorists of a level crossing
RCVW
US Federal Railroad Administration Rail-Crossing Violation Warning
REA
Rail Equipment Accident/Incident
RISSB
Rail Industry Safety Standards Board
Rolling stop
Road vehicle driver approaches an intersection, slow the vehicles before proceeding through the intersection without coming to a complete stop
Appendix B – Summary of sighting distance provisions in Australian Standard AS1742.7:2016
The design criteria for level crossings in Australia are specified the Australian Standard AS 1742.7:2016, Manual of uniform traffic control devices. Part 7: Railway crossings. This standard prescribes the sighting distances required for drivers approaching a level crossing, to enable them to safely identify if it is safe to enter and proceed through a crossing.
The standard seeks to ensure that the driver of a design vehicle will have sufficient time and distance to identify a crossing ahead (S1) and stop after identifying a requirement to stop. In the case of active control crossings, this would be the detection of flashing lights and/or a lowered boom gate, whereas in the case of a Stop sign controlled crossing, this would be the presence of the Stop sign.
The standard also specifies the minimum distance for a driver to approach the crossing, look along the rail line to check for trains, and then continue and cross safely ahead of any undetected trains (S2). This is applicable in the case of Give way controlled crossings, where the driver is not required to stop unless a train is detected.
For vehicles stopped at a level crossing, the standard specifies the distance required to be visible along the track from the ‘stop line’. The distance (S3) is required to be sufficient for the vehicle to start up and clear the crossing prior to the arrival of any train beyond the visible distance.
These distances are illustrated in Figure 6.
Figure 6: Illustration of level crossing sighting distances specified by AS 1742.7:2016
These are expressed in the standards as
These formulae contain variables relevant to the physical characteristics of heavy vehicles. Specifically:
- d is the coefficient of deceleration
- BTis the expected brake delay (in seconds)
- L is the length of the design vehicle (in metres)
- a is the average acceleration of the design vehicle in starting gear (in metres per second squared)
- J is the sum of the perception time and time to depress clutch (in seconds)
- Gs is a grade correction factor
- VVis the 85th percentile road vehicle speed in the vicinity of the crossing
- VT is the speed of the train approaching the crossing (km/h)
- Z (L indicates left direction) is the angle between the road and the railway at the crossing (in degrees)
- CV is the clearance from the vehicle stop or give way line to the nearest rail line (generally 3.5m)
- SC is the unsealed road correction factor (1.2 for compacted gravel, 1.0 for sealed roads)
- RT is the total perception reaction time in seconds (generally assumed to be 2.5s)
In the case of heavy vehicles, AS 1742.7 specifies values for design vehicles for defined categories of heavy vehicles, with greater vehicle length, slower braking and acceleration, and longer reaction times expected for heavier vehicles.[31] The effect of this is that for crossings expected to carry heavy vehicles, AS 1742.7 requires longer sighting distances are provided.
The ATSB modelled the distances required by AS 1742.7 using a standard case of a crossing on a flat, sealed road, where the road speed was 100 km/h,[32] the track speed was 110 km/h and the road to track angle was 90°. The calculated stopping distances for different types of heavy vehicles are shown in Table 18.
Table 18: AS1742.7 calculated stopping distances for heavy vehicle types
Vehicle type
Length (m)
GCM (t)
S1(m)
S2(m)
S3(m)
Level 1 – Semi trailer
20.0
50
276
305
408
Level 2a – B-double
26.0
69
271
305
490
Level 2b – Pocket road train
30.0
85
286
324
532
Level 3a – Double road train
36.5
91.5
263
308
585
Level 3b – B-triple
42.0
91.5
283
333
613
Level 4a – AAB Quad
53.5
143
296
358
757
Level 4b – AAB Quad
60.0
150
333
401
803
Purpose of safety investigations
The objective of a safety investigation is to enhance transport safety. This is done through:
identifying safety issues and facilitating safety action to address those issues
providing information about occurrences and their associated safety factors to facilitate learning within the transport industry.
It is not a function of the ATSB to apportion blame or provide a means for determining liability. At the same time, an investigation report must include factual material of sufficient weight to support the analysis and findings. At all times the ATSB endeavours to balance the use of material that could imply adverse comment with the need to properly explain what happened, and why, in a fair and unbiased manner. The ATSB does not investigate for the purpose of taking administrative, regulatory or criminal action.
Terminology
An explanation of terminology used in ATSB investigation reports is available here. This includes terms such as occurrence, contributing factor, other factor that increased risk, and safety issue.
Publishing information
Released in accordance with section 25 of the Transport Safety Investigation Act 2003
Ownership of intellectual property rights in this publication
Unless otherwise noted, copyright (and any other intellectual property rights, if any) in this report publication is owned by the Commonwealth of Australia.
Creative Commons licence
With the exception of the Coat of Arms, ATSB logo, and photos and graphics in which a third party holds copyright, this publication is licensed under a Creative Commons Attribution 3.0 Australia licence.
Creative Commons Attribution 3.0 Australia Licence is a standard form licence agreement that allows you to copy, distribute, transmit and adapt this publication provided that you attribute the work.
The ATSB’s preference is that you attribute this publication (and any material sourced from it) using the following wording: Source: Australian Transport Safety Bureau
Copyright in material obtained from other agencies, private individuals or organisations, belongs to those agencies, individuals or organisations. Where you wish to use their material, you will need to contact them directly.
[1] Office of the National Rail Safety Regulator. National Rail Safety Data: Network Statistics. Downloaded from www.onrsr.com.au on 21 September 2022.
[2] The ONRSR database recorded 881 level crossings at rail and road interfaces which were non-operational or decommissioned.
[3] The Office of the National Rail Safety Regulator National Rail Safety Data: Network Statistics shows there were over 23,000 level crossings in Australia. This figure includes level crossings which separate road and rail traffic, and crossings which separate rail traffic and pedestrians.
[5] Victorian Government Office of the Chief Investigator Transport and Marine Safety Investigations, Rail Safety Investigation Report 2007/09. Level crossing collision V/Line passenger train 8402 and a truck near Kerang, Victoria, 5 June 2007
[7] The ATSB notes there are some differences between the road vehicles permitted to operate in the United States and in Australia, such that Australian regulations permit longer and heavier maximum vehicle size.
[8] The regulations required that rail operators must report Category A occurrences immediately, with less-immediate reporting required for Category B occurrences. For further details see Notifiable occurrences | ONRSR.
[9] 1 collision involved a train and a light vehicle and heavy vehicle which had had a road traffic accident prior to the level crossing collision. This collision was included in the ATSB analysis of heavy vehicle accidents.
[10] 1 collision involving a heavy freight vehicle in the National rail safety database was excluded from the ATSB analysis because it involved the collision of a truck with a stationary train. Another was excluded because it involved a collision between a hi-rail vehicle and a truck.
[11] 1 collision in the National rail safety database was excluded from the ATSB study because it was a collision between a train and a mini-van.
[12] 1 collision involving a vehicle recorded as special purpose machinery in the National rail safety database involved a collision between a train and a truck, and this collision was included in the ATSB analysis. Collisions between trains and graders and tractors were not included in the analysis.
[13] A road vehicle fitted with retractable rail guidance wheels, to enable it to drive on rails.
[14] Geoscience Australia defined the ending of astronomical twilight as the instant in the evening when the centre of the sun is at a depression angle of 18° below an ideal horizon. At this time the illumination due to scattered light from the sun is less than that from starlight and other natural light sources in the sky.
[16] The Australian Guide to Road Design (Austroads, 2017) states: The design vehicle is therefore the largest vehicle likely to regularly perform a movement at an intersection. The choice of a particular vehicle as the design vehicle depends on the number of those vehicles expected to undertake the movement. …In the absence of data or reliable information to the contrary, the selection of the appropriate design vehicle for a particular intersection or turning movement should be based on the functional classification of the intersecting roads as this reflects the composition of traffic expected at the intersection.
[17] Chadwick, Saat and Barkan (2012) categorised buses as other vehicles, not heavy vehicles.
[18] This included 283 collisions recorded in the national rail safety dataset from July 2014 to July 2022, and 2 additional collisions involving heavy vehicles, which occurred in July and August 2022.
[22] Derailments were only reported in the FRA REA dataset. The ATSB determined that it was highly unlikely for a level crossing accident to result in derailment and not exceed the damage threshold for reporting in the REA dataset. Therefore, the Chi-Square analysis assumed that all level crossing accidents which were not reported in the REA dataset did not result in derailment.
[23] The ATSB analysis categorised the ABS and BITRE categories of ‘Light rigid trucks’, ‘Heavy rigid trucks’, ‘Articulated trucks’ and ‘Buses’ as Heavy vehicles. Other vehicle types were categorised as Light vehicles.
[24] A ‘rolling stop’ refers to a road vehicle driver approaching an intersection and slowing their vehicle, before proceeding through the intersection without coming to a complete stop.
[25] Vehicle Standard (Australian Design Rule 93/00 – Forward Field of View) 2018.
[26] As driving is on the right-side of the road in Canada, this would be the equivalent of a left curve in Australia.
[27] All the research discussed below was conducted in regions where driving is on the right-side of the road. However, in the text in this report, directions have been reversed for Australian conditions (left switched with right).
[28] Such as those encountered by the driver of RO-2015-016.
[29] Transportation Safety Board (2012) Railway Investigation Report R12W0182. Crossing accident at Broadview, Saskatchewan on 9 August 2012.
[30] National Transportation Safety Board (1998) Safety at Passive Grade Crossings Volume 1: Analysis.
[31] The dimensions, acceleration and deceleration characteristics of various types of heavy vehicles up to 70 m and 200 t road trains were determined via computer simulation and field tests, as described in the Austroads research report Heavy Vehicle Sight Distance Requirements at Rail Crossings (Stage 2). These values were utilised in the development of AS 1742.7 (2017 revision).
[32] Regulations in some jurisdictions prescribe lower speed limits (90 km/h) for larger categories of heavy vehicles. The effect of lower speed limits will be to reduce the sighting distances required for these vehicles when approaching level crossings.
In August 2021, during the COVID-19 pandemic, Formosabulk Clement diverted to Brisbane, Queensland for crew change, to be completed to/from a launch via the combination pilot ladder. At the time, Queensland was the easiest jurisdiction in Australia for ships to conduct crew change due to the State’s extensive quarantine arrangements for transporting and accommodating seafarers. By 1833 on 9 August, 8 persons and their luggage had been successfully transferred from the launch PT Transporter to the ship located at an outer anchorage. The launch skipper then drove the launch a short distance off the ship for a short break.
By this time, the ship had turned about the anchor and the boarding side of the ship came under the influence of the forces of wind and sea. After receiving supervisor advice to attempt the transfer again, the launch skipper took the launch back toward the boarding area to assess whether the conditions were suitable. On board Formosabulk Clement, the departing chief mate (dCM) saw the approaching launch and went down the access ladders and onto the vertical pilot ladder in anticipation of boarding. At about 1838, as the dCM waited on the ladder and the launch came close alongside, a large wave passed down the side of the ship and lifted the launch higher than expected. The dCM was struck by the launch and knocked into the sea. Despite being quickly recovered on board, they received fatal injuries.
What the ATSB found
The investigation found that the open water conditions at the anchorage were marginal but, within a lee created by the ship, they were suitable for the transfer to occur. However, as the skipper brought the launch alongside to assess conditions, the transfer area was no longer in a lee and waves were acting against the ship’s side, increasing in height as they passed along it.
Coincident breakdowns in communications between, and within, the ship and the launch resulted in the ship’s master, the dCM, the launch skipper and the launch deckhand having different understandings of the significance and intent of the launch returning alongside the ship.
In addition, the dCM went down the boarding ladders in preparation to board the launch without the knowledge or agreement of either the ship’s master or the launch skipper. The dCM was then in a vulnerable position when the launch was lifted on the higher than expected wave.
The investigation also found that plans and details of how the transfer was to be controlled and progress when the launch was alongside were not adequately shared between all parties in the time available as the launch approached the ship. Neither the shipping company nor the launch company had in place procedures to ensure that such information was shared before the ship arrived at the anchorage.
As a consequence, different interpretations and misunderstandings of the plan and expectations of the people involved in the transfer, particularly those in positions of influence over the progress of the transfer, were not identified and addressed.
What has been done as a result
Following the accident:
the launch service provider (Pacific Tug) ceased crew transfer operations until an investigation into the accident and assessment of transfer operations were completed
Maritime Safety Queensland (the State’s regulator) amended the COVID crew change procedure for vessels at anchor including limiting crew changes to risk assessed conditions and daylight hours only
Formosabulk Clement’s operator, Formosa Plastics Marine Corporation, completed investigations and held multiple safety meetings and training exercises to share details of, and lessons learned from, the accident.
Subsequently, Pacific Tug updated personnel transfer arrangements and procedures. This included developing and implementing a traffic light system (red, amber and green statuses) for operational assessment and control. The system set operational requirements and limits, including weather, against which the conduct of the transfer task was continually assessed. Light sets, mounted on the launch, are used to show the status of the transfer to all involved, on the launch and the ship. A red status requires cessation of the transfer operation and complete reassessment prior to any further attempt to complete the task.
Safety message
All parties are reminded of the importance of maintaining active and adaptable communications before and during the planning, co-ordination and control of a complicated task.
Further, where possible, all parties should share plans and information well before undertaking a task so as to allow all involved to have a common and complete understanding of the planned activity.
The occurrence
During the COVID-19 pandemic, the international maritime industry struggled to comply with requirements for the maximum continuous period that a seafarer could serve on board a ship without taking leave.[1] Following a period of grace during which the continuous service period was relaxed to 14 months, in November 2020, the Australian Maritime Safety Authority (AMSA) notified ship owners, operators and seafarers that it would resume enforcing the 11‑month continuous service limitation from 28 February 2021.
On 25 July 2021, Formosabulk Clement (Figure 1) departed Mailiao, Taiwan, in ballast, bound for Newcastle, New South Wales to load coal. The ship’s trade routes for the preceding 6 months had provided no opportunity for change of crew and 14 of the 25 crew on board had been on board for more than 11 months.
At that time, pandemic-related restrictions on crew changes varied considerably between different States in Australia with Queensland offering the most convenient opportunities. Hence, in early July, Formosabulk Clement’s manager, Formosa Plastics Marine Corporation (FPMC), engaged its local shipping agents in Australia to arrange a crew change off Brisbane, Queensland. The arrangements would involve the ship calling at Brisbane anchorage to rendezvous with a crew change vessel (launch). Eleven crewmembers were to join the ship and 15 were leaving.
Figure 1: Formosabulk Clement at anchor, PT Transporter alongside
Source: AMSA, Pacific Tug with modifications and annotations by ATSB
Arrival to anchor and preparations
At 0912[2] on 9 August, Formosabulk Clement anchored in the port of Brisbane outer anchorage, about 6 miles[3] east of Point Cartwright. Ashore, pandemic protocols had been completed for the joining crew and arrangements for transfer by launch had been made. The launch service provider (Pacific Tug) notified all parties that, to satisfy requirements, the transfer would require 2 trips by the launch PT Transporter. The launch was to collect the passengers and depart from the quarantine facility at Brisbane Rivergate marina and shipyard.[4]
Figure 2: Starboard side boarding site and ladder arrangement
Source: AMSA, FPMC and Pacific Tug annotated by ATSB
Pacific Tug requested that Formosabulk Clement be relocated further south in the anchorage area to assist the transfer, and with Brisbane vessel traffic service (VTS) approval, the ship was moved south. During this same information exchange, the ship’s master was requested to have the boarding arrangements (Figure 2) located on the opposite side of the ship to the deployed anchor and to provide a good lee for the transfer.
At 1436, Formosabulk Clement’s port anchor was let go and at 1500 ‘finished with engines’[5] was rung. The ship was now anchored about 5 miles east of Caloundra Head, about 7 miles south of the original anchor location. It was riding easy on the anchor, 7 shackles in the water in a fresh breeze and moderate seas, from the south-east.[6] Throughout the afternoon, the ship yawed about the anchor, at the whim of the conditions, its heading varying between about 140° and 80° in about 30-minute cycles.
At 1448, PT Transporter departed the Rivergate marina and shipyard with 2 crewmembers (skipper and deckhand) and 8 Formosabulk Clement joining crewmembers on board. At 1530, it passed to the west of the entrance beacons, 30 miles from the ship, heading north-east making better than 15 knots across Moreton Bay. The passage across the bay toward the ship remained uneventful other than for several of the passengers becoming seasick in the choppy conditions.
At 1600, on board Formosabulk Clement, the departing chief mate (dCM) completed handover of rank to the trainee chief mate who had been on board since early May and was now taking over the position. The new chief mate then took the navigation watch from the second mate.
The dCM was to leave the ship on the first launch after supervising the embarkation of the 8 joining crew (and their luggage) and the disembarkation of 7 other crewmembers. In agreement with the master, the plan was for the dCM to be the last person to disembark. The dCM and the master (on the bridge) would be using handheld UHF radios to communicate.
After the evening meal, crewmembers assembled and arrangements for the departure were finalised. At the boarding area on the starboard side, the bosun, one ordinary seafarer and one deck cadet were to be assisted with conducting the transfers by the departing, and then joining, crewmembers, overseen by the dCM. The personnel gathered on deck, with their luggage, and prepared to assist the boarding crewmembers.
At 1725, as PT Transporter approached Formosabulk Clement, the skipper called the ship on the port’s working channel (VHF channel 12) and advised that the launch was 15 minutes away. The skipper confirmed the transfer would be done on the ship’s starboard side and requested that a lee be provided. The ship’s new chief mate confirmed the boarding side and the lee. Subsequent communications generated confusion between the launch and the ship regarding the lee. The launch skipper then requested assistance from the launch passengers and from 1730 communications between the launch and the ship commenced in Chinese. At about 1740, the launch slowed and manoeuvred along the starboard side of the ship.
Transfer to the ship
At 1745,[7]Formosabulk Clement was at one extreme of yaw about the anchor with the starboard side exposed to the weather (heading 089° with weather from 100°— Figure 3). The launch skipper recalled there was a little bit of sea from the east-south-east and that it ‘wasn’t the calmest of conditions’ (noting that several of the launch passengers had been sick during the journey). The ship’s master recalled observing similar conditions at the time with 2 to 2.5 m wave heights. The ship’s stern began to swing to port and conditions along the starboard side began to ease.
Nearing 1800, the ship was at the other extreme yaw angle about the anchor and was on heading 142° with the boarding area sheltered. The master radioed the launch and informed the skipper that the wind was now from the port side and it was suitable to ‘try once again'.
Figure 3: Ship yaw leading up to the accident
Source: ATSB analysis of AIS data from AMSA
On board the launch, the skipper manoeuvred alongside, keeping parallel to the ship’s side with little if any force applied to the hull while keeping the boarding ladder in position on the foredeck of the launch. As the conditions allowed, the transfer commenced with each person guided, one at a time, forward and onto the ladder by the deckhand. Baggage was transferred by line from the after deck.
The weather conditions began pushing the ship’s stern to starboard and the master requested standby on the main engine and at 1806 the engine was ready for manoeuvring. The stern continued to swing to starboard and by 1810 the ship had swung back to heading 095°. The master used dead slow ahead commands in conjunction with rudder movements to drive the stern around and turn the port side of the ship against the weather, thereby providing shelter to the boarding area.
By 1825, the ship had been manoeuvred to heading 167°, creating calm conditions at the transfer site. The transfer continued. At about 1820, the ship’s main engine was stopped and the ship continued to yaw under the influence of the weather. The main engine was used again for a short period and by 1833 the transfer on board was complete and the ship had swung back to 097°.
At the completion of the transfer to the ship, the launch skipper drove the launch away from the ship’s side to rest and reassess the conditions. The launch was stood off a short distance for several minutes. The skipper reported feeling that conditions were marginal and of having contacted the Pacific Tug supervisor for advice. The advice received was to ‘go and have another look and request a lee’. The skipper recalled advising the ship’s master to ‘stand by’ and to provide a lee. The deck hand was also advised to ‘stand by’. The view from the launch’s wheelhouse was somewhat restricted, especially up the side of the ship, and while standing off, the skipper used the launch’s spotlight to view the boarding area. The skipper recalled seeing one person leaning on the rail about midway down the accommodation ladder, and no-one on the boarding ladder.
The skipper then manoeuvred PT Transporter alongside Formosabulk Clement with the intention of assessing the suitability of conditions at the boarding ladder for continued operations.
The accident
Following the brief rest period, the launch was taken back in toward the boarding ladder. The skipper intended to see how the launch sat alongside as the ship yawed and the boarding area became more exposed to the conditions. The skipper also expected to provide approval to the ship before anyone left the deck and did not anticipate that someone would be on the ladder.
Onboard Formosabulk Clement, the master confirmed via radio with the dCM that the boarding phase was completed. At this time, the master could see the dCM on deck and expected that disembarkation would not commence until approval was given. The boarding area on the starboard side was now exposed to the weather and the master was aware that a lee would have to be made on that side. This required the master to manoeuvre the ship to make a lee and then convey this plan to the launch and to the dCM. However, while attempting to communicate with the launch, the master could see it returning.
As the launch approached, the dCM went down the accommodation ladder and onto the pilot ladder. One of the departing able seafarers (AB1) followed onto the accommodation ladder. The dCM was wearing multiple layers of clothes, including a jumper, along with a small document wallet type backpack under a self-inflating buoyancy vest and was carrying a ship’s hand-held radio.
As the launch closed in, the dCM began climbing down the pilot ladder. The master was preoccupied with contacting the launch and remained unaware that the dCM (or AB1) had left the deck and gone onto the ladder(s).
As the launch closed on the ship, the deckhand saw the dCM several rungs down the pilot ladder and descending. As the launch was not yet safely alongside, the deckhand directed the dCM to climb back up. The dCM climbed up until adjacent to the accommodation ladder lower platform.
Soon thereafter, the launch came close alongside and the dCM began to descend the pilot ladder a second time. The deckhand felt the conditions were suitable and did not direct the dCM away. The launch skipper was unaware of the presence of the dCM on the pilot ladder or of the interactions between the deckhand and the dCM.
At about 1838, suddenly a larger wave lifted the launch higher than had to that time been experienced (Figure 4). The skipper sighted the dCM on the ladder as the launch rose, but with insufficient time to take any avoiding action. The deckhand shouted a warning for the dCM to get clear, however, the launch rose up, trapping the dCM between it and the side of the ship. As the launch then came down on the wave, the dCM fell into the water. The dCM’s lifejacket inflated, keeping them afloat.
On board Formosabulk Clement, the master was still attempting to communicate with the launch when notified by the bosun that the dCM had fallen into the sea.
The skipper manoeuvred the launch clear of the ship and the dCM. Once clear, the skipper and deckhand went about rescuing the dCM who was soon retrieved on board PT Transporter. The dCM was seriously injured and the launch crew administered first aid, including CPR. The skipper notified the ship’s master that the dCM had been retrieved but was unconscious.
In the following minutes authorities including VTS, the harbour master and the shipping agents were notified. The emergency authorities were called and police and ambulance personnel were deployed. The launch was directed to take the dCM to Mooloolaba, about 10 miles to the north-west, to meet with the emergency services.
At 1905 PT Transporter departed the area for Mooloolaba. The launch arrived there at 1955 and met paramedics. The dCM was examined and provided treatment but was pronounced deceased soon thereafter.
Figure 4: Approximate positioning of the launch and personnel at 1838
Source: AMSA, Pacific Tug with modifications and annotations by ATSB
Post-accident
All further operations were ceased and both vessels were directed by AMSA to remain in their existing locations pending an accident investigation. During the following days, Formosabulk Clement was detained by AMSA on the grounds that the required boarding arrangements for safe means of access were defective and did not comply with regulations. This notice, along with action by the port authority, prevented personnel from boarding the ship from the water.
Consequently, alternative arrangements were made to complete the still outstanding crew change, which was completed by helicopter on 13 August. The detention order was subsequently lifted and the direction notice closed. At 1530 that day, standby was called and Formosabulk Clement departed the anchorage and continued its onward voyage to Newcastle.
Context
Formosa Plastics Marine Corporation
Formosa Plastics Marine Corporation (FPMC) commenced operations in 1980 with 2 chemical tankers to service the needs of its parent company Formosa Plastics Group. By 2022, FPMC operated a fleet of 48 vessels,including 18 bulk carriers, with total deadweight of 5.9 million tonnes. FPMC ships regularly traded to Australia, calling at ports including Brisbane and Newcastle.
Formosabulk Clement
At the time of the accident, Formosabulk Clement was owned by Pilot Maritime Company (Liberia) operated by the Formosa Plastics Marine Corporation (FPMC, Taiwan) and registered in Liberia. The ship was classed with Bureau Veritas.
Formosabulk Clement had regularly visited Newcastle, with 5 port calls in the 12 months prior to trading between Taiwan and Russia between the period of April 2021 and the accident voyage. The ship had completed one previous crew transfer off Brisbane, by launch, in December 2020. On that occasion, 4 persons had disembarked (none boarded).
Following this accident, Formosabulk Clement was sold and renamed Goody.
Crew details
Formosabulk Clement had a multi-national crew of 25, including the relieving chief mate (scheduled to take over during this crew change), 3 deck cadets and 2 engineer cadets. The master and departing chief mate (dCM) were from China and the remaining crewmembers were from China, Taiwan and India.
The master first went to sea in 1986 and obtained their master’s seagoing qualifications in 1999. They had worked for FPMC since 2003 as master within the bulk carrier fleet. This was the master’s first time on board Formosabulk Clement, having joined in June 2020.
The departing chief mate (dCM) first went to sea as a deck cadet with FPMC in 2007. This was their second time on board Formosabulk Clement, both times as chief mate. They joined the ship in June 2020.
Of the 15 crewmembers scheduled to depart Formosabulk Clement during the call to Brisbane, 14 had joined the ship in June 2020 and had been on board for 409 days.
All crewmembers interviewed reported having used a pilot ladder previously. The least experienced had joined the ship by pilot ladder and stated that more experienced crewmembers gave advice and reassurance when preparing on this occasion. More experienced persons had used pilot ladders multiple times on many different ships. All stated that training was given and discussions held prior to the transfer. Training was also provided at shore-based marine schools.
Crew change procedures
The FPMC fleetwide safety management system (SMS) included several procedures which related to conducting personnel transfer between a ship and another vessel while at anchor in open waters.
Personnel transfer at sea procedure
The ‘Personnel transfers procedure at sea’ advised that crew change at sea was to be undertaken as far as possible in favourable weather conditions, with good visibility, and preferably during daylight. Transfer activities were to be suspended and reported to the superintendent if the weather deteriorated.
The procedure required that, prior to the transfer, a risk assessment and a briefing meeting for the task were to be conducted. The briefing meeting was to include discussion of:
the launch company’s risk assessment for personnel transfers. The documentation to be received was to include details of the suitability of the launch, details of its life-saving equipment and confirmation of the responsible officer on board the launch
limiting weather conditions: wind <17 knots, swell <1.25 m, visibility >5 miles
the requirement for approval by the masters or skippers of both vessels and the persons being transferred, for the transfer to take place.
Personnel to be transferred were to be fully aware of and understand the sequence of events including that only one person was allowed on the ladder at a time. They were also to understand the requirements for and use of any equipment including personal protective equipment (PPE) and clothing, including lifejacket, footwear and safety harness.
The procedure also advised that the responsible officer should not be one of the departing or joining crew.
Furthermore, the procedure advised that good communications be established with the launch and that during the transfer ‘There should also be a clear understanding of the meaning of all terms used in the transfer’.
Risk assessment
A risk assessment for ‘Transfer of personnel to and from small vessels’, involving 14 crewmembers, was authorised and dated 9 August 2021.
The assessment included the risk of personal injury due to a fall. This was mitigated by measures including not transferring in heavy weather (not defined in this document), that all crew were to be briefed on the transfer with the sequence explained, step-by-step, and ensuring good communication with the launch to co-ordinate the task.
The risk of crush injury due to the launch or other equipment was to be mitigated by briefing and training of the crew including confirmation of the sequence of activities.
Also identified was the risk that the gap between the ladder and the launch combined with the motion of the launch may lead to a person falling into the sea. This risk was to be addressed by good communications and co-ordination of the task along with sufficient lighting and personnel wearing the required PPE.
The assessment concluded that the level of risk was tolerable and no ‘additional measures’ to reduce risk or further assessment were required.
Crewmember training—pre-transfer briefing
A record (on FPMC form titled ‘Training Record’) was kept of a meeting held a week before arrival to discuss the transfer. Dated 2 August and signed by all crewmembers, the subject of the training record was ‘Personnel transfers procedure at sea’.
This one-page record included some of the points raised in the personnel transfer at sea procedure, such as providing a lee, having clear communications, completing a risk assessment, and details of lighting and safety equipment. However, no mention was made of the launch company’s documentation or expectations, limiting weather conditions or of signals and terms to be used.
Permit to work overside
A permit to work overside was completed on 9 August 2021, valid from 1530 that day. The permit identified the dCM as the person assigned to the work with the bosun as the team leader at the worksite. Twelve others, including those scheduled to depart, were signed-on to the permit as other persons.
This permit contained general applicable items such as PPE, communications, lighting and consideration of the weather conditions. The permit indicated that all requirements were in place, including that the weather was considered suitable for safe work. However, it did not make specific mention of limiting conditions, personnel transfer activities or communication and signalling protocols.
FPMC risk assessment procedures
The FPMC SMS risk assessment procedures document was to be a source of information and guidance for the use and implementation of risk assessments. The document outlined risk assessment philosophy and the company process. Guidance and suggestions were provided for each stage of the process. The procedure also advised that any person had the authority to stop the work should a condition or behaviour be perceived as unsafe.
The procedure required that all personnel performing a risk assessment on board were to be appropriately trained in the process.
FPMC permit to work procedures
The FPMC ‘Permit to work procedures’ required that, as part of the risk assessment process, a permit to work (PTW) was to be issued before any work was commenced. FPMC had a suite of 13 PTWs for use on board. A permit for work overside was required for any work which required crewmembers to work outboard of the ship’s railings, including preparation of the combination pilot ladder.
The PTW procedures also required that a toolbox talk be completed for all tasks. This was to be held by the person in charge, at the worksite, with all involved, before the work began.
FPMC crew change logistics
The ATSB sought advice from FPMC regarding crew change issues and requirements during the pandemic and the plan to change crew off Brisbane. The response received included:
Joining personnel were to complete any special requirements before departing crew ended their contracts. This included visa requirements as well as pandemic requirements such as PCR[8] testing and quarantining.
COVID-19 pandemic restrictions meant that, in the preceding 6 months, crew were denied entry into Russia or Taiwan. AMSA enforcement of MLC time on board limits meant that crew change needed to occur prior to or at Newcastle.
Approval for crew change was not obtained from New South Wales (NSW) Health, and, FPMC had found, on previous occasions, that crew change in NSW was difficult.
Queensland had put in place a COVID-safe plan which allowed crew changes to be completed and Brisbane was selected for the crew change on this basis.
Crew change arrangements were made by a local Brisbane agent. At that time, arrangements included COVID-safe transport, accommodation and testing, in addition to the usual logistics of launch provision, notification of the required agencies for port, customs, immigration and biosecurity requirements.
Earlier crew change operations for FPMC vessels had showed launch transfers to be significantly more cost-effective than other means, such as helicopters. In addition, the need to disembark 15 persons and embark 11 made launch transfer the preferred choice for Formosabulk Clement.
FPMC also advised, that at the time, there were no restrictions on timing for the crew change with limitations only due to weather. The vessel position was guided by the port and advice from the launch company.
Boarding arrangement
At the time of the accident, freeboard at the boarding location was about 16 m (Figure 2). The combination pilot ladder was arranged with the accommodation ladder section at maximum angle leaving more than 5 m from the bottom of the ladder to the waterline. The vertical, rope pilot ladder was deployed from deck with the bottom step positioned about 1.4 m above the water.
Following the accident, PSC inspection found the pilot ladder defective, as, among other issues, the lower spreader was cracked (possibly due to contact from the launch during the transfer). The ship was detained by AMSA under the Navigation Act 2012, in part, due to deficient safe means of access to the vessel. The rope pilot ladder was replaced prior to the ship sailing from Australia and the deficiency was closed.
Lighting for the boarding area was provided by a portable floodlight mounted over the side at deck level and floodlights mounted on the ship’s starboard bridge wing (Figure 5). Deck lighting was also used to illuminate the work area on deck. Sunset was at 1723, and the ship’s crewmembers reported that there was sufficient lighting for the task.
Figure 5: Ship lighting for the starboard boarding area
Source: AMSA with annotations by ATSB
Recorded data
Formosabulk Clement was fitted with a simplified voyage data recorder (S-VDR)[9]designed to collect and store data from various shipboard systems in compliance with regulations.
This system required crew action to ensure the data was saved following an incident where power was not lost. However, this procedure was not followed on this occasion and consequently the recorded data was not available to the ATSB. Bridge audio, radar data and rudder orders were not recorded.
Engine orders were recorded via the telegraph logger and printer fitted in the bridge console.
Pacific Tug
Pacific Tug (Aust) was a family owned and operated Australian registered company based in Victoria Point, Queensland, with operations in the Brisbane River and around Australia. The company began in 1965 and provided marine services including towage, salvage and personnel transfer. In 2022, the company had a fleet of 25 tugs, barges, support and crew transfer vessels.
Procedures
Pacific Tug maintained a company-wide operations manual within an integrated management system. This system included multiple procedures relevant to personnel transfer between vessels.
Risk assessment
The purpose of the risk assessment document was to provide clear and defined processes for the preparation and execution of a risk assessment at Pacific Tug workplaces. All workers involved in a task were required to actively participate in a risk assessment.
Risk assessments were required for activities which included new or non-routine tasks and prior to any complex task as required by legislation, regulations, standards and codes of practice.
Two types of risk assessments were described:
A job safety environment analysis (JSEA) which detailed step-by-step how a task was to be carried out safely. The analysis considered:
tasks—a step-by-step list of the basic activities of the task
hazards—a list of potential hazards at each step of the task
control measures—step-by-step instruction on how to safely carry out the task by controlling each identified hazard.
A safe work method statement (SWMS) was also available. This statement detailed step‑by‑step how a task was to be carried out safely. It differed from a JSEA in that the SWMS was required, under Australian safety regulations, for all high-risk construction work.
In addition to other activities, Pacific Tug utilised PT Transporter for construction activities and both types of risk assessment were completed for the vessel. Personnel transfer between vessels was an activity for which a risk assessment was required.
Vessel transfers
The Pacific Tug fleet operations vessel transfers procedure aimed to provide clear and defined processes for boarding and disembarking from a vessel. The procedure outlined the master’s responsibilities and then provided guidance on transfer of personnel, including the importance of maintaining 3 points of contact and movement of personnel between a vessel and fixed wharf.
The master (skipper) was to ensure the safety of personnel during the transfer to and from the vessel. If the transfer was between vessels, the masters were to discuss and reach agreement beforehand regarding the person in charge of the activity (and on which vessel), with one person in charge at any one time.
Workers being transferred were to be briefed prior to the transfer and were to be familiar with the method of transfer. The procedure also advised, among other things, that:
Before the transfer operation, the master was to designate who was responsible for the transfer. This designated crewmember was to be in charge of the actual transfer of the worker. No worker was to transfer onto, or off, the vessel until that crewmember considered it safe to do so and indicated that transfers may take place. Any doubt was to be resolved in consultation with the master before the transfer proceeded.
A clear understanding of the meaning of all terminology used in the transfer should be established between all those taking part.
Clear communications were to be established and maintained between the person conning the vessel and those assisting in the transfer.
Only one person was permitted to transfer at a time.
The vessels (where appropriate) should be manoeuvred to create a suitable lee and provide protection to the transfer site.
Permit to work
The Pacific Tug permit to work (PTW) procedure was to provide clear and defined processes for each type of activity requiring a PTW. A PTW was required for any non-routine activities and any activity deemed high risk (defined in the procedure as ‘An activity that is deemed to have potential risk or has hazards that may injure a worker or the potential to injure workers.’). Permits existed for work aloft or over the side and for lifting people, but not specifically for personnel transfer.
The PTW system was to identify, plan and control any hazardous tasks and promote worker accountability and responsibility for the task to be undertaken. Each PTW was to describe the high-risk work to be done and the precautions to be taken while doing it. It also highlighted the conditions to be met for the PTW and hence for the work to proceed.
The risk assessment completed for personnel transfer by launch did not identify that a separate permit to work was required.
COVID safe plan
In compliance with relevant legislation, Pacific Tug completed requirements put in place to respond to the COVID-19 pandemic. This included being a Queensland Government endorsed transport provider with an approved transport plan in place and Statement of Compliance for PT Transporter.
Customer interaction
Pacific Tug had processes in place for corresponding with customers (in this case this was via the agent) which included providing a package of standard information. This package included a schedule of rates, vessel specifications sheet and pandemic response requirements. It did not include Pacific Tug procedures or operational requirements relating to details of the transfer of persons from one vessel to another.
PT Transporter
PT Transporter (Figure 6) was an aluminium catamaran, built in 1996 and refurbished in 2019 with machinery and fit out changes and upgrades, including main engines and generator. The vessel had a cruising speed of 20 knots and was 11.9 m long, with a breadth of 4.80 m and draught of 1.20 m. It was an Australian domestic commercial vessel (DCV) regulated under the Marine Safety (Domestic Commercial Vessel) National Law Act 2012.
PT Transporter was in survey to class 1C,[10] certified to carry 2 crew and 23 passengers. It was designed, and predominantly used, for personnel transfer with the foredeck purpose-built for such. Since October 2019, PT Transporter had completed 51 personnel transfer operations, 39 of which were to outer anchorages.
Figure 6: PT Transporter
Source: Pacific Tug, annotated by ATSB
The vessel’s helm position was located to starboard of the centreline. The cabin layout combined with the foredeck awning limited the skipper’s view upwards, especially in close quarters such as when the launch was alongside the ship (Figure 7).
Crew
PT Transporter was certified with a complement of 2: master with minimum coxswain grade 1 certificate and an uncertificated deckhand.
PT Transporter’s master (skipper) had more than 15 years’ small boat experience in various locations around the coast of Australia. They had worked on several major construction projects as a crew boat skipper. At the time of this accident, they held valid certification as master <35 m near coastal and marine engine driver grade 2 NC (near coastal).
The skipper was employed with Pacific Tug on a contract/casual basis beginning in 2010 as a general-purpose deckhand with short periods as master of PT Transporter. In 2019, after time away, they were re‑employed as master of PT Transporter with stints in other vessels as deckhand and mate.
The deckhand commenced casual employment with Pacific Tug in June 2021 and had served in 4 vessels (total 8 days service), including the day of the accident. On 3 previous occasions the tasks had involved personnel transfer, all on board PT Transporter. The deckhand held a valid AMSA certificate of proficiency as an integrated rating.
Both crewmembers held a valid AMSA certificate of safety training. This was the first time they had worked together.
Figure 7: The view from PT Transporter’s skipper’s position at the helm
Source: Pacific Tug annotated by ATSB
PT Transporter specific procedures
The Pacific Tug operations manual included several procedures specific to the operation of PT Transporter.
Transfer of personnel job safety and environment analysis (JSEA)
A job safety environment analysis (JSEA) was completed in April 2020 for PT Transporter for the task of personnel transfer. This document identified that no permit to work was required and then identified hazards and risk control measures for steps within the task. Users were directed to the fleet procedure relating to personnel transfer.
Identified risk control measures included:
clear communications
assess vessel movement before commencing a transfer
ensure sufficient lighting
maintain communication between vessels at all times
both launch personnel to monitor the sea conditions at all times
the transfer was to proceed only after the skipper had given the ‘all clear’
a lee was to be provided as necessary.
Both the skipper and deckhand of PT Transporter had signed multiple times that they had read and understood this document, with the most recent sign-offs less than 2 weeks before the accident.
General vessel operations job safety and environment analysis
This JSEA was for PT Transporter general operational activities. The risk assessment covered 14 identified activities, several of which were relevant on 9 August. In addition to general considerations, this included arrive at / depart another vessel, transiting, pushing up to another vessel, and transfer of personnel and belongings.
Hazards for each activity were identified, as were control measures. Common to the control measures were ensuring effective communication and ensuring all personnel understood the activity and their role in it.
The JSEA advised that for all vessel activities an ‘Operational Risk Assessment’ was required.
Safe work method statement (SWMS) for letting go / making fast—wharf or vessel
A SWMS risk assessment was completed in April 2020, for PT Transporter operations associated with construction activities identifying hazards and control measures related to the launch making fast to, or letting go from, another vessel. While not expressly applicable to the launch being manoeuvred alongside the ship, this risk assessment showed that relevant risk control measures were considered and applied to operations of this vessel. These included ensuring clear communication and instruction on the task sequence and between vessels, consideration of weather and sea conditions, and proceeding with the task under instruction of the master (skipper) and as per the planned sequence.
PT Transporter vessel safety training manual
This manual focussed on vessel‑specific safety training, equipment and firefighting arrangements with few references to operational procedures. Users were advised that this manual was in addition to the fleet operations manual which contained fleet standards and operating procedures including permits to work, work planning and hazard analysis.
PT Transporter Wellbeing Plan
This document outlined actions Pacific Tug would take to provide a consistent approach for the management of Safety, Health and Environmental (SHE) requirements. The document included details of crewmember responsibilities along with guidance on addressing the COVID-19 requirements at the time. To comply with Queensland Health guidelines, PT Transporter could accommodate 9 passengers and 2 crew.
PT Transporter COVID safe transport of quarantined persons plan
The Queensland Government’s Public Health Directions required that quarantining persons were moved to and from nominated quarantine premises by dedicated modes of transport. This required that the transport provider was endorsed by a government authority, with a Transport Plan in the form approved by the State’s Chief Health Officer. This was in addition to the in-house PT Transporter wellbeing plan.
Under PT Transporter’s approved transport plan, the vessel could safely transport 2 crew (housed in the cabin) and 13 passengers separately accommodated in the after deck seating area.
Daily pre-shift work plan
A daily pre-shift work plan for the vessel was completed on 9 August for a ‘crew run at the outer anchorage’. The work planned was for 8 persons on, 8 off Formosabulk Clement at the outer anchorage, departing from Rivergate Marina. This plan did not expand on this information or make mention of any related risk assessments or permits to work in the columns provided for such. Both crewmembers had signed the plan.
Provisional Pacific Tug procedures
As part of the company continuous improvement programme, at the time of the accident, an operational risk assessment procedure was being trialled for PT Transporter general operations. This provisional procedure included:
A ‘Traffic light assessment’ system and criteria for operations. This system set the conditions used to determine the state of operations—safe, stop and assess, stop immediately and for re‑starting. This included environmental limitations:
a.safe operations (green): wind <10 knots, combined swell <0.5 m
b.stop and assess (amber): (predicted) wind 15 knots, combined swell 0.75 m
Operational requirements, which were separated into when the launch was approaching the ship and when alongside. Both situations mentioned communications between vessels and personnel. While approaching the ship the transfer process was to be communicated to and understood by transferring persons.
Weather
From arrival off Brisbane and throughout the day and into the evening of 9 August, the ship’s navigation watch officers recorded weather conditions as winds from the south-east at force 5[11] (17 to 21 knots, fresh breeze), moderate seas (1.25 to 2.5 m) on 3 m swell with good visibility and overcast conditions.
At the time of the transfer, the master observed that conditions were as above with waves about 2 to 2.5 m and a lee would have to be made for a safe transfer. Testimony of crewmembers on deck at the time was that conditions were windy and that the launch was noticeably moving.
Earlier in the day, as the launch skipper took command, the departing skipper reported that conditions on the bay were ‘not very nice’. Transit across the bay to the ship was made at better than 15 knots and while several of the passengers were sick, the launch crew were not and attributed this to the passengers’ being less experienced in small boats.
Once at the ship, the skipper observed that, with the boarding area exposed to the weather, the conditions were choppy and uncomfortable. The skipper requested the ship (master) provide a lee for the area. As the ship moved and when manoeuvred about the anchor, the conditions at the boarding site improved dramatically. The skipper was satisfied that the conditions, though not dead calm, were sufficiently smooth and comfortable to allow persons to board the ladder and went ahead with the personnel and luggage transfer onto the ship.
The deckhand stated that while choppy, the conditions on the bay and at the ship were similar to other times they had been out and that once in the shelter of the ship, the seas calmed and the launch moved up and down comfortably less than a metre.
Several government agencies, and others, maintain weather and sea monitoring equipment in the area around Moreton Bay and the port of Brisbane. Recordings obtained for locations nearby the anchorage position showed no abnormally high waves were recorded at this time. In the hour preceding the accident, significant wave heights varied from 1.1 m to 1.3 m with maximum wave height of less than 2.4 m recorded. The wave direction varied from 97° to 103°.
Winds were recorded as 10 to 20 knots from about 100° (varying from 70° to 120°).
COVID-19 pandemic
The first human case of a new (novel) coronavirus was identified in December 2019 and on 20 January 2020 the World Health Organization (WHO) issued the first situation report in relation to what was to become known as COVID-19. In response, countries implemented strict measures on the movement of people, including quarantine, isolation and lockdown requirements.
The escalating situation had a profound effect on the maritime industry and seafarers. By July 2021, the IMO estimated that some 250,000 seafarers remained on board commercial vessels, unable to be repatriated and past the expiry of their shipboard contracts. A similar number of seafarers urgently needed to join ships to replace them.[12]
Requirements of the MLC[13] limited the maximum continuous period of service on board ship to 11 months. However, as a consequence of the pandemic, in June 2020 AMSA issued a marine notice[14] allowing for extension of this period of service to 14 months maximum.
In November 2020, AMSA notified vessel owners, operators and seafarers that this extension would end on 28 February 2021.[15] At this time, crew change hubs were available in several major Asian ports including Hong Kong and Singapore. AMSA considered that industry had had sufficient time to adjust to the challenges of repatriation, and did not consider difficulties in finding a flight as an appropriate reason for an extension of a seafarer’s service onboard. Consequently, AMSA advised that from that date, the 11-month continuous service limitation as outlined in Marine Notice 17/2016 would be enforced.
The first case of the virus in Australia was reported on 25 January 2020, and on 20 March the international borders were closed to all non-residents and non-citizens and tight restrictions applied to movement of citizens.
Queensland
On 29 January 2020, Queensland recorded its first COVID-19 case. From 30 January, Maritime Safety Queensland (MSQ), via the vessel traffic service (VTS), increased vetting of vessels prior to pilot boarding. Then, on 25 March, border access restrictions were imposed which limited movement between States. In accordance with emergency powers arising from the declared public health emergency, the Queensland Chief Health Officer issued the first Border Restrictions Direction. Under these restrictions, anyone arriving into Queensland from another State or Territory had to self-quarantine for 14 days, unless they were an exempt person.
In July 2020, Queensland implemented the requirement for a maritime crewmember to comply with a comprehensive ‘Protocol for maritime crewmembers joining or signing off a vessel in Queensland’. The protocol contained instructions and requirements for crew joining or leaving a vessel including testing, quarantine and transport. The protocol required that a crew changeover checklist, endorsed by the regional harbour master (RHM), be completed for the joining crew and another for the departing crew. By June 2021 the protocol had been amended and updated to be version 10.
Also, in July 2020, MSQ established a liaison role to work with the Queensland State Health Emergency Co-ordination Centre to manage, among other roles, interaction between the health and shipping requirements. By mid-2021, a network of persons to assist and oversee crew change on behalf of RHMs and health authorities was in place. This included 2 full-time crew change assistants (CCA) based in Brisbane, 2 in regional ports and a hotel liaison officer based in Brisbane to manage accommodation and quarantining requirements.
In Brisbane, a 230-room hotel was designated for the primary use of maritime crew quarantine. From May 2020 to the end of July 2021, more than 9,000 mariners, from almost 1,500 ships, had changed through Queensland ports. About 4,500 had been through the port of Brisbane with less than 500 changed by launch to vessels at anchor.
At the time, a major Australia-based shipping industry representative body considered that crew changes were most easily conducted in Queensland and had provided that advice to members.
Quarantine corridor—crew changes in Queensland
To complete a crew change in Queensland, the shipping company’s representative (usually the local agent) applied to Queensland Health via a ‘Crew changeover checklist’ form. The form was submitted to the RHM who was acting on behalf of health authorities in this regard. In Brisbane, the CCA then assessed the application and the RHM approved the plan. The CCA responded to the applicant with information outlining the requirements to be met prior to, during and after the crew change.
Following the response from the CCA, communication followed in which the details of the crew change were revised, updated and approved as circumstances required. This included all travel and accommodation arrangements regardless of when these occurred—the first joining personnel for Formosabulk Clement arrived into quarantine in Brisbane on 13 July, almost 4 weeks before the ship arrived.
In this way, a ‘quarantine corridor’ was set up and maintained about any ship personnel travelling through Queensland. The CCAs kept oversight of the planning and progress. They ensured that plans were in place which ensured that a person remained quarantined from the point of arrival into Queensland until they boarded the ship, and vice versa. All steps within the corridor were assessed and approved. This extended to the CCA ensuring that all requirements were in place (for example, PCR testing and quarantine periods) to enable a departing person entry into their destination country.
This system thereby provided the flexibility and security to enable continuing crew changes within the dynamic circumstances created by the pandemic.
COVID safe transport plan
Queensland Government’s Public Health Directions required that quarantining persons were moved to and from a nominated quarantine premises by dedicated modes of transport. In certain circumstances, quarantined persons were required to travel with a transport provider endorsed by a government authority, with a Transport Plan in the form approved by the Chief Health Officer. To fulfill this requirement, transport providers developed a Transport Plan using a template and sought endorsement to operate from the Department of Transport and Main Roads (DTMR).
The purpose of the Transport Plan was to document the practices that would be applied by transport providers to keep themselves and the community ‘COVID safe’. It contained the minimum standards of practice that must be met by transport providers when offering a service to quarantined persons.
Pacific Tug was a Queensland Government endorsed transport provider with an approved transport plan in place and Statement of Compliance for PT Transporter.
Safety analysis
Introduction
In 2021, the COVID-19 pandemic and the response of international shipping to manage it created challenges for ship crew changes. In the case of Formosabulk Clement, this resulted in the ship diverting to Brisbane to conduct a change of long‑serving crewmembers on 9 August 2021. With the ship at anchor, the crew change was being conducted via a combination pilot ladder from the crew transfer launch, a much smaller vessel about 16 m below the ship’s deck.
The transfer was conducted in the early evening on the ship’s starboard side, the leeward side from time to time as the ship yawed at anchor in the rough sea conditions. The ship’s main engine was also used to maintain a lee and, by 1833, the 8 joining crewmembers (and their luggage) had safely boarded the ship.
The launch then moved clear of the ship to wait for the transfer of crew from the ship. While waiting, the launch skipper felt the seas become rougher and, after conferring with shore management, returned the launch alongside. The skipper reported that the deckhand and ship’s master were advised to stand by while they (the skipper) assessed the feasibility of continuing in the conditions. The skipper did not expect to embark anyone at that time and believed permission would be required before anyone attempted to use the ladder.
Meanwhile, the ship’s master was expecting the launch, having moved off, to wait until the ladder was in the ship’s lee again and the master had asked the launch to return. The master knew the starboard side was exposed to the weather and that making a lee using the ship’s engine would take some time and planned to resume the crew transfers once there was a good lee. However, the language difficulties experienced combined with other tasks in this busy period resulted in the master not being able to communicate this plan to the skipper of the returning launch.
At the same time, the departing chief mate (dCM) climbed onto and down the pilot ladder in anticipation of boarding the launch. Neither the ship’s master nor the launch skipper was aware that the dCM had descended the ladder. In addition, the deckhand did not know that the skipper only intended to assess conditions, not to embark anyone. The deckhand saw the dCM on the ladder, directed them clear of the approaching launch and anticipated signalling readiness when it was safe to board.
However, neither the skipper nor the deckhand nor the dCM recognised the significance of the rough seas and swell running along and against the ship’s starboard side resulting in larger and higher waves. Consequently, they did not expect the launch to be lifted higher than previously experienced while alongside. A large wave, however, lifted the launch high and it struck the dCM, who fell into the water. The dCM was recovered but had been fatally injured.
Weather and making a lee
While the weather conditions at the time with rough, choppy seas exceeded limits defined in both ship and launch procedures for operations in open waters, conditions in the lee of the large ship were sufficiently benign to allow safe personnel transfers. The ship’s main engine was also used to effect to make a lee on the starboard side as the anchored ship’s heading swung through its natural yaw. This provided 15-minute windows for safe transfers, and the accident occurred outside one of these windows while the master was attempting to make a lee.
Communications
Clear, unambiguous communications within and between workgroups are essential for the safe completion of any task. Specifically, this ensures that all participants:
have a shared understanding of the task, of what is expected and what is about to happen
know and understand their input into that task as well as their individual, and team, roles and responsibilities.
Formosabulk Clement’s personnel transfer required active and adaptable communications at all stages of the planning, co-ordination and control of the high-risk task. Difficulties maintaining optimal communications can arise with personnel who have not previously worked together, increased workgroup size, multiple workgroups of differing skill sets, multiple worksites, and different languages. These factors complicated the task on 9 August.
The personnel transfer operation comprised crew with roles and responsibilities in 4 closely linked, but distinct locations:
ship’s bridge
ship’s deck
launch cabin
launch deck
The crew in these locations were central to the co-ordination and safe management of the transfer, and safe completion of the task required clear communication between all of them. They were all aware of the overall objective and sequencing for the transfer but details of their individual and common plans for each step were not shared and agreed.
Multiple communication breakdowns occurred, resulting in the responsible crew at each location being unaware of the intentions or expectations of those at the other locations.
For example:
On the ship’s bridge—the master intended to manoeuvre the ship to re-create the lee and did not expect the launch to return alongside and did not know its skipper’s intentions.
On the ship’s deck—the dCM changed the departure plan, without informing others, including the master, and left the deck first. The intentions and expectations of the dCM were not known to anyone on the ship or the launch.
In the launch cabin—the skipper planned to bring the launch alongside and assess conditions before allowing anyone to board. They did not expect anyone to be on the pilot ladder.
On the deck of the launch—the deckhand was unaware of the skipper’s intention to only assess conditions. The deckhand expected boarding to take place once the launch was alongside and stable.
The opportunity to discuss the next phase of the operation while the launch was stood off from the ship was not taken. Had that time been utilised by the various participants to discuss and agree the next phase, the conditions would likely then have been favourable due to a lee and the dCM would have probably not been in the position they were at the time of the accident.
On this occasion, key personnel misinterpreted the actions and intentions of other parties. Both ship and launch crew assumed those on the other vessel understood what was happening and about to happen and were experienced in the transfer operation from each other’s perspective.
Pre-task information sharing and task understanding
The decision to conduct the personnel transfer was made several weeks before the event. There were explicit procedural requirements to seek and discuss operational requirements prior to the transfer, at least on the part of Formosabulk Clement. However, neither Formosa Plastics Marine Corporation (FPMC) nor Pacific Tug (PT) had specific guidance in place regarding the content of, or timing for, information to share with third parties regarding the specifics involved in the transfer of personnel to or from company vessels.
As a consequence, other than information related to the procedures and protocols required by shore agencies to prevent transmission of the COVID‑19 virus, only generic particulars such as time, location and boarding ladder positioning were exchanged in the lead up to the event. This in turn led to a situation where misunderstandings in, and differences between, plans could only be clarified while the transfer task was underway.
English is the international language for ship-to-shore communications[16] and masters and mates are required to demonstrate competence in its use.[17] Problems with language, translation and interpretation are known risks in international shipping that were not adequately mitigated on this occasion. Limitations of the ship’s officers’ English language ability were exposed when attempting to communicate complicated details of a dynamic situation, over radio, in a busy, noisy environment. In this case, the launch skipper resorted to enlisting the passengers to assist communications with the ship’s master in their native language. However, this removed the skipper from the communication loop and from developing a proper understanding about what the ship’s master and crew would do.
In general, standard procedures on both the ship and the launch emphasised the importance of establishing and maintaining effective communications, including communicating plans, requirements and expectations for the activity. However, the evidence indicates that there was no common or complete understanding of how the transfer would be conducted either within, or between, the crew of either vessel.
Formosabulk Clement
Multiple procedures on board Formosabulk Clement were in place for crew change operations. Crewmembers completed risk assessments and held meetings to share details, roles and responsibilities of the task. This provided the opportunity to reduce misunderstanding or miscommunication between those involved on board the ship.
Procedures also required a toolbox talk prior to the task and the crewmembers involved in the transfer recalled discussions prior to arrival and commencing the task. However, their different versions and details of those discussions did not indicate that the required distinct, formalised toolbox talk took place, potentially reducing its effectiveness.
Procedures also required that the launch’s risk assessment be obtained and discussed on board but this was not done. Consequently, the plans and discussions relating to the task were imprecise and did not include detail of how an individual was to safely transfer between the vessels and how this was to be controlled and co-ordinated. This contributed to the master losing understanding of what was happening on the ship’s deck and what the launch was doing and why. Most significantly, the dCM left the deck first and climbed down the pilot ladder without the master’s knowledge or approval.
Pacific Tug
Pacific Tug (PT) had considerable experience in conducting personnel transfers with procedures to support these operations. However, PT had not ensured that all involved personnel, within the company and external parties (such as ship masters), had an agreed, clear and complete knowledge and understanding of how this process would occur and progress.
As a consequence, when the launch skipper returned alongside the ship with the intent to assess conditions, their actions and plans were not clearly understood by all. Therefore, their intentions were not understood on board the ship (bridge or deck) or by the launch deckhand. Specifically:
the approaching launch was probably mistaken by the dCM as a signal to climb down the ladder in preparation to disembark
the master did not understand why the launch was returning before a lee had been provided and before being requested to return
the deckhand took it as confirmation that crew transfers were resuming.
Findings
ATSB investigation report findings focus on safety factors (that is, events and conditions that increase risk). Safety factors include ‘contributing factors’ and ‘other factors that increased risk’ (that is, factors that did not meet the definition of a contributing factor for this occurrence but were still considered important to include in the report for the purpose of increasing awareness and enhancing safety). In addition ‘other findings’ may be included to provide important information about topics other than safety factors.
These findings should not be read as apportioning blame or liability to any particular organisation or individual.
The following findings are made with respect to a crewmember’s fatal fall from Formosabulk Clement’s pilot ladder during crew transfer operations with the launch PT Transporter on 9 August 2021.
Contributing factors
Formosabulk Clement’s departing chief mate climbed down the vertical pilot ladder intending to board the crew transfer launch. They did this without the knowledge of the ship’s master or the skipper of the launch.
After the ship's master had manoeuvred the ship to create a lee and embark the joining crew from the launch, the ship yawed about the anchor, which exposed the transfer area to the prevailing weather.
Immediately before the accident, there were difficulties in communicating between the ship’s bridge and the launch. As a consequence, the main engine was not used to re-create a lee before the launch came back alongside the ship, and the transfer location was exposed to the weather.
A wave, larger than previously encountered, lifted the transfer launch higher than expected and sufficient to make contact with the departing chief mate, knocking them into the water.
On board Formosabulk Clement, communications plans and protocols for the crew transfer operation had not been sufficiently well implemented and agreed to ensure that deck and bridge personnel maintained awareness and understanding of what was occurring and what was about to occur.
On board PT Transporter, communications arrangements had not been sufficiently well implemented to ensure that events occurring as the crew transfer process progressed were clearly understood and agreed between its skipper and deckhand.
Neither vessel’s managers had ensured that the involved personnel had a common and complete understanding of how the personnel transfer would be conducted with respect to aspects including:
outlining task steps, limits and triggers such as agreed permissions for vessel movements
setting operational limits
defining terminology for key transfer-related communications.
The opportunity was not taken to share information well beforehand, which would have allowed differences to have been addressed and a single plan developed and agreed before the task was underway.
Safety action
Whether or not the ATSB identifies safety issues in the course of an investigation, relevant organisations may proactively initiate safety action in order to reduce their safety risk. The ATSB has been advised of the following proactive safety action in response to this occurrence.
Pacific Tug
Pacific Tug (PT) informed the ATSB that the company immediately ceased personnel transfer operations after this accident until a comprehensive review of such operations was conducted. PT sought a system of communication less constrained by language and amenable to being shared beforehand to assist in achieving the shared mental model of the task among all participants.
To that end, PT designed and implemented a traffic light system (red, amber and green states) for control of 2 separate aspects of the transfer process:
operational status—through the updated ‘operational risk assessment for personnel transfers to/from a PT vessel’ a range of preconditions were set which need to be met before the planned operation could commence. These preconditions included the setting of weather limits for each state as well as requirements on all involved vessels and crewmembers. The weather parameters are set prior to the launch leaving the wharf and then assessed against at the transfer location.
transfer status—indication of the status of the transfer as it is occurring and controlled by the crew of the transfer launch.
Green—transfers can occur as guided by launch crew
Amber—transfers to stop, personnel make safe, reassess conditions to determine next steps
Red—the transfer operation is stopped and not to recommence until the operational status preconditions are reassessed and met.
Transfer of personnel can only commence when both statuses are green, and masters of both vessels have agreed on the process and given permission.
PT procedures required that the operational risk assessment and a ‘personnel transfer procedure poster’ were shared with the vessel requiring the transfer of personnel. The poster outlined the traffic light system and actions to take in each situation. The masters of involved vessels, all personnel transferring and anyone assisting in the transfer were to provide confirmation that they understand and agree to the transfer protocols.
It was also emphasised that the master of the crew change vessel was to be in ultimate control for all transfers.
These procedural changes were supported by modifications to the launch (PT Transporter) through the fitting of red, amber and green indicator light sets: one in the passenger area and a second on the main mast. These light sets were designed to show the status of the transfer to persons on board both vessels. The launch crew (master and deckhand) each have remote controls for the lights.
During an extended transfer (many persons), the status was able to alternate between amber and green only. Red required a complete termination of the operation.
This personnel transfer process was further supported by updating of procedures including those for:
Risk assessment
Operational risk assessment for personnel transfers to/from a PT vessel
Personnel transfers
Formosa Plastics Marine Corporation
Following this accident, Formosa Plastics Marine Corporation (FPMC) notified the ATSB that the company had:
completed on board training and reassessment of risks relating to transfer of personnel to and from small vessels, including pilots
conducted investigations via a third party and internally
shared lessons learned throughout the FPMC fleet including a fleet circular outlining precautions for crew change at anchorage
amended the ‘personnel transfers procedure at sea’
held company safety meetings, including to senior shore management, to discuss the accident and outcomes.
Maritime Safety Queensland
Maritime Safety Queensland (MSQ) amended the COVID crew change procedure for vessels at anchor following the accident. The changes included that:
all crew transfers were to be conducted during daylight hours only, commencing after sunrise, completing before sunset
weather conditions were to be appropriately risk assessed by those involved prior to conducting the transfer
both the ship and the transfer vessel were to be provided a copy of the Maritime Safety Awareness Bulletin September 2019 – Safe Access to Vessels.
the transfer operations were to be appropriately risk assessed considering the competency and ability of all involved personnel (ship and launch) to complete transfers between vessels.
These conditions remained in place until COVID restrictions were eased in 2022.
Glossary
Beaufort scale
The Beaufort scale of wind force, developed in 1805 by Admiral Sir Francis Beaufort, enables sailors to estimate wind speeds through visual observations of sea states.
COVID-19
Coronavirus disease (COVID-19) is an infectious disease caused by the SARS-CoV-2 virus. (World Health Organisation—WHO)
Freeboard
The vertical distance between the waterline and the ship’s main deck.
International Maritime Organization. (www.imo.org)
Lee
this side or part of the ship that is sheltered or turned away from the wind
MLC
Maritime Labour Convention. The Maritime Labour Convention, 2006, as amended, (MLC), was adopted on 23 February 2006. and became binding international law on 20 August 2013. By December 2019 it had been ratified by 96 countries.
SMS
Safety management system. A systematic approach to organisational safety encompassing safety policy and objectives, risk management, safety assurance, safety promotion, third party interfaces, internal investigation and SMS implementation.
SOLAS
The International Convention for the Safety of Life at Sea, 1974, as amended.
STCW Code
Seafarer’s Training, Certification and Watchkeeping Code, International Maritime Organization, 1995.
VTS
Vessel traffic service. A VTS is any service implemented by a competent authority, designed to maximise the safe and efficient movement of water borne traffic within the jurisdiction. In Brisbane, VTS was the principal system by which the Regional Harbour Master managed the safe and efficient movement of vessel traffic approaching, departing and operating within the Brisbane VTS area.
Yaw
The ship’s head swinging from one side to the other.
Sources and submissions
Sources of information
The sources of information during the investigation included:
the master and crewmembers of Formosabulk Clement
the skipper and deckhand of PT Transporter
Formosa Plastics Marine Corporation
Pacific Tug
Wave Shipping
LBH Australia
Maritime Safety Queensland
Australian Bureau of Meteorology
Queensland Police Service
Australian Maritime Safety Authority
Marine Investigation Department of the Liberian Registry
Queensland Department of Environment and Science
Aus Ship P&I
Wilhelmsen Ships Service
Bhagwan Marine
Citizens Radio Emergency Service Teams
Submissions
Under section 26 of the Transport Safety Investigation Act 2003, the ATSB may provide a draft report, on a confidential basis, to any person whom the ATSB considers appropriate. That section allows a person receiving a draft report to make submissions to the ATSB about the draft report.
A draft of this report was provided to the following directly involved parties:
the skipper and deckhand of PT Transporter
Pacific Tug
Formosa Plastics Marine Corporation
the master of Formosabulk Clement
Maritime Safety Queensland
Australian Maritime Safety Authority
Marine Investigation Department of the Liberian Registry
Submissions were received from:
the skipper of PT Transporter
Pacific Tug
Formosa Plastics Marine Corporation
Maritime Safety Queensland
Australian Maritime Safety Authority
Marine Investigation Department of the Liberian Registry
The submissions were reviewed and, where considered appropriate, the text of the report was amended accordingly.
Purpose of safety investigations
The objective of a safety investigation is to enhance transport safety. This is done through:
identifying safety issues and facilitating safety action to address those issues
providing information about occurrences and their associated safety factors to facilitate learning within the transport industry.
It is not a function of the ATSB to apportion blame or provide a means for determining liability. At the same time, an investigation report must include factual material of sufficient weight to support the analysis and findings. At all times the ATSB endeavours to balance the use of material that could imply adverse comment with the need to properly explain what happened, and why, in a fair and unbiased manner. The ATSB does not investigate for the purpose of taking administrative, regulatory or criminal action.
Terminology
An explanation of terminology used in ATSB investigation reports is available here. This includes terms such as occurrence, contributing factor, other factor that increased risk, and safety issue.
Publishing information
Released in accordance with section 25 of the Transport Safety Investigation Act 2003
Ownership of intellectual property rights in this publication
Unless otherwise noted, copyright (and any other intellectual property rights, if any) in this report publication is owned by the Commonwealth of Australia.
Creative Commons licence
With the exception of the Coat of Arms, ATSB logo, and photos and graphics in which a third party holds copyright, this publication is licensed under a Creative Commons Attribution 3.0 Australia licence.
Creative Commons Attribution 3.0 Australia Licence is a standard form licence agreement that allows you to copy, distribute, transmit and adapt this publication provided that you attribute the work.
The ATSB’s preference is that you attribute this publication (and any material sourced from it) using the following wording: Source: Australian Transport Safety Bureau
Copyright in material obtained from other agencies, private individuals or organisations, belongs to those agencies, individuals or organisations. Where you wish to use their material, you will need to contact them directly.
[1]Limited to 11 months by the Maritime Labour Convention, 2006 (MLC), Regulation 2.4—Entitlement to leave and Regulation 2.5—Repatriation. The MLC provides the basic requirements for seafarer’s welfare regarding working and living conditions during employment. (www.ilo.org)
[2]All times referred to in this report are local time, Coordinated Universal Time (UTC) + 10 hours.
[4]Rivergate marina and shipyard is located in the Brisbane River about 10 miles upstream from the entrance beacons.
[5]A signal from the bridge to the engine room (usually via the engine telegraph and verbally confirmed) that the main engine is no longer required and it and its ancillary systems can now be shut down and cooled as required.
[6]Bridge logbook recorded weather throughout the afternoon and evening as fresh south-easterly breeze (force 5—17 to 21 knots) and moderate seas (waves to 3 m, swell to 4 m)
[8]Polymerase chain reaction testing or PCR testing was the type of test done most often in Queensland when testing for COVID-19. PCR testing looked for the genetic material of the virus in a sample taken from the person. As this test looked directly for the virus, it was the most accurate test for seeing whether a person was infected with the virus at the time the test was taken. (Queensland Health)
[9]The voyage data recorder for a cargo ship larger than 3,000 gross tons, constructed before July 2002 may be an S‑VDR.
[10]DCV class 1C—vessel use 1: Passenger vessel (13 or more passengers), operational area C: Restricted offshore operations: within 30 miles or 50 miles depending upon the area of Australia in which the vessel operates.
[11]The Beaufort scale of wind force, developed in 1805 by Admiral Sir Francis Beaufort, enables sailors to estimate wind speeds through visual observations of sea states.
On the night of 19 August 2021, the pilot of a Hawker Beechcraft King Air B200C aircraft, registered VH‑VAH and operated by Pel-Air, commenced the take-off from Essendon Fields Airport, Victoria on a medical retrieval flight to Albury, New South Wales. During the take-off, there was a reduction in power on the left engine and an uncommanded left yaw. The pilot initially managed the situation as an engine power loss and focused on maintaining directional control. However, when troubleshooting, the pilot identified that the left engine power lever had migrated rearwards to the idle position. In response, the pilot moved the power lever back to take‑off power and adjusted the friction lock to prevent further movement. The flight continued to Albury without further incident.
What the ATSB found
The ATSB found that the left engine power lever had migrated rearwards as the friction lock had not been sufficiently adjusted during the pre-flight checks. It was also established that power lever friction locks fitted to the Beechcraft King Air series aircraft required careful adjustment to prevent power lever migration, particularly during take-off. This was more prominent on the left engine, which was a characteristic generally known among King Air operators and pilots.
What has been done as a result
The operator provided additional training to all King Air pilots to demonstrate how the power lever system operated, when power lever migration could occur, and how to check that the friction locks were adequately adjusted to ensure the levers remain at take-off power. A component on friction locks was also included in the King Air pilot ground school training. In addition, the operator published a notice to air crew, which stipulated that all take-offs on sealed runways must be conducted using a standing start take-off. Further, the operator amended the take-off checklist for a standing start to include checking the friction locks to prevent a power lever migration during the take-off sequence.
The ATSB has released a safety advisory notice to all operators and pilots of King Air aircraft advising of power lever migration and the need to be aware of the careful adjustment required for the power lever friction lock.
Safety message
This incident highlights the importance of having a detailed understanding of the characteristics that may be specific to an aircraft type. In the case of the King Air series of aircraft, the design of the power lever system meant that the friction locks required careful adjustment to prevent power lever migration particularly during take-off.
Decisions regarding whether to conduct an investigation, and the scope of an investigation, are based on many factors, including the level of safety benefit likely to be obtained from an investigation. For this occurrence, a limited-scope investigation was conducted in order to produce a short investigation report and allow for greater industry awareness of findings that affect safety and potential learning opportunities.
The occurrence
On 19 August 2021, a Hawker[1] Beechcraft B200C King Air aircraft, registered VH-VAH and operated by Pel‑Air, was scheduled to depart Essendon Fields Airport, Victoria on a medical retrieval flight to Albury, New South Wales. On board was a pilot, paramedic, and doctor.
At about 2300 Eastern Standard Time,[2] the pilot began to prepare the aircraft for departure as per the before engine starting checklist. One of the requirements was to set the power lever friction locks. The pilot recalled moving the power levers to the mid-range position to gauge their movement and adjusted the friction locks to establish adequate friction. They also recalled that their usual practice was to check the friction locks were correctly set before take-off.
Soon after, the aircraft was taxied to the runway and the pilot commenced a rolling take-off with their left hand on the control column and right hand on the power levers. When at about 94 kt, the pilot moved their right hand onto the control column and rotated the aircraft. When about 50 ft above ground level, the aircraft suddenly yawed left. Automatic dependent surveillance-broadcast data showed the aircraft tracking immediately left from the runway. The paramedic also recalled being pushed to the right and the aircraft not being aligned with the runway. The pilot looked at the engine instruments and observed that the left engine was showing a power loss, but the right engine appeared to be producing take-off power. Based on these indications, the pilot managed the situation as an engine power loss.
The pilot recalled focusing on maintaining directional control by applying right aileron and rudder. They then assessed the reason for the power loss and whether the propeller was feathered,[3] which they believed it was not. The pilot scanned the cockpit again and observed that the left power lever had migrated rearwards towards the idle position. While moving the left power lever back in-line with the right power lever, the aircraft yawed right as the pilot was still applying right rudder. The power increased on the left engine, the pilot reduced application of right rudder and retracted the landing gear. Immediately after, the left power lever started moving rearwards again. The pilot re‑tightened the friction lock on the left power lever, which resolved the issue. At that time, the aircraft was climbing through 200-300 ft. The paramedic reported that the pilot said the power lever had migrated as the friction lock had not been correctly set.
The flight continued to Albury without further incident. The pilot noted the power lever migration on the aircraft’s maintenance log as that they believed the friction lock was not adequately functioning. The subsequent engineering inspection did not find any technical issues with the power lever assemblies and friction locks.
Context
Pilot information
The pilot held a valid Air Transport Pilot Licence (Aeroplane), multi-engine command instrument rating, and a type rating for the B200C obtained in July 2021. At the time of the incident, the pilot had accrued about 16,000 hours of total aeronautical experience, of which 42 hours were in the B200C.
Engine controls
The aircraft’s engines were controlled using 3 sets of levers located on the centre pedestal.
The 2 power levers controlled engine power from the idle position through to take-off power. When the levers were lifted and pulled aft over a gate, they controlled engine power for taxi operations, and over another gate for propeller reverse thrust to slow the aircraft after landing.
The 2 propeller levers controlled propeller speed (rpm). The propellers could be feathered by moving the relevant lever past detents and back to the aft most position.
Condition levers were used to select high or low idle, and to shut the engines down.
Friction locks
Four friction locks were located on the engine control pedestal. One each for the left and right power levers, one for the propeller levers, and one for the condition levers (Figure 1). The friction lock assemblies consisted of an adjustment mechanism, a phenolic drum, and a friction band. When the friction lock was rotated clockwise, the band around the phenolic drum tightened, which increased the friction between the 2 parts. The respective lever would become progressively resistant to movement, preventing the lever from moving out of position. When rotated counter‑clockwise, the lever moved freely. The design of the friction lock had been used since the 1965 model 88 Queen Air through to current production King Air aircraft.
Figure 1: Engine control levers and friction locks
Source: Pel-Air and Textron Aviation, annotated by the ATSB
A characteristic of the King Air friction locks was that they required careful setting as some aircraft had a narrow range between no friction and too much friction. The operator reported that there was no consistency in setting friction locks for a desired resistance between power levers in the same aircraft and other aircraft, and this changed over time due to wear. Worn friction locks were required to be replaced.
The maintenance log for the aircraft indicated that the left and right power lever assemblies, including both friction locks, were replaced in November 2020 after being observed to be worn, resulting in a reduced range of adjustment. Before the assemblies were replaced, pilots had reported to engineering staff that the friction locks were difficult to adjust.
The operator’s Flight Crew Operating Manual for the B200C aircraft included the following checklists where the friction locks were to be checked by the pilot prior to take-off:
Internal daily inspection: This checklist was completed prior to the first flight of the day[4] and included checking the power levers friction lock settings in the idle position.
Before engine starting: After the first flight of the day, the internal daily inspection was replaced by the ‘before engine starting’ checklist, which included a scan procedure beginning at the left side of the cockpit. This checklist required the power levers to be at idle and the friction lock setting checked. Further detail on how to adjust the friction locks was also included:
Place the power lever to the approximate position for take-off power and let go. If they roll back, set them again but tighten the friction.
The power levers have a spring retention configuration that increases resistance the more the levers are advanced. The result of this is the roll back of power levers if the friction lock is set too loose.
Before take-off: In the before take-off checklist, the pilot would check the friction locks were set. After this, there was no further requirements to check the locks.
These checklists were consistent with the manufacturer’s Pilot Operating Handbook. The ATSB noted that the handbook did not contain further detail on how to adjust the friction lock and the potential for power lever migration.
The operator advised the ATSB that in 2019, there were a number of reported rejected take-offs with serviceable aircraft with no faults found, which were assessed to be related to friction locks not being set correctly prior to take-off. As a result, the operator published an operations note to pilots about friction locks in the before take-off check for the King Air aircraft, with details about their proper adjustment. It was unknown if the incident pilot, who had commenced with the operator in 2021, was aware of this notice.
Power lever migration
Power lever migration on the King Air referred to an uncommanded spring back or migration of the lever towards the idle position. This was typically experienced when the pilot removed their hand from the levers during take-off. If unnoticed, this could result in the aircraft yawing towards the engine experiencing the power lever migration, a significant loss of propeller torque on that engine, and the auto-feather system disarming.[5]
This migration occurred when the friction locks were not appropriately set, and could affect King Air 90, 200 and 300 series aircraft. The propeller and condition levers were not susceptible to migration.
The cockpit to engine nacelle power lever control cables were connected to a cam assembly on the right side of each engine via a lever. This lever was spring loaded towards idle to prevent an uncommanded acceleration in the event of a power lever cable malfunction that could damage the engine when torque and temperature limits were exceeded. The springs also reduced the effect of hysteresis[6] when power was reduced, which could cause the rate one engine’s power reduced relative to the other to be different. An additional spring could be fitted during production or maintenance to further balance the rate of power reduction between both engines. This additional spring was not fitted to the incident aircraft. The effect of the springs migrating the power levers toward idle during normal operations was overcome by setting the friction locks.
In addition, as the power lever cables were connected to the right side of each engine, the cable for the left engine was shorter than the right, and therefore less affected by hysteresis. Due to this, if the friction locks were not correctly set, the left power lever could migrate further aft than the right, resulting in an uncommanded left yaw. The operator demonstrated this on the ground without the engines running. With both power lever friction locks loosened and the levers full forward, when they were released the left engine power lever migrated further aft than the right (Figure 2).
Figure 2: Power lever migration demonstration
Source: Pel-Air, annotated by the ATSB
Prior to the incident, the operator’s training for pilots converting to the B200C was limited to the operation of the friction locks. At interview, the pilot reported that they were new to the B200C aircraft type and unaware that power lever migration could occur during take‑off. Another pilot from the operator noted that, until a pilot experienced a power lever migration, then it could be difficult to know how much to tighten the friction locks.
In addition, the King Air magazine included articles that emphasised the importance of adjusting the friction locks adequately to avoid power lever migration. The articles also described techniques to check that the friction locks were set sufficiently to prevent migration.
Similar occurrences
A review of the ATSB database did not find any reported occurrences involving power lever migration on the King Air series aircraft relating to the adjustment of the friction locks, but the manufacturer stated that they had received such reports. Likewise, the operator’s pilots interviewed recalled they had experienced or heard of others having a similar event. The operator’s senior base engineer also indicated that power lever migration was a known issue.
A review of the operator’s safety management system database found 10 reports from the previous 5 years, 6 of which involved VH-VAH. For example, on 18 August 2021 (the day prior to the incident), VH-VAH was being operated on a patient transfer flight. During take-off, the aircraft lost partial engine power and yawed left. This occurred due to the left power lever migrating aft when the pilot under check moved their hand to the control column to rotate the aircraft. Both the check captain and the pilot under check immediately identified the reason for the loss of power. The check captain moved the power lever forward to full power while the pilot under check applied right rudder to maintain control, retracted the landing gear, and adjusted the friction lock when the aircraft was at safe height. The flight continued without further incident.
In addition, the operator advised the ATSB of another power lever migration occurrence involving a B200 aircraft after the occurrence that was the subject of this investigation. On 31 September 2022, the aircraft was being operated on a patient retrieval flight. During the take-off roll, the pilot detected a migration of the left power lever, resulting in an uncommanded yaw left. This occurred at about the time when the pilot removed their hand from the control column. The pilot rejected the take-off and the aircraft subsequently impacted the runway edge lights. Engineers replaced the throttle quadrant and the throttle friction assembly. Based on this event, the operator is conducting a review of their take-off procedure including simulator testing and research.
The ATSB also contacted another B200 operator who recorded 4 reports of power lever migration over the previous 5 years.
A review of the United States Aviation Safety Reporting System database found 3 reported power lever migration occurrences due to friction lock adjustment since 1988. In addition, there have been 2 notable international investigations where this was identified as a potential factor that contributed to the accident involving a King Air (detailed below).
On 23 December 2000, a Beechcraft B200 aircraft departed Blackbushe, United Kingdom to Palma, Spain on a private flight. Shortly after take‑off, the aircraft was observed to bank left before colliding into a factory complex 13 seconds later, resulting in a fire. All on board were fatally injured.
An examination of the aircraft did not identify any technical issues that would have contributed to the accident. However, analysis of the cockpit voice recorder showed a reduction in one of the propeller’s rpm as the aircraft rotated, which would have led to thrust asymmetry. The investigation concluded that, it was probable a migration of a power lever due to insufficient friction being set had occurred. It was also noted that the friction control had been slackened during recent maintenance and it was possible that it was not adjusted adequately by the pilot when doing their checks prior to take-off. As a result of the investigation, a safety recommendation was made to Raytheon Aircraft Company:
The Raytheon Aircraft Company should ensure that reference to the correct adjustment of power lever friction is suitably emphasised in the Beech 200 Aircraft Operating Manual (AOM) and the consequences of insufficient adjustment are not only highlighted in the AOM but also included in the recommended Beech 200 type training syllabus.
The ATSB was unable to find any follow-up action on this recommendation recorded in the investigation site.
On 30 June 2019, a Beechcraft King Air 300 departed Addison, Texas, United States, on a private flight. During take-off, the aircraft was observed to roll left before reaching a maximum altitude of 100 ft above ground level. It then descended and collided with a hangar in an inverted attitude about 17 seconds after take-off. All on board were fatally injured.
Analysis of the cockpit voice recorder showed that 7 seconds after take-off, the propeller speeds diverged, with the left propeller speed decreased to 1,688 rpm and the right propeller speed decreased to 1,707 rpm. An engineering examination did not identify any technical issues with the aircraft, but other evidence suggested a loss of thrust in the left engine was most likely experienced shortly after take-off.
While the reason for the reduction in thrust could not be conclusively determined, the investigation considered inadequate friction setting the most likely cause. It was noted that other circumstances, such as a malfunction within the power control system could have also resulted in a loss of engine thrust. However, the extent of damage to the power control system precluded determining the position of the power levers at the time of the loss of thrust or the friction setting during the flight.
Safety analysis
Uncommanded left yaw
Just after take-off at night, the pilot reported that the aircraft suddenly yawed left. This was consistent with the recorded flight path and the paramedic’s observations. When the yaw occurred, the pilot’s immediate response was to manage the situation as a left engine failure by applying right rudder and aileron to maintain directional control. The pilot then noticed the left power lever had migrated to the idle position and responded by pushing the power lever forward. After resetting the power lever friction lock, the flight continued without incident.
Insufficient friction applied
The friction locks were adjusted by the pilot to a level they believed to be sufficient prior to take-off. However, as the post-flight engineering inspection did not find any technical issues with the power lever and friction lock assemblies, and the left power lever had migrated twice during the take-off sequence, it was likely that the friction lock had not been sufficiently set during pre-flight checks. This was consistent with the paramedic’s recollection of the pilot indicating that the friction lock had to be re-set.
King Air friction lock characteristics
Due to the spring loading of the power levers on the King Air series aircraft, there was a tendency for the levers to migrate towards the idle position, particularly during take-off, if the friction locks were not appropriately set. This was more prevalent on the left power lever due to the shorter length of its cable. There was also an awareness of the possibility of a narrow range of adjustment, inconsistency in friction lock settings between the left and right engines, and from aircraft to aircraft, which could change due to wear.
While the incident pilot was not aware of the possibility of power lever migration, the need to carefully adjust the friction locks to prevent migration was more broadly known by B200C pilots and operators. This characteristic had been experienced among different operators and pilots as demonstrated in the reported occurrences and had also been considered as a potential factor in two fatal accidents.
Findings
ATSB investigation report findings focus on safety factors (that is, events and conditions that increase risk). Safety factors include ‘contributing factors’ and ‘other factors that increased risk’ (that is, factors that did not meet the definition of a contributing factor for this occurrence but were still considered important to include in the report for the purpose of increasing awareness and enhancing safety). In addition ‘other findings’ may be included to provide important information about topics other than safety factors.
These findings should not be read as apportioning blame or liability to any particular organisation or individual.
From the evidence available, the following findings are made with respect to the uncommanded power reduction involving Hawker Beechcraft King Air B200C, VH-VAH, Essendon Fields Airport, Victoria, on 19 August 2021.
Contributing factors
During a night take-off from Essendon Fields Airport, the left-engine power lever migrated to idle, which resulted in an uncommanded left yaw.
During the pre-flight checks, it was likely that the pilot applied insufficient friction to prevent the left power lever migrating.
The power lever friction locks fitted to the Beechcraft King Air series aircraft required careful adjustment to prevent power lever migration during take-off, particularly on the left engine. This characteristic was broadly known among operators and pilots.
Safety actions
Whether or not the ATSB identifies safety issues in the course of an investigation, relevant organisations may proactively initiate safety action in order to reduce their safety risk. All of the directly involved parties are invited to provide submissions to this draft report. As part of that process, each organisation is asked to communicate what safety actions, if any, they have carried out to reduce the risk associated with this type of occurrences in the future. The ATSB has so far been advised of the following proactive safety action in response to this occurrence.
Safety action by the Pel-Air
As a result of the incident, Pel-Air undertook the following safety actions.
Training
The engineering department and flight operations manager provided additional training to all King Air pilots demonstrating how the friction lock system worked, how power lever migration could occur, and how to check the friction locks were adequately adjusted. In addition, a course on power lever migration has now been included as part of the ground school pilot training for the King Air aircraft.
Revised take-off procedure
The day after the incident, the operator published a notice to air crew, which stipulated that all take-offs on sealed runways must be conducted using a standing start take-off. Further, the take‑off checklist for a standing start in the Flight Crew Operations Manual was amended to include a requirement for pilots to check that the friction locks were set to prevent power lever migration when take-off power had been set.
Safety advisory notice to King Air series aircraft operators
The Australian Transport Safety Bureau advises pilots and operators of the King Air series aircraft (90, 200, and 300) that the power lever friction locks require careful adjustment to prevent power lever migration towards the idle position, particularly during take-off. Inadvertent migration of one power lever towards idle can result in power reduction and yaw that, when occurring at low height, can result in catastrophic outcomes. Operators should ensure pre-flight checks provide opportunities to confirm friction lock settings before the take-off run, and ensure pilots have adequate knowledge of friction lock sensitivity to help prevent and recover from inadvertent power lever migration.
Sources and submissions
Sources of information
The sources of information during the investigation included:
the pilot
the paramedic
Pel-Air
Textron Aviation (type certificate holder)
United States National Transportation Safety Board.
Submissions
Under section 26 of the Transport Safety Investigation Act 2003, the ATSB may provide a draft report, on a confidential basis, to any person whom the ATSB considers appropriate. That section allows a person receiving a draft report to make submissions to the ATSB about the draft report.
A draft of this report was provided to the following directly involved parties:
the pilot
the paramedic
Pel-Air
Textron Aviation
United States National Transportation Safety Board.
A submission was received from Pel-Air. The submission was reviewed and, where considered appropriate, the text of the report was amended accordingly.
Purpose of safety investigations
The objective of a safety investigation is to enhance transport safety. This is done through:
identifying safety issues and facilitating safety action to address those issues
providing information about occurrences and their associated safety factors to facilitate learning within the transport industry.
It is not a function of the ATSB to apportion blame or provide a means for determining liability. At the same time, an investigation report must include factual material of sufficient weight to support the analysis and findings. At all times the ATSB endeavours to balance the use of material that could imply adverse comment with the need to properly explain what happened, and why, in a fair and unbiased manner. The ATSB does not investigate for the purpose of taking administrative, regulatory or criminal action.
Terminology
An explanation of terminology used in ATSB investigation reports is available here. This includes terms such as occurrence, contributing factor, other factor that increased risk, and safety issue.
Publishing information
Released in accordance with section 25 of the Transport Safety Investigation Act 2003
Ownership of intellectual property rights in this publication
Unless otherwise noted, copyright (and any other intellectual property rights, if any) in this report publication is owned by the Commonwealth of Australia.
Creative Commons licence
With the exception of the Coat of Arms, ATSB logo, and photos and graphics in which a third party holds copyright, this publication is licensed under a Creative Commons Attribution 3.0 Australia licence.
Creative Commons Attribution 3.0 Australia Licence is a standard form licence agreement that allows you to copy, distribute, transmit and adapt this publication provided that you attribute the work.
The ATSB’s preference is that you attribute this publication (and any material sourced from it) using the following wording: Source: Australian Transport Safety Bureau
Copyright in material obtained from other agencies, private individuals or organisations, belongs to those agencies, individuals or organisations. Where you wish to use their material, you will need to contact them directly.
[1] At the time of VH-VAH’s manufacture in 2010, the type certificate holder for the Beechcraft King Air series was Raytheon Aircraft Company, operating under the Hawker Beechcraft brand name. Textron Aviation has been the type certificate holder for the Beechcraft King Air series since 2014.
[2] Eastern Standard Time (EST): Coordinated Universal Time (UTC) + 10 hours.
[3] Feathering reduces drag following an in-flight engine failure or shutdown by increasing the angle of the propeller blades until they are parallel with the aircraft’s line of flight.
[4] The incident flight was the tenth flight of the day.
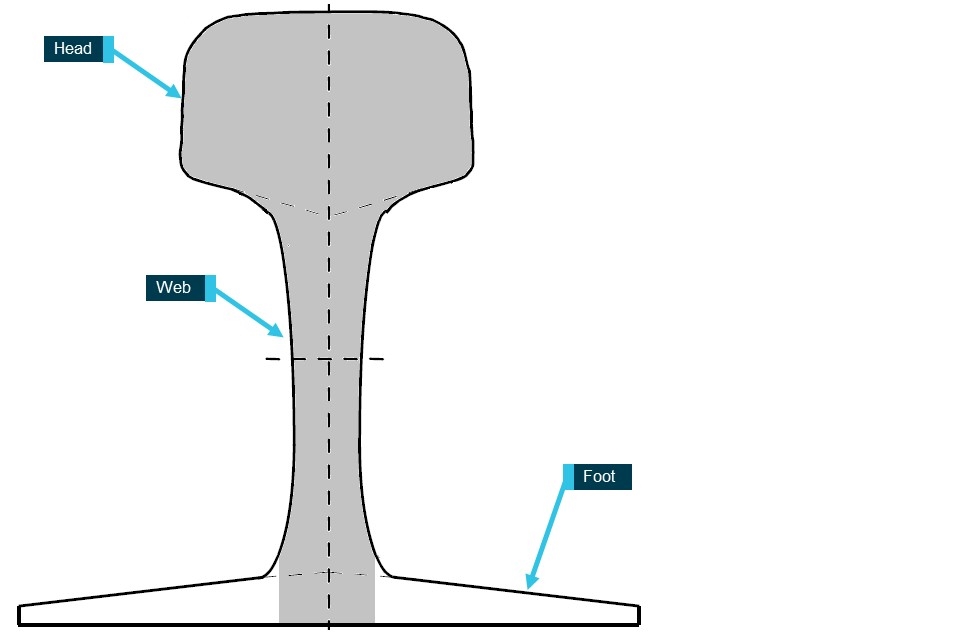
[5] The auto-feather system automatically feathered the propellers in the event of an engine failure. If the power lever moved back past the 90% engine speed position, the auto-feather system would disarm.
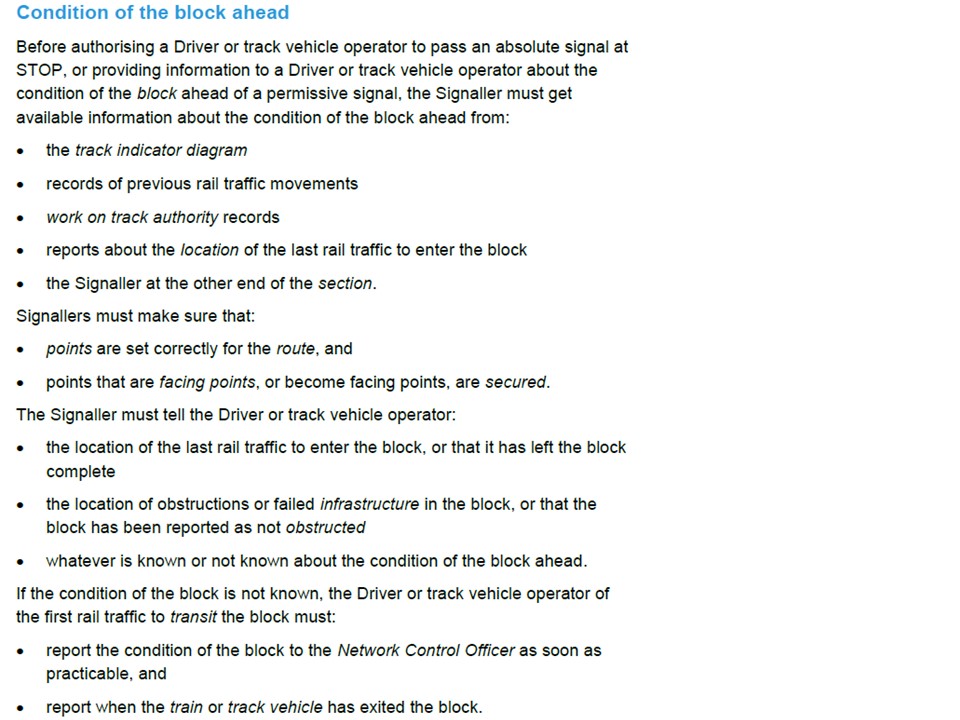
[6] In this context, hysteresis is the lost motion (or backlash) in the cables used in the power control system. For a given input by the pilot, the cable’s movement may be impeded mechanically by friction and/or non-linear movement of the cable within its housing.