Aircraft performance and cockpit visibility study supporting investigation into the mid-air collision involving VH-AEM and VH-JQF, near Mangalore Airport, Victoria on 19 February 2020

Final

Safety summary

What was done

As part of the investigation into the mid-air collision involving Piper PA-44-180 Seminole, VH-JQF, and Beech D95A Travel Air, VH-AEM, near Mangalore Airport, Victoria, on 19 February 2020 (AO-2020-012) the ATSB identified concerns around the pilots' ability to visually identify the other aircraft in time to take avoiding action.

In response to this, the ATSB initiated an aircraft performance and cockpit visibility study to determine at what times the aircraft may have been visible to the crew of the opposing aircraft.

This assessment involved the review of available literature covering the see and avoid concept, the techniques used to assess visibility and analysis of the recorded automatic dependent surveillance broadcast (ADS-B) data from each aircraft. Exemplar aircraft were modelled, and this information was used to calculate the positions of aircraft structure relative to the pilots’ eye positions. This, combined with the analysed ADS-B data, was used to perform an assessment of the size and location of the other aircraft in the pilots’ field of view. Following this an assessment of the benefits of ADS-B IN systems for the purposes of enhancing a pilot’s mental model was undertaken. Finally, using this information an animation was developed that represented the flights from the perspective of each of the pilots involved. The animation also includes a cockpit display of traffic information to demonstrate the benefits ADS-B IN information could have provided for the early detection of the conflicting traffic.

What the ATSB found

The study found that the pilots of both aircraft were unlikely to have acquired the other aircraft visually due to meteorological factors, aircraft closing speed and shielding of the opposing aircraft by cockpit structure with 2 of the 4 pilots likely having the opposing aircraft shielded from their view at key moments. The ATSB analysis indicated that even in clear conditions, more favourable to visual acquisition, the closing speed and shielding by the aircraft structure would have limited opportunities to acquire the other aircraft.

Neither accident aircraft was equipped with ADS-B IN systems. The study shows that had the aircraft been equipped with this technology the pilots would have been alerted to the position of the other aircraft much earlier than by visual acquisition. Both a cockpit display of traffic information with an ADS-B traffic alerting system or an electronic conspicuity device connected to an electronic flight bag application could have provided this. While effective radio communication remains the primary means of self-separation in non-controlled airspace, the targeted and accurate information provided by ADS-B IN can provide the pilot significant assistance.

Safety message

To ensure that a pilot’s mental models of conflicting traffic is accurate, they should use all available information, including the rules of the air, radio, air traffic control (ATC) services and visual scanning to locate and separate from other traffic. Where a visual scan is being used, pilots should always remember to move the whole head to avoid approaching traffic being shielded behind structure within their field of view.

The proliferation of relatively low-cost ADS-B IN and ADS-B OUT equipment, whether inbuilt or in conjunction with electronic flight bag applications on personal electronic devices can provide a significant improvement in this capability. With ADS-B IN and ADS-B OUT installed, aircraft can be more certain of the location of traffic, particularly outside ATC radar and ADS-B ground station coverage areas.

Acknowledgements

The ATSB acknowledges the assistance of the United States National Transportation Safety Board Office of Research and Engineering, the RTCA (formerly Radio Technical Commission for Aeronautics), Moorabbin Air Services and Yarra Valley Aviation in the development and preparation of this study.

Introduction

This safety study is presented in 4 sections:

  • Introduction
  • Background - contains relevant contextual information related to the occurrence, technologies, and other relevant supporting information.
  • Methodology and results - assesses and presents analysis of the ‘Background’ information
  • Conclusions.

This study does not contain findings, however relevant conclusions and supporting information were considered as part of the safety analysis for AO-2020-012 and influenced relevant findings for that investigation.

Background

On 19 February 2020 Piper PA-44-180 Seminole, VH-JQF (JQF), and Beech D95A Travel Air, VH-AEM (AEM) collided in mid‑air 8 km south of Mangalore Airport, Victoria. At the time of the collision AEM was inbound to Mangalore Airport on an instrument rating training flight, with an instrument rating student and an instructor on board. JQF had recently departed Mangalore Airport for an instrument rating examination flight with a pilot under examination and an examiner on board.

This was the first mid-air collision between 2 civil‑registered aircraft operating under the instrument flight rules (IFR) in Australia. As the collision was outside of controlled airspace, air traffic control (ATC) was required to provide traffic information on other IFR aircraft, but not ensure separation. This meant that the pilots were self-separating using radio communications and, where possible, the ’see and avoid’ principle. A key part of the investigation was to determine the likelihood that the pilots of each aircraft could detect the other in sufficient time to take avoiding action. Multiple papers and studies conducted by agencies and organisations around the world, including the ATSB, have identified significant limitations with the ’see and avoid’ principle.

The ATSB sought to establish what influence the position and performance of the aircraft, the cockpit structure and human performance limitations had on the pilots’ ability to detect traffic. Further, the ATSB sought to determine what effect an automatic dependent surveillance broadcast (ADS-B) IN system would have had on the pilots’ ability to detect traffic as they converged.

In Australia IFR aircraft are required to be equipped with ADS-B OUT, primarily to increase ATC surveillance service coverage. ADS-B OUT data can also be received and processed for traffic information by aircraft fitted with ADS-B IN systems. Neither aircraft involved in this accident were fitted with ADS-B IN equipment.

The ATSB consulted the United States National Transportation Safety Board (NTSB) Office of Research and Engineering following their study of a mid-air collision that occurred near Ketchikan, Alaska. That study included an animation that replicated the flight paths and view from each aircrafts’ cockpit and simulated the aircrafts’ ADS-B IN traffic displays.

That NTSB study was one of many they performed looking at the effects of cockpit visibility and aircraft performance in mid-air collisions. The ATSB sought the guidance of performance specialists at the NTSB as to the process used to carry out their study. Based on that advice the ATSB gathered location, aircraft and performance data from operators, manufacturers, Airservices Australia (Airservices), and the Civil Aviation Safety Authority (CASA), to conduct this study.

Aim

The aircraft performance and cockpit visibility study sought to understand the performance characteristics of AEM and JQF in the lead up to the mid-air collision to produce a virtual recreation of the flights. Human performance and aircraft structural obscuration were then considered to determine the pilots’ ability to detect the other aircraft. The study also considered the role an ADS-B IN system could have played in increasing the opportunity for timely detection of traffic.

Scope

This study was conducted as part of the analysis for investigation AO-2020-012 Mid-air collision involving Piper PA-44-180 Seminole, VH-JQF and Beech D95A Travel Air, VH-AEM, 8 km south of Mangalore Airport, Victoria on 19 February 2020. The flight data used for the study was primarily the raw ADS-B data broadcast from each of the aircraft.

The investigation found that the collision likely occurred in or close to cloud, limiting the ability of the pilots in each aircraft seeing the other aircraft. However, this study also considered the likelihood for visual acquisition had better weather conditions existed.

Methodology

The methodology for this study is based on similar studies performed by the NTSB Office of Research and Engineering. The completion of the study consisted of the following steps:

  1. A literature review looking at available information related to human visibility and perception characteristics, aircraft tracking and collision avoidance technologies and aircraft specifications.
  2. Calculation of the aircrafts’ position and performance characteristics using applicable aircraft information and available recorded data, in this case ADS-B data.
  3. Development of scale 3-dimensional models of the internal and external structures of representative aircraft using laser scanning technologies and determination of the pilot’s approximate eye position within each model.
  4. Development of 2-dimensional representations of each pilot’s view of the aircraft structure. The relative position of the other aircraft was located on this representation to determine when it would have been shielded from the pilot’s view.
  5. Based on the literature review and consultation with ATSB human factors specialists, human performance was considered to determine where and when the pilots may have been able to detect the other aircraft.
  6. Additional technologies were explored to establish what role these could have played in increasing the pilot’s ability to detect the other aircraft prior to the collision.
  7. Finally, an animation was developed using position and performance data showing the cockpit view for both pilots in each aircraft overlaid with exemplar cockpit traffic displays and alerts (not fitted to the accident aircraft). This was supplemented by recorded air traffic control data.

Notes

  • Throughout this report standard aviation units are used unless specifically stated. These units are nautical miles for distance, feet for altitude and knots (nautical miles per hour) for speed.
  • All times in this report are referenced to Eastern Daylight‑saving Time (EDT - Universal Co‑ordinated Time (UTC) + 11 hours), which was the accident location time zone.
  • This report is intended to support the AO-2020-012 investigation report and should be read in conjunction with, and in the context of, that report. It relies and expands on factual content presented in that report.
  • Unless specifically stated otherwise, any reference to the ’investigation report’ should be taken as referring to the ATSB AO-2020-012 investigation report. 

Background

Aircraft Information

AEM

As described in the aircraft information section of the investigation report:

The Beech D95A Travel Air is a 4 to 6 seat, low wing, retractable-tricycle-undercarriage aircraft fitted with 2 180 horsepower Textron Lycoming IO-360-B1B reciprocating engines driving constant speed, two-bladed propellers.

AEM [Figure 2] was manufactured in the United States in 1966 with serial number TD 682. It was first registered in Australia in 1967, and prior to the departure from Tyabb, the aircraft had accumulated 7,400.3 hours in service.

The aircraft was certified for IFR and charter operations and was equipped with dual controls for the student and instructor. The aircraft was also equipped with a Garmin GNS530 radio communication and GNSS navigation system, together with a second communication radio. The aircraft was also fitted with a Garmin GTX335 ADS-B OUT transponder. AEM did not have any ADS-B receiving equipment.

To determine where and when JQF would have been in the view of AEM’s pilots, the positions of both aircraft, AEM’s Euler angles [1] (pitch, roll and yaw) and the location of AEM’s cockpit structure, relative to the pilots’ eye positions, were required.

The positions of JQF and AEM were calculated from available ADS-B data (see the section titled Position estimation) and the location of each aircraft’s cockpit structure was developed from laser scans of exemplar aircraft (see the section titled Aircraft modelling). No recorded data was available for the Euler angles of either aircraft. These were calculated from the aircraft’s position and a range of aerodynamic and physical properties of the aircraft (see the section titled Calculation of Euler angles). These properties included aircraft weight, wing area and the lift co-efficient as a function of the angle of attack (lift-curve). Figure 1 shows the 3‑view diagram of the Travel Air from the aircraft’s maintenance manual.

Figure 1: Travel Air 3‑view diagram
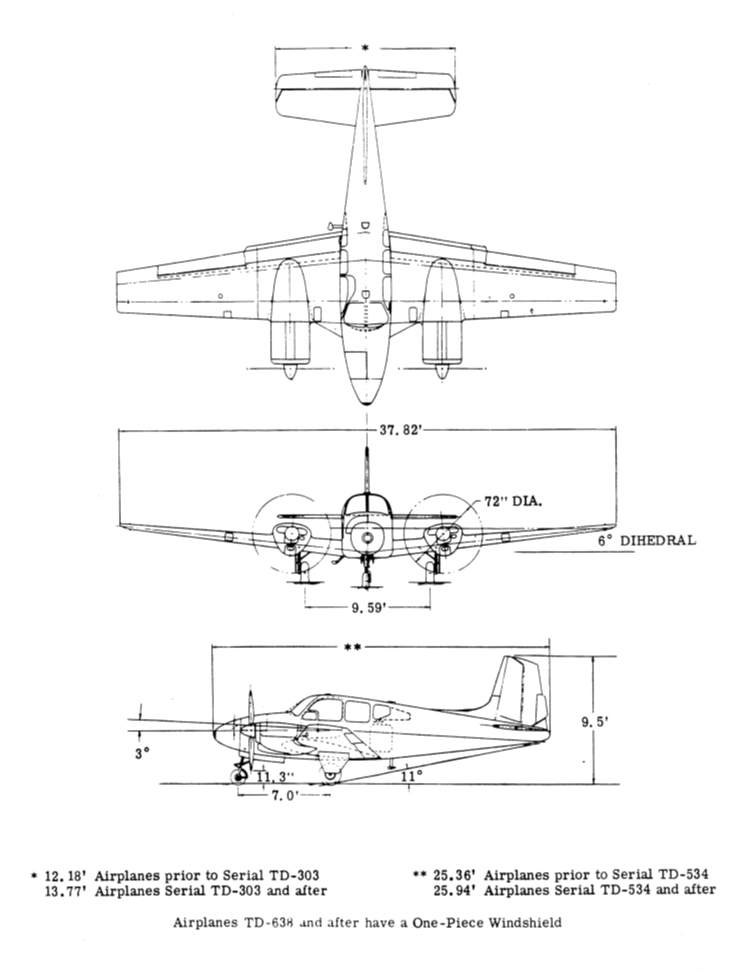
Figure 1: Travel Air 3 view diagram

Source: Aircraft manufacturer

Figure 2: Travel Air VH-AEM
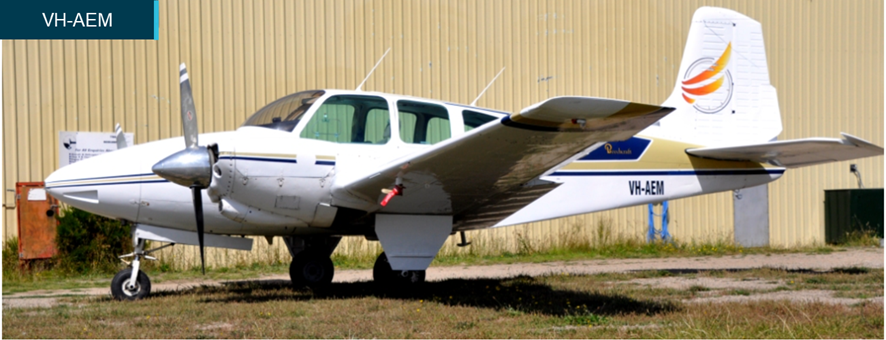
Figure 2: Travel Air VH-AEM

Source: Aircraft operator, annotated by the ATSB.

Lighting

The initial airworthiness requirements for the Travel Air outlined the type, intensity, colour, and visibility arcs, in both the horizontal and vertical planes, of the various position lights around the aircraft. The ATSB confirmed that the lighting installed on AEM was in accordance with these requirements.

Position lights, also referred to as navigation lights, are primarily designed for identifying location and orientation at night and their usefulness during the day, is relatively low due to their low intensity. Therefore, they were not expected to be operational at the time of the collision.

In addition to position lights AEM was equipped with upper and lower beacons (flashing red lights). These beacons were required by regulation 196 of the Australian Civil Aviation Regulations (CAR) to be used when an aircraft is in flight or operating on the manoeuvring area of an aerodrome at night or in low visibility. However, the performance standards or intensity of this lighting was not defined. As a result, its effectiveness in aiding visual acquisition was not able to be determined.

The aircraft was not fitted with strobe lights. No further information was available as to the lighting that was installed on the aircraft or its intensity at the time of the accident.

Speed slope windscreen

The factory design of the Travel Air included a two-piece windscreen with a defined centre spline separating left and right panels. Since the introduction of the aircraft, the United States Federal Aviation Administration (FAA) has issued multiple supplemental type certificates (STC) relating to the replacement of the windscreen with a single piece, as was standard for later models of this type of aircraft.

Sometime prior to 1976 AEM was modified with an updated single piece ’speed slope’ windscreen. Due to the age of the modification, the actual date that it was carried out and what STC it was carried out under could not be confirmed. This modification made 2 changes that affected the pilot’s visibility. In addition to removing the centre spline of the windscreen it increased the slope of the screen moving its intersection point with the front of the fuselage further forward and increasing the size of the glareshield required to fill the space between the instrument panel and the windscreen.

JQF

As described in the aircraft information section of the investigation report:

The Piper PA-44 Seminole is a four-seat, low-wing, twin-engine light aircraft. It is powered by 2 180 horsepower Textron Lycoming O-360-E1A6D reciprocating piston engines. JQF [Figure 3] was fitted with three-blade, constant speed and full-feathering aluminium propellers.

The Seminole is equipped with hydraulically operated, retractable, tricycle landing gear. JQF was manufactured in the United States in 1979 with serial number 44-7995291. It was first registered in Australia in 1990. The aircraft was owned by the operator. Prior to the accident flight, the aircraft had accumulated a total flight time of 11,190.6 hours.

The aircraft was certified for IFR and charter operations. It was equipped with dual controls for the student and instructor. The aircraft was also equipped with a Garmin GNS430 radio communication and GNSS navigation system and a second communication radio. The aircraft was fitted with an Appaero Stratus Mode-S transponder unit, which had ADS-B OUT transmit capability only.

To determine where and when AEM would have been in the view of JQF’s pilots, the process applied to AEM for calculation of Euler angles and location of the cockpit structure and pilots eye position was also applied to recorded position data for JQF.

Figure 4 shows the 3‑view diagram of the Seminole from the aircraft’s maintenance manual.

Figure 3: Seminole JQF
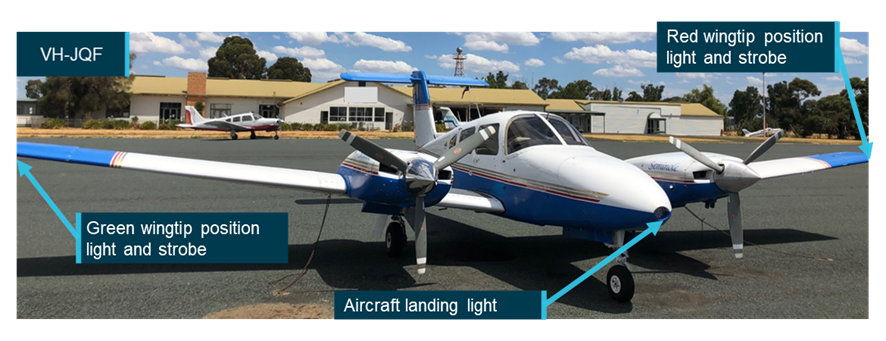
Figure 3: Seminole JQF
Source: Aircraft operator, annotated by the ATSB.
Lighting

The initial airworthiness requirements for the Piper PA-44-180 defined the requirements and specifications for lighting fitted to the aircraft. The aircraft was certified under Part 23 of the Federal Aviation Regulations in 1978. Under this certification the aircraft was required to be fitted with an anti-collision lighting system if being used for night operations. This system was required in addition to the aircraft’s position lights. Colourisation must be in either aviation red or aviation white and the required intensity is described formulaically depending on flash intensity. Minimum required intensity above or below the vertical plane is stated as 400 candela between 0‑5°, 240 candela between 5‑10°, 80 candela between 10‑20° and 40 candela between 20‑30°.

The ATSB determined that JQF was fitted with wingtip strobes that were integrated with the position lights. As per procedure, navigation lights would not have been switched on during the day. However, the anti-collision lights were switched separately in the cockpit and examination of the wreckage indicated that these lights were likely to have been on at the time of the collision. The wingtip lights (Figure 3) were Whelen A650PGD1 and A650PRD1 with the ‘R’ and ‘G’ indicating the colour of the position light.

In addition to these lights the aircraft was also fitted with a Whelen Prometheus Plus PAR36 landing light (Figure 3) rated for an intensity of 60,000 candela. To avoid this light interfering with the flight crews’ vision it was set back in the front nose cowl of the aircraft. This reduced its ability to be seen at certain angles away from directly in front of the aircraft. The operator reviewed the light determining that the beam extended 20° either side of straight ahead. The light was visible at 40°, but it was difficult to determine if the light was on. Beyond 70° the light was not visible.

Under procedures outlined in the En-Route Supplement Australia (ERSA) for operating in the vicinity of Mangalore Airport, the landing light should have been switched on within 10 NM of the airport or in the training area. Wreckage examination indicated that the landing light was likely on at the time of collision.

Figure 4: PA-44-180 3 view diagram
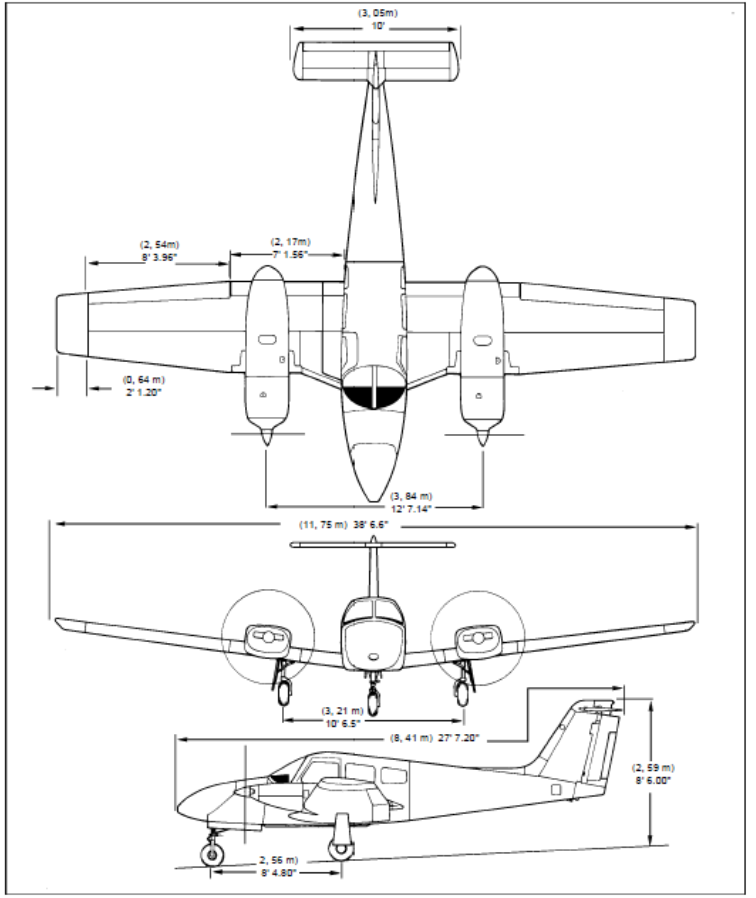
Figure 4: PA-44-180 3 view diagram

Source: Aircraft operator

Recorded Data

As part of the investigation the ATSB reviewed ADS-B data, radar data and ATC recordings provided by Airservices. Data was also collected from an electronic flight bag (EFB) application that was in use by the student pilot of AEM. The EFB data did not provide any additional information so was not considered for further analysis in this study. Neither aircraft was equipped with a flight data recorder or a cockpit voice recorder, nor were they required to be, due to their size and type of operation. No data was recoverable from any of the instruments on board either aircraft.

Recorded ADS-B data

The ATSB obtained 2 data sets from Airservices: filtered data (combined ADS-B and radar) and raw ADS-B data. The filtered data is used for ATC display and alerting functionality and is filtered to approximately 5 second intervals.

Raw ADS-B data records every signal received by ground stations from ADS-B equipped aircraft. These transmissions from each aircraft are at approximately 0.5 second intervals but are not uniform to avoid simultaneous transmission with other aircraft and subsequent data loss.

Further discussion of the operation of ADS-B can be found in the ADS-B and Position estimation sections.

Figure 5 shows the comparison between the raw ADS-B data and filtered data. Due to scaling requirements only the last 20 seconds of AEM’s flight path is shown. All data recorded from JQF’s take-off until the collision is shown. For display, data has been converted to rectangular cartesian co-ordinates with the threshold of runway 05 at Mangalore Airport used as the reference point for the data (an explanation of this process can be found in the Position estimation section). For each point of the filtered data the time and the altitude recorded are shown.

The ATSB analysis of the data also calculated the collision altitude. This analysis determined that the aircraft were at approximately 4,125 ft above means sea level at the point of collision (see the section titled Position information for further detail).

It was noted that in the filtered data there were points beyond the end of the raw data and the estimated collision location. This was due to a projection capability within the Airservices system that accounts for short term loss of signal by estimating the position of the aircraft based on previous track and speed information.

Air traffic control recordings

The ATSB obtained and reviewed air traffic control recordings of communications between Melbourne Centre air traffic controllers and aircraft in the area. The Mangalore Airport common traffic advisory frequency (CTAF) was not recorded. Table 1 shows the communications between air traffic control and both AEM and JQF on the Melbourne centre frequency during the flight. Figure 5 shows the location of JQF at the time the departure call to the controller was initiated.

Figure 5: Raw ADS-B and filtered data comparison [2].
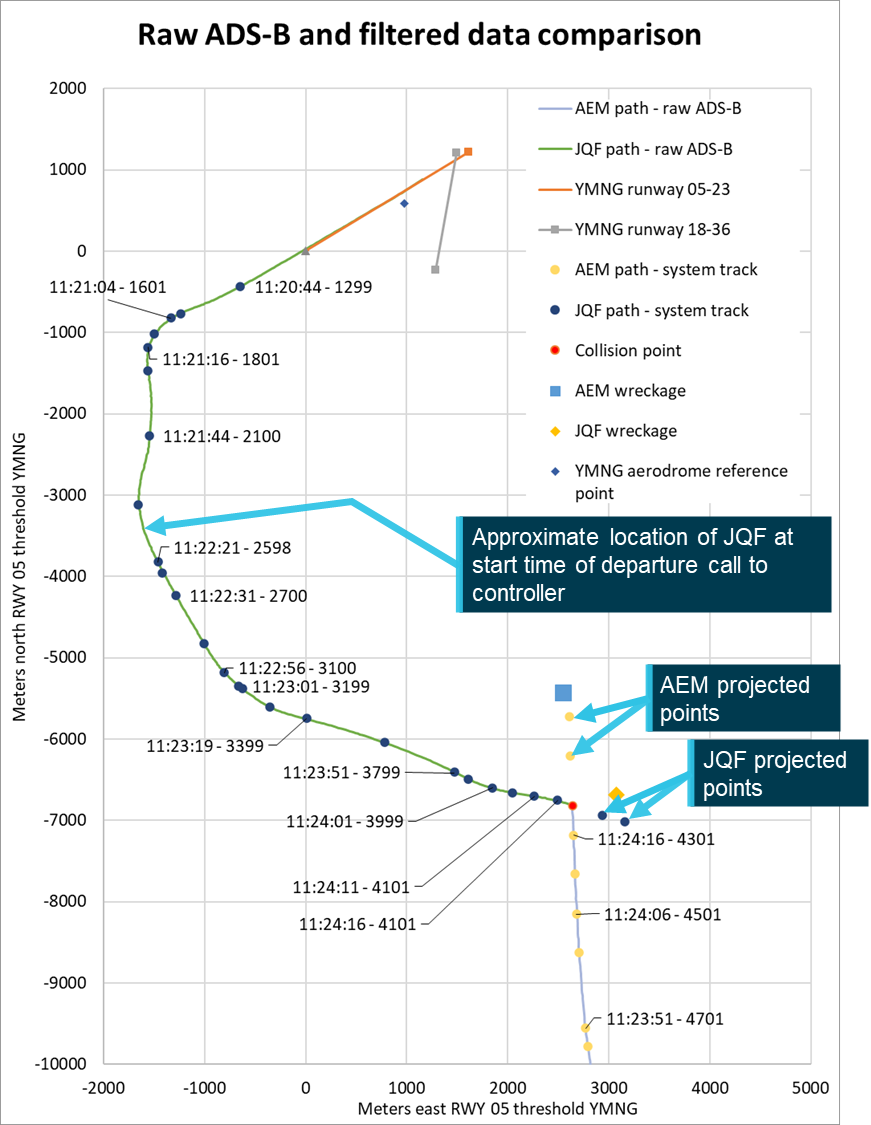
Figure 5: Raw ADS-B and filtered data comparison1F .

Source: ATSB

Table 1: Key traffic information on Melbourne Centre frequency

Time start

(*indicates approximate time)

Time end

(*indicates approximate time)

AircraftComment
1111:211111:32JQFTaxi call
1117:421117:55AEMInitial contact with controller on entry to airspace. Area QNH provided and advice of no reported IFR traffic.
1119:351119:54AEMController contacted with information about commencing descent from 6,000 ft and establishing a SAR time for airwork in the Mangalore area. Advice of no reported IFR traffic provided by the controller.
1120:0711:20:08AEMController called the pilots of AEM to pass traffic. No response received.
1120:151120:28AEMController again called the pilots of AEM. Pilot responded and traffic information about JQF shortly to depart Mangalore was passed and acknowledged.
11:22:191123:00JQF

Departure report to controller. Information was provided that the aircraft was passing 2,700 ft on climb to 7,000 ft and tracking to LACEY. Controller advised the pilots that AEM was inbound to Mangalore in JQF’s 12 o’clock position, for airwork, passing 5,000 ft on descent to not above 4,000 ft.

During this conversation a STCA[3] for proximity between AEM and JQF activated and was acknowledged by the controller.

1123:511124:09 STCA for AEM and JQF. Controller zoomed in on screen and acknowledged the STCA at 1124:09.
1124:20  Approximate time of collision

Source: Airservices, annotated by the ATSB

Meteorological Information

The study considered the effect cloud, background luminosity, wind and sun position may have had on the pilots’ ability to detect the approaching aircraft.

Cloud information

The ATSB reviewed both the forecast and actual cloud conditions for Mangalore Airport at the time of the collision. The Mangalore Airport automatic weather service (AWS) recorded 2 layers of cloud, one scattered at approximately 3,500 ft above ground level (AGL) and a second layer, broken at approximately 4,200ft AGL. To verify this information imagery from Bureau of Meteorology (BoM) weather cameras at Kilmore Gap and Wahring Field were reviewed. Further imagery was provided from a Victoria Police Air Wing helicopter taken 1 hour and 16 minutes after the accident. It indicated that the cloud layer was between approximately 4,050 ft and 4,900 ft above mean sea level with some patchy cloud below this. Figure 6 and Figure 7 show the Kilmore Gap and Wahring Field weather cameras. Figure 8 and Figure 9 show the Victoria Police Air Wing images and Figure 10 shows the approximate locations of these photos relative to the estimated collision point.

Figure 6: Weather camera image from Kilmore Gap
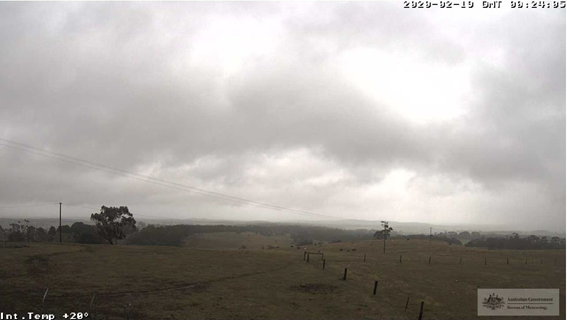
Figure 6: Weather camera image from Kilmore Gap

Source: BoM

Figure 7: Weather camera at Wahring Field
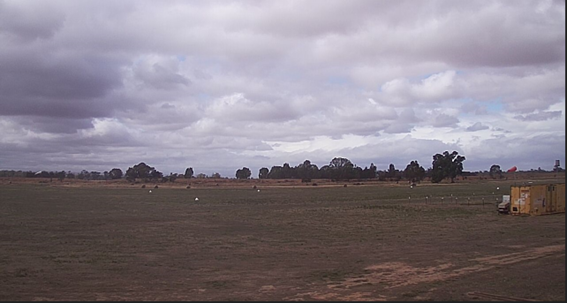
Figure 7: Weather camera at Wahring Field

Source: BoM

Figure 8: View of base of cloud from the Victoria Police Air Wing helicopter taken approximately one hour after the accident (altitude approx. 4,000 ft)
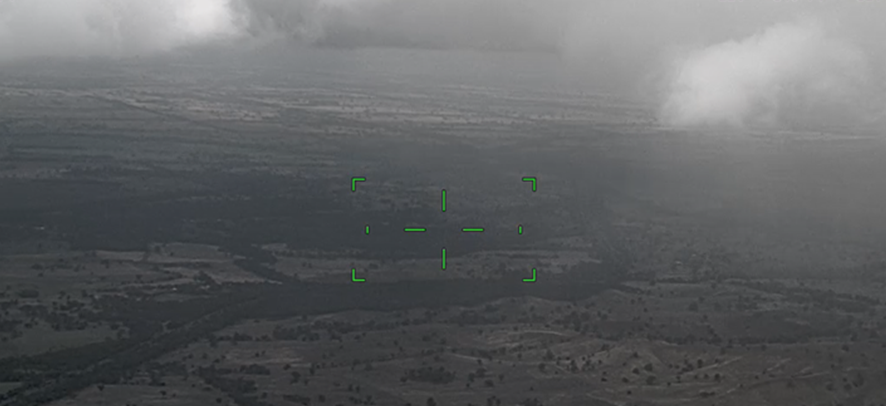
Figure 8: View of base of cloud from the Victoria Police Air Wing helicopter taken approximately one hour after the accident (altitude approx. 4,000 ft)

Source: Victoria Police

Figure 9: View of top of cloud from the Victoria Police Air Wing helicopter taken approximately one hour after the accident (altitude approx. 4,900ft)
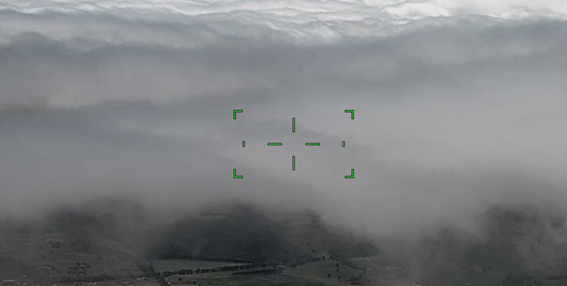
Figure 9: View of top of cloud from the Victoria Police Air Wing helicopter taken approximately one hour after the accident (altitude approx. 4,900ft)

Source: Victoria Police

Figure 10: Weather imagery locations relative to Mangalore Airport and the collision point
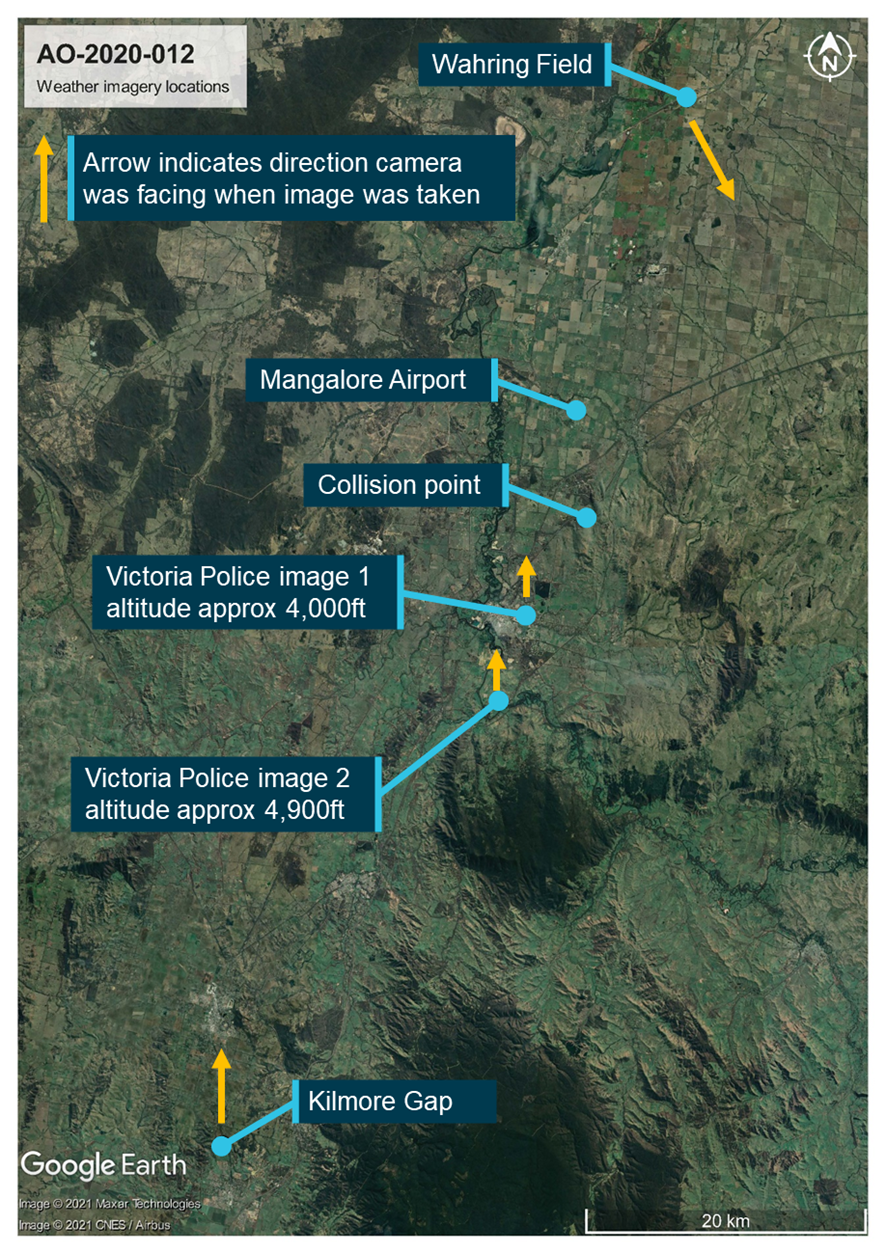
Figure 10: Weather imagery locations relative to Mangalore Airport and the collision point

Source: Google Earth, BOM and Victoria Police annotated by the ATSB

Extent of cloud

The BoM also provided the ATSB with satellite imagery showing the extent of cloud at the approximate time of the accident. Figure 11, taken 4 minutes before the collision, shows extensive cloud around Mangalore Airport with more broken areas towards the north and west and increasing cloud to the south and east.

Figure 11: Satellite image showing cloud coverage of central Victoria 11:20 EDT 19/02/2020
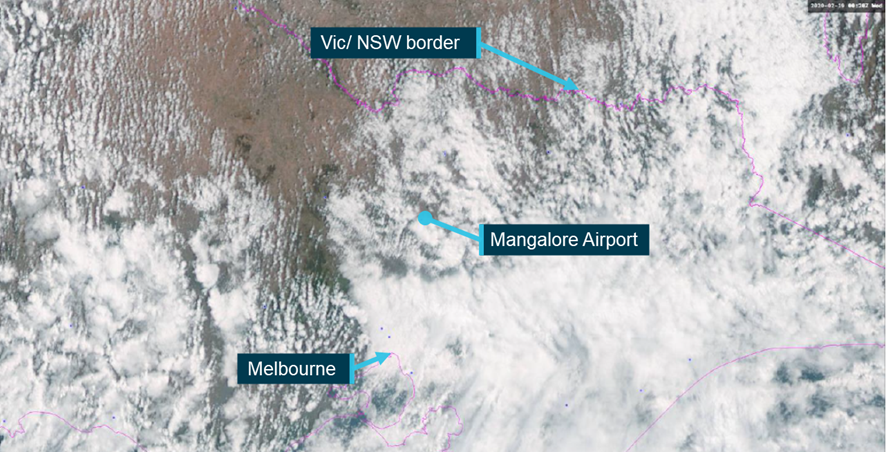
Figure 11: Satellite image showing cloud coverage of central Victoria 11:20 EDT 19/02/2020

Source: BOM annotated by the ATSB

Background luminosity

Background luminosity is the calculation of the effective brightness of the background against which an object is being perceived. During the day, the background luminosity depends on the time of year and atmospheric conditions including cloud. The actual background luminance on the day of the incident was unable to be determined. Table 2 reproduced in Hobbs, 1991 from the Illuminating Engineering Society’s Lighting Handbook provided approximate values for luminance in common conditions. Due to the cloud cover on the day and the time of year, the ATSB used the overcast value of 300 cd/m2 for further assessment.

Table 2: Luminance of common backgrounds
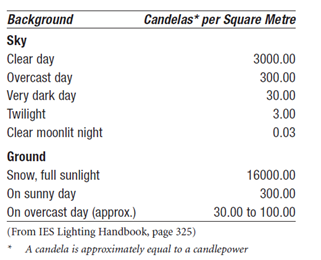
as-2022-001-table-2.png

Source: IES Handbook in ATSB – Hobbs 1991

Wind information

Wind plays a key role in the calculation of aircraft performance and Euler angles. Unfortunately, none of the available meteorological or other recorded data captured the wind at altitude at the time of the collision. As a result, the ATSB estimated the wind at altitude using data from the BoM’s grid point wind and temperature forecast (GPWT), issued at 0644 on 19 February 2020 and valid from 1100 that day. The chart indicated that at approximately 5,000 ft the wind was from 200° true and the wind speed was between 30 and 35 kt.

Sun position

Where the sun is visible, or close to the edge of the field of view, the sun’s glare can reduce a pilot’s ability to locate nearby traffic. Due to the sun’s consistent movement across the sky its position relative to a point on the earth’s surface can be calculated with a reasonable degree of accuracy. The ATSB obtained data on the sun’s position relative to the collision position (location and altitude) from the United States National Oceanic and Atmospheric Administration.[4] For the final 270 seconds leading up to the impact, the Azimuth [5] and Elevation [6] angles of the sun relative to the collision point varied from 58.26 to 56.98° and 50.8 to 51.56° respectively.

Human performance information

Object perception

It is not possible to state how large an object needs to be in a person’s field of view before they are able to distinguish it. This is due to a wide variety of factors both internal and external to the viewer and include the background that an object is seen against, where in the field of view it appears, relative motion of the object, vibration and physiological factors such as fatigue, age and hypoxic effects.

Multiple studies and reports give varying values as to what the minimum perceptible size of an object may be. One such example is an NTSB report from a mid-air collision in 1987 (NTSB, 1988), where 12 minutes of arc (0.2°) was suggested. Other examples suggest between 24 - 36 minutes of arc (0.4-0.6°) is more realistic, especially if conditions are sub optimal (Morris, 2005). The 2 main factors that will affect the size of the aircraft in the pilot’s eye are the dimensions of the aircraft and distance from the viewer. Figure 12 shows the change in visual angle and the time to collision at various constant closure speeds for an aircraft with a 40 ft wingspan. [7]

Figure 12: Visual angle and Time to Impact for various closure rates
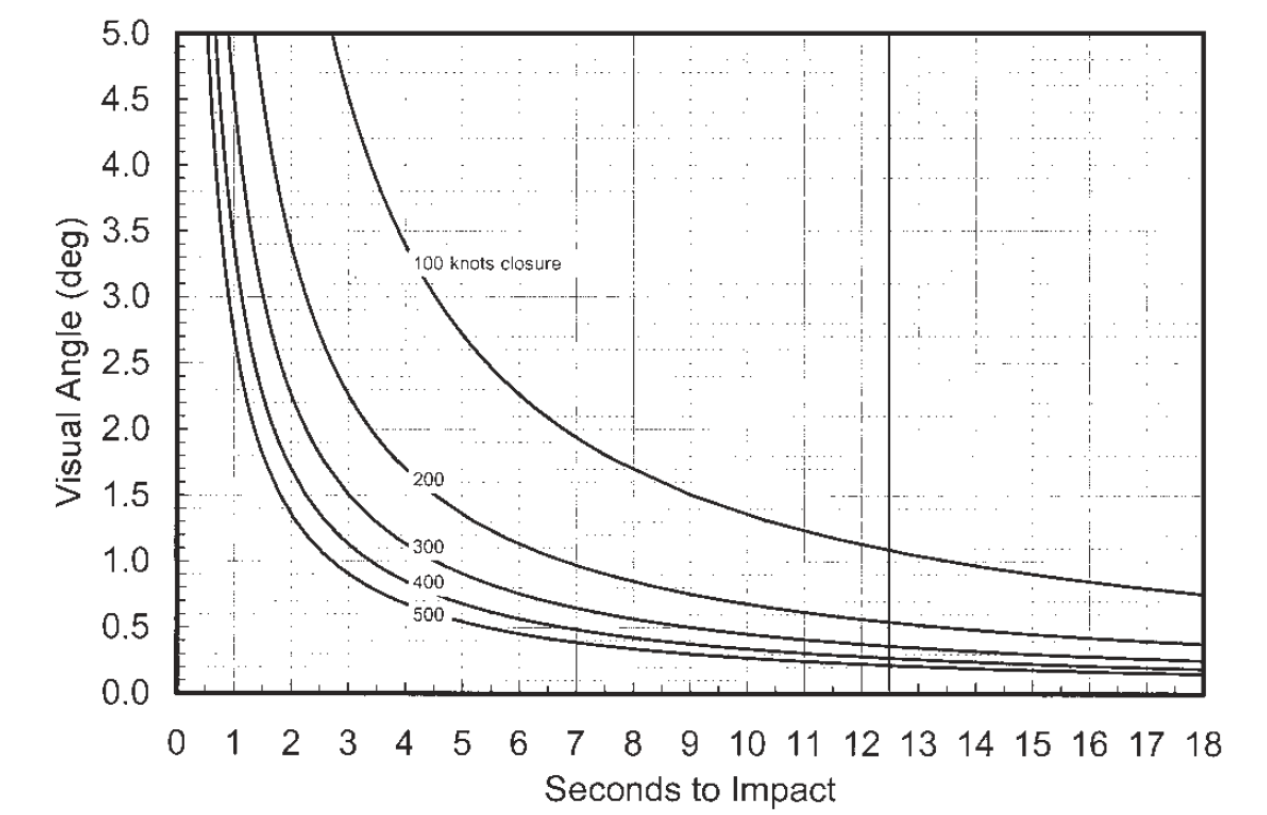
Figure 12: Visual angle and Time to Impact for various closure rates


Source: (Morris, Midair Collisions: Limitiations of the See-and-Avoid Concept in Civil Aviation, 2005)

For perspective, a piece of paper measuring 4 by 20 mm positioned lengthwise subtends an angle of 0.2° horizontally in the field of view when viewed from 5.73 m away.

Physiological blind spot

When considering at what point an object can be perceived, it is also necessary to consider the blind spot associated with the structure of the human eye (where the optic nerve exits the eye). This covers approximately 5° of azimuth and 7.5° of elevation. In most cases this is overcome by binocular vision where each eye can see what is in the blind spot of the other. However, where an object obscures perception from one eye, then in combination with the blindspot of the other eye, can potentially prevent an object being seen entirely. (Hobbs, 2004)

Relative movement

An object will be more easily perceived, regardless of where it is in the field of view, if there is relative movement between the object and viewer. (Hobbs, 2004) This is due to the human brain’s evolutionary adaptation to perceive movement as an indicator of threat. In many cases aircraft on collision courses will not have relative movement and so the eye will take longer to detect the aircraft. The perception and location of relative movement in the field of view is assisted where there is a stationary object, such as a structure, past which the object is moving. In this case the viewer will more easily locate the target if it is moving or transiting past the cockpit structure which will remain constant in the pilot’s field of view. Under ideal conditions where there is a stationary reference point proximal to the target movements of 0.017 - 0.034° of arc per second may be detected. When no such references are available it will require a 10-fold increase in movement for detection. (ATSB, 2002)

Strobe or other aircraft lighting may be used to create apparent movement or a focal point that attracts the viewer to the object.

There have been a range of studies assessing the effectiveness of various lights on people’s ability to see or perceive an object. Where an object is in a known position, a light even of relatively low power can be detected. Where a light is required to attract the attention of a viewer, particularly where it is in that person’s peripheral vision, it is required to be 5-10 times brighter than a light where a person is already alerted to the location and is simply looking for confirmation (Bullough, 2011).

Reaction time

Once an object is perceived by the viewer it takes time for the person to identify it, realise it is a threat, determine the appropriate course of action and implement that course of action. (ATSB, 2002) In the case of aircraft approaching one another, the implementation of that course of action will not only require an input to the controls from the pilot but also a reaction from the aircraft.

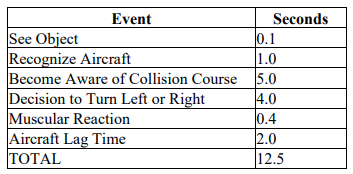
Based on a range of research, the FAA published an advisory circular that defined standard reaction time for a pilot from perception to the aircraft reacting. This table showed that from seeing an object to aircraft reaction was 12.5 seconds. Of this the 2 most significant portions are the determination that the other aircraft is on a collision course and determining the appropriate course of action. These 2 elements make up 9 of those 12.5 seconds. Table 3 is taken from the relevant FAA Advisory circular (AC 90-48D CHG 1.

Table 3: Aircraft Identification and Reaction Times Chart
as-2022-001-table-3.png

Source: Federal Aviation Administration

Theoretically, this means that, with no alert or guidance, if an object on a collision course is perceived less than 12.5 seconds prior to impact then the impact will occur regardless of a pilot’s attempted evasive actions. The time available for pilots to react can be increased through the introduction of an external or internal stimulus that alerts the pilot to traffic that poses a collision threat, provides an estimate of the location or if the aircraft is on a collision course a manoeuvring recommendation to resolve the conflict (a ’resolution advisory’).

Avoidance alerting

Mental model

A pilot’s mental model of the airspace around them is a key tool in good airmanship and conflict avoidance, regardless of the type of airspace operated in. The model requires an understanding of:

  • the rules and regulations governing the airspace
  • what traffic is in the airspace
  • what traffic is relevant
  • how relevant traffic is moving
  • the intentions of the traffic’s pilot
  • traffic’s performance.

This is then compared to the pilot’s intentions and the characteristics of their aircraft to determine the likelihood of conflict with the traffic.

A pilot’s mental model is affected by a range external and internal inputs. Internally pilots rely on:

  • experience
  • understanding of the airspace system
  • understanding of their aircraft and its performance
  • instrumentation
  • on-board systems such as ADS-B or a Traffic Collision Avoidance System (TCAS)
  • their view of the surrounding airspace.

Externally, the model is supplemented by radio communications, whether from ATC or directly or indirectly by other pilots on relevant frequencies and data relating to weather or procedural information that may be available digitally through a range of electronic devices. Increased accuracy and frequency of information available to a pilot can increase the accuracy of their mental model, and therefore reduce the risk of conflict with other traffic.

Alerting

As discussed above, for a pilot to detect a threat and effectively manoeuvre to avoid a collision the aircraft must be large enough for the pilot to detect it by eye and then react with sufficient time to manoeuvre and avoid the conflict. With an effective mental model based on radio or other detection technologies pilots can be aware of aircraft and conflict potential well beyond the limits of the human eye and at distances that allow ample time to arrange separation.

The alerts that assist in the development of the mental model can be either internal or external. External alerts could be direct communications or area broadcasts from either ATC or other aircraft. These alerts do not necessarily apply directly to the pilot and will often not require any action. They assist the pilot’s mental model development and conflict avoidance in 3 ways:

 1.Identify areas or aircraft that may require additional attention, either immediately or later.
 2.They can provide information as to the likely tracking of another aircraft assisting the pilot to determine if or when it is likely to become a threat. For example, a pilot that reports on a common traffic advisory frequency (CTAF) that they have just landed and taxied clear of the runway is unlikely to be a threat to an overflying aircraft.
 3.They can identify and locate targets beyond visual range and assist in visual acquisition at the edge of the visual range through directing the scan to a particular point of focus. As discussed in the Object perception section visual target identification is more likely to be effective if the viewer is aware of a target’s presence. This also assists in focusing the pilot’s view or scanning in a part of the airspace where a threat is likely to emerge, reducing the risk of empty field myopia or becoming caught in a focal trap.

Internal traffic alerts are provided by aircraft systems. These alerts have a range of advantages over externally provided alerts, including:

 1.All information that they provide is relative to the pilot and their aircraft. This requires less information for the development of an accurate mental model. In many cases this information is presented on a display providing a visual representation of traffic to assist or verify the pilot’s mental model.
 2.Internal alerting systems do not rely on radio communications from external parties. This is particularly important in non-controlled and remote airspace where radio calls may not be required.
 3.They can provide information about a target aircraft, such as type, speed, and activity (climbing, descending or level), well beyond the range of the human eye, allowing pilots to arrange self-separation earlier.
 4.Internal alerting systems can, in some cases, provide pilots with additional information such as guidance about recommended avoiding action if separation is compromised.
 5.They can provide a more frequent refresh rate for the data allowing for more accurate and near‑continuous information to be available to the pilot.

In discussing the relative effectiveness of internal and external alerting, Hobbs (1991) made the following statement.

Traffic alerts [presumably those provided by an aircraft collision avoidance system (ACAS)] were found to increase search effectiveness by a factor of eight. A traffic alert from ATS or from a radio listening watch is likely to be similarly effective

This paper was written prior to the introduction of the ADS-B system and the development of ADS‑B IN based traffic alerting systems. The similarities between the types of alerts that older ACAS and ADS-B IN systems can provide to the pilot would suggest that a similar increase in detection potential would be possible.

Not only do these alerts make it more likely that a threat aircraft will be detected or detected earlier, they also reduce the time required to take avoiding action. In the Reaction time section above, the time required from detection to implementation of avoiding action is cited as 12.5 seconds. Of this, 7.3 seconds is required for the pilot to detect the conflicting aircraft and recognise it as a threat. An internal alert can provide the pilot with the position and threat status of an aircraft limiting the delay from location and threat determination. Consequently, with ACAS, including ADS-B IN it is less likely that aircraft will converge without pilots realising and taking action to ensure separation.

Finally, it is important to note that outside of controlled airspace aircraft may not be required to have ADS-B or TCAS functionality and may not carry a radio or make broadcasts. Therefore, an effective lookout that covers as much of the sky as possible remains a critical component of conflict avoidance.

Case Study: Collision on runway between Extra EA-300 aeroplane, VH-EXR and Guimbal Cabri G2 helicopter, VH-LTO, Caloundra Airport, Queensland, on 18 September 2020

ATSB Investigation: AO-2020-051

On 18 September 2020, a high-performance single engine aeroplane VH-EXR (EXR), collided on the runway with a training helicopter VH-LTO (LTO) at Caloundra Airport, Queensland. EXR was conducting check circuits while LTO was conducting a stop and go landing during a navigation exercise. As part of the investigation, the ATSB identified that several radio transmissions from 3 different aircraft (including the accident aircraft) were either misheard, not heard or misinterpreted. The pilots of EXR did not hear or accurately assimilate the radio calls from LTO. The inaccurate assimilation was based on their understanding of the aircraft type and the operational requirements/ procedures at Caloundra.

The student pilot of LTO made 6 broadcasts on their approach to, and within, the circuit area. They identified EXR and believed it had identified them due to a radio transmission indicating that EXR was landing ’number 2’, However, a third aircraft had just conducted a touch and go and this was likely the aircraft that the pilot’s in EXR believed they were following, not LTO.

Of the 2 pilots in EXR, the rear seat pilot recalled hearing a transmission from the helicopter but they understood that the aircraft would be on a 500 ft circuit approaching the helipad and not in the same circuit as the aircraft and so did not warrant their attention. The front seat pilot of the aeroplane, who was the pilot in command and pilot flying at the time of the incident did not recall hearing any calls from the helicopter and further commented that while helicopters used the airport regularly, they were not usually in the circuit.

Consequently, the pilot of LTO believed that the occupants of EXR were aware of their presence, while neither pilot of EXR expected the helicopter to be on the runway. With visibility restricted by the aircraft’s structure, flight profile and the near‑stationary helicopter, no pilot was able to detect the other aircraft until they collided. Both aircraft sustained substantial damage but there were no injuries.
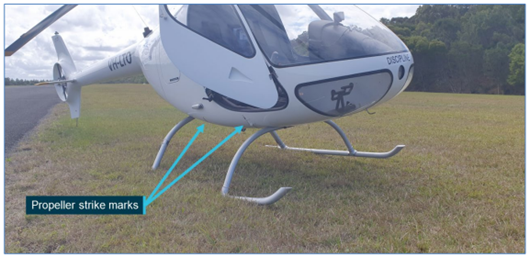
as-2022-001-case-study-pic.png

Propeller strike mark and skid damage to VH-LTO                                  Source: Aeropower, annotated by the ATSB

In this accident, both the limitations of visual acquisition and a limited or incorrect mental model of the surrounding traffic were present. While the pilots were providing the relevant communications for alerting, as they were not being correctly received or interpreted, they were unable to enhance the visual acquisition opportunity.

While internal alerting functionality was not available in this case, it would have provided all 3 pilots with a better understanding of the location of the other aircraft, their movements and assisted them in visual acquisition and collision avoidance.

Pilot eye position

Each pilot’s eye position relative to the aircraft structure is the combination of several factors. The study considered the pilot’s height, seat position, and head movement. The pilots’ heights were obtained from their CASA medical records. The ATSB utilised a human analogue during this study to replicate the seated heights of the pilot’s in the opposing seat and the shielding from their head and torso.

The seat position for each pilot prior to the impact were not able to be determined from the wreckage examination. When ATSB investigators attended exemplar aircraft to gather data in support of this study, persons of the same approximate height as the pilots sat in the control seats and positioned the seats to an appropriate and comfortable position for operating the aircraft. These seat positions were recorded along with the scan data for further analysis.

In some cases, aircraft are developed with a ’design eye position’ the location from which operators are intended to view the cockpit. Neither of the manufacturers of the accident aircraft were able to locate or provide the ATSB a design eye position for their aircraft.

Movement of the pilot’s head, both translational and rotational, creates variability in both the eye position and field of view. The study considered a range of position and rotation of the eyes. Two matrices were developed simulating eye translation and rotation and the view of the cockpit and location of the target aircraft from these positions was determined. Further description of this process, and results, can be found in the Sensitivity analysis and Field of view sensitivity sections.

Workload

The human brain has limited processing capacity. When multiple sources of information need to be perceived and processed at the same time this can limit the ability of the pilot to attend to each of them effectively. For pilots, tasks including operating or listening to the radio, talking or conducting mental calculations can reduce a pilot’s eye movement, and effective field of view. (Hobbs, 2004)

Research has shown that stimuli, particularly those in the peripheral vision are more difficult to detect when attention is focused on a priority task. Data from NASA indicated that undertaking concurrent tasks while performing a visual scan can reduce pilot eye movement by up to 60%. (Hobbs, 2004)

Onboard AEM both pilots would be expected to have a slightly elevated workload as, in addition to regular flying duties, the instructional flight included the first VOR approach in this aircraft for the student. In JQF, not only was the flight an examination, meaning that both the examiner and the candidate would likely have been experiencing a higher workload, but they were also in the take‑off and climb phases of flight which also have relatively higher workload requirement.

Field of view

A pilot’s field of view or visual field, measured in azimuth and elevation angles from the eye, determines how far from the centre point an object can be effectively located. This field will vary from person to person and can change based on a range of factors including age, and existing visual conditions/diseases. A binocular field of view typically traverses through 190° of azimuth and 135° of elevation with a slight bias towards downwards perception (+60° elevation, -75° elevation). (Gibb, Gray, & Scharff, 2010) Within this are multiple layers of vision covering the rest of the visual field with decreasing acuity as they move further away from the centre.

For simplicity in this study the visual field has been broken into 3 areas

 1.The foveal region covering approximately the central 10° (both azimuth and elevation) of the visual field. Within this area is the sharpest daylight vision and the highest acuity.
 2.The central visual field, defined as 60° of azimuth and 60° of elevation split evenly above and below the centre of the field of view. Within this area objects can be located simply by their presence and do not need to specifically attract the viewers’ attention.  
 3.The full visual field is the remaining area that a person can see. In this area objects can appear but will only be specifically focussed on or perceived if they attract the viewers’ attention through contrast, or movement including the use of lights.

Figure 13 shows an exemplar silhouette of an equirectangular [8] 360° view of a Vans RV-8 aircraft cockpit showing the 3 visual areas field of views.

Throughout this report these coordinates will be used to describe the pilot’s visual field. It is worth noting that while all objects in the field of view might be visible to the pilot it is unlikely that all objects, particularly ones on the extremities or in areas where there is a large amount of visual clutter or activity will be detected (Gibb, Gray, & Scharff, 2010).

Figure 13: Fields of view example
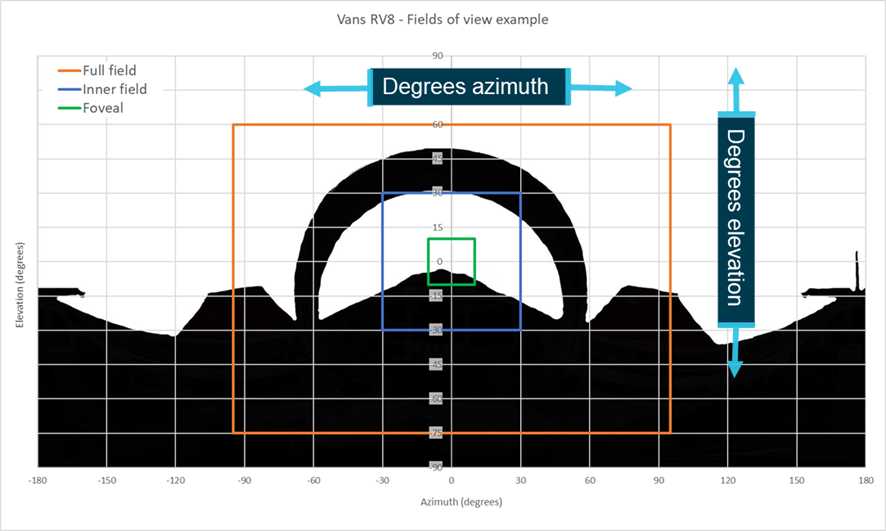
Figure 13: Fields of view example

Source: ATSB

Empty field myopia

When there is nothing in the field of view that the viewer is specifically focussed on the eye returns to a ’default’ position and focusses on a point 0.5‑1 m in front of it. This can lead to a viewer being unaware of potential threats proximal to them. This is referred to as empty field myopia. (Hobbs, 2004)

Pilot scanning

To improve the effectiveness of ’see and avoid’ and to overcome issues with ’empty field myopia’ and the ’blind spot’ pilots are trained to visually scan the airspace around them for potential threats. This is usually combined with an internal scan of the aircraft’s instruments.

General guidance is to ensure that the entire visual field is scanned by moving and rotating the head to reveal objects otherwise lost behind aircraft structure or in visual traps. [9] The FAA recommends a series of regularly spaced eye movements that cover approximately 10° of the visual field and where that area is focused on for one second to allow the eye to adjust and focus in this area to enable detection.

It is further recommended that external viewing occupies 66‑75% of the scan time, with the remainder spent scanning instruments and looking inside the aircraft. (FAA, 2017) Research indicates that the recommended amount is reversed with instrument rated pilots spending up to 66% of their time looking in the cockpit. When they were aware of the presence of traffic this decreased to 49%. This research also indicated that pilots are likely to scan the centre of windscreen thoroughly but neglect scanning of the edges of a windscreen. (Colvin, Dodhia, & Dismukes, 2005)

IFR pilots are taught to focus more of their scanning inside the aircraft and less externally. This is due to an increased focus on instruments in this type of flight and a heavier reliance on procedural separation techniques.  

Glasses

The use of glasses can affect multiple characteristics around a person’s vision. Usually this will improve perception of objects allowing the viewer to perceive objects more clearly at certain ranges and in certain parts of the visual field. However, they add another layer of material through which a person can look and create distortion. They also add further areas of shielding where frames intersect with the wearers sight lines.

Lighting

The ability of a person to perceive an object depends on the contrast ratio between the background and the object itself. This ratio can be increased using anti-collision lighting which will not only provide additional contrast against the background but in the case of strobe or rotating beacons provide movement that can attract the viewers’ attention alerting them to the presence of a threat.

Regulatory background

Regulation 196 of the Civil Aviation Regulations (CARs) require that aircraft conducting IFR operations in Australia be fitted with green, red and white navigation lights dependent on position on the aircraft. In addition, they must be fitted with at least one red anti-collision beacon or aviation white strobe lighting. The operational requirements for these lights are defined within the Civil Aviation Orders.

These documents specify operational requirements and so do not specify the technical requirements for either of these types of lights. The type and performance specifications for lights are defined within the airworthiness and certifications standards for the aircraft. The requirements and fitted lighting for both AEM and JQF are outlined in the Aircraft lighting sub-sections within each Aircraft information section.

Visibility

There has been a wide body of research into the effectiveness of aircraft lighting in improving visual detection of aircraft. A range of agencies around the world have encouraged aircraft owners and operators to fit anti-collision lights. The luminance of traditional aircraft lights meant the presence of these lights was of minimal advantage particularly in bright background lighting conditions such as those experienced in daylight (Hobbs, 2004).

Much of the available research into the effectiveness of aircraft lighting was carried out prior to the introduction of light emitting diode (LED) lighting when standard lighting intensities were in the order of a maximum of 300‑400 candela. As Figure 14, reproduced in (Hobbs, 2004), shows that for these lights to be effective at 3 nautical miles, background luminance cannot be more than approximately 30 candela (equivalent to a very dark day). On a full sunlit or even an overcast day lights of this power this would not be sufficient for an operator to see let alone draw attention.

Figure 14: Required effective intensity of lights
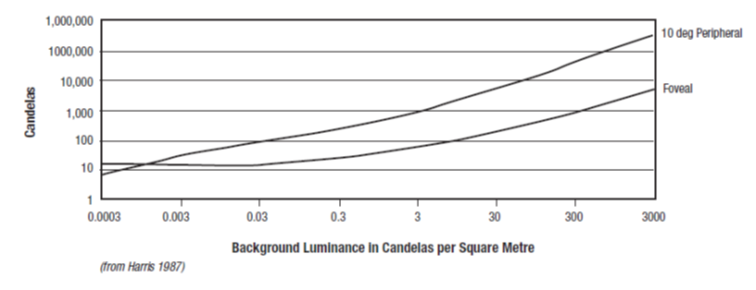
Figure 14: Required effective intensity of lights

Source: Harris 1987 in ATSB – Hobbs 1991

Currently available lighting

Over the past 15‑20 years LED technology has become more commonly used in almost all lighting applications including aviation lighting systems. Due to lower power consumption, higher brightness and longer lifetimes, LEDs provide a significant advantage over the traditional incandescent or halogen bulbs (US DOE, 2022).

The provision of these improvements has led the FAA to encourage the use of landing lights when an aircraft is operating within 10 NM of an airfield or below 10,000 ft (FAA, 2020). The low power consumption and increased brightness of modern LED landing lights provide for visibility at significant distances even in bright daylight. For example, the sunspot series of LED landing lights produced by AeroLEDs in the United States have candela ratings between 150,000 and 420,000 (AeroLEDS, 2021) which is more than sufficient for a light to be seen at distances of 3 NM even outside of the foveal region of highest visual acuity (Figure 14). It is important to note that many landing lights do not have strobe functionality and so must use brightness and contrast alone to attract the viewers’ attention to the target.

A recommendation to use the taxi and landing light within 10 nautical miles, including within the circuit area, was also part of the standard flight procedures for Mangalore Airport as outlined in the ERSA and made up part of the standard operating procedures for JQF. 

Aircraft modelling

Discounting meteorological and human performance factors, which are considered separately, this study assumed that the aircraft would be visible from one another unless an opaque part of the aircraft’s structure was directly in line between, or shielding, the pilot’s eye position from the ’target’ aircraft.

To accurately determine the location of the aircraft’s structure from both pilots’ eye positions the ATSB modelled exemplar aircraft of those involved in the accident. Two full scale digital models were developed representing the aircrafts’ external and internal structures.

Point clouds were developed from data gathered using a FARO Focus series laser scanner. Each point is representative of the position of the material that reflects a laser beam put out by the scanner. As the scanner sweeps through 360° of azimuth and 150° of elevation it creates points representing the three-dimensional location of the aircraft’s structure. Noting that the laser will only capture data when a reflection is received, transparent objects such as windows may not be identified or identified accurately. However, their position can be deduced from the surrounding structure.

As the scanner can only ’see’ in a direct line of sight, a single scan cannot capture the whole aircraft as some areas will be in the scanner or aircraft’s shadow. To overcome this, a series of known points or ’targets’ are set up around the aircraft and then the scanner placed in multiple locations where both the aircraft’s surfaces and the targets can be seen. The ATSB utilised 2 different types of targets - spheres and checkerboards placed throughout the space at locations likely to be overlapped by multiple scans.

The utilisation of spheres provided a target that maintains its shape when viewed from any angle so can be referenced in any scan where it is visible. Checkerboards are used as they are easy to transport and position in larger numbers, however flat surfaces mean that they are only usable when the scanner can capture the whole checkerboard. The patterns created by the targets allows multiple scans to be combined or ’merged’ by the scanner software. [10] The number of targets and their distribution simplifies the processing as it creates more identifiable patterns in the targets that the software can identify.

Once merged the scans generate a point cloud and are processed into a triangulated mesh. Both the cloud and the mesh are dimensionally accurate representations of the whole aircraft.

For this study, the scans were performed at multiple locations around each aircraft, and inside the aircraft. This resulted in 4 models being produced for each aircraft:

 1.Exterior model of the aircraft with internal scans not included.
 2.Exterior and interior model of the aircraft with both pilots’ seats unoccupied.
 3.Exterior and interior model of the aircraft with human analogue in the left pilot seat.
 4.Exterior and interior model of the aircraft with human analogue in the right pilot seat.

The point cloud that was generated by the scanner contained all the points that the scanner had been able to see. This included not only the aircraft but the surrounding environment. Additionally, depending on the nature and material that that the laser was reflecting off there was some ’noise’ or unwanted points in the scan. To overcome this the scan data was automatically and then manually cleansed and these points were removed from the point cloud.

Both aircraft were modelled with propellor blades in a single static location. The wreckage analysis (see investigation report) determined that the engines and propellors of both aircraft were operational up to the collision. While the propellors are a solid structure, the speed with which they would have been rotating meant that the pilot’s visibility through the propeller disc would not have been significantly impeded by them. The propellor blades were removed during the modelling stage.

Aircraft were modelled on the ground with the landing gear extended. Due to the position of the landing gear, it is not visible to the pilot during flight and therefore does not impede detection of a target aircraft. As such, the gear was retained within the models of both aircraft. The attitude of the aircraft when sitting on the landing gear is different to that while in flight. This was accounted for by levelling the aircraft model when converting each aircraft from the scanner axis system to the body axis system, see point cloud conversion section for further details.

AEM

For the study, AEM was substituted with VH-IJM (IJM) a Beechcraft E95. While AEM was a D95A, the fitment of the ’Speed Slope’ windscreen modification (see the section titled Aircraft information) meant that it was more accurately represented for structural purposes by the E95. While scanning IJM, ATSB personnel also viewed VH-FLM, a D95A that had retained the original windscreen layout, and took photographs for comparison with both AEM and IJM.

The model developed of IJM comprised 22 external scans and 9 internal scans taken over the course of a day while the aircraft was hangered. At the time of scanning IJM was not fitted with dual cockpit controls as AEM was at the time of the accident. The ATSB reviewed photos of AEM configured with dual controls and determined that the control yoke for the right seat pilot would not have affected the pilot’s visibility and so it was not considered as necessary for accurate model development.

Figure 15 shows IJM during preparation for scanning, surrounding it are a range of targets, both checkerboards and spheres. Figure 16 shows a panoramic image taken by the laser scanner when situated over the right pilot’s seat. Panoramic images like this were taken at each scanner head location and are used by the scanner software to ’colourise’ the point cloud. Figure 17 shows the 3-dimensional point cloud model of IJM.

Figure 15: IJM prepared for scanning.
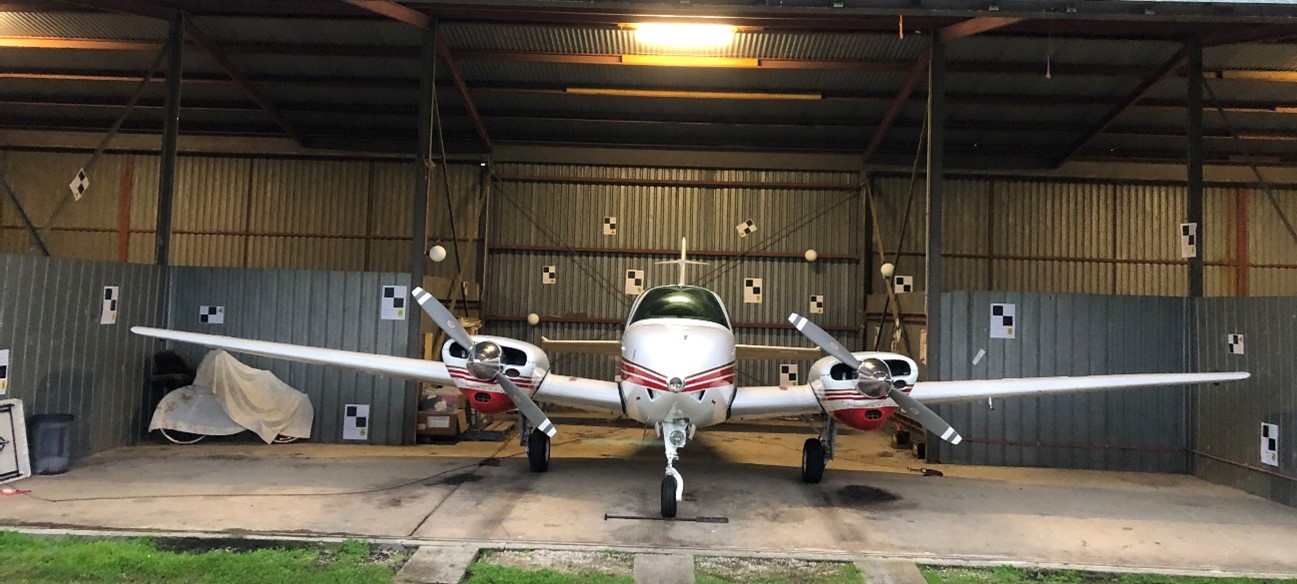
Figure 15: IJM prepared for scanning.

Source: ATSB

Figure 16: Panoramic image taken by laser scanner when scanning from right pilot’s seat
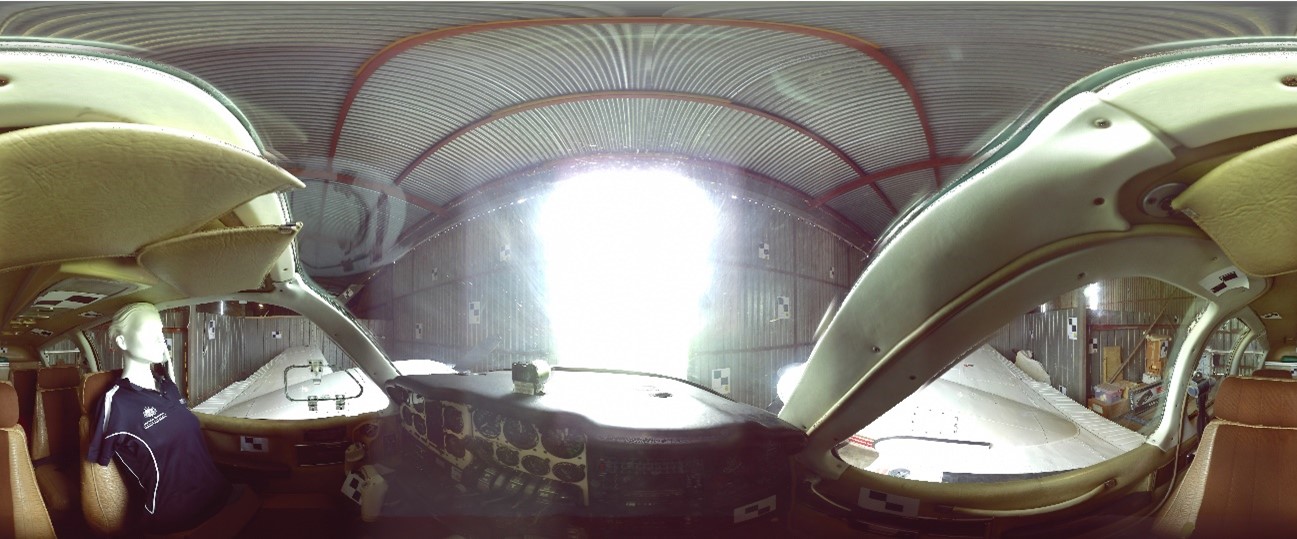
Figure 16: Panoramic image taken by laser scanner when scanning from right pilot’s seat

Source: ATSB

Figure 17:  3-dimensional point cloud model of IJM
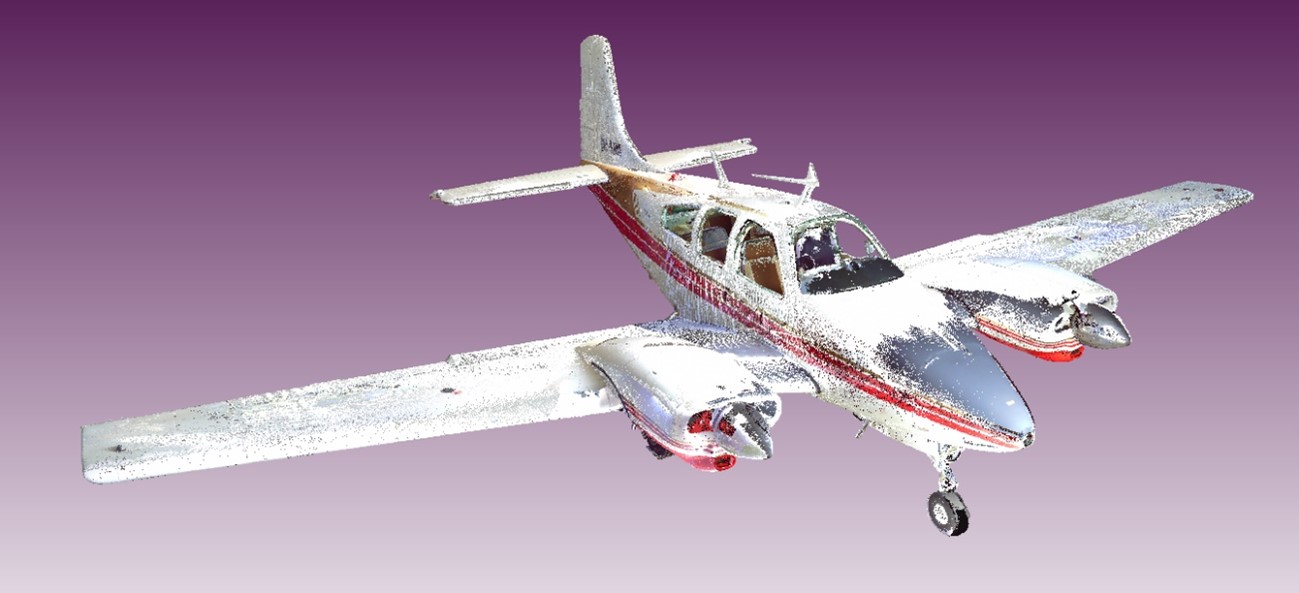
Figure 17:  3-dimensional point cloud model of IJM

Source: ATSB

JQF

For the study, JQF was substituted with VH-NLO (NLO) a PA-44-180 Seminole manufactured approximately a year prior to JQF. NLO was scanned by ATSB personnel over the course of 2 days while hangered. When scanned, NLO was equipped with 2 bladed propellors compared to JQF’s 3 bladed propellors. However as discussed previously, due to their limited impact on visibility, the propellor blades were removed from the models. The ATSB reviewed imagery of NLO and JQF with 2 and 3 bladed propellors, it was determined that, while not dimensionally identical, the spinner domes from the 2 and 3 bladed propellors were similar enough to not require further assessment or modification of the aircraft model.

The model of NLO consisted of 23 external scans and 8 internal scans. To facilitate scanner positioning within the aircraft, seats were removed prior to interior scanning and were replaced as necessary for locating a human analogue to replicate the second pilot’s eye positioning. Figure 18 shows NLO in the hangar at Mangalore Airport during preparation for scanning with checkerboard and spherical targets visible. Figure 19 is a panoramic image taken by the laser scanner when positioned approximately at the left pilot’s eye position. Figure 20 shows the 3-dimensional point cloud model of NLO.

Figure 18: NLO prepared for scanning
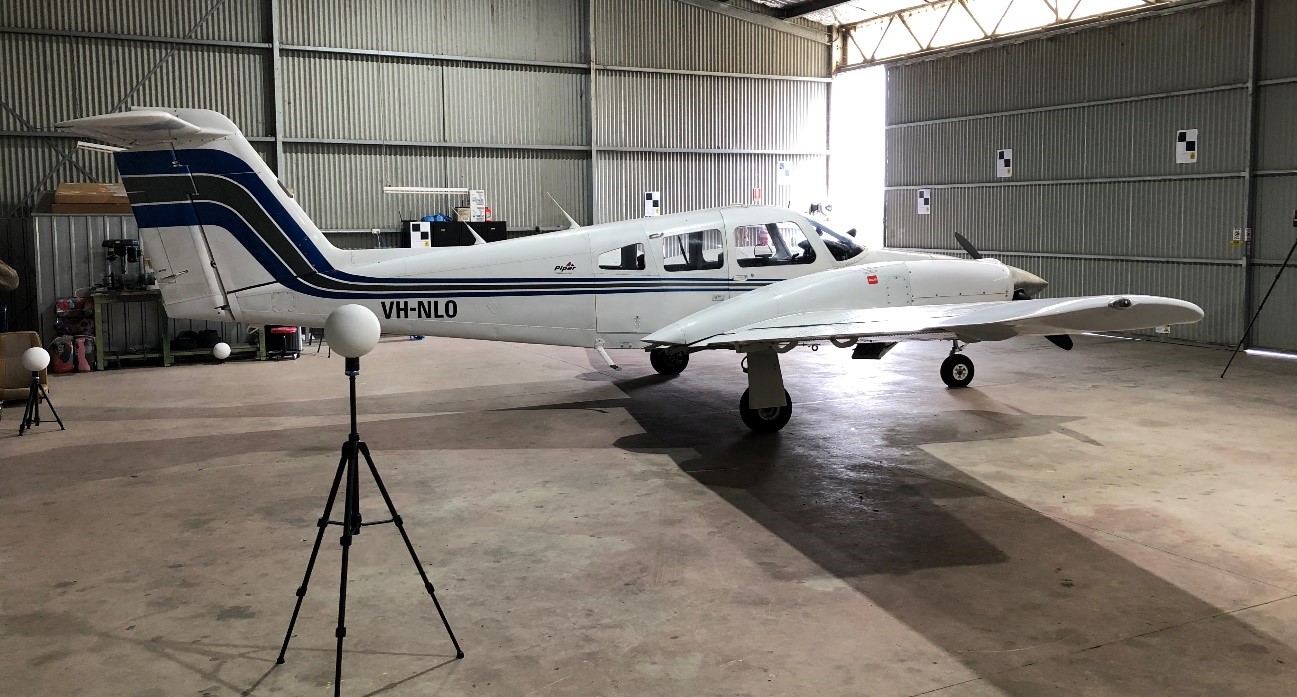
Figure 18: NLO prepared for scanning

Source: ATSB

Figure 19: Interior panoramic view of NLO from left seat pilot’s position – note sun visors in the lowered position
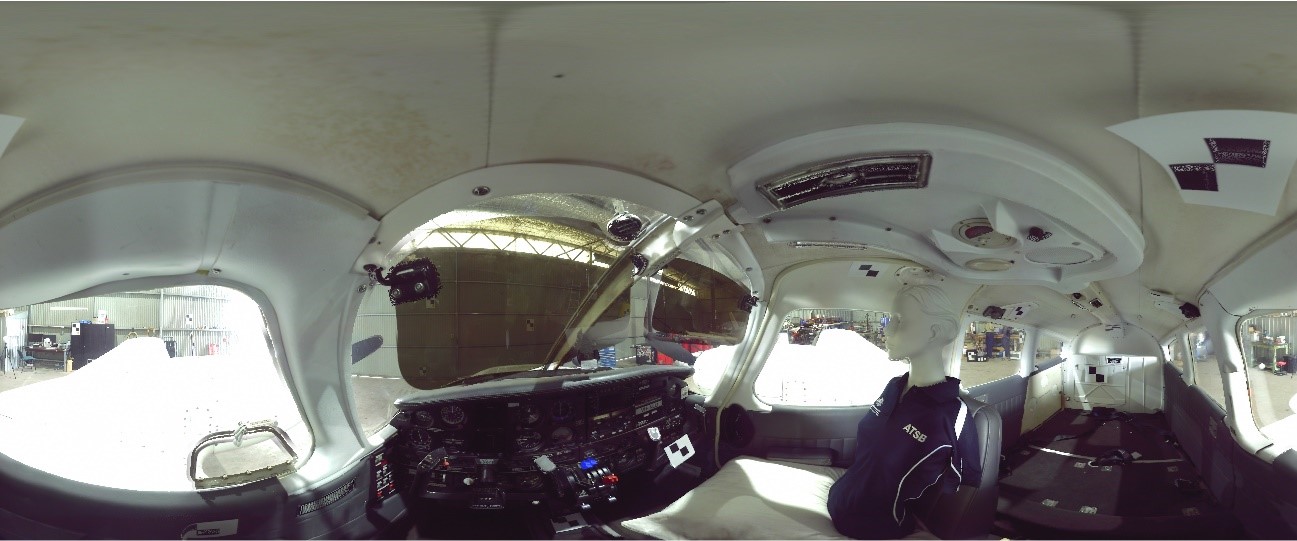
Figure 19: Interior panoramic view of NLO from left seat pilot’s position – note sun visors in the lowered position

Source: ATSB

Figure 20: 3-dimensional point cloud model of NLO
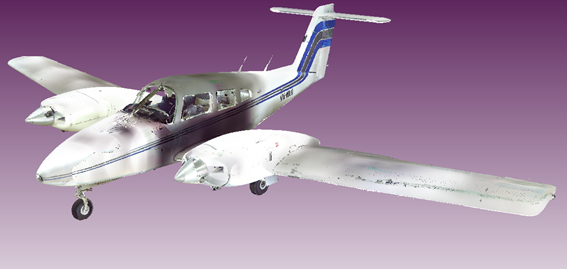
Figure 20: 3-dimensional point cloud model of NLO

Source: ATSB

Point cloud conversion

All points in the 3-dimensional models were recorded relative to an origin point, in the case of the aircraft scans, this was relative to the location of the scanner head when the first scan was taken. These co-ordinates are referred to as being in the Scanner Axis System. To accurately calculate the position of the target aircraft relative to the viewer aircraft the target’s position must be expressed relative to the viewer aircraft and in its co-ordinate system, this system is referred to as the viewer aircraft’s Body Axis System. To convert from the Scanner Axis System to the Body Axis System each point must be translated and rotated using a series of matrix transformations. [11]

Calculating the rotation and translation matrices relied on the identification of a series of 3‑dimensional points in the Scanner Axis System with known co-ordinates in the Body Axis System. For this study the ATSB used the left and right wing tips, the nose and rear of the aircraft and the highest point on the tail as identified on the aircraft 3 view diagrams (Figure 1 and Figure 4). These points were identified in both the Scanner Axis System and in the aircraft’s Body Axis System. From this the ATSB calculated the transformation matrices and applied the rotation and translation to the point clouds for each model.

Pilot eye positions were defined in the Scanner Axis System and the same transformations were applied to compute their coordinates in the aircraft’s Body Axis System.

With the aircraft fuselage and pilot’s eye position in the aircraft’s Body Axis System the azimuth and elevation angles of the aircraft structure relating to the pilots’ eyes were calculated. These positions were then represented on a 2D plot with the target aircraft locations to establish the windows where the target aircraft (see the section titled Locating the target aircraft) was shielded from view.

Refining the pilots’ eye positions

The location of the pilots’ eyes was based on the locations of the eyes of the human analogue used in the study. Due to potential differences between the position of the human analogue’s eyes and the pilots’ eyes a matrix of possible eye positions (see the section titled Sensitivity analysis) was developed and the pilot’s view of the cockpit structure from each position in the matrix was examined. Using pilot and aircraft characteristics and images of both the accident and exemplar aircraft cockpits, investigators selected optimised eye positions within the matrix of eye positions. Throughout the remainder of this study these optimised eye positions were used as the primary eye positions for assessment and calculations. The original position taken from the human analogues were used in the sensitivity analysis section to identify the difference that small movements of the eye position could make to visibility and referred to as the ’displaced eye position’.

Locating the target aircraft

The location of the target aircraft in the field of view of the pilot of the viewer aircraft can be defined in terms of the azimuth and elevation angles from the viewer to the target, as depicted in Figure 21. To compute these angles, the target aircraft’s coordinates are first transformed from an Earth-based coordinate system into the viewer aircraft’s body-axis coordinate system.

The area of the pilot’s field of view taken up by the viewer aircraft’s structure can similarly be expressed in terms of the azimuth and elevation angles (from the pilot’s optimised eye position) defining the boundaries of the structure. At points where the azimuth and elevation coordinates of the target aircraft overlap those of the viewer aircraft’s structure, the target can be considered to be ’shielded’ from the pilot of the viewer aircraft. Similar considerations can be used to determine the location and shielding of the sun in a pilot’s field of view.

Figure 21: Azimuth and elevation angles from viewer aircraft to target aircraft
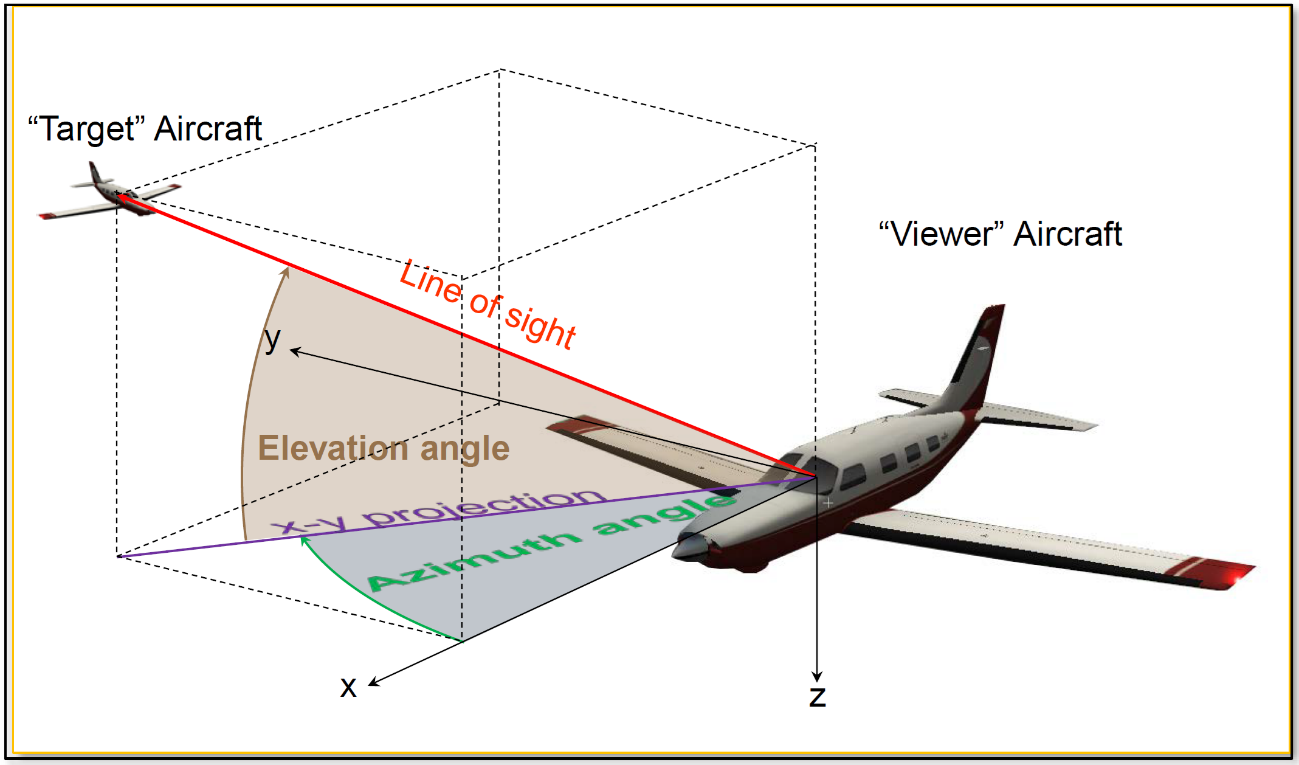
as-2022-001-pic-21.png

Source: NTSB

Automatic Dependent Surveillance – Broadcast

ADS‑B OUT

ADS-B collates and transmits a range of gathered and calculated aircraft parameters based on Global Navigation Satellite System [12] (GNSS) data. Parameters include:

  • aircraft position - latitude, longitude and geometric altitude
  • position accuracy
  • time the position was recorded
  • unique aircraft identifier [13]
  • flight id (in this case the aircraft registration mark)
  • performance information including
    • ground speed,
    • track angle and
    • rate of climb or descent.

In addition, ADS-B can be connected to other aircraft systems to provide more accurate display data including heading, barometric altitude and vertical rate.

ADS-B transponders can also transmit emergency indicators using dedicated transmission settings. The system is defined as automatic as it does not require an external interrogation before transmitting its data and dependent as it relies on a GNSS source for position information.

Data is transmitted line of sight on an open 1090 MHz frequency and can be collected by a range of receivers. In Australia, Airservices operates and maintains the ADS-B network for air traffic control. There are multiple other networks and individual receivers that provide a range of coverage patterns within Australia and globally. Individuals may even build their own receivers to obtain traffic information about aircraft operating nearby.

Additionally, recent improvements in technology have allowed for ADS-B receivers to be fitted to satellites which can provide significantly greater coverage than ground‑based receiving stations. Further details relating to reception networks for ADS-B data can be found in the Receiver network coverage section below.

Except for certain exempted aircraft, as of 2 February 2017 under Civil Aviation Orders 20.18, it is required that all aircraft operating IFR be ADS-B OUT equipped. These exemptions expired for Australian aircraft on 1 January 2020. This requirement assists ATC in locating IFR aircraft and providing separation inside controlled airspace, and a traffic information service in non-controlled airspace, where ADS-B coverage is available.

ADS-B vs Mode C and Mode S transponders

Traditionally aircraft identification has relied on interrogation of a Mode C or Mode S transponder fitted to the aircraft. These 2 systems provide a series of aircraft parameters, 3 for mode C and 7 for standard mode S which are then supplemented by data from secondary surveillance radar (SSR) information. This allows ATC to establish course, speed, climb or descent, the aircraft’s position and other performance parameters for ATC traffic management purposes. The data provided by a Mode C or Mode S transponder when interrogated, is referred to as a ’squawk’. (Device Technologies Inc., 2019)

Conversely, ADS-B transmissions do not require interrogation. The ADS-B system automatically transmits relevant data at an average rate of 2 per second, this is referred to as a ’squit’.

ADS-B transmissions contain up to 49 parameters referred to as ’extended squitter’. This volume of data gives it a significant advantage over the older mode S and mode C transponders. (Garmin Aviation, 2021) The additional benefit is that any appropriate receiver can accept the signal and can unpack it for relevant information about an aircraft without the need for interrogation.

Receiver network coverage

Airservices Australia

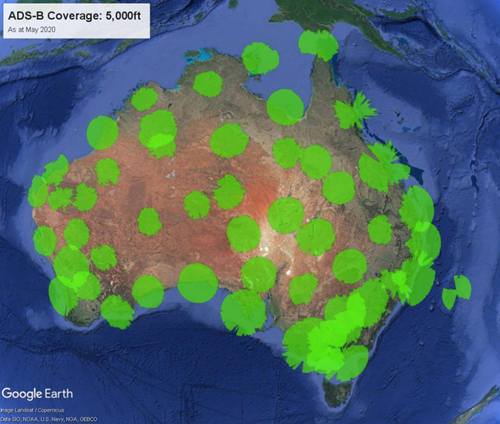
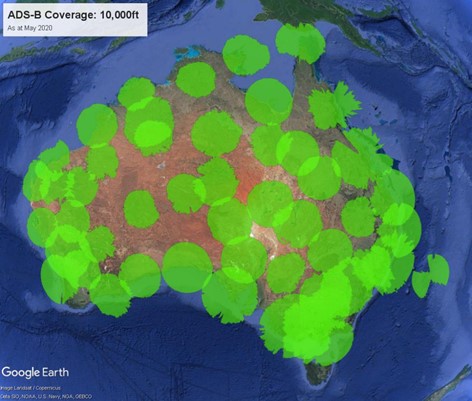
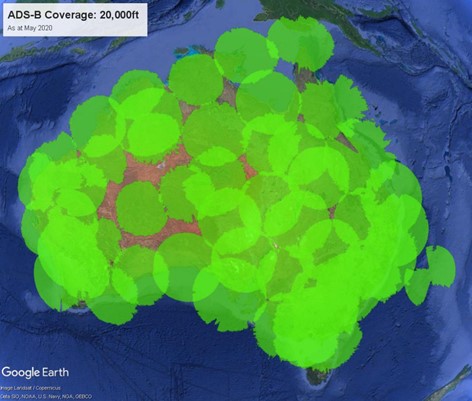
Airservices maintains a network of 50 ADS-B receivers based around mainland Australia, supported by 7 wide area multilateral receivers based in Tasmania (TASWAM) which provides both radar and ADS-B coverage. (CASA, 2019) The coverage provided by each of these stations depends on the surrounding terrain and consequent shielding of signals. (Airservices Australia, 2020) Figure 22, Figure 23 and Figure 24 show the network coverage, as of May 2020, at altitudes of 5,000, 10,000 and 20,000 ft respectively. Mangalore Airport is within the Airservices ADS-B networks coverage area with coverage down to ground level.

In Class G airspace [14], outside of these coverage areas and without ADS-B IN technology, pilots of aircraft not fitted with Traffic Collision Avoidance Systems (TCAS), whether flying under IFR or visual flight rules (VFR) must rely on procedural separation and accurate radio communications for their mental model of the airspace and traffic around them.

Figure 22: Airservices ADS-B receiver coverage 5,000 ft [15]
as-2022-001-pic-22.png

Source: Airservices Australia

Figure 23: Airservices ADS-B receiver coverage 10,000 ft
as-2022-001-pic-23.jpg

Source: Airservices Australia

Figure 24: Airservices ADS-B receiver coverage 20,000 ft
as-2022-001-pic-24.jpg

Source: Airservices Australia

Third party networks

Other third-party organisations or individuals may use a separate network of receivers with differing coverage patterns to that provided by Airservices. This can provide better coverage in certain areas where these organisations may have a specific focus. One such example of this is the utilisation of third-party receivers by the AvPlan EFB to supply its subscribers with ADS-B data.

This application was available on an iPad device carried by the student pilot of AEM, but it was not able to be determined whether a traffic information display was selected at the time of the collision. Furthermore, investigation by the ATSB determined that prior to or at the collision altitude, this network would not have located JQF and so would not have provided traffic information prior to the collision.

Satellite ADS-B reception

Mounting ADS-B receivers to a satellite network provides continuous global coverage of ADS-B equipped aircraft. This information can then be provided to relevant air navigation service provider (ANSP) or third-party subscribers improving coverage at low altitudes and away from airports and population centres (Aerion, 2021). Satellite coverage does not guarantee reception as it depends on the signal strength of an aircraft’s transmitter, requiring a minimum of a 125 watt transmitter if only fitted with a top mount ADS-B antenna (Aerion, 2021).

In Australia it is a requirement for aircraft manufactured on or after 9 February 2012, with a maximum take-off weight of more than 5,700 kg or a max cruising speed of greater than 250 kt, to be fitted with ’diverse’ antennas (meaning top and bottom mounted) (CASA, 2020). Diverse antennas provide the best coverage for both ground based and satellite ADS-B receivers. In most cases, larger aircraft are fitted with this antenna layout even if older than the requirement as it forms a part of the TCAS system. Diverse antennas are particularly important when the aircraft structure may shield an antenna. (Aerion, 2021) This is most common when the aircraft are on or close to the ground, or when manoeuvring in flight.

Supplementary technologies

Some EFB applications allow users to share device GNSS data to provide traffic information to other subscribers using a data connection. While this does provide an improvement to the situational awareness there are 3 primary drawbacks:

  1. The display of data can lag significantly due to the transmission time required between devices via a data connection.
  2. A data connection is required to be able to transmit or receive the information for display. It is important to note that the lack of an internet connection will not impact the ability for a device to receive a GNSS signal and so the viewing device’s position will still be able to be displayed but not traffic.
  3. Position information is only available for other users of that specific application who have the traffic transmission functionality operational. This may give the pilot a false sense of the traffic picture around them. [16]

ADS-B IN

ADS-B IN refers to an aircraft that is equipped with a device that can receive other aircrafts’ transmitted ADS-B information. ADS-B IN data can provide location and proximity information on local traffic shown on a cockpit display or personal electronic devices with appropriate software.

In Australia, the fitment of ADS-B IN provides improved awareness of all IFR traffic and ADS-B OUT equipped VFR traffic. This can assist pilots in locating aircraft when traffic information is provided by ATC. It can also provide pilots outside of ATC coverage with accurate information of proximal traffic at ranges far greater than that detectable by the human eye.

Due to the signal characteristics and technology that is in use, ADS-B receivers are small and lightweight. This enables them to be fitted into aircraft avionics packages or attached, either wired or wirelessly to personal electronic devices in the cockpit. Installing these receivers improves significantly on data from EFB applications as it displays all nearby ADS-B equipped traffic in near real time.

Cockpit display of traffic information

Cockpit display of traffic information (CDTI) is a system used to display ADS-B IN information to the pilot to enhance spatial and situational awareness and assist in visual acquisition of traffic. The CDTI screen shows in a planar or overhead view the location of proximal traffic to the aircraft, over either a moving map or against a plain background with range rings depicting distances from the aircraft. These systems have a range of settings that can be adjusted to display or remove certain aircraft or distractions as per flight crew requirements.

ADS-B traffic alerting system

ATAS is an add on to ADS-B IN functionality that can provide alerts about the location, speed and direction of proximal traffic to a pilot with the aim of reducing the risk of mid-air collision. When aircraft are projected to breach certain defined proximity thresholds the ATAS system audibly alerts the pilot to the intrusion with a standard phraseology that states ’Traffic, direction [by clock co-ordinate], [17] altitude [high, same level, low], distance, current activity [ascending, level, descending]’.

Unlike most other ADS-B IN functionality, the ATAS system has an audible only implementation that can provide an alert to the pilot. However, in many cases it is combined with display functionality on the CDTI screen whereby the traffic triggering the alert is highlighted on the screen.

An example of a CDTI screen with integrated ATAS is shown in the Cockpit display of traffic information study section of the safety analysis.

Traffic Collision Avoidance System

Traffic collision avoidance system (TCAS) is a separate traffic avoidance system that utilises transponder interrogation of mode C and mode S units. The system interrogates the other aircraft’s transponder and calculates the relative position of other aircraft. It then, analyses the track of the host aircraft and approaching aircraft to determine if there is a collision risk. The system provides 3 levels of alerting for nearby traffic that is within a defined area around the host aircraft: (FAA, 2011)

 1.Proximal traffic, uses the same definition as ATAS (6 NM lateral and 1,200ft vertical separation) and a similar change in target aircraft symbol on the display, from unfilled to filled character (white diamond).
 2.Traffic alert, is similar to the ATAS aural alert whereby if traffic breaches a certain threshold the crew will receive an audible ’traffic, traffic’ callout and a change in target aircraft symbology to a higher contrast colour and separate shape (yellow circle).
 3.The third alert that the TCAS system provides is different to that off the ATAS system in that, having detected a collision risk, it also provides an avoidance manoeuvre recommendation based on the tracking of the host and target aircraft.

If fitted to both aircraft the TCAS systems will work together providing opposing resolution advisories that reduce the risk of collision. With the development of ADS-B technologies and more accurate aircraft positioning using GNSS data, TCAS systems have been able to be augmented with ADS-B and ATAS functionality.

The FAA provides guidance in Advisory Circular (AC) 20-172B as to how the systems can be integrated effectively so that duplicated alerts are not received based on the ADS‑B and radar returns. In addition to the increased accuracy of ADS-B data, another advantage is that it provides information on more distant targets.

Complementary technologies

In the United States ADS-B IN is supported by 2 other technologies to improve a pilot’s situational awareness of traffic proximal to them - Automatic Dependent Surveillance – Rebroadcast (ADS‑R) and Traffic Information Service – Broadcast (TIS-B). These systems are an advancement on ADS-B and radar technology and combine ADS-B information, gathered via an onboard ADS-B IN system with traffic information from ATC to provide pilots of ADS-B IN equipped aircraft with a better picture of the traffic around them.

The ADS-B network in the United States differs from that in Australia in that it uses a second ADS-B frequency. This reduces congestion and provides infrastructure for additional ADS‑B functions such as graphical weather information. The second frequency, 978 MHz Universal Access Transceiver (UAT) is used primarily by general aviation aircraft, operating at lower levels (below 18,000 ft).

While many ADS-B IN devices support both reception and display of both frequencies, some ADS‑B devices cannot. In these cases, the ADS-R network provides a rebroadcast of the alternate frequency to those aircraft that require it. Within the contents of the extended squitter parameters is an indicator of whether an aircraft is dual frequency enabled and, if not, what frequency it is broadcasting on. This allows the ADS-R network to rebroadcast relevant transmissions on the relevant frequencies without causing duplicate or over transmissions.

Due to the additional delay required for the ground stations to receive, decode and retransmit the data, there is an increased lag in reception and analysis of ADS-R data. Additionally, ADS-R systems will only work in areas where the aircraft is in range of a relevant ADS-B ground station. (FAA, 2017)  

TIS-B provides ADS-B IN equipped aircraft with approximate location and speed of aircraft detected by ATC primary and secondary surveillance radar, which is then transmitted to aircraft on the relevant ADS-B frequencies for display and utilisation in traffic alerting. This means that aircraft equipped with only a mode C or mode S transponder can be more easily located by ADS‑B IN equipped aircraft, enhancing the opportunity for visual acquisition by aircraft crew.

The system also uses position and altitude information to filter the volume of traffic data broadcast to an ADS-B IN client aircraft. TIS-B will only transmit data associated with transponder-only (non‑ADS-B OUT) aircraft detected within 15 NM horizontally and +/- 1,750 ft vertically of the ADS-B IN client aircraft. (FAA, 2017).

The implementation of these technologies, ADS-R and TIS-B, carries with them a significant expense and at this stage they have not been introduced in Australia. As more aircraft, particularly in general aviation, become ADS-B equipped and depending on the technologies and frequencies used there may be an increased appetite to introduce these systems. (Airservices Australia, 2016)

Regulator guidance

In support of the mandating of ADS-B OUT for IFR aircraft in Australia, both CASA and Airservices have produced a range of guidance material to assist pilot’s in the implementation and operation of ADS-B. Specifically, in July 2020 CASA released an advisory circular (AC 91-23 v1.0) titled ADS-B for enhancing situational awareness. The documentation covers the requirements and benefits of ADS-B OUT. However, pilots do not have real time access to ADS-B data without a device that can receive and process this data (ADS-B IN.)

Section 9.1.1 of the AC states:

Being able to receive ADS-B transmissions from other aircraft and to display that information to the pilot is an essential component of ADS-B technology to enhance a pilot's situational awareness. The capability to receive ADS-B transmissions is generally referred to as 'ADS-B IN'.

This is followed by a statement in section 9.2.1 of the AC that ADS-B IN technology is not required in any Australian aircraft.

Without the accompanying ADS-B IN functionality, ADS-B OUT only provides increased situational awareness to ATC.

Electronic conspicuity devices

Electronic Conspicuity (EC) devices are designed to assist in the identification of aircraft operating under the VFR and are not required to meet the same ADS-B OUT standards as equipment fitted to aircraft operating under the IFR. In September 2020, CASA approved these relatively cheap portable devices so aircraft could be more easily identified by both ATC and aircraft fitted with ADS-B IN systems.

The most recent iteration of these devices includes ADS-B IN functionality allowing them to display ADS-B OUT equipped traffic on a moving map relative to the receiving aircraft through portable electronic devices. The GNSS receivers that these devices use do not necessarily meet an aviation technical standard. Subsequently while Airservices can receive the transmissions and information from these devices the information is not currently displayed to ATC for airspace management and separation.

EC devices have significantly lower transmit power than full IFR ADS-B installations. This means that the distance the signal can travel and still be received and decoded is lower. This does not affect the ability for traffic to be detected by other aircraft in the area at ranges significantly greater than visual acquisition. However, it would limit their ability to be detected by satellite or ground based ADS-B receivers. This could hamper, search and rescue operations or accident investigations.

For example, the Sky Echo 2 produced by uAvionics and an approved EC device by CASA has a nominal transmit power of 20 watts (uAvionics, 2022) allowing it to be detected at ranges of up to 40 NM (OzRunways, 2022). As discussed in the satellite ADS-B reception section a minimum transmit power of 125 watts is required for satellite reception.

While not specifically designed for fitment to IFR aircraft, the use of these devices with ADS-B IN functionality connected to an EFB application can provide a cost-effective alternative to fitment of a certified ADS-B IN system. Additionally, their portability allows for a single unit to be used across multiple aircraft that already have ADS-B OUT provided the unit’s ADS-B OUT functionality is disabled. This ensures that duplicate traffic information is not transmitted.

The SkyEcho 2, can be connected to the AvPlan or OzRunways EFBs. This device can be used for ADS-B IN and OUT or it has ability for the transmit function to be disabled and only used as an ADS-B IN device. Where ADS-B OUT functionality is not required, such as in an IFR aircraft with certified ADS-B OUT, the uAvionix ’Ping’ provides an ADS-B IN functionality at a lower price point without a transmit capability.

ADS-B fitment

Currently it is a requirement for aircraft operating under the IFR to be ADS-B OUT equipped. To better understand the current environment relating to ADS-B fitment in those aircraft operating under the VFR, CASA conducted a voluntary survey of VFR pilots and aircraft related to equipment including ADS-B that was currently carried on the aircraft. The survey, conducted between March and May 2021, received unique applicable responses from 1,936 pilots relating to the 2,245 aircraft, which was deemed by CASA to be broadly representative of the VFR community in Australia. For the purposes of the survey, CASA further broke down the VFR group into general and sport aviation. General aviation is VH-registered aircraft, except gliders, paragliders, gyroplanes, and Sport aviation aircraft are those registered with sports and recreational organisations. (Civil Aviation Safety Authority, 2021)

The survey found that approximately 40% of general aviation aircraft are fitted with some form of ADS-B OUT, with 15‑18% also fitted with some ADS-B IN capability. For sport aviation aircraft this is considerably lower with less than 20% of aircraft fitted with some form of ADS-B and approximately 6‑8% fitted with or using an ADS-B IN device.

Of those general aviation aircraft that were equipped with ADS-B about 47‑50% indicated that they also had diverse antennas (top and bottom mounted). For sport aviation aircraft this was only about 14‑21% indicating that they had diverse antennas. As discussed in the Receiver network coverage section, diverse antennas provide an increased likelihood of detection by reducing shielding due to aircraft structure.

As part of the survey, CASA also looked at where these aircraft are typically operated. They found that up to 38% of General aviation aircraft and 11% of Sport aviation aircraft with ADS-B are operating in an area without ATC coverage. In these areas, the fitment of both ADS-B OUT and ADS-B IN devices is more important as there is no third-party alerting capability, such as ATC, to provide traffic information.

CASA also asked pilots about their use of EFB applications, with approximately 80% of VFR pilots utilising an EFB application, including almost 90% of general aviation pilots. Of the responses received 70% reported using either AvPlan or OzRunways as their EFB application of choice, both of which have the capability to be linked with an ADS-B device.

However, only 15‑20% of pilots reported that they had linked the EFB application with an available ADS-B device. The survey results stated:

Interestingly, pilots of general aviation aircraft have a higher level of EFB use, but a higher proportion of sports aviation pilots have their EFB linked to ADS-B. Examining aircraft that have some form of ADS-B shows that for pilots who fly general aviation aircraft, only between 28.5% and 36.0% link ADS-B to their EFB. Whereas for pilots who fly sports aviation aircraft equipped with ADS-B, between 64.1% and 80.4% link ADS-B to their EFB. (Civil Aviation Safety Authority, 2021)

Finally, the survey asked about awareness and intentions around low cost ADS-B units (EC devices). Up to 70% of VFR pilots were aware of the availability of these devices and of those, up to 50% indicated their interest in purchasing a unit. However, 37% of the survey’s respondents indicated that it would be at least 6 and more likely 12 months before they would purchase an ADS-B device.

Limitations of ADS-B IN systems

ADS-B IN systems have a significant number of advantages for pilots flying under either VFR or IFR. However, it is important to also note the limitations of the system and remind pilots that these systems are designed to assist them in their responsibilities to maintain an effective lookout for traffic and communicate in the event of a potential conflict.

ADS-B IN systems can only detect ADS-B OUT equipped traffic that is within the line of sight of the aircraft. This means IFR aircraft and ADS-B equipped VFR aircraft (including those equipped with EC devices) can be detected. Additionally, as ADS-B OUT is not mandated for all aircraft, there will remain traffic that cannot be detected and pilots must maintain a lookout and listening watch on the relevant radio frequency to ensure they are aware of all traffic in the area.

Finally, ADS-B IN functionality and traffic information should not be used to second guess or override an ATC instruction in controlled airspace.

Methodology and results

Introduction

This section outlines how human factors, aircraft performance, aircraft structure and technological considerations either affected, or could have affected, this accident. It also details the processes that the ATSB used to calculate aircraft position and performance characteristics from ADS-B data.

The factors affecting the views from each pilot’s seat and where the opposing or target aircraft would have appeared in the visual field and how reaction time, visual field and perception size affected the ability to detect the aircraft are also analysed. Finally, it illustrates how available technology could have provided additional alerting capabilities for the pilots, improving their mental model, and increasing their ability to detect and avoid the other aircraft.  

Aircraft performance study

Position estimation

As discussed in the Recorded Data section, the ATSB received all available raw ADS-B data from the Airservices receiver network for both aircraft. To be able to effectively use this data for both position estimation, calculation of Euler angles and further analysis of visibility, it needed to be processed. Specifically, position data for the 2 aircraft was interpolated to common sampling points in a common co-ordinate system and smoothed to eliminate unrealistic jumps that could introduce spurious noise in parameters calculated from the data.

The following sections outline this process and how it was undertaken.

Filtering and refinement of raw ADS-B data

For AEM the raw ADS-B data set contained 6,565 points covering 24 minutes from 10:59:59 till 11:24:20. For JQF the data set contained 539 data points covering approximately 4.5 minutes from 11:19:55 to 11:24:20. On review, it was determined that both data sets contained a volume of data that would need to be filtered out before further analysis could be completed. This primarily focused on the removal of repeated data points or data points that had the same position for 2 different times.

Figure 25 and Figure 26 show the difference in time recorded between data receptions for the 2 aircraft. The maximum time between received data points for AEM data was 6.5 seconds and for JQF it was 2.4 seconds. As noted in the Recorded data section, to avoid over transmission and data loss, ADS-B transmissions are not at constant time intervals. Variation is semi-random between 0.4 and 0.6 seconds (Francis, et al., 2011). The reception of signals depends not only on the transmission but also on any shielding, from either terrain or aircraft structure, between the transmitter and receiver.

The ATSB’s review of the data identified 3,788 points in the AEM data set that were reporting the same position as another point in the data set. Of these 2,059 were identified as repeat data points (reporting same time and position) with the remaining 1,729 within one second of one of the adjacent points. For JQF the ATSB review identified 117 points that were reporting the same position, of these 49 were identified as repeat points and the remaining 68 were within one second of an adjacent point. A filter was applied to the data to remove repeated points. Where multiple points of the same position were identified, the first data point was retained.

After the repeated points were removed, variation between data points for JQF was between 0.390 and 2.406 seconds, with an average interval of 0.628 seconds. For AEM the variation was from 0.258 – 6.508 seconds with an average interval of 0.526 seconds.

Figure 25: JQF time between signal receptions
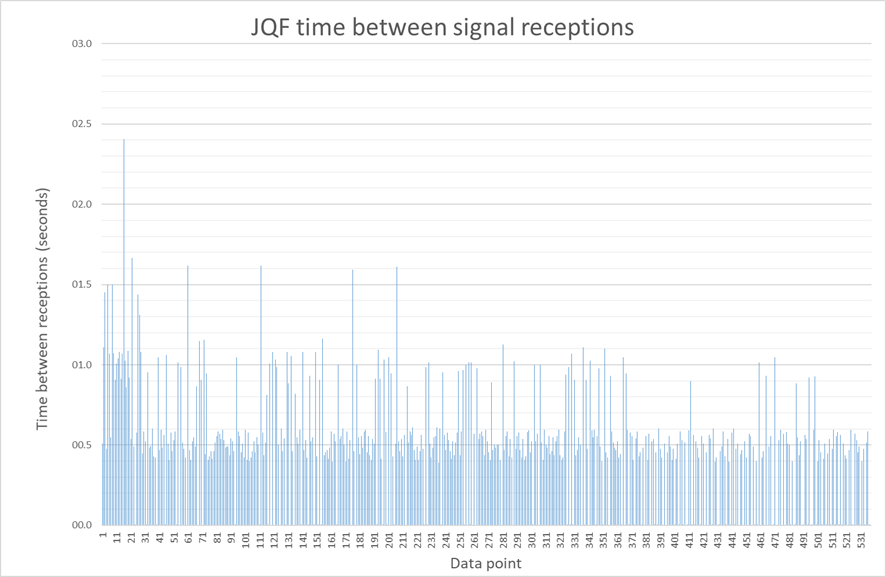
as-2022-001-pic-25.png

Source: ATSB

Figure 26: AEM time between signal receptions
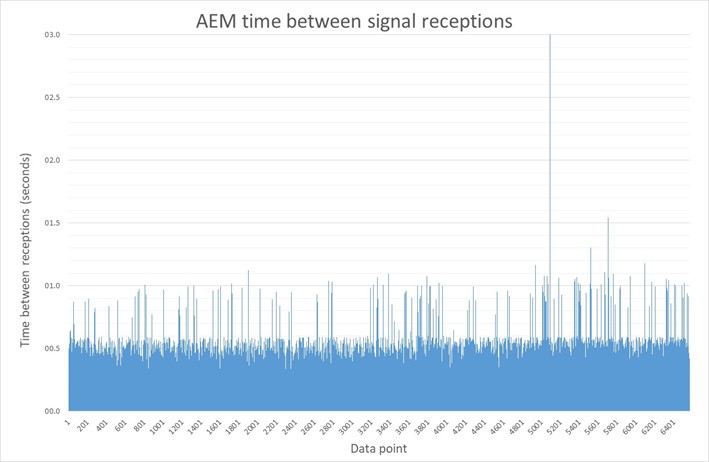
as-2022-001-pic-26.jpg

* Note: Maximum recorded separation between signal receptions was 6.5 seconds, due to the scaling of the graph this has been truncated to 3 seconds. All calculations and data analysis used 6.5 seconds’ difference for the relevant data point.

Source: ATSB

Conversion to rectangular cartesian co-ordinates

ADS-B data contains aircraft latitude and longitude position in decimal degrees to 9 decimal places. The data was simplified by converting from latitude and longitude to rectangular cartesian co-ordinates. In this case, eastings and northings in meters relative to a reference point within a certain area on the earth’s surface. While not as accurate globally as latitude and longitude, these cartesian co-ordinates allow for simpler calculations of relative positions and proximities when locations are nearby. For this study the ATSB utilised a batch processing application of Geoscience Australia’s Geodetic Calculator [18] to convert the data from latitude and longitude to eastings and northings.

To simplify the data processing, the co-ordinates were identified relative to a reference point within the global co-ordinate system. In this case, while JQF departed runway 23 the threshold of runway 05 at Mangalore Airport was utilised, as the aircraft passed over this point while airborne. [19] Figure 27 and Figure 28 show JQF and AEM’s flight paths in cartesian co-ordinates in meters relative to this reference point. Although altitude was recorded in feet, no conversion of the data was required at this stage.

Data smoothing

While GPS data is highly sampled and relatively accurate, positional and altitude discrepancies do occur, which can cause jumps or steps in the data. Additionally, ADS-B altitude is recorded in 25 ft steps. Further calculations, particularly calculation of the Euler angles, using raw data would lead to unrealistic variation in multiple parameters. This, in turn, would affect the positioning of the aircraft and structure in later visibility calculations. To account for this, the ATSB smoothed both position and altitude data using a series of methods including integrations and running averages. The result of this smoothing was best fit lines through the data points that more accurately represented the flight profiles than the raw data set.

The following figures show the smoothed tracks for both position and altitude compared to the data recorded in the raw ADS-B Data. Figure 29, 30 and 32 show the location and altitude of AEM in comparison to the smoothed data. Figure 31 and Figure 33 show the same information  for JQF. The figures show that the smoothed data accurately represented the position for both aircraft, and it removes the ’stepped’ nature of the altitude.

Resample data

To simplify the calculations and enable the aircraft positions over time to be compared, the position of each aircraft needed to be known at a constant time interval with a common time base. As the time intervals between raw ADS-B data points is not constant the data needed to be resampled to a constant time interval. The smoothed data developed through the process described above can be represented as a curve of the aircraft position through time. The position of each aircraft along these curves at a constant time interval, in this case 0.5 seconds, from a defined base point were obtained. The time 11:20:00 was selected as the base point for the analysis as it was close to the take-off time of JQF and simplified calculations being on a 10-minute divisor.

Figure 27: JQF flight track in relative cartesian co-ordinates
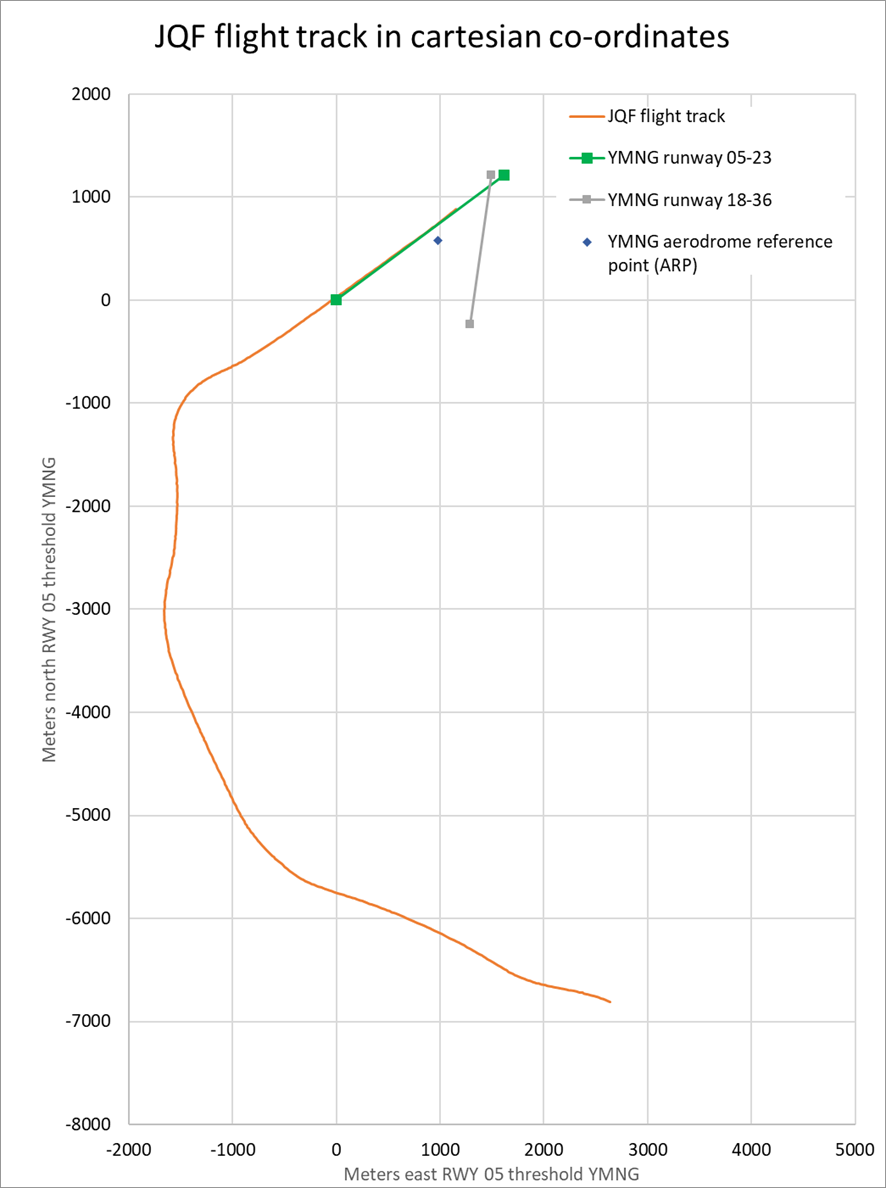
as-2022-001-pic-27.png

Source: ATSB

Figure 28: AEM flight track in relative cartesian co-ordinates
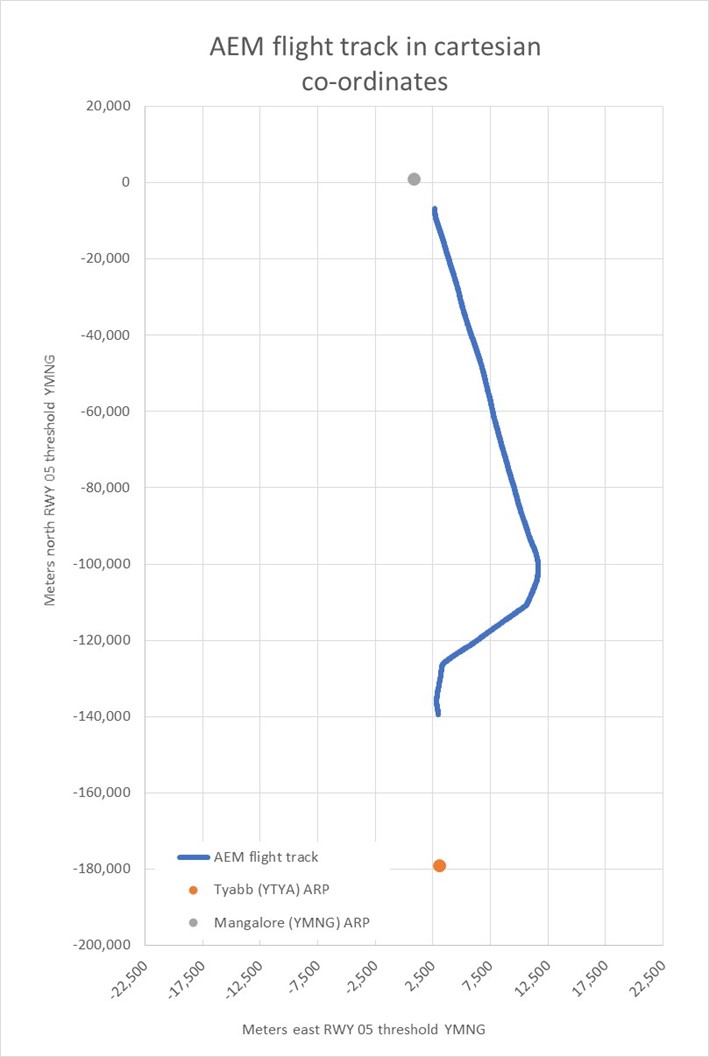
as-2022-001-pic-28.jpg

Source: ATSB

Figure 29: AEM calculated position vs ADS-B position
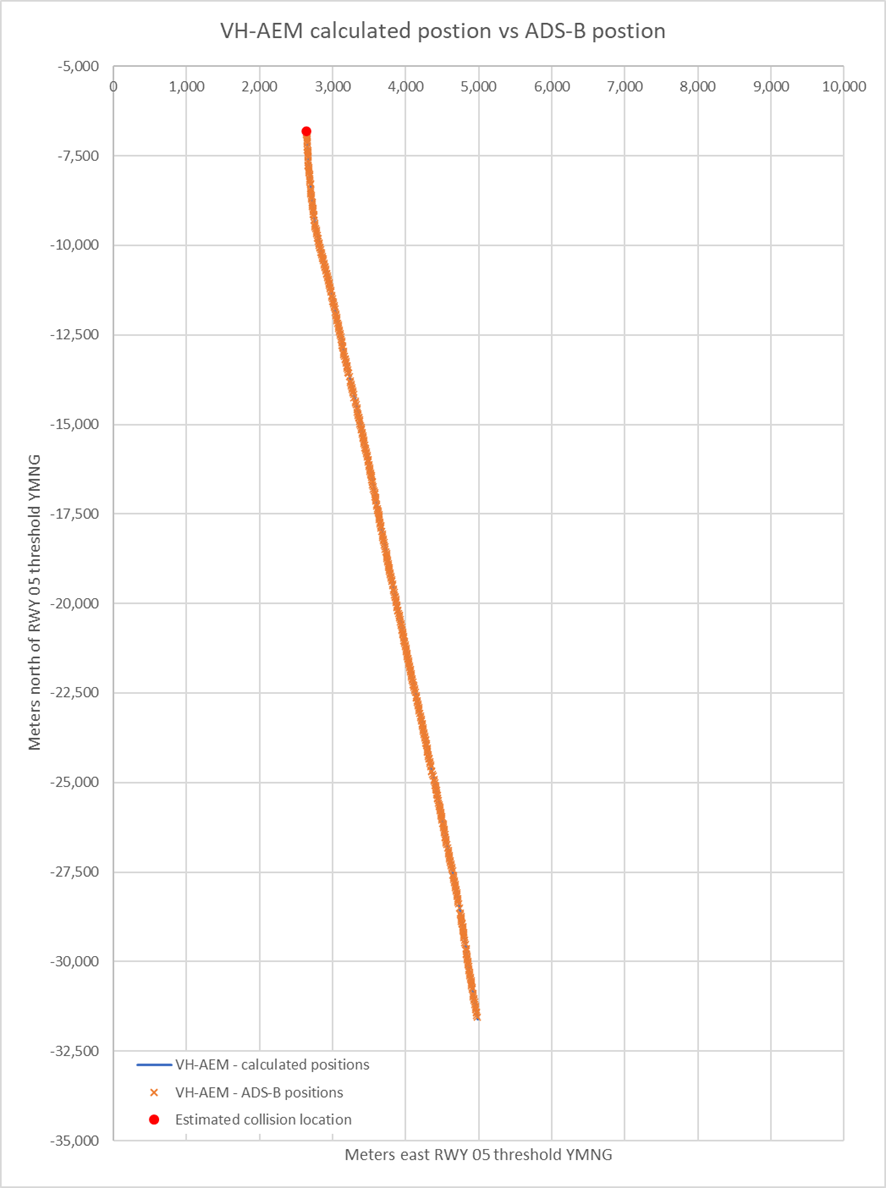
as-2022-001-pic-29.png

Source: ATSB

Note: Due to scaling constraints and resolution of the image the line representing the AEM calculated positions is not visible beneath the AEM ADS-B location data. To confirm the correspondence the ADS-B data was removed from this graph and a check carried out. To overcome scaling constraints the final 30 seconds of AEM’s data was reproduced in Figure 30 and shows the similarity between the ADS-B and calculated positions.

Figure 30: AEM calculated position vs ADS-B position (last 30 seconds)
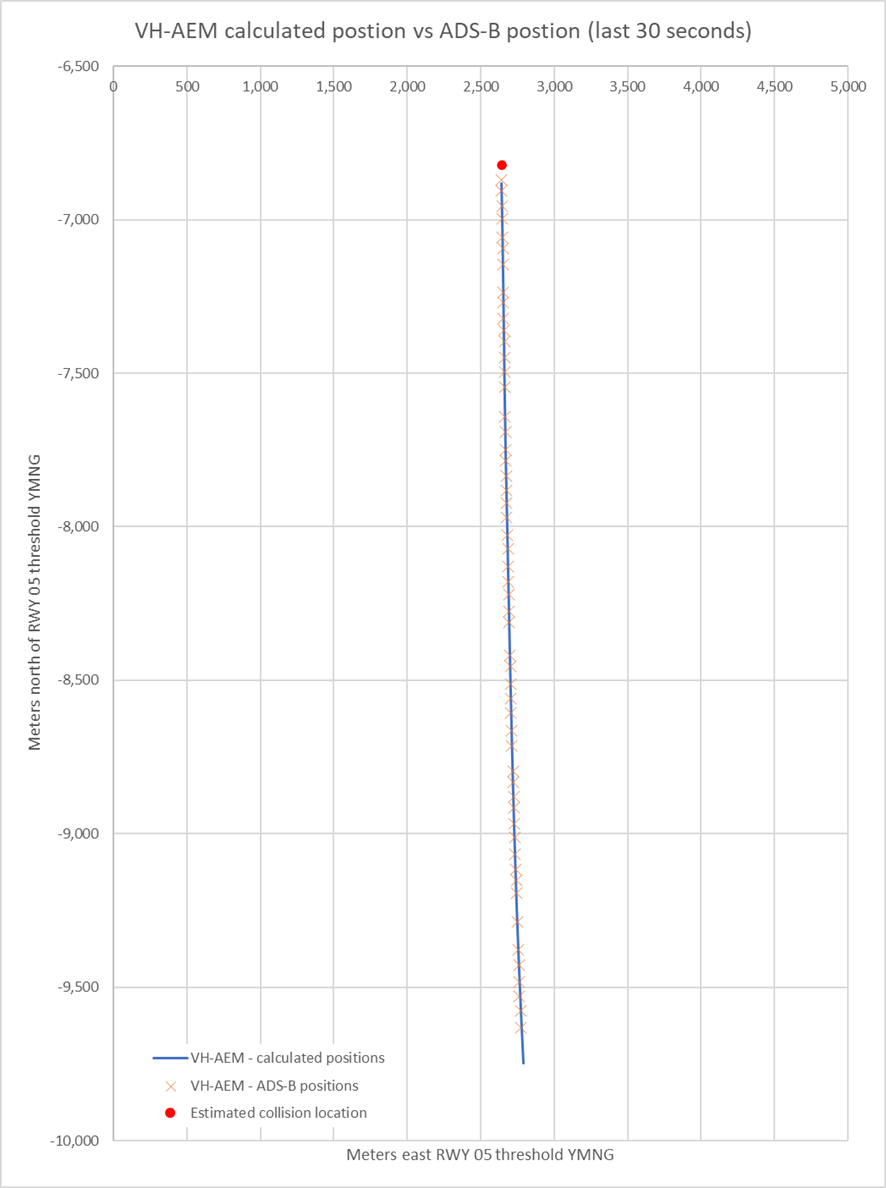
as-2022-001-pic-30.png

Source: ATSB

Figure 31: JQF calculated position vs ADS-B position
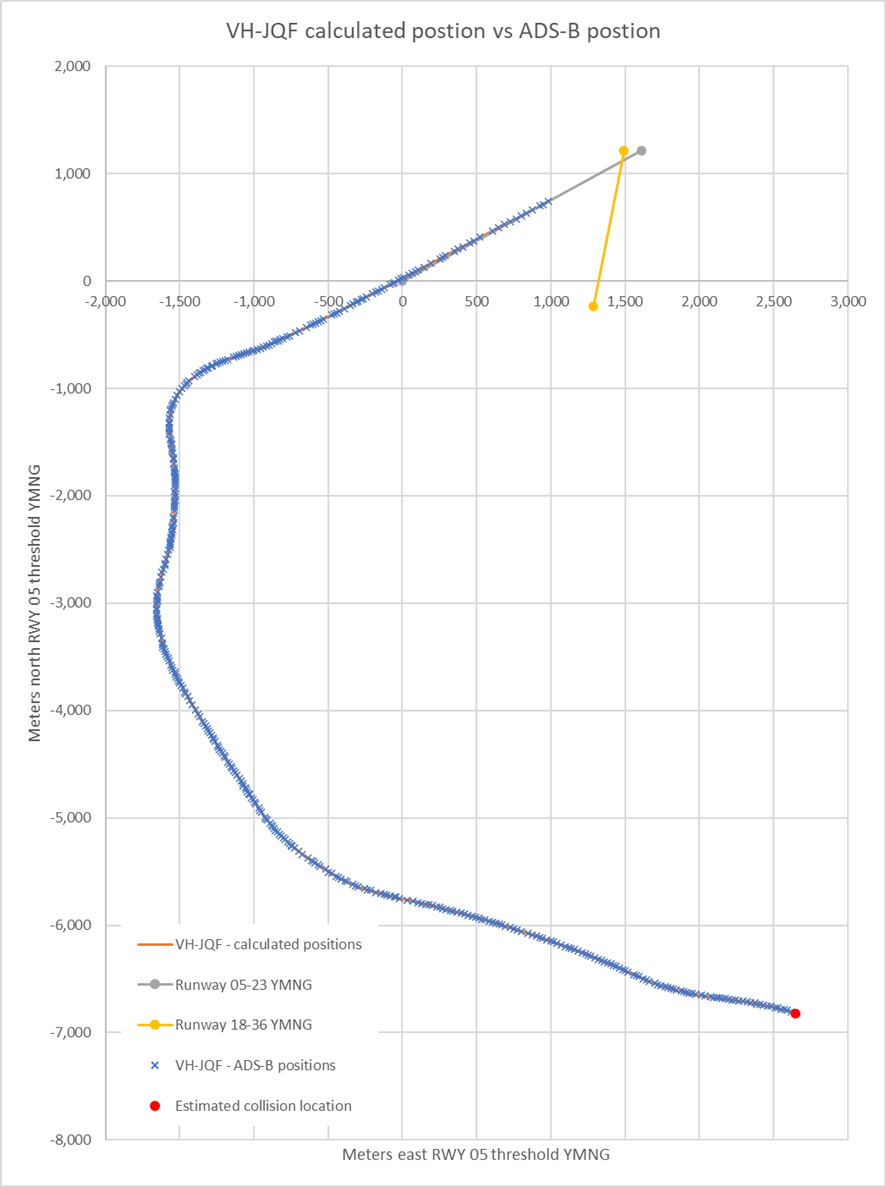
as-2022-001-pic-31.png

Source: ATSB

Figure 32: AEM calculated altitude vs ADS-B altitude over time
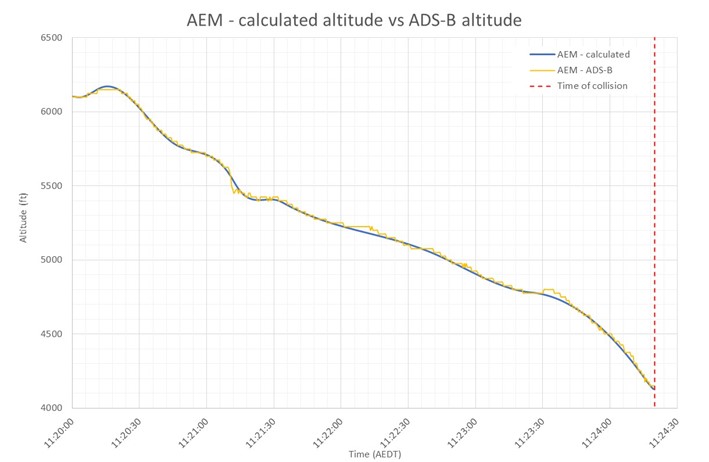
as-2022-001-pic-32.jpg

Source: ATSB

Figure 33: JQF calculated altitude vs ADS-B altitude over time
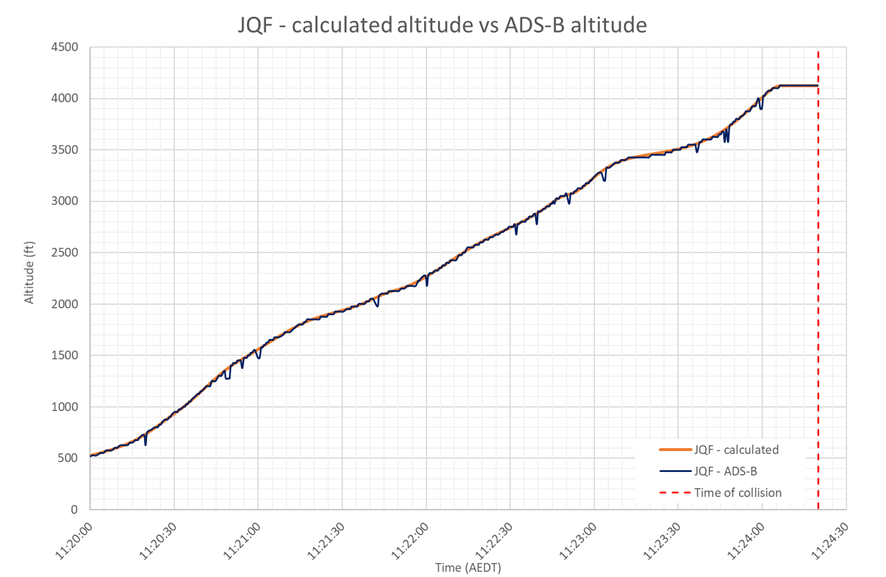
as-2022-001-pic-33.png

Source: ATSB

Calculation of Euler angles

If the position of an aircraft as a function of time is known, then it is possible to estimate the Euler angles provided the following are known (O’Callaghan, 2020):

      1.    The motion and density of the air mass relative to the earth (wind)
      2.    The lift co-efficient as a function of the angle of attack
      3.    The gross weight of the aeroplane
      4.    The sideslip and lateral acceleration of the aircraft are negligible (aircraft is in co-ordinated flight).

Where actual values were available or could be calculated from known information for these parameters, they were used. Where values were not available, they were estimated based on known parameters about the aircraft, conditions and the type of operation.

In their aircraft performance and cockpit visibility study, the NTSB described how the Euler angles could be calculated (O’Callaghan, 2020):

The position of an airplane as a function of time defines its velocity and acceleration vectors. In coordinated flight [assumed], these vectors lie almost entirely in the plane defined by the airplane’s longitudinal and vertical axes. Furthermore, any change in the direction of the velocity vector is produced by a change in the lift vector, either by increasing the magnitude of the lift (as in a pull-up), or by changing the direction of the lift (as in a banked turn). The lift vector also acts entirely in the aircraft’s longitudinal-vertical plane, and is a function of the angle between the aircraft longitudinal axis and the velocity vector (the angle of attack, 𝛼). These facts allow the equations of motion to be simplified to the point that a solution for the airplane orientation can be found given the additional information about wind and the airplane lift curve (i.e., 𝐶𝐿 vs. 𝛼).

Euler angles, based on the ATSB’s smoothed position data, are shown below. Figure 34 - 36 show the pitch, roll (bank angle), heading (magnetic and true) of both AEM and JQF as a function of time leading up to the collision. Figure 37 shows the computed air and ground speeds of both aircraft.

The data showed that AEM had some minor deviations in pitch, less than 5°, throughout the final 260 seconds of the flight. Over the last 80 seconds of the flight the aircraft’s pitch trended downwards until the final 10 seconds when it trended up by approximately 2°. Variation in roll was minimal, apart from several spikes in the bank angle, none more than 5°. Heading and track angle remained near constant throughout final 260 seconds with the aircraft travelling north.

Data for JQF showed it making turns as per the flight path with changes in roll and heading corresponding to these manoeuvres. Throughout the flight, pitch remained in an upward trajectory with some reduction in areas where the aircraft levelled or decreased its rate of climb. Figure 38 shows the rate of climb in feet per minute based on the smoothed altitudes.

Figure 34: Aircraft pitch angles over time
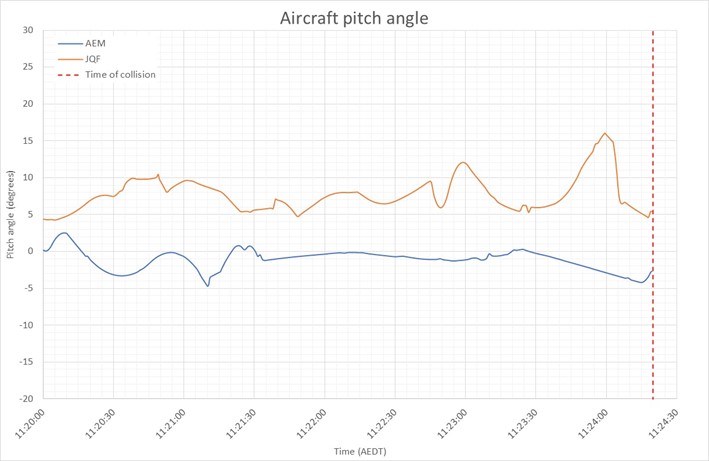
as-2022-001-pic-34.jpg

Source: ATSB

Figure 35: Aircraft roll (bank angle) over time
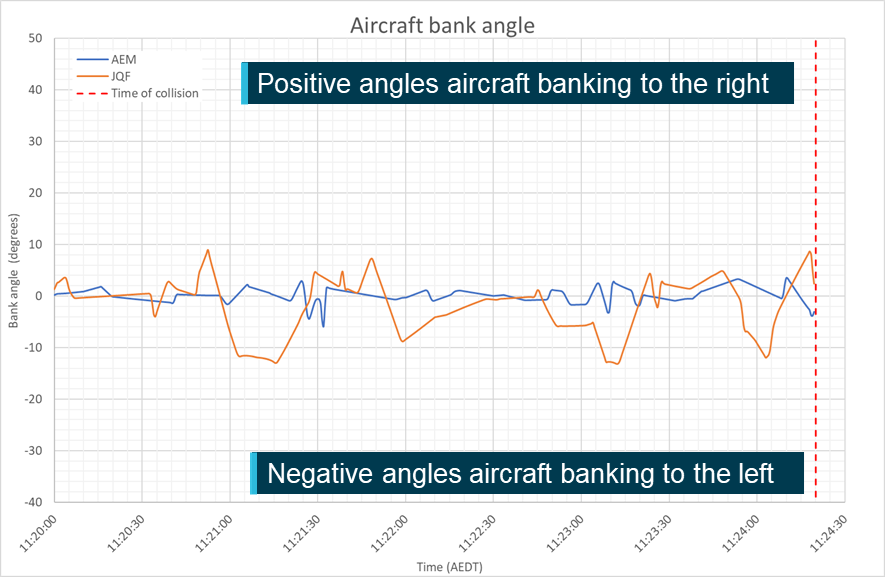
as-2022-001-pic-35.png

Source: ATSB

Figure 36: Aircraft heading and track angles
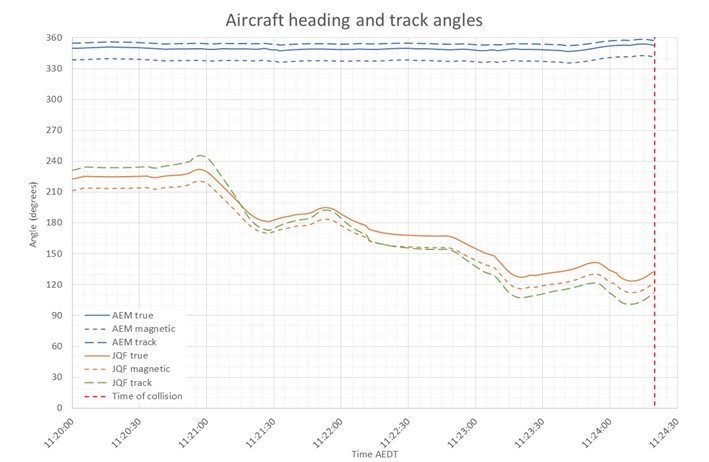
as-2022-001-pic-36.jpg

Source: ATSB

Figure 37: Aircraft speeds over time
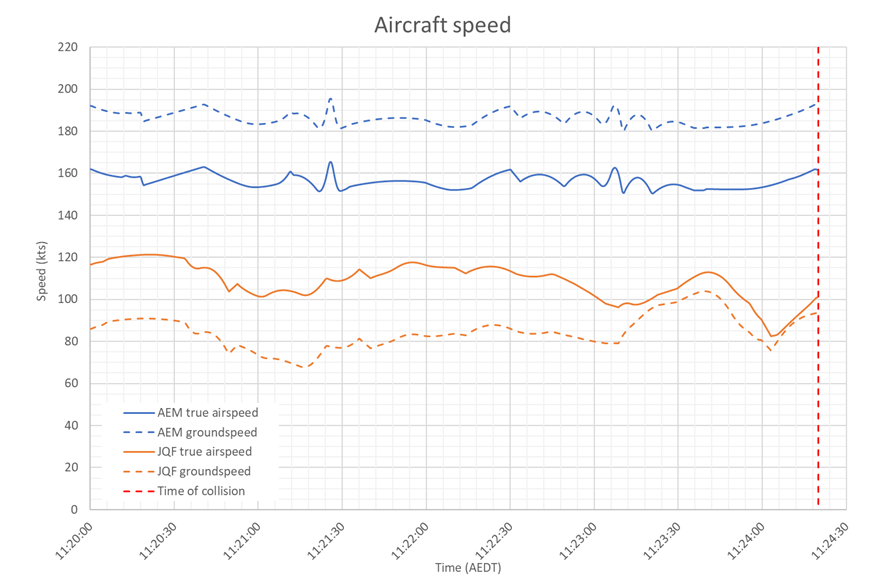
as-2022-001-pic-37.png

Source: ATSB

Figure 38: Aircraft rate of climb
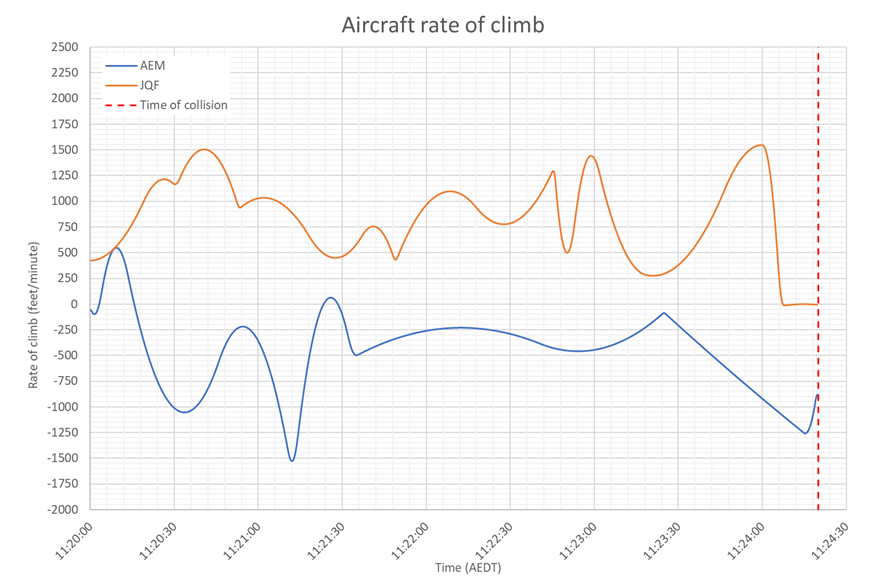
as-2022-001-pic-38.png

Source: ATSB

Collision geometry

Based on the estimated positions and calculated performance characteristics, the ATSB sought to estimate the collision geometry between the 2 aircraft. The aim of this was to determine whether the collision geometry based on the performance analysis agreed, within limitations of the data, with that determined using the on-site wreckage assessment. This provided a cross check to both the performance analysis and the on-site wreckage assessment.

Aircraft proximity

The ATSB first analysed the position data, within the resampled smoothed data set, over time looking at the distances and altitudes between the 2 aircraft. This established the collision location, geometry and aircraft closure rate (see the section titled Aircraft closure rate).

The following parameters were calculated for this assessment, aircraft metres east and north of the Mangalore Airport runway 05 threshold over time and lateral, vertical and total proximity over time. To calculate the total proximity over time, altitudes were converted to meters. Figure 39 to Figure 43 show the results for each of these parameters.

Figure 39: Aircraft metres east of runway 05 threshold
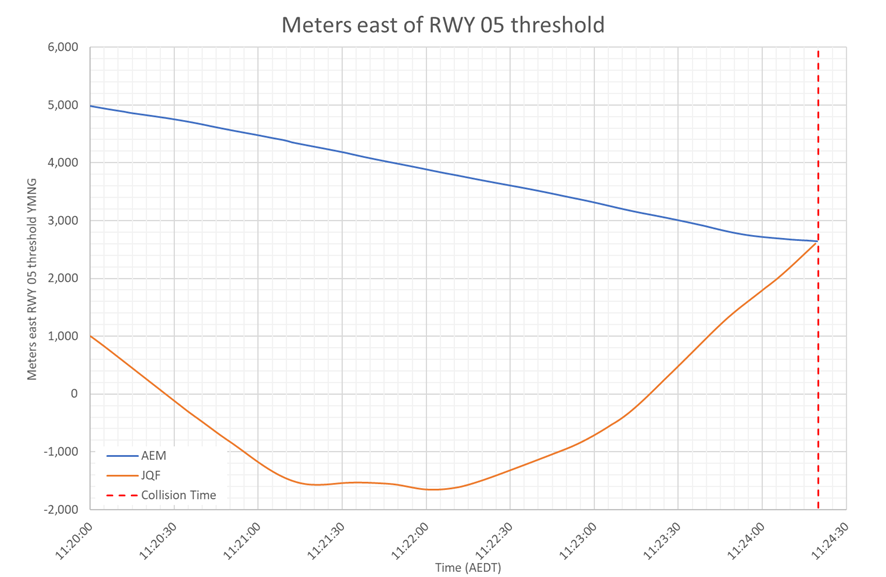
as-2022-001-pic-39.png

Source: ATSB

Figure 40: Aircraft meters north of runway 05 threshold
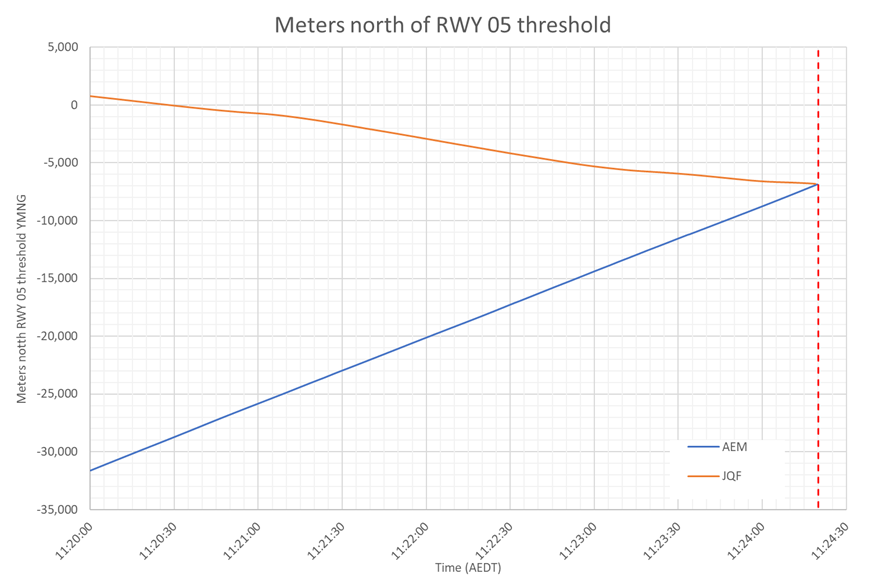
as-2022-001-pic-40.png

Source: ATSB

Figure 41: Lateral proximity
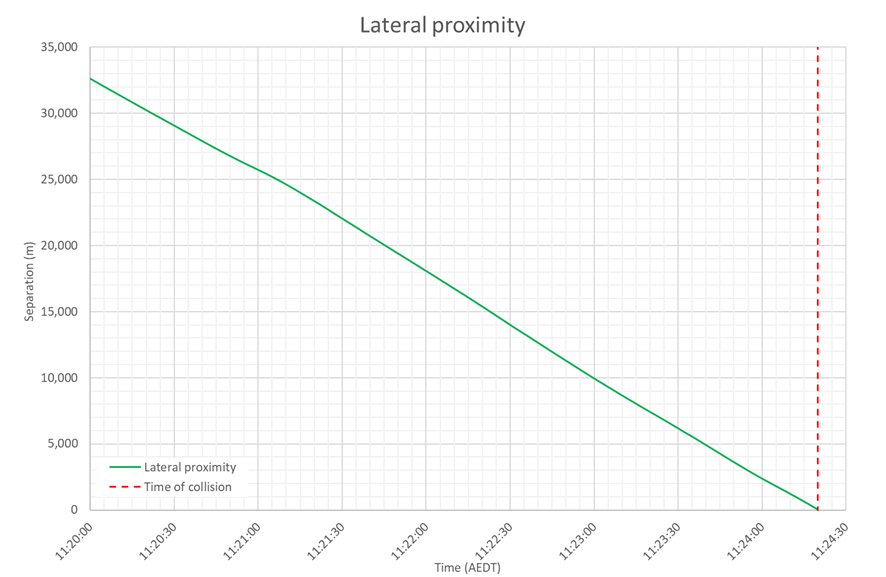
as-2022-001-pic-41.png

Source: ATSB

Figure 42: Vertical proximity
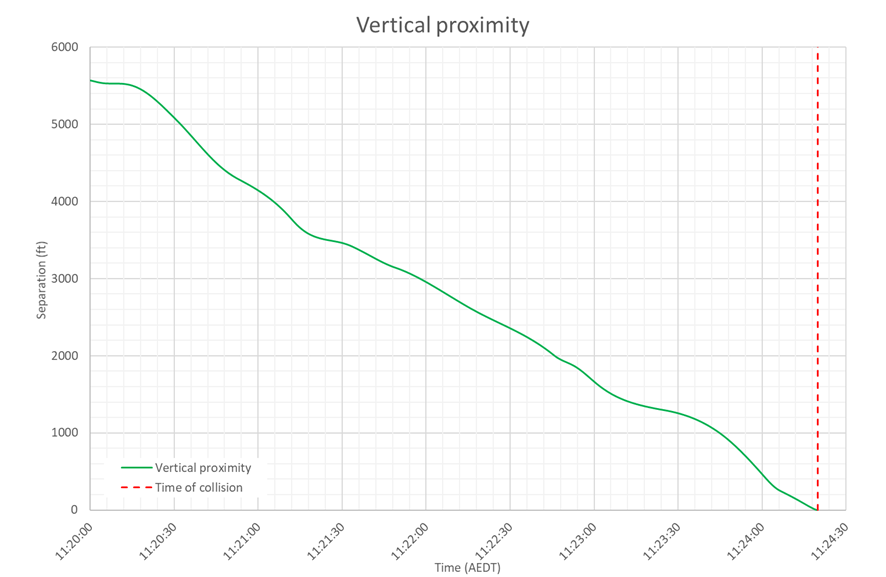
as-2022-001-pic-42.png

Source: ATSB

Figure 43: Total proximity
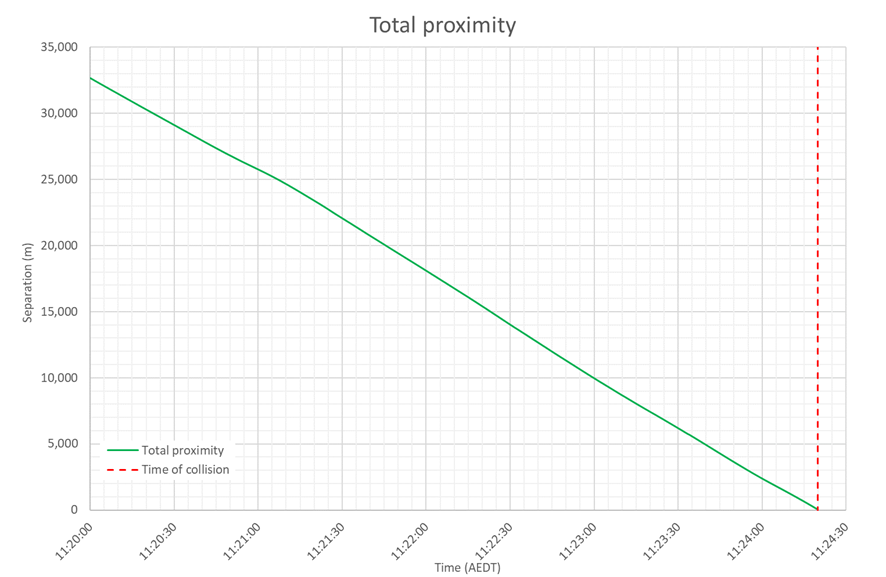
as-2022-001-pic-43.png

Source: ATSB

Geometry projection and estimation

The ATSB extrapolated 3 additional data points beyond the end of the previously assessed data set. Based on previous analysis, it was understood that this would take the aircraft through and beyond the estimated point of collision. These calculations resulted in Figure 44 with the projected position of the aircraft at 11:24:20.05. This was calculated to be the first time that either aircraft would have passed through the centreline of the other and represented the time of the collision. The linear representations of the aircraft accurately depict scale but does not accurately depict the structure’s shape.

The data showed a similar collision geometry to that estimated from the wreckage examination (Figure 45 and Figure 46). The ATSB estimated and plotted the difference. It was determined that there was approximately a 5-10 metre difference between the projected and estimated collision geometries. Based on the resolution of the data available, and the range of inherent errors both in the positions and the assumptions that had to be made to complete the analysis, it was concluded that the 2 data sources supported one another. It was further noted that, due to disturbance of both aircraft wreckages, the collision geometry calculated based on the wreckage examination also relied on a level of estimation of the aircraft position and orientation.

The ATSB’s analysis indicated that approximately 0.55 seconds before the collision AEM was on a true heading of 352° and JQF on a true heading of 132°, giving a relative angle of 140°. At this time JQF and AEM were estimated to be at approximately the same level (JQF 4,124 ft and AEM 4,127 ft) with JQF maintaining its altitude and AEM descending towards Mangalore Airport at a reducing rate. Based on this the estimated collision altitude was 4,125 ft. The ground speeds of the aircraft were 92 kt and 192 kt, for JQF and AEM respectively and the closing speed was approximately 244 kt (see the section titled Aircraft closure rate for further detail).

Figure 44: ATSB aircraft ADS-B position projection
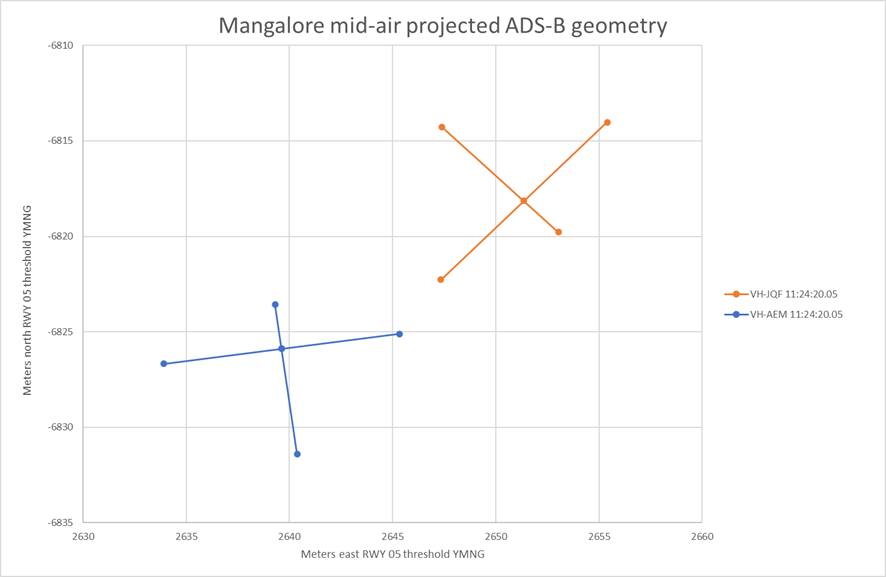
as-2022-001-pic-44.png

Source: ATSB

Figure 45: ATSB collision geometry estimation
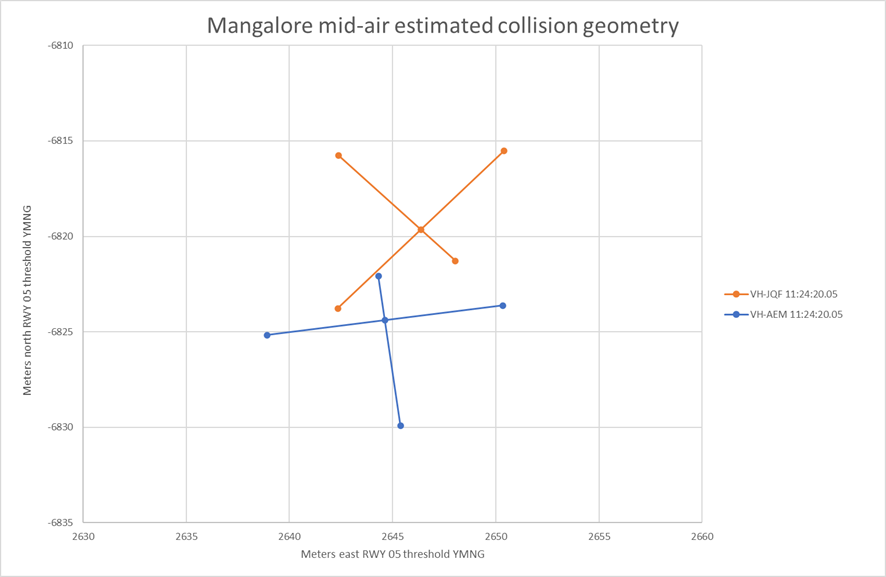
as-2022-001-pic-45.png

Source: ATSB

Figure 46: Estimated collision geometry from wreckage analysis – investigation report.
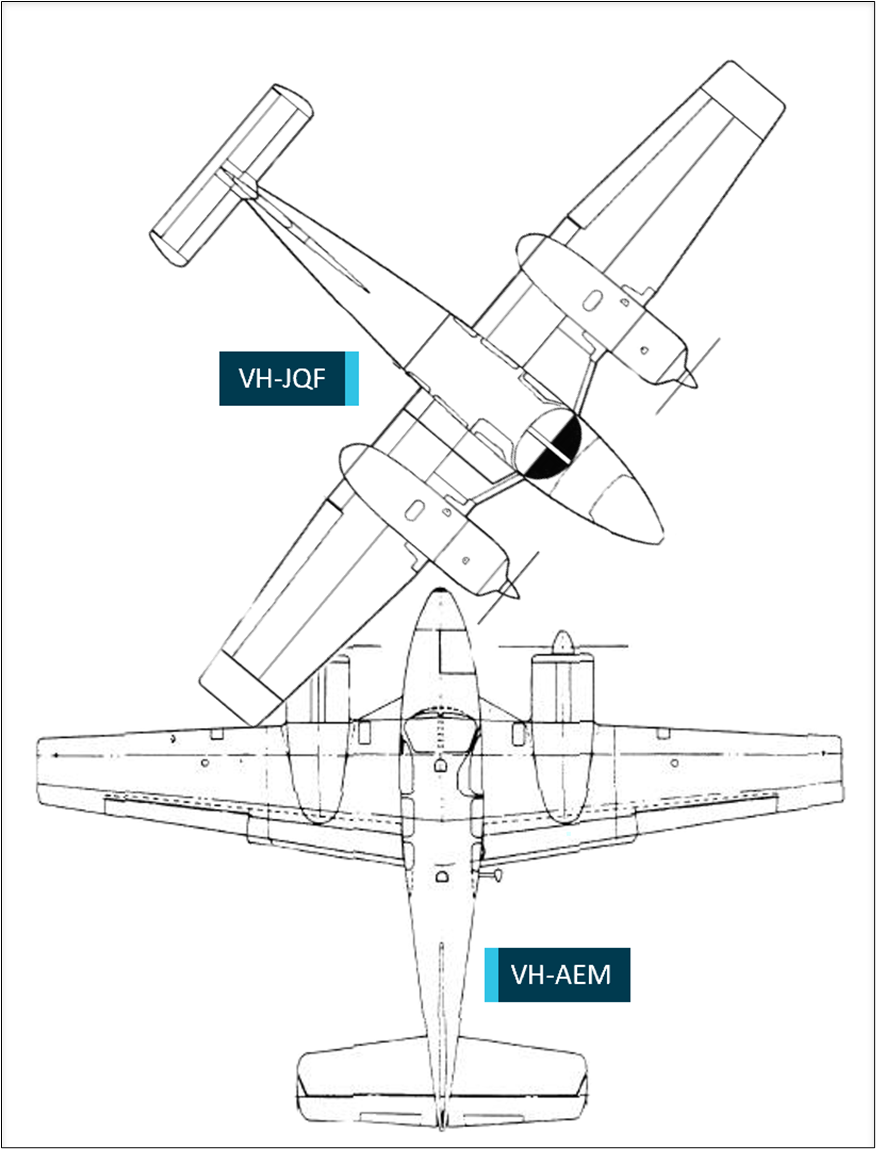
as-2022-001-pic-46.png

Source: ATSB

Aircraft closure rate

Based on the position assessment, the closure rate between the 2 aircraft was calculated. For the final 260 seconds prior to impact, the rate varied between 197‑271 kt, with an average closure rate of 244 kt. Figure 47 shows the change in closure rate in the period leading up to the impact, with the rate increasing to just above the average in the final moments before the collision.

Figure 47: Aircraft closure rate (kt)
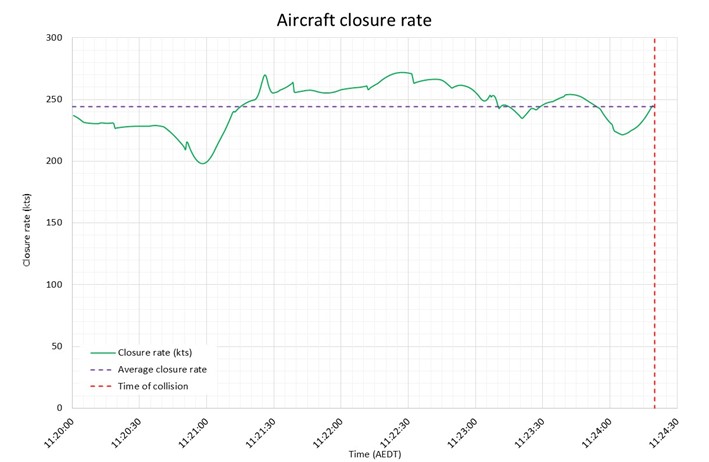
as-2022-001-pic-47.jpg

Source: ATSB

Research presented in the Object perception section and shown in Figure 12, indicated that for these aircraft with a closure speed of 245 kt, it would be expected that the angular size of the target aircraft would have been approximately 0.4-0.5° about 10-12 seconds before the collision.

Cockpit visibility study

As detailed previously, at the time of the collision one or both aircraft were likely in or had just emerged from cloud. Additionally, research presented in the Reaction time section indicated that at least 12.5 seconds is required for aircraft pilots to effectively see and avoid a converging aircraft.

The cockpit visibility assessment will consider the likelihood that the pilots could have detected each other within this timeframe, even if the environmental conditions had been more conducive to visual acquisition. It will consider a scenario where a cloud layer was present, but at a higher altitude, resulting in greater visibility while having little impact on the presence of the sun, the background luminance or contrast values for the aircraft.

Aircraft observed size

Based on the positional and performance analysis outlined in the previous section, the ATSB determined the approximate angular size of the target aircraft in the eyes of the pilots of the viewer aircraft. For this assessment, the azimuth and elevation angles to the following 5 different points on the aircraft were considered:

  • intersection point of wings and centreline of the fuselage
  • nose
  • tail
  • forward tips of both wings.

The difference between the maximum and minimum azimuth angles represents the maximum angular size of the aircraft in the pilot’s eye. As Figure 48 - Figure 51 show there was little change in the aircrafts’ relative size until the last 10-12 seconds before the collision.

AEM

In the case of AEM, the target aircraft’s angular size (if visible and without obstruction) would have been approximately 0.39° 12.5 seconds prior to the collision. This increased to 1°approximately 5 seconds before the collision and 7.5° in the last second before impact. Based on the research presented earlier, it is highly unlikely, even with clear conditions that the target aircraft would have been a perceptible size to the pilots of AEM 12.5 seconds before the impact, limiting opportunities for avoiding action.

JQF

In the case of JQF, the target aircraft’s angular size would have been (if visible and without obstruction) approximately 0.43° from either pilot’s field of view 12.5 seconds prior to the collision. This increased to 1° approximately 6 seconds before the collision and 8.6° in the last second before the collision. As above, it is highly unlikely that AEM would have been a perceptible size to the pilots of JQF 12.5 seconds before the impact to have permitted avoiding action.

Figure 48: Angular size of JQF from AEM for the last 260 seconds.
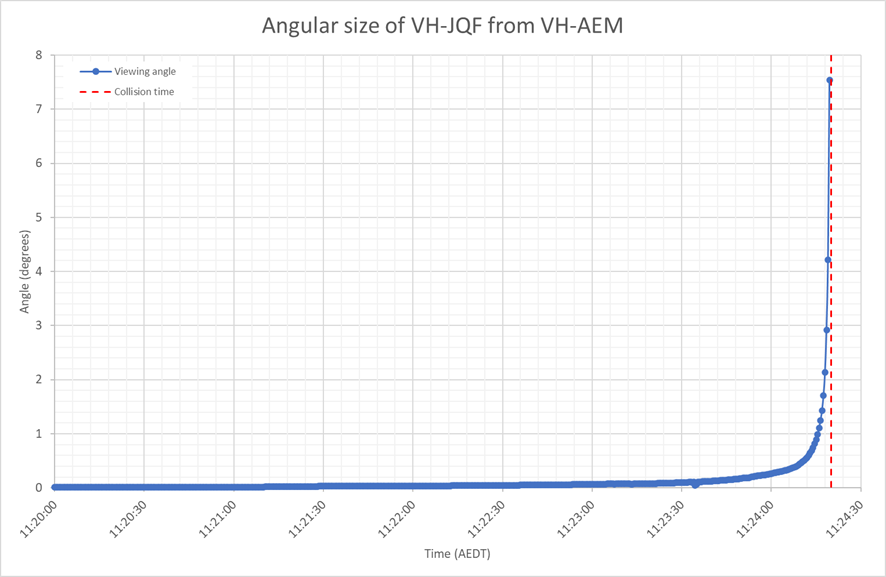
as-2022-001-pic-48.png

Source: ATSB

Figure 49: Angular size of JQF from AEM for the last 15 seconds
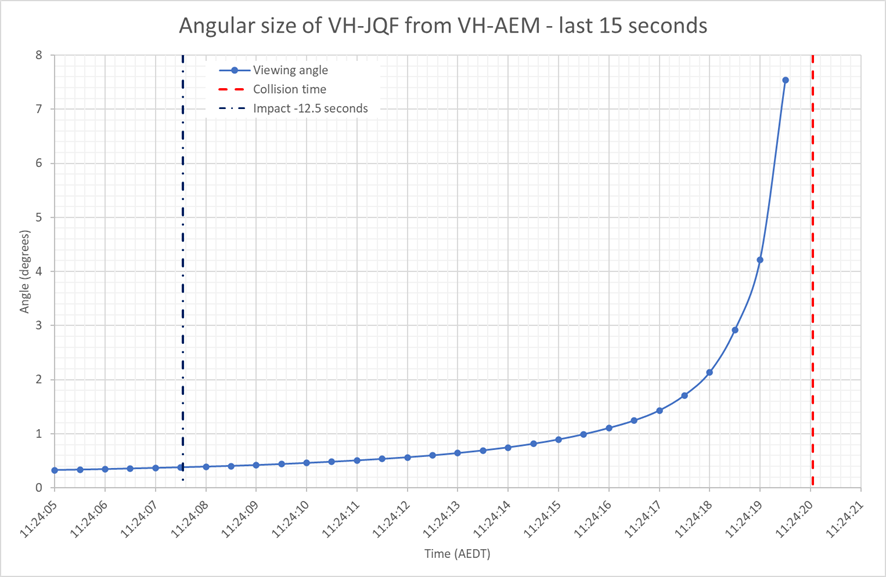
as-2022-001-pic-49.png

Source: ATSB

Figure 50: Angular size of AEM from JQF for the last 260 seconds.
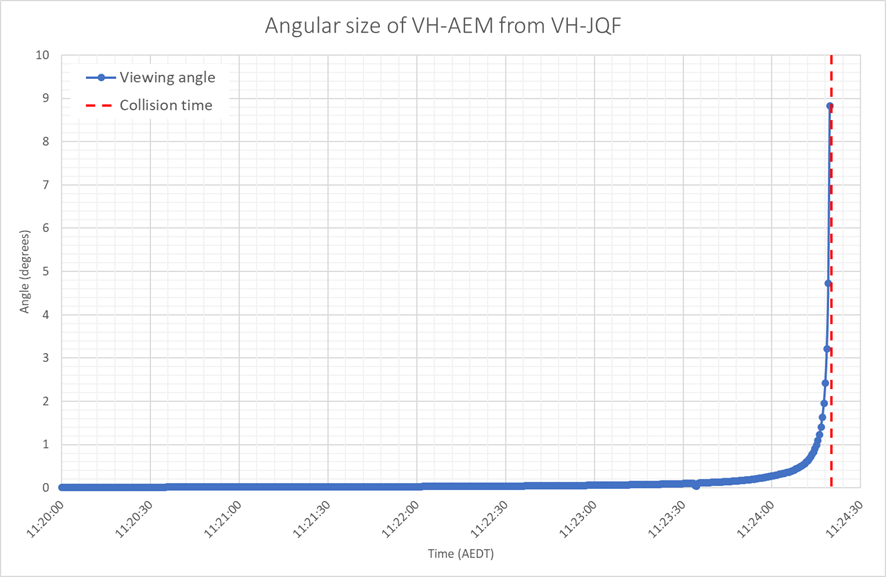
as-2022-001-pic-50.png

Source: ATSB

Figure 51: Angular size of AEM from JQF for the last 15 seconds
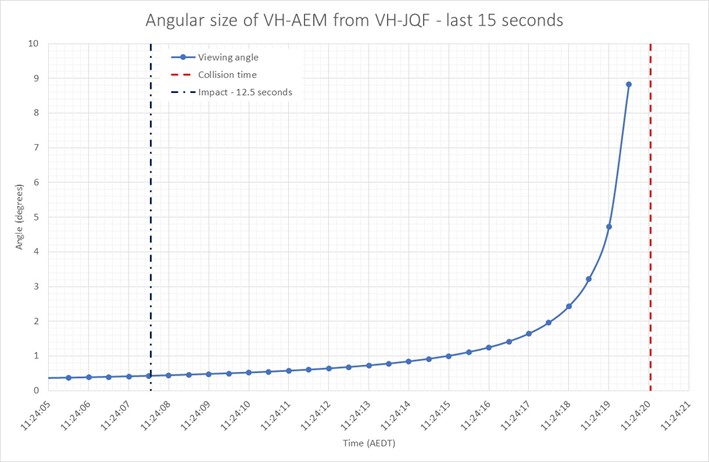
as-2022-001-pic-51.jpg

Source: ATSB

Sun consideration

Sun location

With the azimuth and elevation from a particular location known, it is possible to calculate the azimuth and elevation angles from the aircraft to sun as both the aircraft and the sun move over time. As discussed in the Meteorological Information section, the ATSB obtained the sun azimuth and elevation relative to the collision point for the 270 seconds leading up to the accident. These values were obtained at 30 second increments and a linear interpolation was used to calculate positions at half second intervals equivalent to the resampled position data. From this the azimuth and elevation from each aircraft to the sun were calculated.

Figure 52 and Figure 53 show the azimuth and elevation angles from AEM and JQF to the sun over time. Figure 54 and Figure 55 show the location of the sun in relation to the cockpit structure from the position of both left and right seat pilot’s for AEM. Figure 56 and Figure 57 show azimuth and elevation for JQF.

Sun visors

Both AEM and JQF were fitted with visors to limit sun glare. Due to the disruption of the wreckage on both accident sites it was not possible to determine if the visors were being used at the time of the collision.

AEM’s flight path altitudes indicated that it was above the cloud during its flight and so the sun visors may have been utilised during some portions for the flight. However, the presence of cloud at and above the approximate collision altitude and the ATSB analysis of the aircraft trajectories and sun positions indicated that the sun was in such a position that the visors are unlikely to have been necessary. Consequently, they were considered to have been in the stowed position.

The location and flight path of JQF was entirely beneath the could layer at approximately 4,200 ft and within its estimated extents. The ATSB analysis of the aircraft trajectory and sun position also indicated that the sun was in a position whereby the visors would not have been necessary and have subsequently been considered in the stowed position.

Differently to AEM, the visors of JQF were see through (see Figure 19). Instead of a solid barrier they had a tinted piece of Perspex that could be brought down into the pilot’s field of view to limit sun glare. While this does not have as significant an impact on visibility as the solid visor, the tinting of the Perspex can disguise objects in the visual field or make them harder to see by either changing the contrast between the object and the background or dimming lights intended to indicate position.

Sunglasses

Sunglasses worn by pilots can have a similar effect, particularly those with polarised lenses. However as discussed in the above paragraphs, the lighting conditions and sun positions would tend to indicate that it is unlikely that glasses were being worn in the lead-up to the collision.

One of the 4 pilots involved in the accident required vision correction for exercising the privileges of their license, while this does not preclude the use of standard sunglasses in conjunction with contact lenses there are also several other options available for glare reduction. These include over-glasses, prescription sunglasses the use of transitions lenses, which adjust filtering based on brightness. Given the conditions it is unlikely that these options were in use at the time or that transitions would have provided significant filtering given the background luminance of an overcast day.

Figure 52: Azimuth and elevation angles from AEM to sun
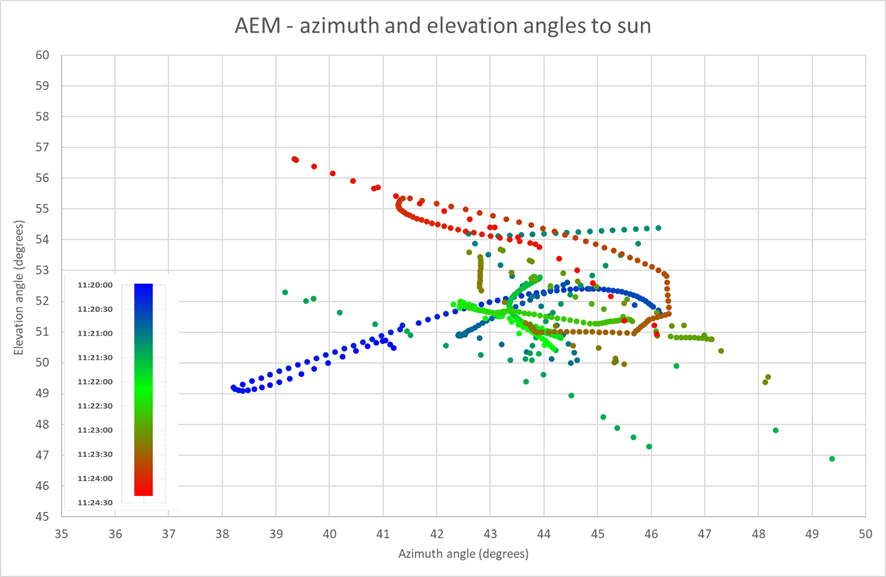
as-2022-001-pic-52.png

Source: ATSB

Figure 53: Azimuth and elevation angles from JQF to sun
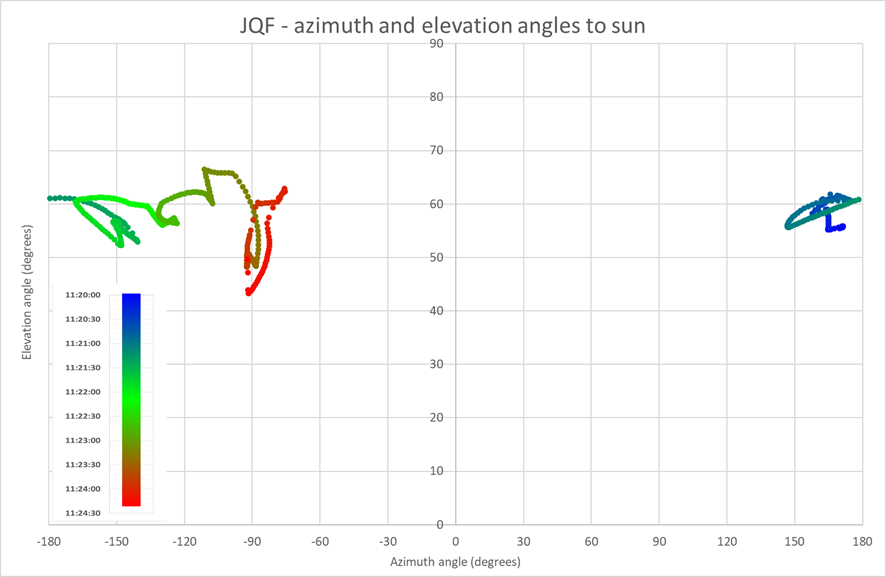
as-2022-001-pic-53.png

Source: ATSB

Figure 54: AEM left seat pilot azimuth and elevation angles to sun
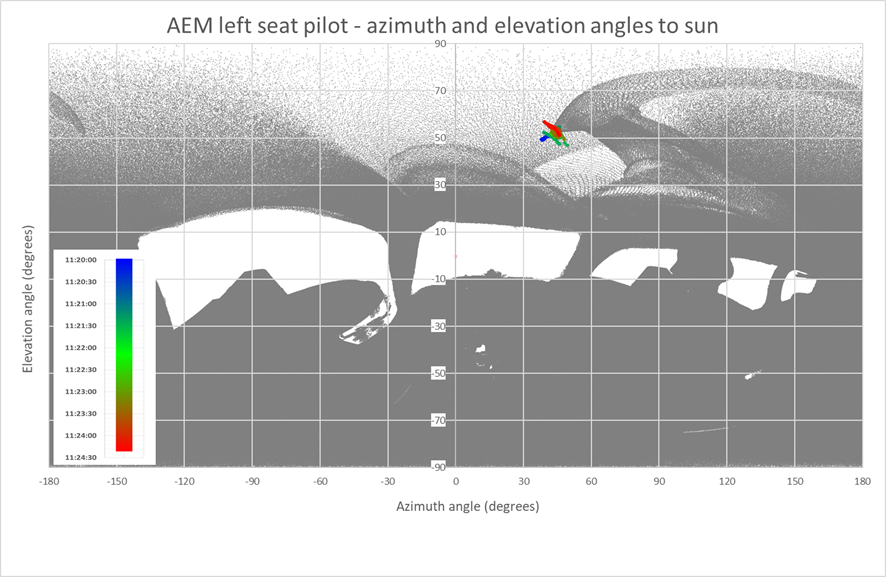
as-2022-001-pic-54.png

Source: ATSB

Figure 55: AEM right seat pilot - azimuth and elevation angles to sun
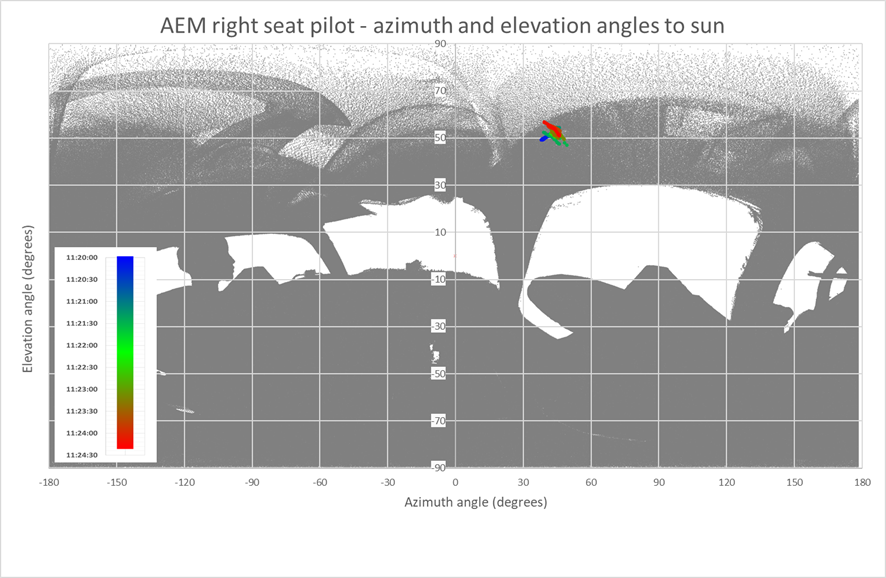
as-2022-001-pic-55.png

Source: ATSB

Figure 56: JQF left seat pilot - azimuth and elevation angles to sun
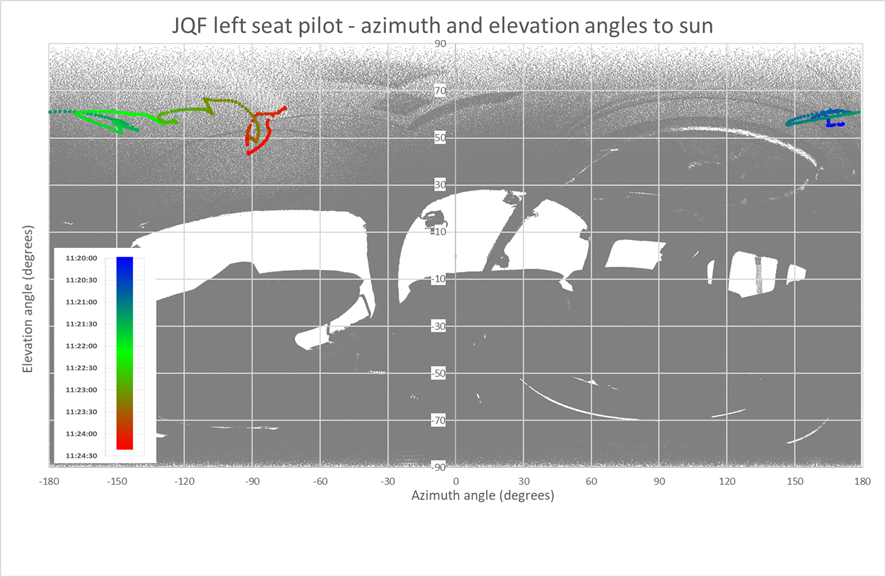
as-2022-001-pic-56.png

Source: ATSB

Figure 57: JQF right seat pilot - azimuth and elevation angles to sun
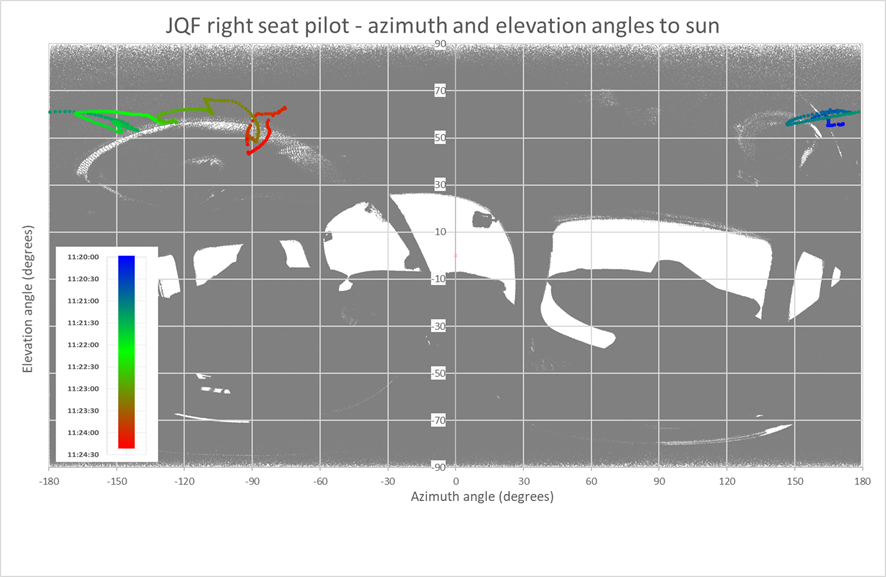
as-2022-001-pic-57.png

Source: ATSB

Aircraft contrast

Calculation of visual contrast for the target aircraft depends on the luminance of the aircraft and the luminance of the background that it is seen against. The ratio of these 2 factors give the aircraft’s contrast. The higher the contrast, the easier it is for an object to be detected against its background.

Background luminosity

The background luminosity depends on the:

  • light source
  • background that the aircraft is seen against.

The light source in this case was the sun diffused through a layer of cloud. However, the background was subject to change from the perspective of each viewer aircraft depending on whether the target aircraft was above or below the horizon line.

The background depends on both the flight path profile and the topography. To simplify the process of determining the background characteristics, the ATSB utilised the animation produced for the investigation (see the section titled Animation development). The simulation software used to produce this animation contains a reasonable approximation of the area’s topography allowing determination of whether the aircraft could be seen against the sky or the topography.

This review indicated that of the last 260 seconds of the flight, if meteorological conditions allowed, the pilots of AEM, would not have seen JQF against the background of the sky until the last 5 seconds where it would have transitioned over the horizon line. For the pilots of JQF, AEM, if visible through cloud, would have been silhouetted against the sky until the last second where it would have been crossing the horizon line.

While the difference between the sky and topography has an impact on the contrast, it was not possible to quantify due to the presence of the cloud reducing the difference between the background luminance levels of the sky and the topography. Due to this, and as discussed in the Background luminosity section, the ATSB was not able to determine a reliable value for the background luminosity on the day of the incident.

Aircraft luminosity

Calculation of the luminance value for an aircraft depends on the.

  • location and brightness of the light source that is illuminating the target aircraft
  • surface area of the target aircraft that is visible to the viewer
  • reflectance value of the target aircraft
  • proximity of the target aircraft and the viewer aircraft.

Light source

As detailed above. the source of illumination for the aircraft was the sun. However, due to the presence of the cloud the aircraft would have been viewed under diffuse light through the cloud. Estimations for luminance values from the sun on overcast days vary depending on the source of the data. Due to the amount of cloud and the time of year and day it was estimated that the light intensity from the sun through cloud would sit at the upper end of these values, being approximately 3000 lux.

Surface area

Surface area of the target aircraft that is visible at any time is a function of the aircraft’s relative heading. pitch and bank angles. Visible surface area varies from its minimum when the target aircraft is level on a reciprocal track to its maximum when it is banked on a near‑perpendicular track. Additionally, on a reciprocal track, the greater the pitch angle, whether positive or negative, the more of the surface area will be visible.

Reflectance value

Reflectance value is a measure of how much light a surface will reflect and how much it will absorb. The reflectance values for AEM and JQF were estimated based on the aircraft layouts and colour schemes at the time of the accident. The predominantly white paint schemes at the time of the incident would have likely increased their reflectance value.

Unlike AEM, JQF had a 2-tone paint scheme with the lower half of the aircraft fuselage and the outer portions of the wings painted a darker blue. This paint scheme, with this colour choice, meant a reduction in the aircraft’s overall reflectance value when compared to AEM.

Aircraft proximity

As detailed previously (Figure 43), the distance between the 2 aircraft was calculated.

Evaluation

The ATSB reviewed all the information available for calculating the contrast for the 2 aircraft. While it was determined that such a calculation could be made, the uncertainty resulting from limited information available for estimation of background luminosity, light source, and the reflectance values rendered any calculation of contrast values unusable. Further review undertaken in the Aircraft observed size, Closure rate, Target shielding sections and development as part of the Animation development section indicated that there were a range of other parameters that were likely to have had as great, if not greater, impact on the aircraft’s visibility from one another.

Aircraft lighting

As discussed in the Lighting section of Human performance information, aircraft lighting assists a pilot in locating a target aircraft that may be beyond their visual range. The ATSB reviewed the available information about the lighting that was fitted to both aircraft to look at whether it could have improved the opportunity for detection.

AEM

The review of information about AEM was not able to locate specific information about the lighting that was fitted to the aircraft. It was assumed that the aircraft was fitted with a lighting package that complied with the requirements of its certification and the relevant civil aviation regulations as discussed in the Aircraft information section. Due to the availability of newer more powerful lighting packages, this was considered a worst-case scenario.

For this review, position lights were considered at 40 candela maximum for the wingtips and 20 candela for the rear. Reviewing this information against the chart presented in Figure 14, these lights, if they had been switched on, would have provided little opportunity for detection at a distance that was useful for collision avoidance. No further information was available as to the presence or power of other lighting such as landing or taxi lights.

JQF

For JQF, the addition of strobe lights would have provided additional contrast if they had been activated. However, the best opportunity for attracting the attention of AEM’s pilots was likely to have been the aircraft’s landing light, which had a luminosity of 60,000 candela. Based on information from the operator, the procedures outlined in ERSA and the wreckage examination, it is highly likely that the light was on in the lead up to the collision. Reviewing against Figure 14, at 3 nautical miles and against the background luminance of 300 cd/m2, a light with this intensity would have been visible in both the foveal and out to almost all the inner visual field. The aircraft were approximately 3 NM apart at 11:23:35, 45 seconds prior to the estimated collision time. At this time the target aircraft’s angular size would have been only 0.062° of the pilots’ view, meaning that on size alone it was unlikely to be detected.

These calculations assume an unobstructed line of sight between the viewer and the light. In the case of JQF’s landing light there were 2 additional considerations: the positioning of the light and the environmental conditions.

The landing light was located on the nose of the aircraft, set back into the nose cowl by approximately 30 mm to avoid direct line of sight to the pilots. This meant that the arc through which it was visible in front of the aircraft was reduced. The operator reviewed the lights fitted to a similar aircraft and determined that the beam arc was 20° either side of straight ahead the aircraft and 4° above to 8° below the horizontal axis. The full light was visible to 40° either side of straight ahead, however it had a significantly reduced luminance to the point where it was not possible to determine if it was switched on. Part of the light was visible to approximately 70° either side of straight ahead. The most powerful illumination and the best chance of visual acquisition was within the central beam. Therefore, only the central beam and its visibility were considered for further study.

The assessment of visibility of the light was based on the azimuth and elevation angles from JQF to AEM. Azimuth angles between -20 and 20° and elevation angles between -8 and 4° from JQF were the time that the light would have been directed at the target aircraft (AEM). The azimuth and elevation angles from AEM to JQF’s nose, calculated in the Aircraft observed size section, were then used to determine where JQF’s landing light would have appeared to the pilots of AEM when directed at AEM, and what areas of the pilot’s visual field the light would have appeared in.

The analysis identified 4 windows of time where AEM would have been within the arc of JQF’s landing light. These totalled 74 seconds and varied in length from 5.5 seconds to 50 seconds and when the aircraft were separated by distances of between 12.5 and 1.7 NM. Of these 74 seconds, for the first 32.5 of them JQF’s nose would have been within the foveal region of AEM’s pilots. Assuming the pilots continued looking straight ahead, the aircraft remained within 3° of left side of the pilot’s foveal region for the remaining 41.5 seconds.

The 2 best opportunities for visual acquisition of the light were 10 seconds between 11:23:04 and 11:23:14, between 76 and 66 seconds before the collision and 5.5 seconds between 11:23:47.5 and 11:23:52.5 between 32 and 27 seconds before the collision. During the first opportunity aircraft proximity was between 5.01 and 4.37 NM, when the aircrafts angular size was between 0.069‑0.076° in the pilot’s field of view. The second opportunity the proximity was between 2.09 and 1.75 NM, when the aircraft’s angular size was between 0.160‑0.188° (Figure 58). These results were also compared against the cockpit structure of AEM (see the section titled Target shielding).

It was determined that for the optimised pilot eye position the target aircraft (JQF) was not shielded from either pilot in AEM by the cockpit structure during any of the times when the landing light would have been visible.

Figure 58: Visibility windows for JQF landing light from AEM
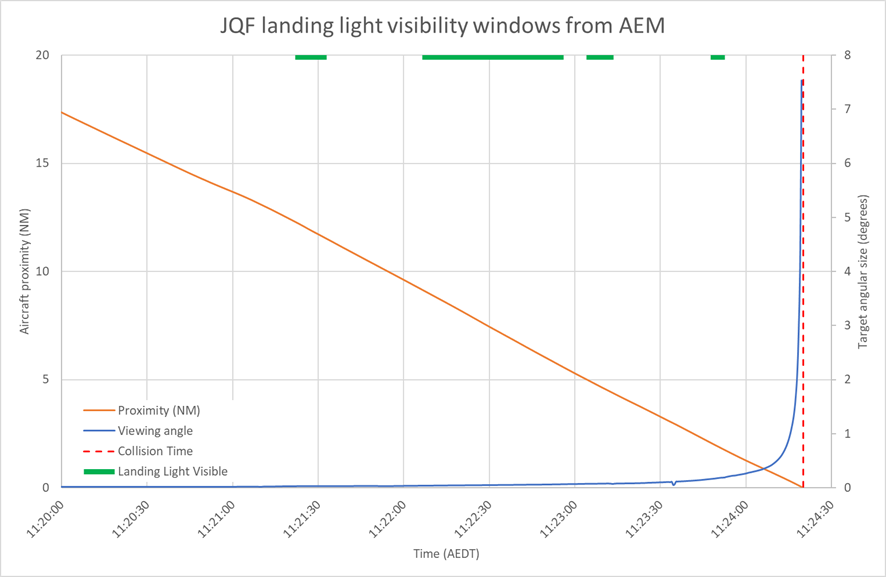
as-2022-001-pic-58.png

Source: ATSB

Considering the intensity of the landing light, it is highly likely that, if environmental conditions allowed, the pilots of AEM would have been able to perceive and locate JQF based on its use of the landing light, at least 27 seconds prior to the collision and possibly between 76 and 66 seconds. At these times the ability to detect based on aircraft size alone was unlikely, and other than movement, there was no other specific characteristic that would have diverted attention of either pilot towards JQF.

With the presence of cloud, the effectiveness of the landing light to aid visual acquisition was reduced. The significance of the reduction was dependant on the extent of the cloud, with even a powerful landing light unable to penetrate significant distance through thick cloud. As it was not possible to ascertain the specific extent of the cloud in the vicinity of the accident, the actual detection opportunity offered by the light could not be determined.

Aircraft position assessment

As discussed in the Locating the target aircraft section, the position of each aircraft relative to the other can be used, along with consideration of the viewer aircraft’s structure to determine when the aircraft was visible from a particular pilot’s viewpoint. The azimuth and elevation angles between the 2 aircraft were calculated considering each was the ’viewer’ and the ’target’. These values, based on the smoothed data (see the section titled Position information) are plotted in Figure 59 and Figure 60.

Due to the location of the GPS antennas on the aircraft being close to the pilot’s eye position (within 500 mm) the position of the aircraft and the pilot’s eye position (optimised eye position – see the section titled Refining the pilots’ eye positions) for the purposes of locating the target aircraft have been considered the same. Figure 61 and Figure 62 show the view and target aircraft locations from the optimised pilots’ eye position in AEM and Figure 63 and Figure 64 show the view and target aircraft locations from JQF pilots’ optimised eye positions.

The target aircraft positions have been coloured to indicate that aircraft’s movement over time with the colour transiting from blue through green to red showing times getting closer to the collision. As discussed in the Sun consideration section, the azimuth and elevation angles to the sun were also plotted, indicating the sun’s movement in the field of view over time. As discussed previously, it shows the sun well above and away from the pilot’s viewpoint and entirely obscured by structure.

Figure 59: Azimuth and elevation angles from JQF to AEM
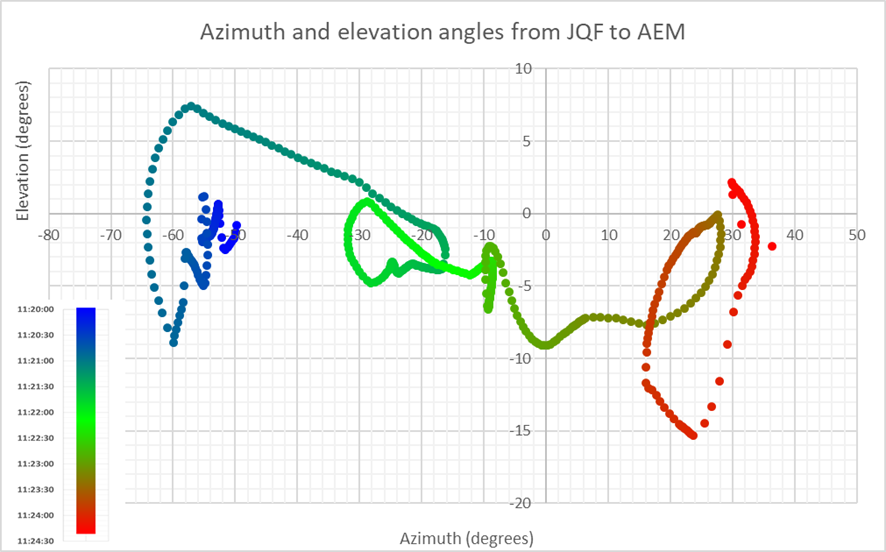
as-2022-001-pic-59.png

Source: ATSB

Figure 60: Azimuth and elevation angles from AEM to JQF
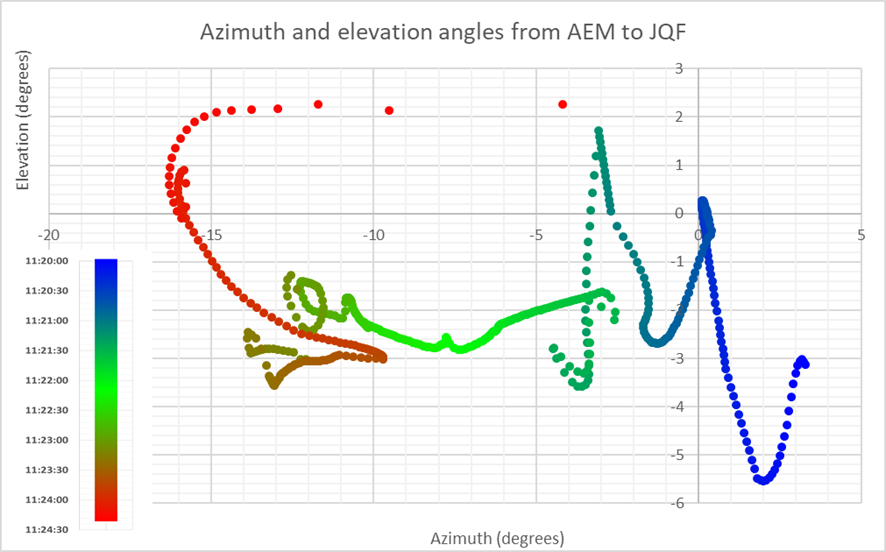
as-2022-001-pic-60.png

Source: ATSB

Figure 61: AEM left seat pilot’s view (optimised eye position) with target aircraft and sun positions.
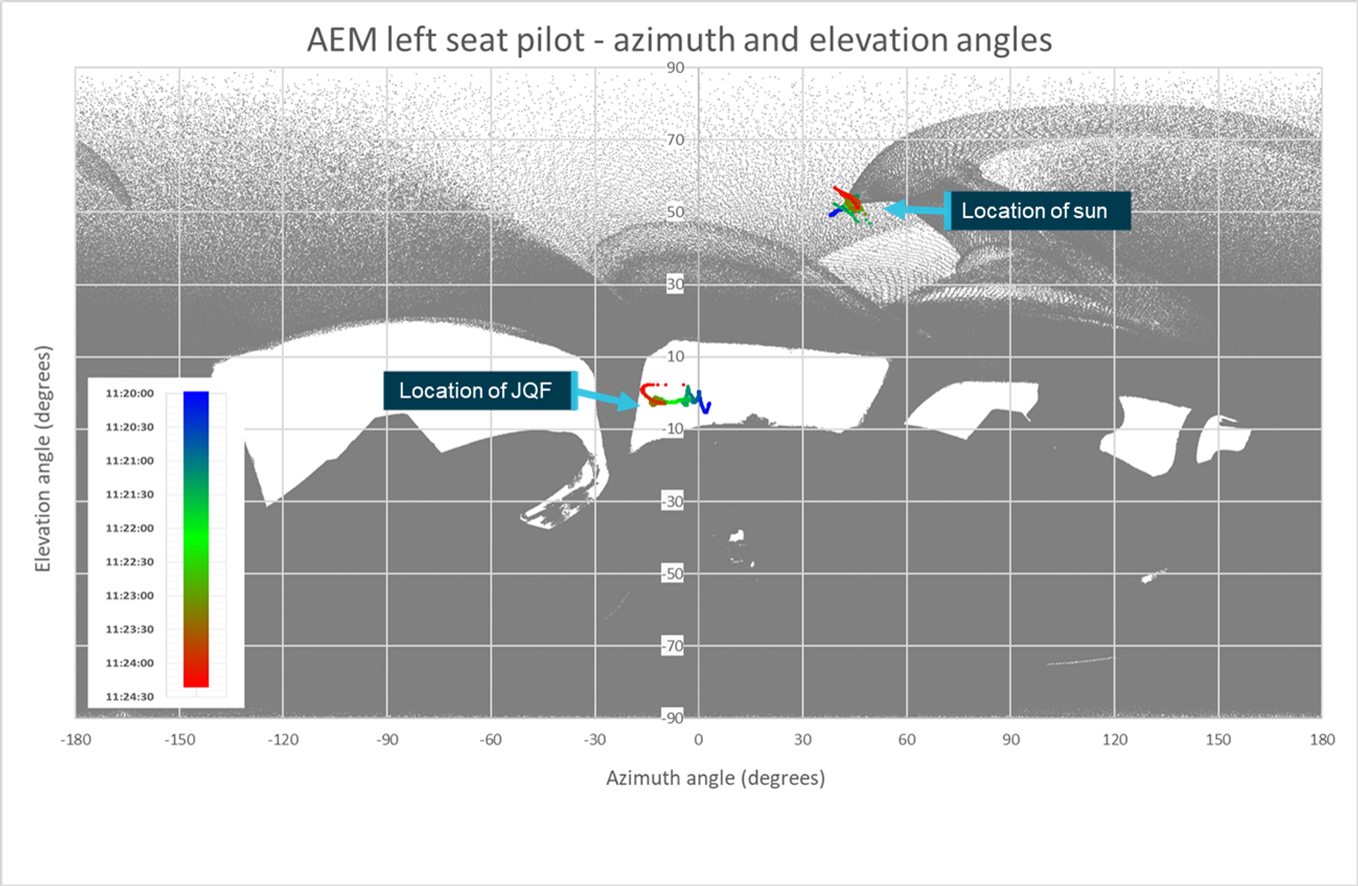
figure_61png.png

Source: ATSB

Figure 62: AEM right seat pilot’s view (optimised eye position) with target aircraft and sun positions.
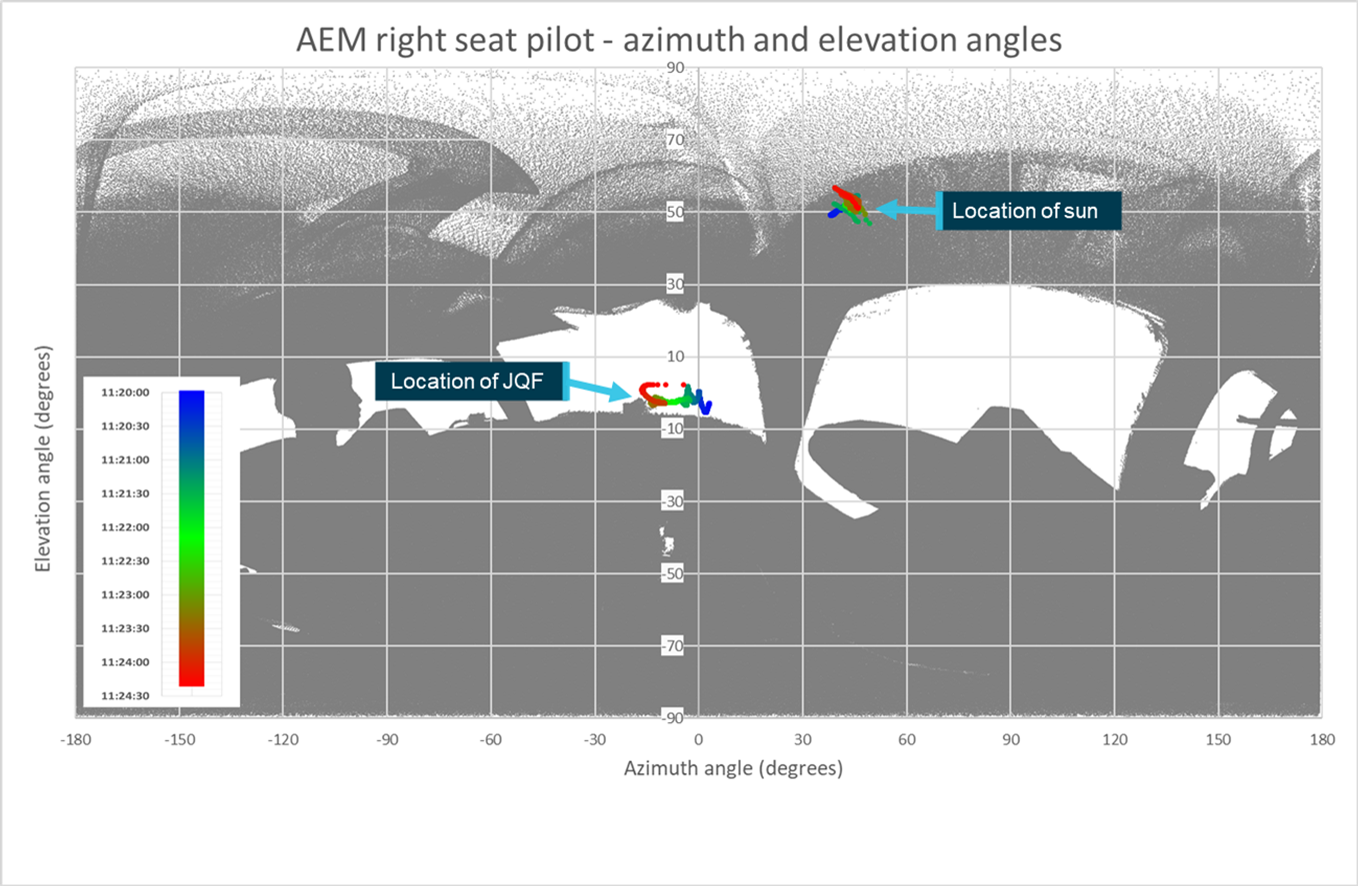
figure_62png.png

Source: ATSB

Figure 63: JQF left seat pilot’s view (optimised eye position) with target aircraft and sun positions
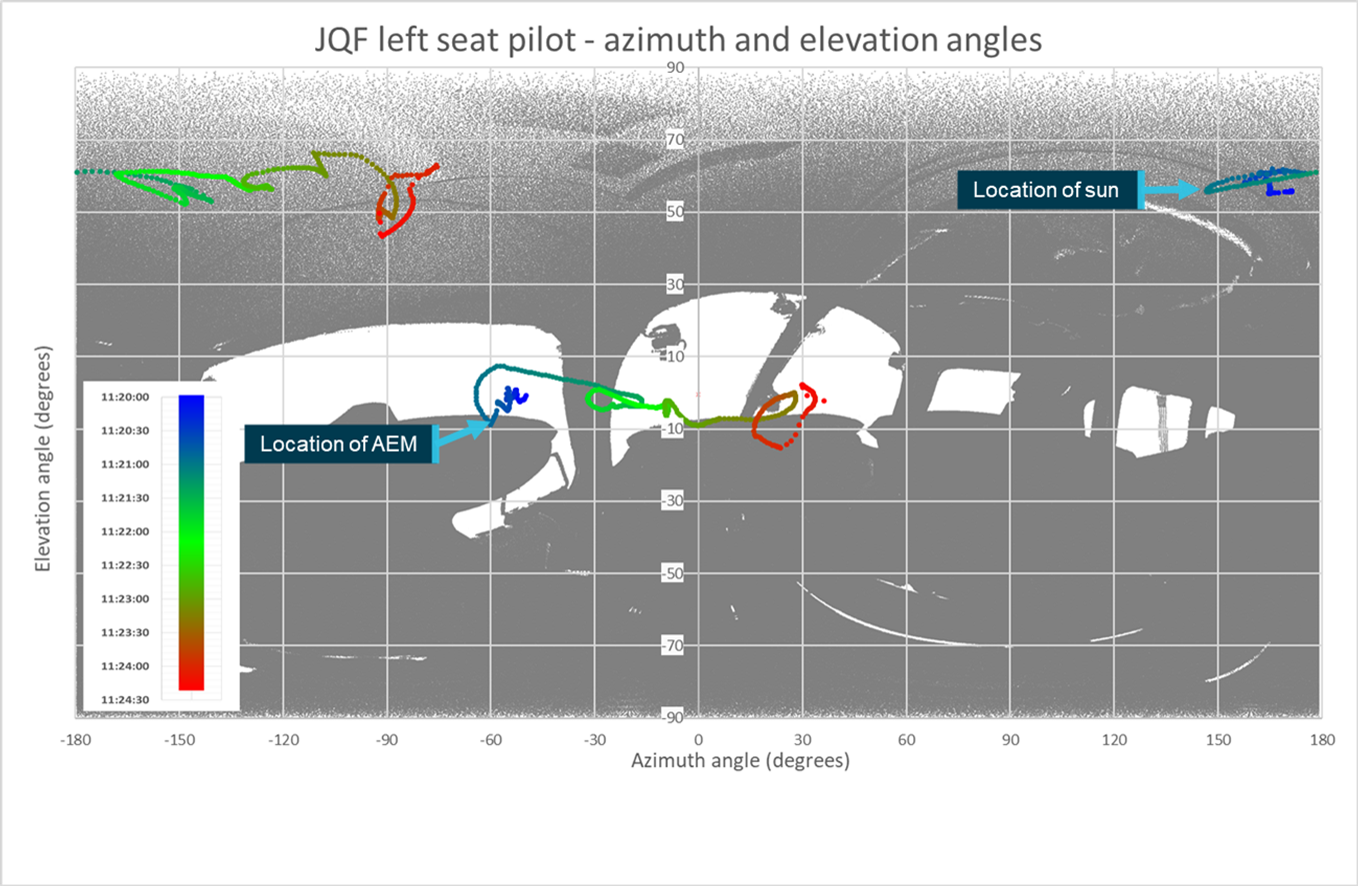
figure_63png.png

Source: ATSB

Figure 64: JQF right seat pilot’s view (optimised eye position) with target aircraft and sun positions
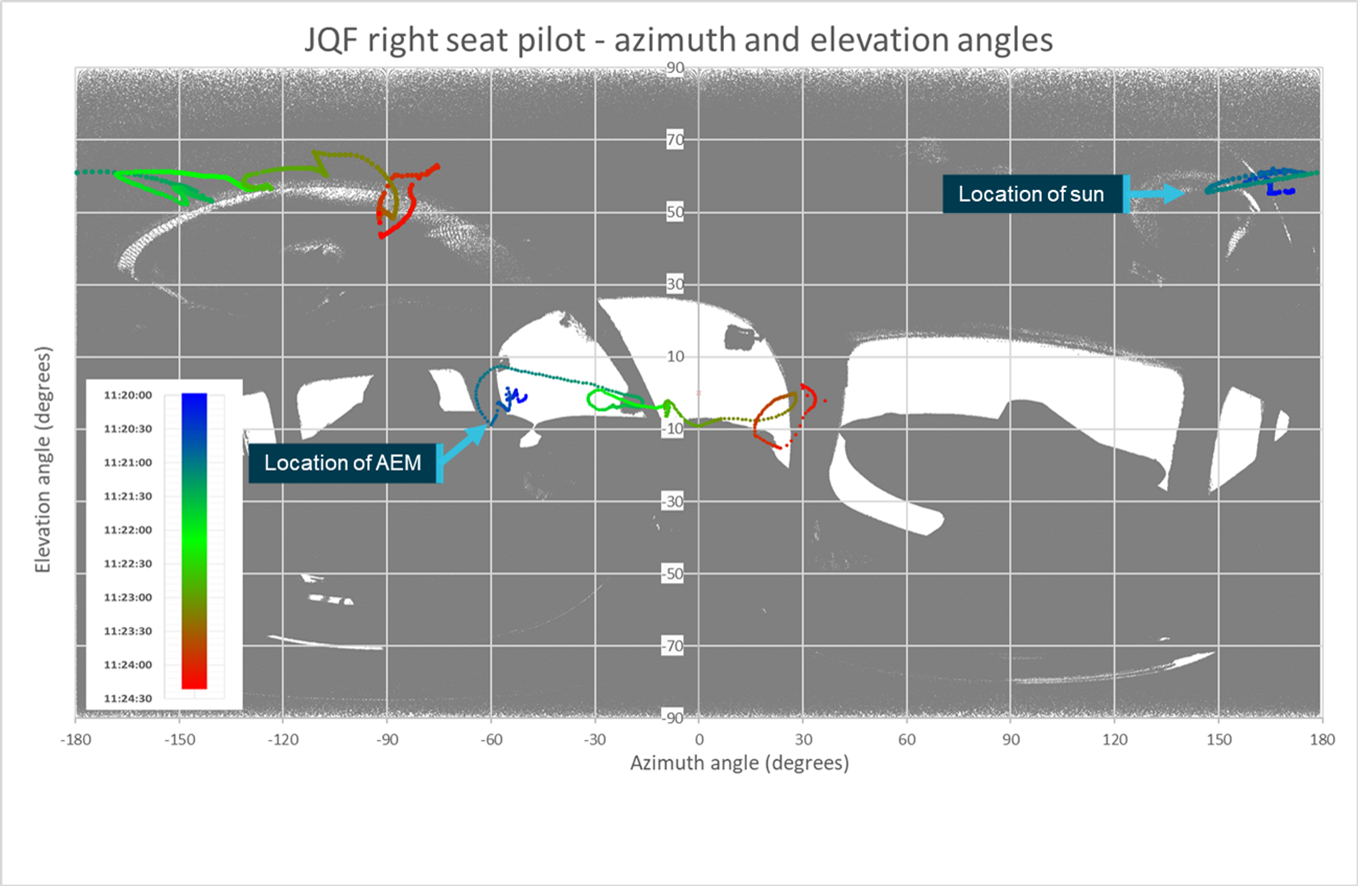
figure_64png.png

Source: ATSB

Target shielding

The ATSB’s optimised eye position (see the section titled Refining the pilots eye position) and views as presented in the Aircraft position assessment section, were used for further assessment of the times that the target aircraft would have been shielded from the view of the pilots by the aircraft’s structure. The ATSB reviewed azimuth and elevation angles of the aircraft structure and of the target aircraft, determining when the target aircraft would have been shielded from each pilot.

A series of 8 charts were developed, 2 for each pilot. The first showed the windows during which the target aircraft would, or would not, have been shielded from the approximate time that JQF became airborne until the approximate time of the collision, 260 seconds later (11:20:00‑11:24:20). The second shows the final 15 seconds before the collision, which as discussed in the earlier Aircraft observed size section, is the time when the target aircraft likely became visible to the pilot (assuming no cloud obscuration).

Pilots of AEM

Based on the ATSB’s optimised eye position, the target aircraft sat centrally, but relatively low in the windshield view. The cockpit structure did not shield the target aircraft from either of the pilots. As a result, charts showing target shielding times were excluded from this section of the report.

It is important to note that, while the target aircraft was not shielded from either pilot’s optimised eye positions, it would only have taken a relatively small movement of the head to shield the target for a considerable portion and at key times. The Sensitivity analysis section considers this further.

Pilots of JQF

The manoeuvring flightpath of JQF meant that the target aircraft, while approaching on a relatively stable heading, moved significantly through both pilots’ fields of view (traversing more than 180° of azimuth). For the right seat pilot, the target aircraft was shielded from their view for 95 of the last 260 seconds across 7 different shielding windows by different parts of the cockpit structure.

After 11:23:54 (26 seconds before the collision), when the target aircraft traversed 0.2° of the pilot’s field of view, the target aircraft was shielded for 21 seconds (81% of this time). The aircraft would have emerged from behind the instrument panel briefly approximately 19.5 seconds before the collision for about 4 seconds, but this was only to traverse between the instrument panel and the right pillar.

For the final 15 seconds the aircraft was completely shielded from the right seat pilot by the cockpit’s right pillar. The right pillar traversed approximately 20° of the pilot’s field of vision and immediately before impact the aircraft occupied no more than 9° of azimuth, shielding it completely/near completely from the pilot’s view.

Figure 65 and Figure 66 show the angular size of the aircraft and the time windows when it would have been visible to the right seat pilot for the final 260 seconds and in the final 15 seconds.

Figure 65: JQF right seat pilot’s visibility
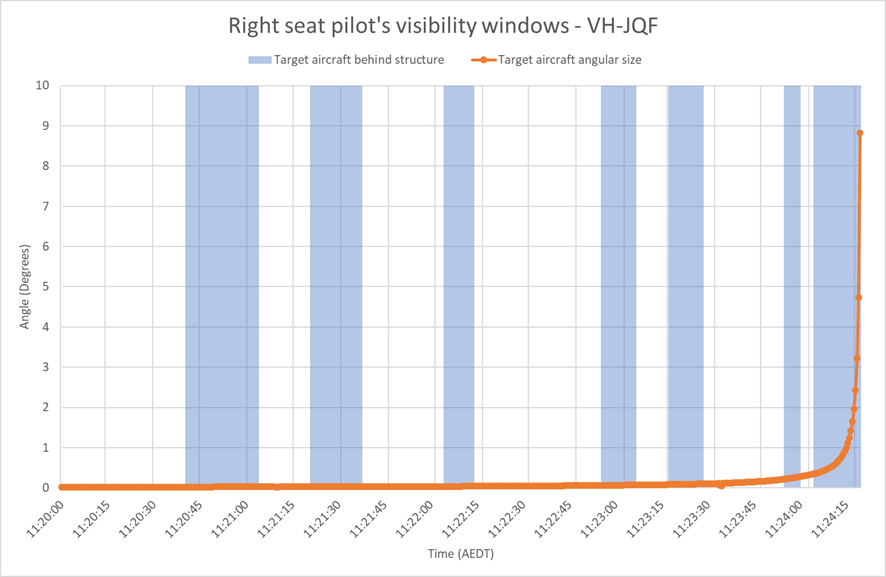
as-2022-001-pic-65.png

Source: ATSB

Figure 66: JQF right seat pilot’s visibility last 15 seconds
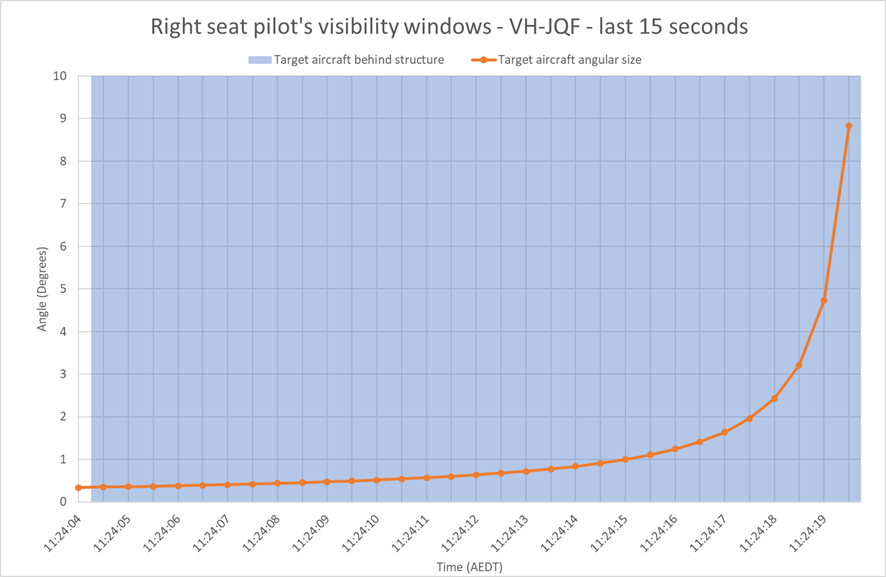
as-2022-001-pic-66.png

Source: ATSB

AEM was shielded from JQF’s left seat pilot’s view by JQF’s structure for approximately 80 of the final 260 seconds split across 6 windows. These windows varied in length from 4.5 seconds to 20 seconds.

Approximately 52.5 seconds or 66% of the time that the target aircraft was shielded was before 11:23:30 when the aircraft would have traversed only 0.1° of the pilot’s visual field. However, different to the right seat pilot, the target aircraft would have become visible approximately 14.5 seconds prior to the estimated collision time. The target aircraft would likely have emerged from behind the instrument panel near the windscreen mounted compass and with an angular size of slightly less than 0.4°.

Figure 67 and Figure 68 show the angular size of the aircraft and the time windows when it would have been visible to the left seat pilot for the final 260 seconds and in the final 16 seconds.

Evaluation

Based on the ATSB optimised eye position there was very limited opportunity for the pilots of JQF to visually detect AEM with sufficient time for the aircraft to be manoeuvred to avoid the collision.

For the right seat pilot, the aircraft was likely entirely obscured during critical phase where it may have been possible to visually acquire the target aircraft and initiate an avoiding manoeuvre. While the left seat pilot probably had a window whereby the aircraft could have been visually acquired and an avoiding manoeuvre initiated, based on the aircraft’s size and the time available, the pilot would have been required to:

  • identify an object on the opposite side of the windscreen centre spline of angular size less than 0.5°
  • determine it was a threat and initiate a manoeuvre within 15 seconds.

Research suggests that this was possible, however it required that each of these steps was carried out efficiently and there is no delay in the detection of the target or determination of the threat status of the aircraft.

Figure 67: JQF left seat pilot's visibility windows
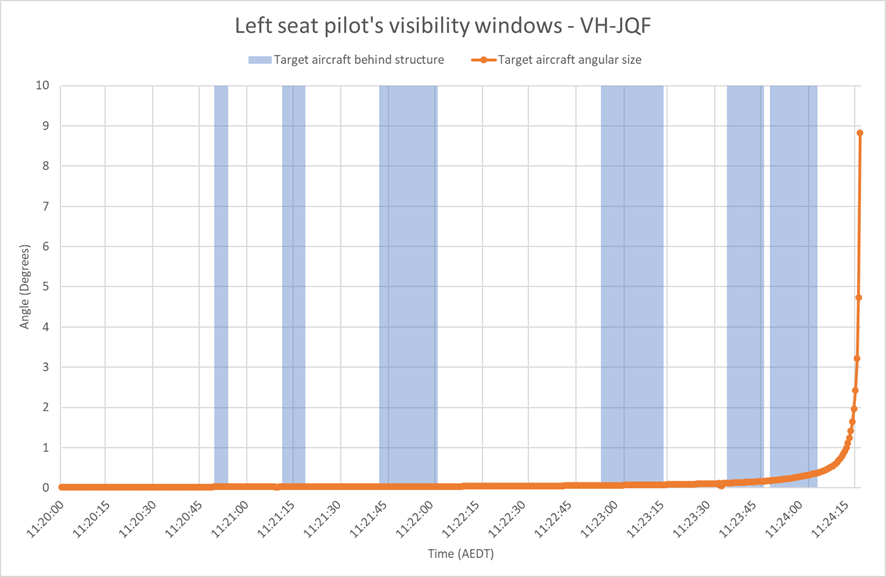
as-2022-001-pic-67.png

Source: ATSB

Figure 68: JQF left seat pilot visibility windows - last 15 seconds
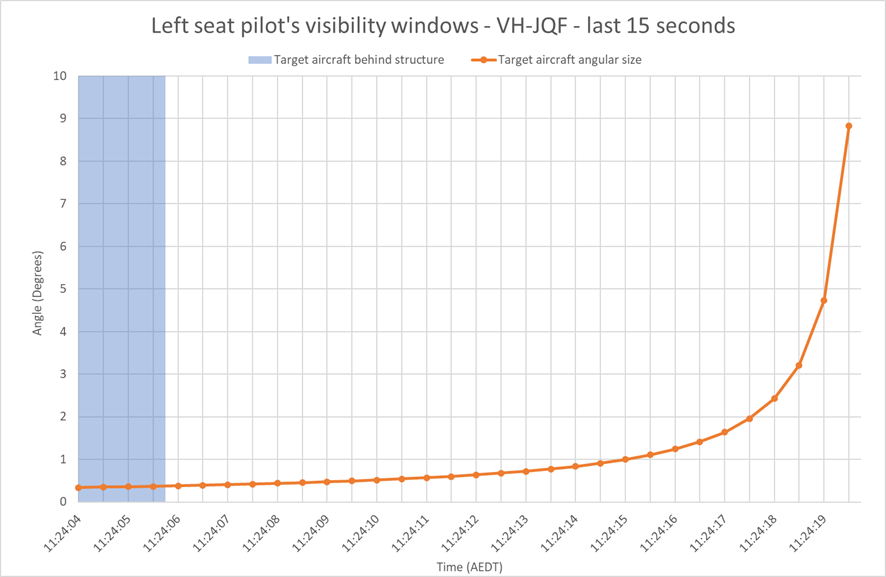
as-2022-001-pic-68.png

Source: ATSB

Relative movement

Relative movement increases the opportunity for visual acquisition of a target. With the position of the target aircraft tracked across the viewer pilots’ field of view at constant, half second, intervals the speed of angular motion can be determined. For the purposes of the study the angular speed of movement was considered as a combination of the change in azimuth angle and elevation angle every 0.5 seconds (Figure 69), which was converted to a value in degrees per second.

Figure 69: Calculation of speed of angular motion
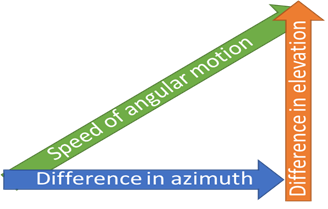
as-2022-001-pic-69.png

Source: ATSB

As discussed in the Object perception section, relative movement of 0.017-0.034°/ second (1-2 arcminutes/second) can be detected under optimal conditions where the movement is proximal to a stationary reference. A ’stationary reference’ was considered to exist when the target was within 5° of azimuth or elevation of the cockpit structure.

Where such a reference was not available, 0.17-0.34°/seconds (10-20 arcminutes/ second) was required to be detected. For an aircraft, the location of the aircraft structure in the pilot’s visual field will remain constant and so will act as the stationary reference point. As the Aircraft position assessment and target shielding sections discussed, the aircraft’s position in the visual field at defined intervals was known so its angular speed through the visual field could be calculated.

AEM

JQF’s movement across the visual fields of the pilots of AEM was significantly less than AEM’s movement across JQF.

This corresponded to lower angular speeds, with a range of between 0.012 and 10.64° per second, and an average angular speed of less than one third of that of JQF at 0.290° per second. For 12.5 seconds, of the 260 seconds leading up to the collision, the aircraft had an angular movement of less than 0.034° per second (2 arcminutes per second) and was unlikely to have been detectable.

For 65 seconds the target aircraft would have had an angular velocity of greater than 0.34° per second and therefore likely detectable with no stationary reference point. For the remaining time the target aircraft was more likely to be detected if it was proximal to a stationary reference point. Figure 70 and Figure 71 show the angular speed of the target aircraft and the times it was proximal (within 5° of azimuth or elevation) to stationary aircraft structure for the left and right seat pilots.

For AEM’s right seat pilot, as discussed in the Target shielding section, the target aircraft was close to but not obscured by the cockpit structure. For 219.5 of the final 260 seconds, the aircraft was proximal to the cockpit structure. Of the remaining 40.5 seconds, 37 were before 11:21:17.0 which was 182 seconds before the collision when the distance between the aircraft was approximately 12.5 NM and the target aircraft traversed only 0.02° in the pilot’s visual field.

The target aircraft then did not exit the proximal region again until 4 seconds before the collision, however by that time it would have been larger than 1° in the pilots’ visual field and there would have been insufficient time to react to prevent the collision.

For AEM’s left seat pilot the target aircraft was initially close to the centre of the windscreen and moved throughout the final 260 seconds towards the left cockpit pillar. This location limited the opportunity for enhanced visual acquisition due to proximity to cockpit structure with the target aircraft proximal to the cockpit structure for only 47.5 of the final 260 seconds. However, of these 47.5 seconds, 35 occurred over the last 75 seconds before the collision, including all but the last 1.5 seconds of the final 24.5 seconds leading into the collision. As discussed in Aircraft observed size the target aircraft at this point was getting larger and the combination of the movement in proximity to stationary structure increased the visual acquisition opportunity.

Figure 70: Target aircraft structure proximity and angular velocity - AEM right seat pilot
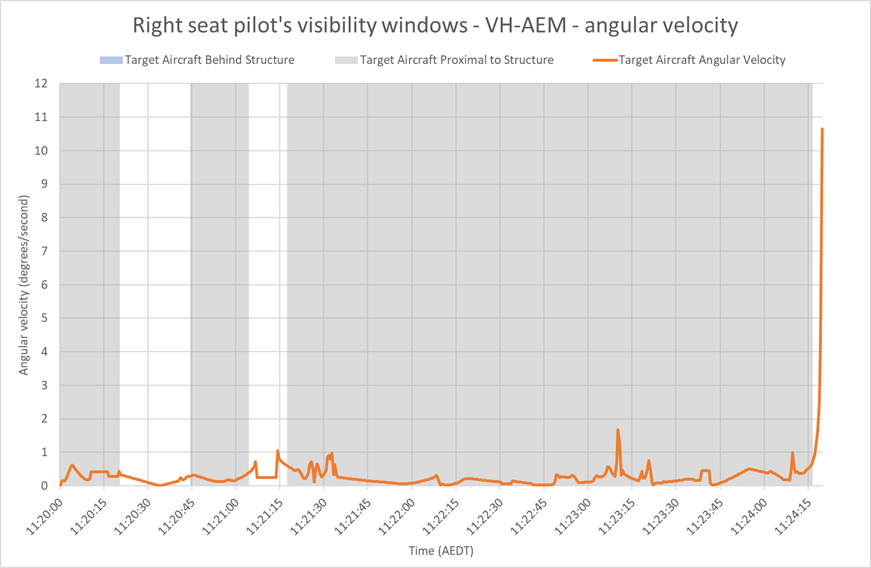
as-2022-001-pic-70.png

Source: ATSB

Figure 71: Target aircraft structure proximity and angular velocity - AEM left seat pilot
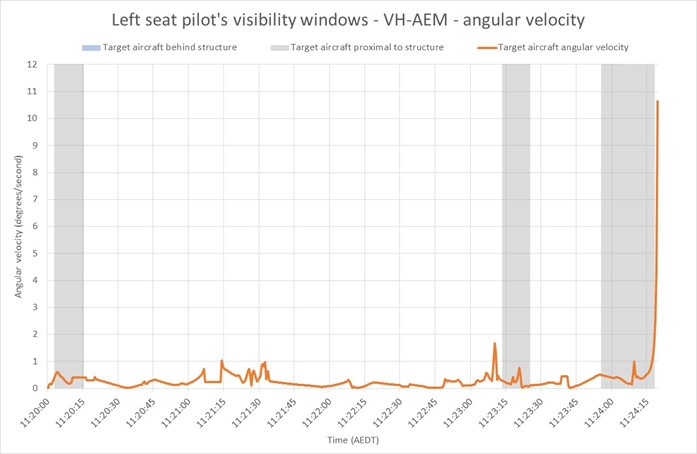
as-2022-001-pic-71.jpg

Source: ATSB

JQF

The angular velocity of AEM through JQF’s visual field varied from 0.03 to 10.33° per second with an average of 0.96° per second. Of the final 260 seconds AEM’s angular speed was sufficient to be detectable by the pilots of JQF without a stationary reference point for 184 seconds, or about 71% of the time.

For the remaining 76 seconds the aircraft’s movement through the field could be located if it was proximal to a stationary reference point. Due to the change in the pilot’s eye position from the left to right seat pilot as presented in the Target shielding section, the times when this occurred were different for the left and right seat pilots. Figure 72 and Figure 73 show the times for the individual pilots when the target aircraft was proximal to the aircraft structure and had a lower threshold for detection of relative movement. Both charts show that the closer to the time of collision the more time that the target aircraft spent proximal to, or obscured by, the structure.

For JQF’s right seat pilot the target aircraft was proximal of aircraft’s structure, but unshielded, for 139.5 of the final 260 seconds before the collision. The final time that the aircraft was not proximal to the structure and unshielded was between 34 and 30 seconds before the collision. At this time the aircraft was just over 2 NM away and the size of the target aircraft was approaching 0.2° in the pilot’s field of view, making the presence of the stationary reference of the cockpit structure less necessary for visual acquisition.

For JQF’s left seat pilot, the target aircraft was at the boundary of the aircraft’s structure but unshielded for 127 of the final 260 seconds before the collision. Approximately 15 seconds before the collision the target aircraft emerged from behind the aircraft instrument panel and moved towards the centre of the right windscreen. At this point the target aircraft would have had an angular velocity approximately 4° per second and an angle of 0.4° in the pilots’ visual field.

Evaluation

The movement of both AEM and JQF across the viewer pilot’s visual fields provided relative motion that increased visual acquisition potential. For the pilots of JQF, the target aircraft moved through a larger part of the visual field, and at a greater rate, increasing opportunity based on movement. With a significant portion of this movement proximal to stationary cockpit structure a reference was available for movement to be detected against.

As discussed in the Target shielding section this also meant that the target aircraft spent a significant portion of time obscured from view. This was particularly significant when the aircraft was at the limits of visual acquisition capability, 15-20 seconds prior to the collision. For AEM the target aircraft has less than one-third the average speed of motion in the lead up to the collision. For the right seat pilot, the movement of the target aircraft low on the windshield meant that the instrument panel and the centrally mounted compass provided stationary reference for the target’s movement.

For the left seat pilot, the target aircraft’s position higher in the windscreen meant that there was no stationary reference available for the initial time, however the movement towards the aircraft’s left cockpit pillar meant that at the critical time in the lead up to the collision the aircraft was not only unshielded but also in a position where its relative movement could have attracted the pilots attention.

The utilisation of the 5° proximal window is an important consideration. If the head or eyes were moved or rotated slightly, the stationary reference of the cockpit structure would change and may have obscured the target aircraft. This aspect will be discussed in the following Sensitivity analysis (Movement of the pilot’s eye position) and Field of view sensitivity (Rotation of the pilot’s eyes) sections.

Figure 72: Target aircraft structure proximity and angular velocity - JQF right seat pilot
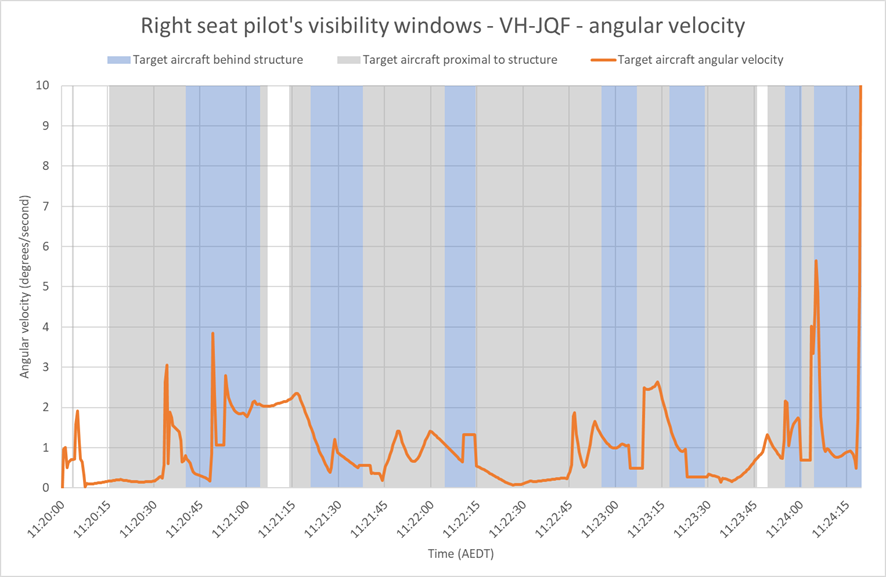
as-2022-001-pic-72.png

Source: ATSB

Figure 73: Target aircraft structure proximity and angular velocity - JQF left seat pilot
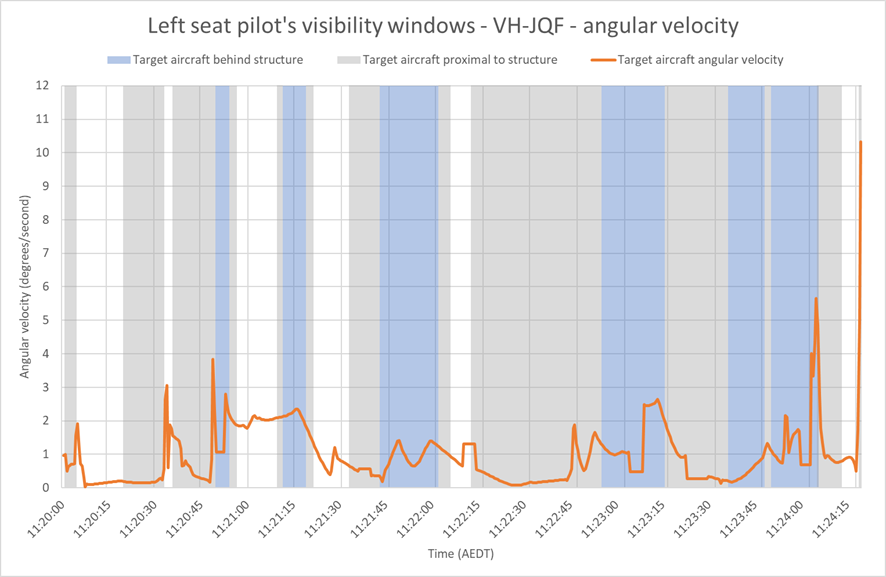
as-2022-001-pic-73.png

Source: ATSB

Sensitivity analysis

As introduced in the Refining the pilots’ eye position section, optimised eye positions for each pilot were selected from a matrix of possible positions. The matrix moved the head and associated eye position 0.01, 0.03, 0.05 and 0.10 m along each axis generating 729 different eye positions and views for each of the 4 pilots. The original eye position prior to optimisation has been referred to as the ‘displaced’ eye position.

The following section presents the results of a target shielding analysis done on the displaced eye positions the equivalent of that which was done in the Target shielding section. For the purposes of this assessment the optimised and displaced eye positions are not the eye positions that show the least shielding time or the greatest visibility opportunity for the target aircraft. The purpose of the comparison between the optimised and displaced positions is to demonstrate the difference that small positional changes can make to visibility opportunity.

Through the process of selecting the optimised eye position, investigators reviewed imagery that represented the eye positions at the extremities [20] of the matrix. They examined the difference these made to the detectability of the target aircraft and its likely shielding behind cockpit structure. For example, as would be expected, the lower that a pilot sits in the structure the more shielding is provided by the instrument panel and the less likely an aircraft approaching from below the elevational origin will be detected. This movement in the vertical plane also effects the shielding of other parts of the aircraft structure outside the cockpit such as the wings and engine cowling.

AEM pilots

For AEM’s right seat pilot, displacement was 1 cm back, 3 cm right and 1 cm up (Figure 74). As with the optimised eye position, the target aircraft was not shielded during the final 260 seconds leading up to the impact. However, the displacement placed the target aircraft’s track closer to the central compass and the instrument panel meaning further small movements, particularly vertically, could lead to significant shielding of the target.

For AEM’s left seat pilot, displacement was 1 cm back, 5 cm left, with no vertical position shift. (Figure 75) This equated to a 70 second increase in the time that the target aircraft was shielded from view (Figure 76). Critically, this increase fell entirely within the last 90 seconds prior to the collision. The last practical visual acquisition opportunity before the target aircraft moved behind the left pillar was 27.5 seconds before the collision, when the aircraft made up 0.18° in the pilot’s field of view. The aircraft re-emerged from behind the cockpit pillar 1.5 seconds before the collision (Figure 77), however this did not provide sufficient opportunity for a reaction, let alone an evasive manoeuvre.

Figure 74: AEM right seat pilot ATSB displaced eye position
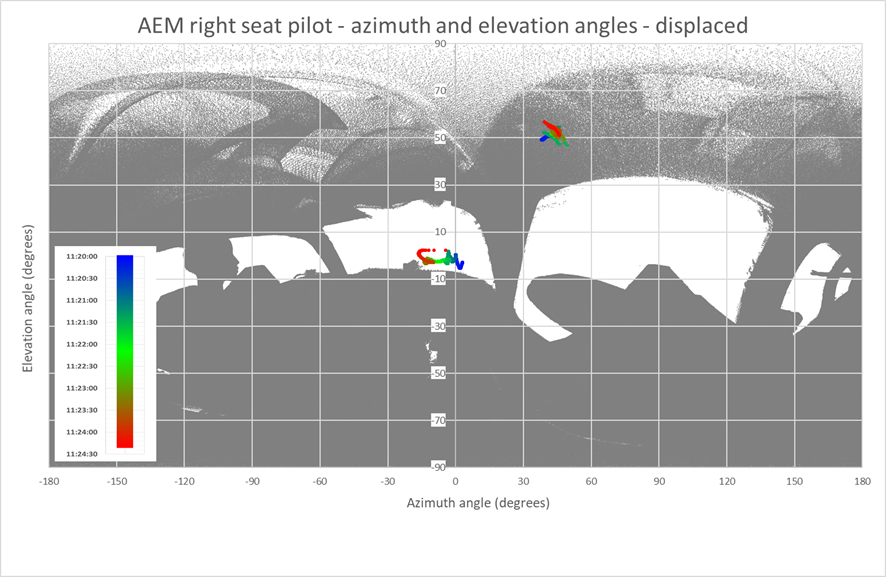
as-2022-001-pic-74.png

Source: ATSB
 

Figure 75: AEM left seat pilot ATSB displaced eye position
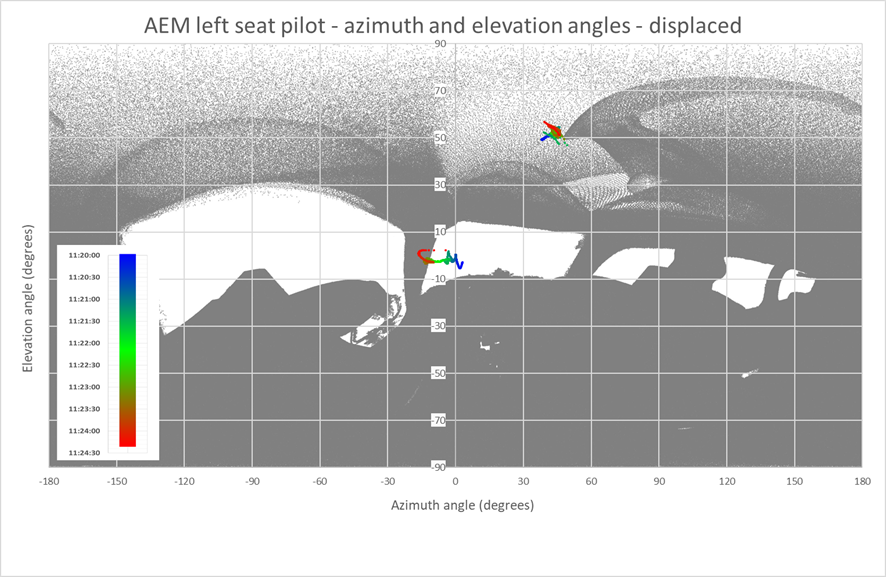
as-2022-001-pic-75.png

Source: ATSB

Figure 76: AEM left seat pilot’s visibility windows – displaced eye position
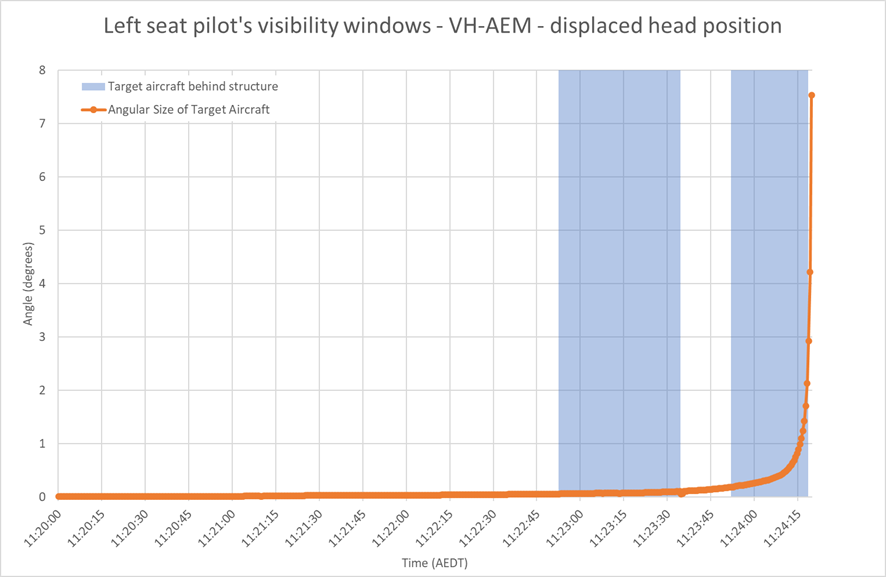
as-2022-001-pic-76.png

Source: ATSB

Figure 77: AEM left seat pilot’s visibility windows final 15 seconds – displaced eye position
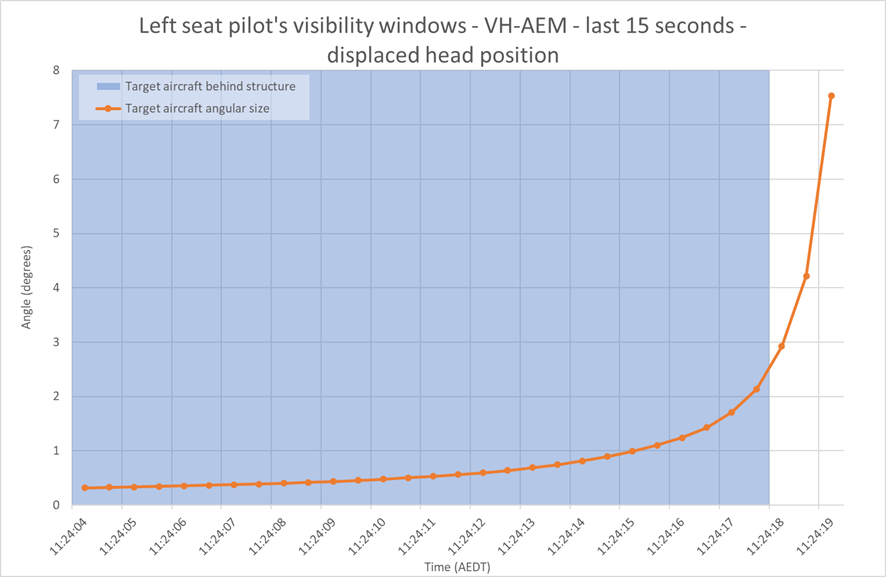
as-2022-001-pic-77.png

Source: ATSB

JQF pilots

The shift between optimised and displaced eye position for JQF’s right seat pilot was 1 cm forward, 5 cm left and 3 cm down (Figure 78). This change in positioning equated to an increase in target shielding time of 54.5 seconds with an additional 5 shielded windows over the final 260 seconds, for a total of 149.5 seconds across 12 shielding windows. Critically, the aircraft remained shielded from the right seat pilot for the final 15 seconds prior to the estimated impact.

The last opportunity for the pilot to locate the aircraft would have been approximately 19 seconds before the impact time and the aircraft would have appeared for approximately 3 seconds while transitioning between the instrument panel and the right cockpit pillar. At this time the aircraft would have an angular size of approximately 0.3° in the pilot’s field of view. Figure 79 and Figure 80 show the target viewing windows over the final 260 and 15 seconds respectively.

For the left seat pilot of JQF the shift between optimised and displaced eye position was 5 cm back, 3 cm left and 5 cm up (see Figure 81). This resulted in a decrease in target shielding by 4.5 seconds with one more shielding window, totalling 74.5 seconds over 7 shielding windows. The aircraft would have appeared in the pilot’s view approximately 15 seconds before the impact, at a size of approximately 0.36° in the pilot’s field of view. Prior to this, the aircraft would have been shielded by the instrument panel and the central pillar of the windscreen for approximately 23 seconds. Figure 82 and Figure 83 show the times the aircraft was shielded by the cockpit structure.

Figure 78: JQF right seat pilot ATSB displaced eye position
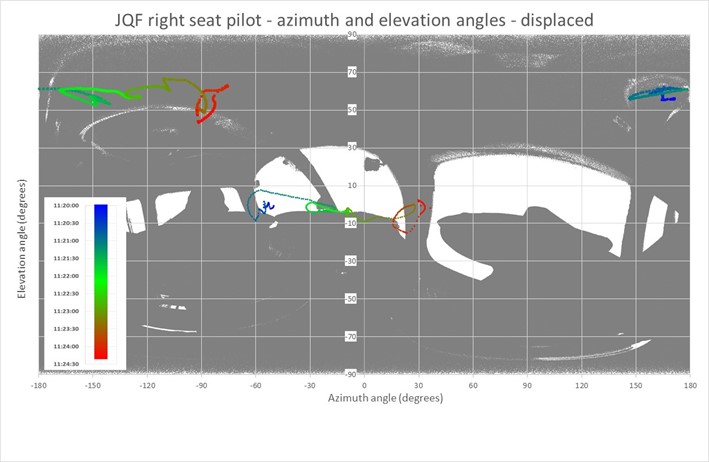
as-2022-001-pic-78.jpg

Source: ATSB

Figure 79: JQF right seat pilot’s visibility windows - displaced eye position
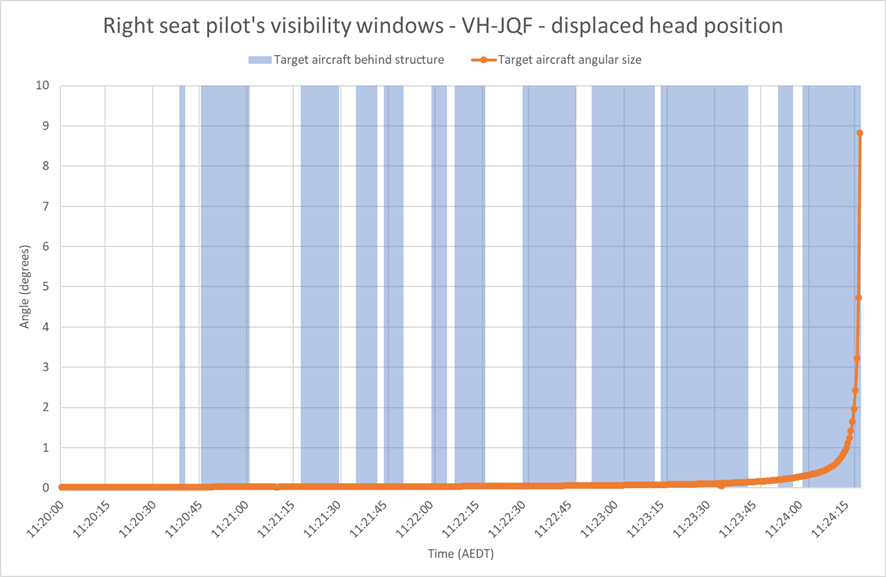
as-2022-001-pic-79.png

Source: ATSB

Figure 80: JQF right seat pilot’s visibility windows final 15 seconds - displaced eye position
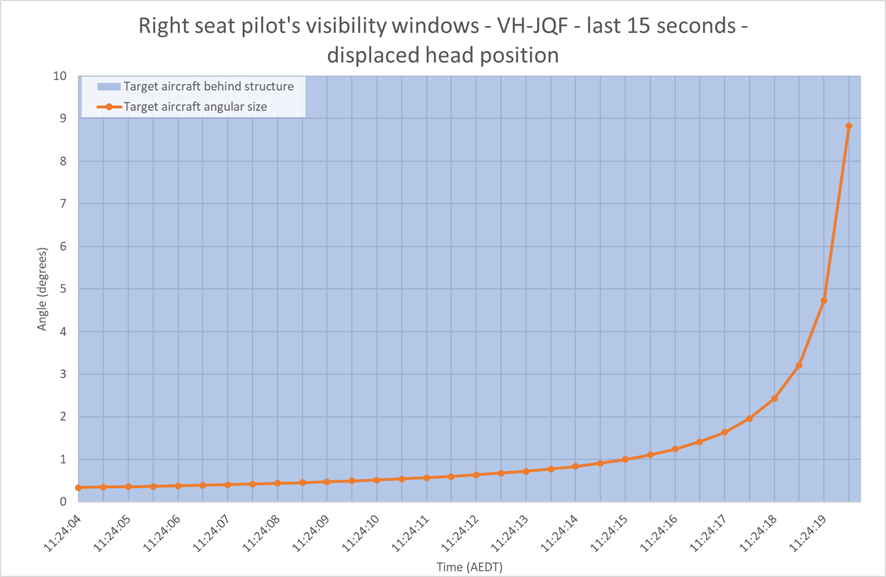
as-2022-001-pic-80.png

Source: ATSB

Figure 81: JQF left seat pilot ATSB displaced eye position
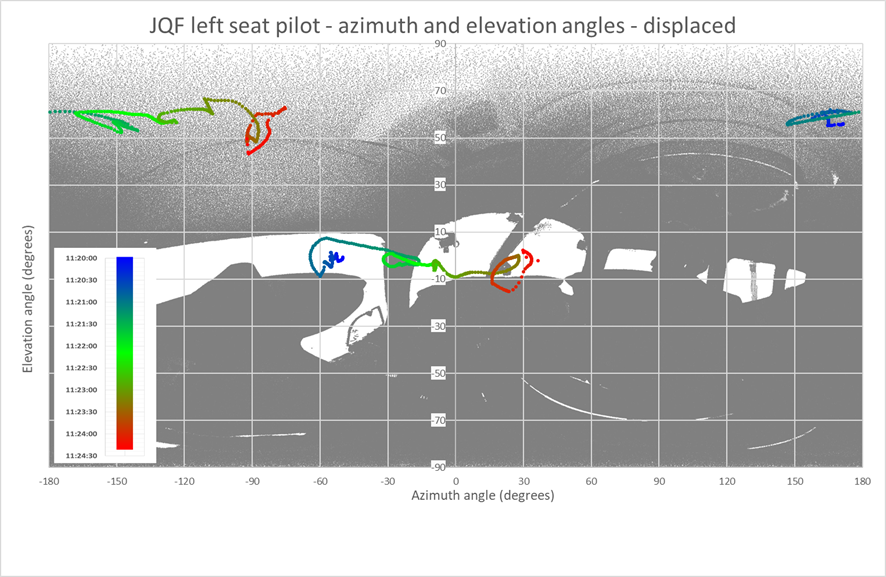
as-2022-001-pic-81.png

Source: ATSB

Figure 82: JQF left seat pilot’s visibility windows – displaced eye position
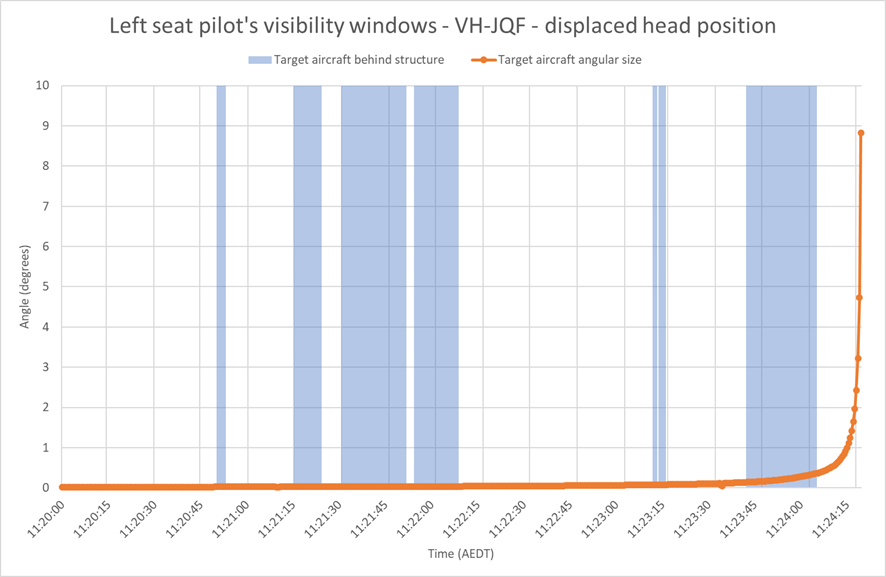
as-2022-001-pic-82.png

Source: ATSB

Figure 83: JQF left seat pilot’s visibility windows final 15 seconds – displaced eye position
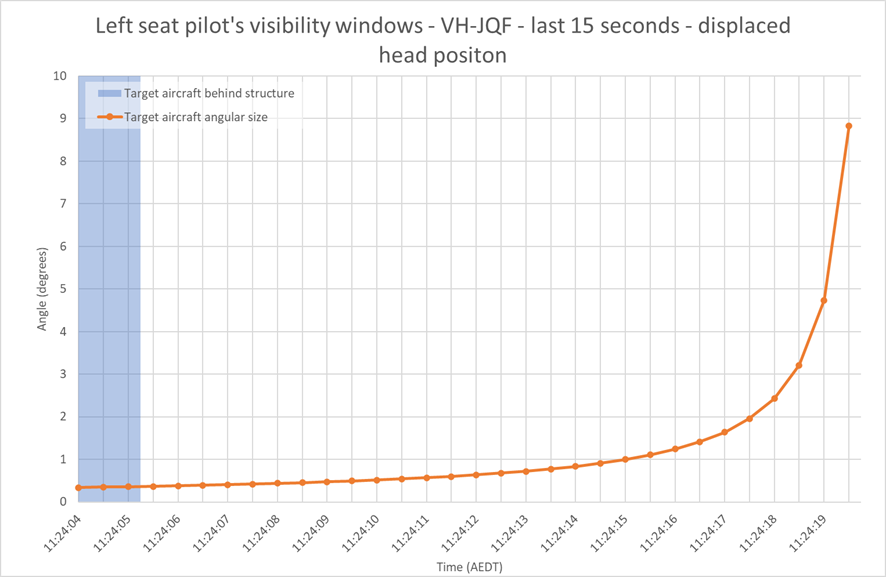
as-2022-001-pic-83.png

Source: ATSB

Evaluation

The sensitivity analysis identified that even small movements in the pilot’s eye position could have a very significant impact on the target shielding. The left seat position of AEM demonstrated the most significant change to the pilot’s eye position, with an increase in the shielding time of 68.5 seconds. This included almost all the last 20 seconds of flight where the pilot has the best chance of visual acquisition.

By contrast, analysis of the left seat position of JQF shows that similarly small movements in the eye position could reduce the shielding time, with the displaced eye position giving 4.5 additional seconds where the aircraft was visible to the pilot. While this time was not at a critical phase (the aircraft still emerged approximately 15 seconds before the collision), it demonstrated the difference that these small movements could make.

For the right seat pilots a similar contrast was present. For JQF, the movement increased the shielding time by almost a minute (54.5 seconds) throughout the final 260 seconds with much of this increase occurring later in the timeline where it limited visual acquisition opportunity. The right seat pilot of AEM remained entirely unshielded for all the final 260 seconds. Interestingly, this showed the difference that the speed slope windscreen made, one of the reasons that JQF’s shielding time was much higher was that the target aircraft was obstructed by the central pillar of the cockpit as it crossed the windscreen.

Further detail on other eye positions tested are outlined in attachment A to this report.

In summary, this analysis demonstrates the importance of moving the head when scanning and searching. Moving the head changes the location of the shielding obstructions, potentially overcoming the lack of relative movement associated with intercepting courses at constant speed.

Field of view

The aircraft positioning and target shielding considerations to this point have included the entire spherical field around the eye position. However, as discussed in the Field of View section, a person can only see and perceive a certain portion of this area at any point in time. It is therefore important to consider where the aircraft was within the field of view throughout the flight.

As previously discussed, the ATSB has defined 3 areas of the human vision where objects are likely to be located without specifically looking for them and where something on the target will be required to attract attention (such as a strobe light). The area for the full field of view were defined as 190° of azimuth by 135° of elevation. For the inner field a literature review was unable to provide a definitive value for the size of this area, however for this study the size of the inner field was estimated as 60° of both azimuth and elevation evenly distributed around the centre of the field of view. Making up the inner 10° of both azimuth and elevation, the foveal region or the area of highest, daylight, visual acuity was also represented. The following sections show these 3 areas as they relate to the position of the aircraft and the opportunity for visual detection.

The following section and the Field of view sensitivity section that follows present an examination of where the target aircraft likely appeared in the field of view of each pilot, assuming that they were looking out of the windscreen. Given the stage of each flight, with AEM preparing to conduct an instrument approach, and JQF conducting an instrument departure, it must be considered that each of the left seat pilots were likely spending more time conducting instrument scans than visual scans outside the window. While this limits how effective this assessment was for the accident case, it also demonstrates the importance of scanning through the whole visual field to best aid visual traffic acquisition.

AEM

Figure 84 and Figure 85 show the pilot views from AEM with the outer, inner and foveal regions of the field of view identified. The target aircraft fell within the inner field for the entire 260 seconds. Therefore, the pilot should have been able to perceive it when it was of a sufficient size to be located. The foveal region is the area of maximum visual acuity and where objects are most likely to be detected.

For both the left and right seat pilots of AEM, JQF spent most of its time on or within the boundaries of this area. For AEM’s pilots the target aircraft was within the foveal region for 154.5 of the final 260 seconds. This included the first 147.5 seconds, 6 seconds between 11:23:40 and 11:23:46, and the last second before the collision. Upon exiting the foveal region at this time, the target aircraft proceeded to a maximum of 16° to the left of the centre of field of view before coming back towards the centre of the field.

Figure 84: AEM left seat pilot - fields of view – optimised eye position
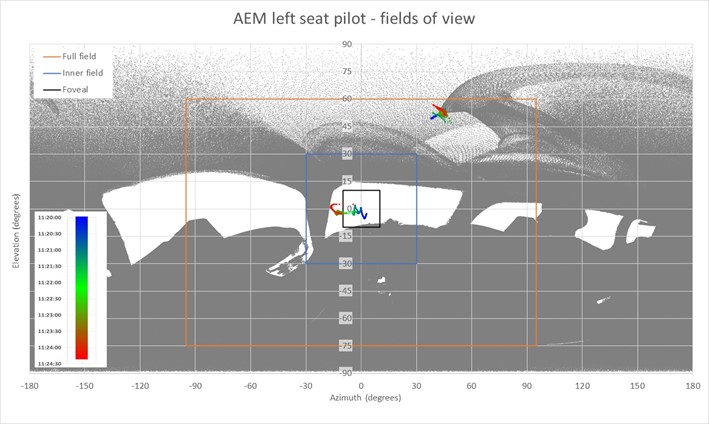
as-2022-001-pic-84.jpg

Source: ATSB

Figure 85: AEM right seat pilot - fields of view - optimised eye position
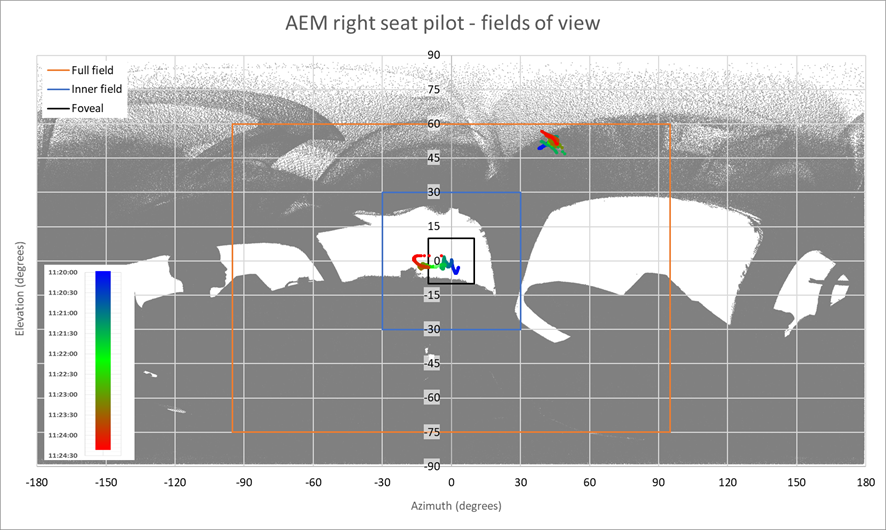
as-2022-001-pic-85.png

Source: ATSB

JQF

Through the final 260 seconds, AEM transitioned through 101° of azimuth from -64.1° to 36.4° and 22° of elevation from 7° to ‑15°. As the target’s elevation remained entirely within the inner field of view, the further analysis will only consider its positioning for azimuth.

The target started in the outer field of view, initially moving to the left and a minimum azimuth value of -64° before increasing elevation and transiting back towards the inner field of view. The aircraft entered the inner field of view on the left of the pilot’s view (-30° azimuth) at approximately 11:21:16, looping further into the region and back out again, exiting into the outer field of view at 11:21:50. After 7 seconds the target re-entered the inner visual field and passed through the foveal region from 11:22:19 to 11:23:09 and continued across the inner field of view, exiting at 11:24:05, and continued in the outer field of view until the collision.

As the inner visual field is the area that a pilot is likely to be able to detect an object without having attention specifically drawn to it, the timings and size of the target aircraft within this area are critical. At 11:21:16 when the target aircraft entered the visual inner visual field it made up only 0.02° of the pilot’s visual field - a size that is very unlikely to be detectable. 41 seconds later, when the aircraft re-entered the inner visual field it had almost doubled in size to 0.035° in the pilot’s visual field. The size continued to increase as the target crossed the inner and foveal fields.

By the time the target exited the inner field of view at 11:24:05, it was 0.35° in the pilot’s field of view and at a size that was likely detectable. This has not considered shielding of the target aircraft by the cockpit structure, which will vary between the 2 pilots. For the left seat pilot of JQF, of the 162.5 seconds that the aircraft traversed through the inner and foveal regions it was shielded by cockpit structure for approximately 40% of this time by the left windscreen pillar, instrument panel and the centre windscreen pillar and compass.

For the right seat pilot of JQF, of the 162.5 seconds that the aircraft is traversed through the inner and foveal regions, it was shielded by cockpit structure for over 35% of this time, by the centre windscreen pillar and compass, the top of the instrument panel and the right windscreen pillar.

Figure 86 and Figure 87 Show the field of view from the left and right seat pilots of JQF and the time window through which the target aircraft was traversing the inner field of view.

Figure 86: JQF left seat pilot - fields of view – optimised eye position
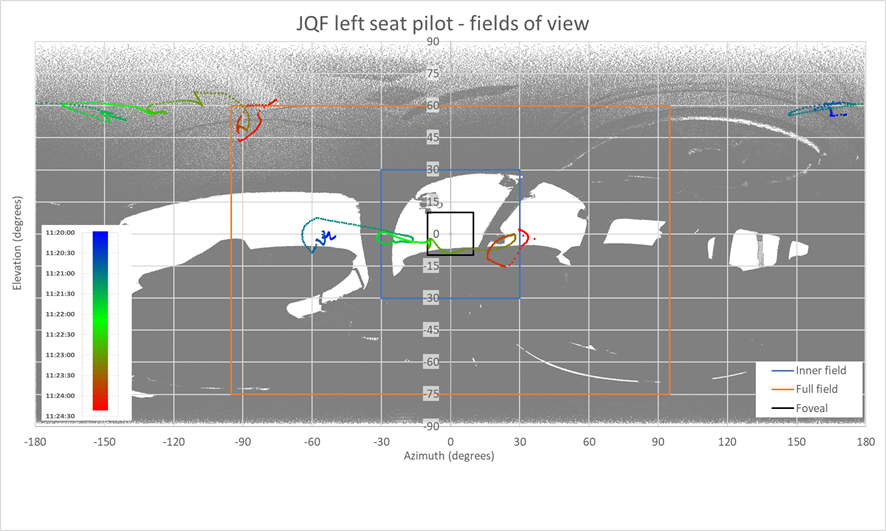
as-2022-001-pic-86.png

Source: ATSB

Figure 87: JQF right seat pilot - fields of view – optimised eye position
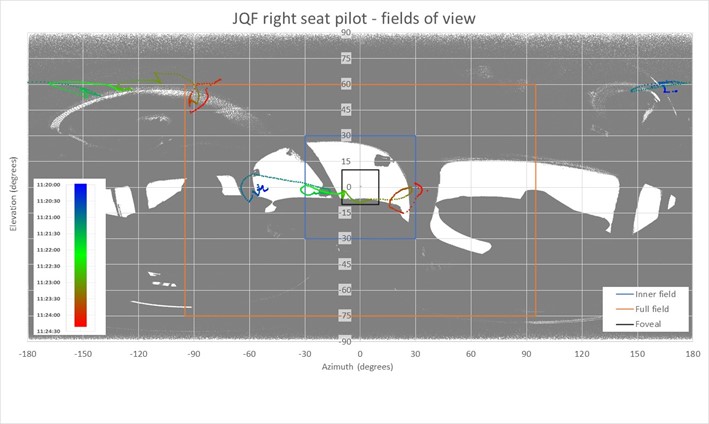
as-2022-001-pic-87.jpg

Source: ATSB

Field of view sensitivity

The earlier Sensitivity analysis section considered the movement of the pilot’s eyes while facing forward. Rotation of the head and eyes will have different effects on the field of view. Due to the distance of the eyes from the axis of rotation (centre of the neck) rotating the head will affect both the field of view and the location of the eyes, affecting the position of the ‘target’ aircraft and the location of the ‘viewer’ aircraft structure. The field of view can also be affected by rotation of the eyes themselves, however this only affects the field of view and not the position of the ‘target’ aircraft or structure.

As the head is rotated about its horizonal axis the eyes, being forward of the axis, will move in the x-y plane relative to their original position. Figure 88 shows a highly stylised example of the effect that a 30° rotation can have on X and Y positions of the eye relative to the heads point of rotation. An equivalent movement of the eyes will occur in the Y-Z plane when the head is rotated about its vertical axis. Discounting binocular vision considerations, which for the purposes of this section are considered negligible, these movements of the eye position will have the same effect as the movements of the eye position discussed in the Sensitivity analysis section. The rotation of the field of view that occurs with the rotation of the head will also occur when the eyes are rotated independently of the head.

Figure 88: Example of eye position displacement due to head rotation (top down view).
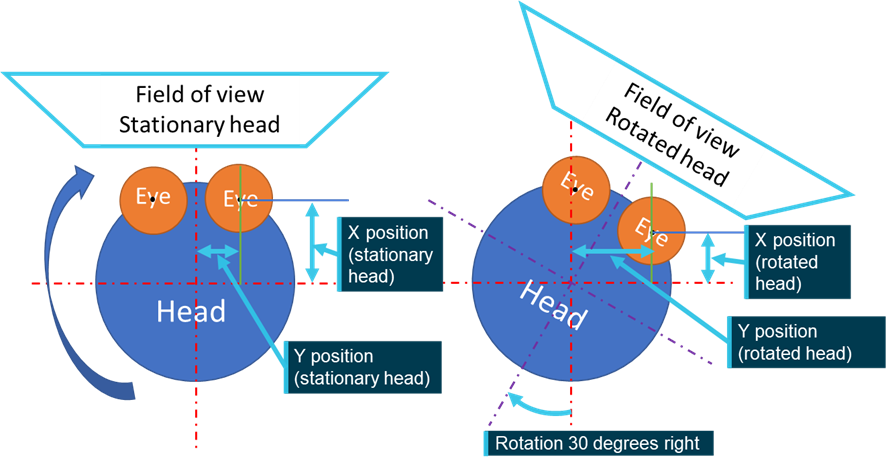
as-2022-001-pic-88.png

Source: ATSB

If the eyes are rotated about their own axis this movement will not induce a movement affecting the eyes position only the field of view, subsequently position of the target aircraft and the cockpit structure do not change. However, the position within the field of view will change. As discussed in earlier sections, the appearance of objects in different areas of the visual field can make them more or less likely to be detected by the pilot.

Figure 89 shows a highly stylised image of the effect that a rotation of the eyes horizontally has on the field of view. A 30° rotation has been used to show the effect of the rotation more clearly on the field of view, the following analysis will consider rotations up to 9°. Rotation of the eyes about their horizontal axis will affect the field of view in the azimuth plane while rotation about the eyes vertical axis affect the elevation angle. Note the constant eye positions as the head has remained stationary against the rotated field of view.

Figure 89: Field of view change with eye rotations (top down view.)
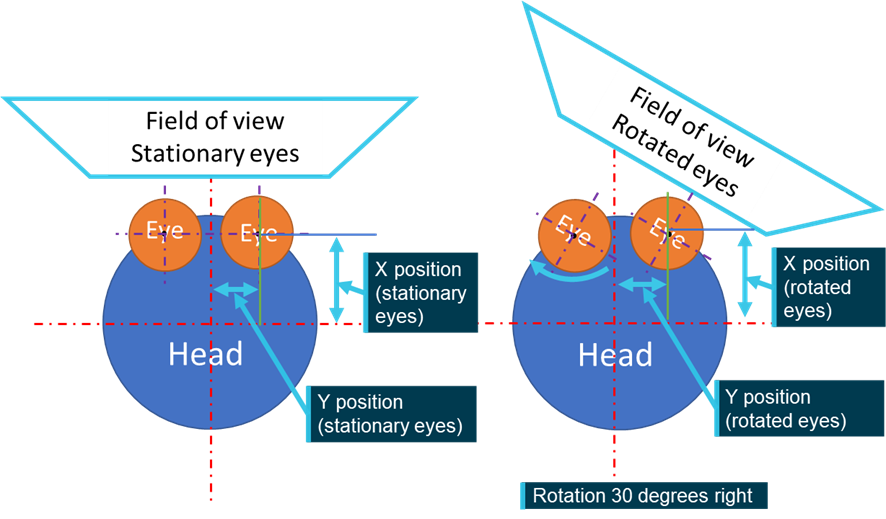
as-2022-001-pic-89.png

Source: ATSB

The ATSB considered a matrix of eye rotations that moved the field of view 3, 6 and 9° in both the positive and negative directions of azimuth and elevations and analysed the resultant effect. This produced 49 different fields of view, but as per the previous analysis these rotations have only been applied to the ATSB’s optimised eye position for each pilot.

The analysis below considers the extremities of rotations, separately considering the changes to detectability of the aircraft based on its position in the differing fields of view. While this provides an insight into the detectability and location, it only considers a snapshot in time at the maximum value examined. In a real-world scenario, the pilot’s head and eyes will constantly move and rotate through the scanning process, combining the effects of the Sensitivity analysis, the discussion of head rotation presented above and the eye rotations that will be explored below. Throughout a flight pilots will also look at various instruments or systems in the cockpit, other flight crew members or passengers constantly changing the field of view and the focus location.

AEM

The comparatively small movement of the target aircraft through the field of view of AEM’s pilots meant that the rotations made relatively little difference to what area of the pilot’s field of view the target aircraft appeared. The negative azimuth rotations brought the later locations of the aircraft more into the foveal field than the original viewpoint. A negative azimuth rotation of 9°, as shown in Figure 90 and Figure 91, increased the amount of time that the aircraft spent in the foveal region from 154.5 seconds to 244.5 of the final 260 seconds.

The 15.5 seconds that the aircraft did not spend in the foveal region was the first 15.5 seconds of data recorded and would have been at a time when the aircraft would not have been detectable due its angular size in the pilot’s view. At this rotation the target aircraft moved into the foveal region at approximately 11:20:15.5 when the aircraft were separated by approximately 16 NM. It remained in the foveal region until the estimated time of collision. For the left seat pilot, this eye rotation also brought the left cockpit pillar into the foveal region. While it did not impact target aircraft visibility, the appearance of the stationary structure in the key part of the visual field may have had 2 effects:

  • provided a better capacity for the detection of relative movement by making the stationary object more obvious.
  • increased the likelihood of a focal trap with a stationary object being so prominent, which would reduce opportunity for detection.

For the right seat pilot, this brought the centrally‑mounted compass into the field of view, which would have a similar impact as a static point in the field of view.

Figure 90: AEM left seat pilot FOV azimuth (Az) -9° elevation (El) 0°
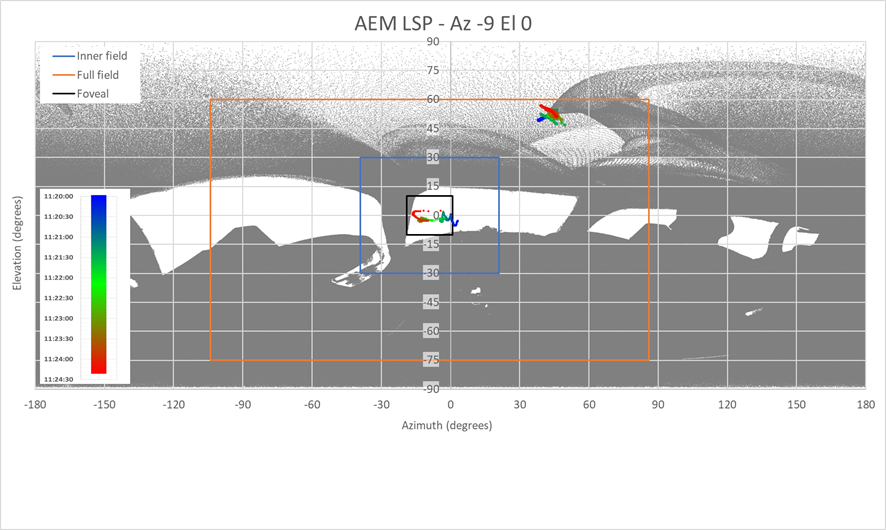
as-2022-001-pic-90.png

Source: ATSB

Figure 91: AEM right seat pilot FOV Az -9° El 0°
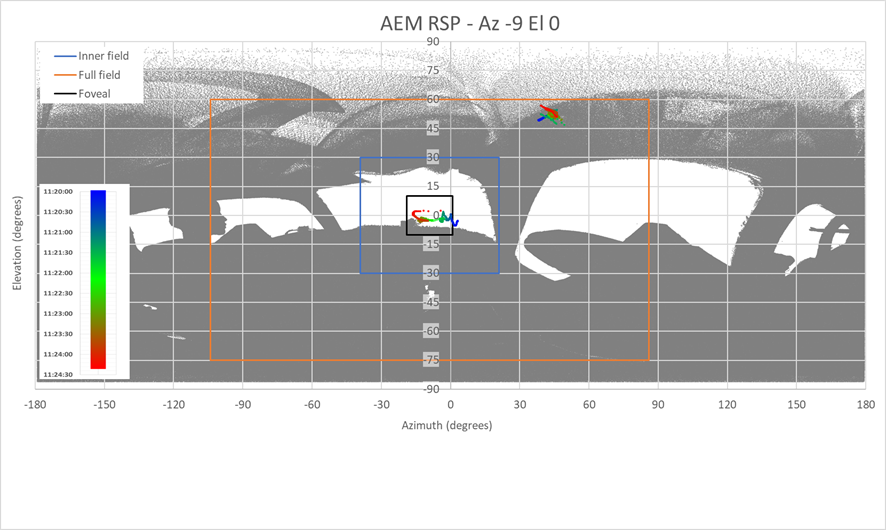
as-2022-001-pic-91.png

Source: ATSB

Rotating the eyes positive 9° of azimuth, as shown in Figure 92 and Figure 93, located the target aircraft within the foveal region for the first 52.5 of the final 260 seconds. While the target exited the foveal window, it remained within the inner field of view where the likelihood of detection remained good.

For both the left and right pilots, this brought elements of the cockpit structure into the foveal view. For the left pilot, part of the compass was within the foveal region and for the right pilot, part of the right pillar and instrument panel were then in the foveal view. While these were then visible within this region, they were also away from the position of the target aircraft so their effectiveness in assisting detecting relative movement would have been minimal.

Figure 92: AEM left seat pilot FOV Az 9° El 0°
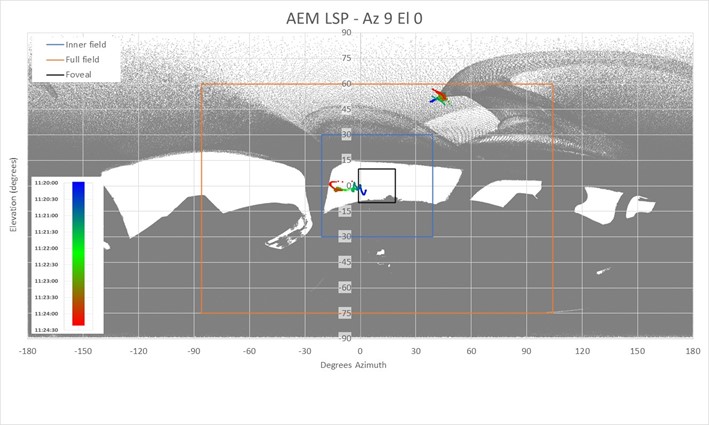
as-2022-001-pic-92.jpg

Source: ATSB

Figure 93: AEM right seat pilot FOV Az 9° El 0°
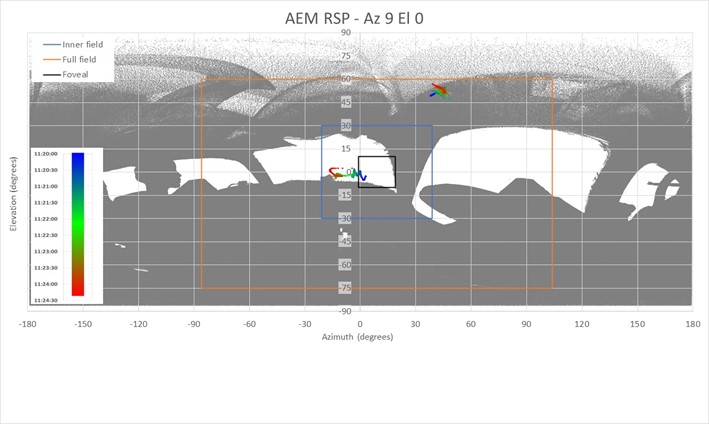
as-2022-001-pic-93.jpg

Source: ATSB

As with azimuthal rotation, elevational rotation only significantly affected how much time the target aircraft spent in the foveal region. As above, rotation of the pilot’s eyes was considered 9° above and below the elevational origin.

Rotating the pilot’s eyes 9° above the origin is equivalent to the pilot scanning towards a distant location or the horizon, as shown in Figure 94 and Figure 95. For this rotation the target aircraft was within the foveal region for 34.5 of the last 260 seconds. Of these 34.5 seconds, 33.5 of them were within the first 2 minutes following JQF’s take-off when the aircraft was outside of visual range. The final second within the foveal region was at 11:21:17, 3 minutes and 3 seconds before the estimated collision time. At this time, the target aircraft would have an angular size of only 0.02° in the field of view and so was likely undetectable.

A rotation of 9° below the origin, as shown in Figure 96 and Figure 97, is the equivalent of a pilot looking at instruments in the top part of the instrument panel. At this rotation the target aircraft was within the foveal region of 150 of the final 260 seconds. The target aircraft was in the foveal region across 3 windows. The first 2 of these windows totalled 144 seconds and were completed before 11:22:27 when the aircraft was 0.04° in the pilot’s field of view. The remaining 6 seconds were between 11:23:40 and 11:23:46, where the aircraft ranged between 0.12 and 0.16° in the pilot’s field of view

For both pilot’s this field also brought a portion of the instrument panel into the foveal region, providing a stationary structure in the field of view. The advantage of this would have been greater for the right seat pilot, with the movement of the aircraft closer to the stationary structure than for the left pilot.

Figure 94: AEM left seat pilot FOV Az 0° El 9°
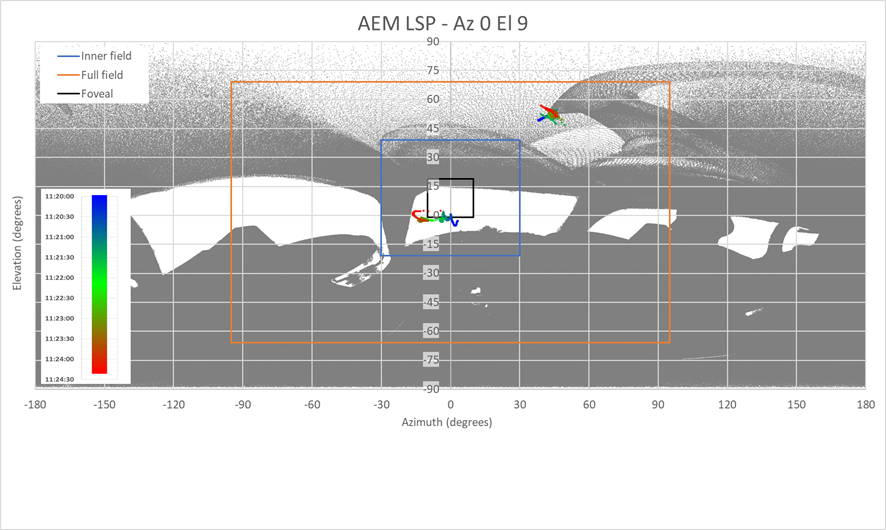
as-2022-001-pic-94.png

Source: ATSB

Figure 95: AEM right seat pilot FOV Az 0° El 9°
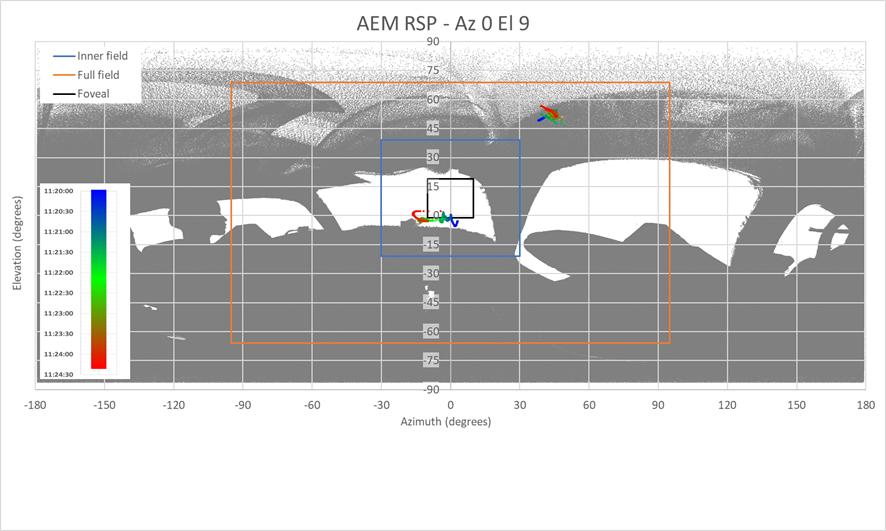
as-2022-001-pic-95.png

Source: ATSB

Figure 96: AEM left seat pilot FOV Az 0° El -9°
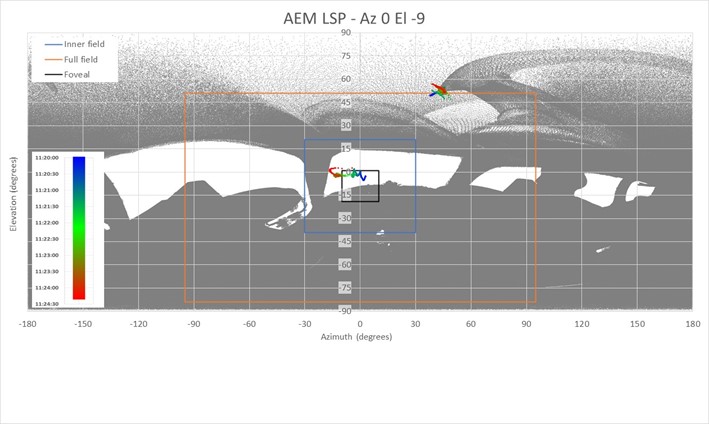
as-2022-001-pic-96.jpg

Source: ATSB

Figure 97: AEM right seat pilot FOV Az 0° El -9°
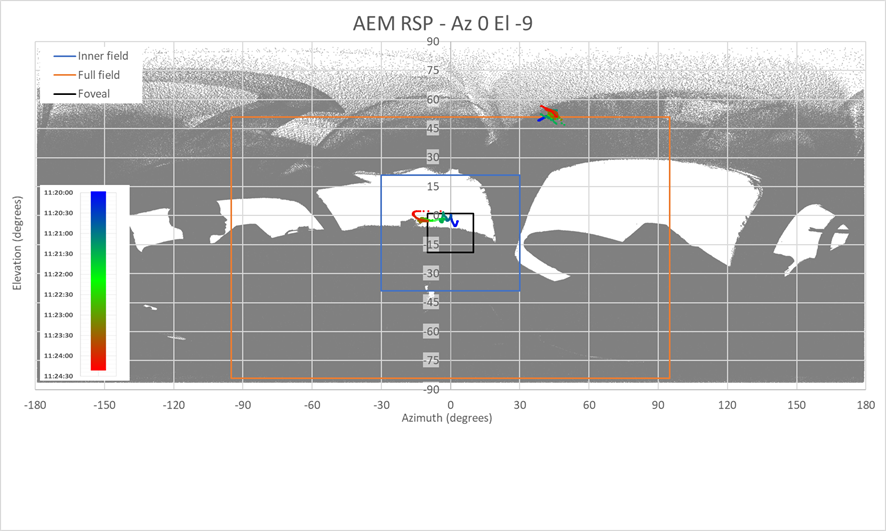
as-2022-001-pic-97.png

Source: ATSB

JQF

The effect of the eye rotations was greater for the pilots of JQF, with the target aircraft moving not only though the foveal region but also from outer region to inner region and back out again. As discussed in the Target shielding section, for the optimised eye position, the target aircraft was shielded during multiple windows to both pilots of JQF. While the rotation of the eyes did not affect the relative position of the target or the structure, the timings when the aircraft was more likely to be detected were dependent on what part of the visual field it was in.

If the aircraft was shielded while it was in the foveal or inner regions it was less likely to be detected. As with the AEM examples, the following sections consider the effect of positive and negative 9° rotations in both azimuth and elevation angles. These will show the extremities of the movement examined in a real-world scenario as a pilot rotated their eyes to scan or look out the cockpit and subsequently the visual field will move through these rotations and viewpoints.

A positive azimuth rotation of 9° retained the aircraft within the full visual field for its entire trajectory. The target aircraft entered the inner field of view at 11:21:20, 179.5 seconds before the collision and exited the inner field at 11:21:35. During this time it remained unshielded to the left seat pilot but was shielded for the entire time from the right seat pilot by the centre spline of the windscreen and the centrally mounted compass. The target then re-entered the inner visual field at 11:22:06, 134 seconds before the collision and remained in the inner field until the collision. While during this time it was shielded from the right seat pilot for 53 seconds and from the left seat pilot for 48 seconds.

Within this final 134 seconds the target aircraft moved in and out of the foveal region twice totalling 21 seconds within the foveal region. Of these 21 seconds, for the right seat pilot 8 of them were calculated as shielded by cockpit structure. For the left seat pilot, the target aircraft was shielded for 19.5 seconds. The target aircraft exited the foveal region at 11:23:54, 26 seconds prior to the collision. From this time until the collision, the target aircraft was shielded from the left seat pilot for 11 seconds and from the right seat pilot for 21 seconds. Figure 98 and Figure 99 show the left and right seat pilot’s views with a positive 9° azimuthal rotation.

Negative azimuth rotation of 9° retained the target aircraft within the full field of view for its whole trajectory. With this shift, the target aircraft exited the inner field before the time of the collision. The target aircraft remained in the inner or foveal visual field for 134 seconds split over 2 windows. The first, 122.5 seconds, starting at 11:21:12 and exiting at 11:23:14.5, approximately 66 seconds before the collision. Of this time the target aircraft was obscured by cockpit structure for 46.5 and 38.5 seconds to the left and right seat pilot’s respectively.

The second entry to the inner field was for 13.5 seconds. The target aircraft entered at 11:23:46 and exited at 11:23:59.5, approximately 21 seconds before the collision. Of this time the target was shielded by structure for 11.5 and 4.5 seconds to the left and right seat pilot’s respectively.

The aircraft was in the foveal region of the visual field for 62.5 seconds split over 2 windows. The target entered the foveal region for 9 seconds, entering at 11:21:22.5 and exiting at 11:21:31.5, 168.5 seconds before the collision. Of these 9 seconds the target was shielded by cockpit structure for the whole time to the right seat pilot and remained unshielded to the left seat pilot.

The second entry to the foveal region lasted 53 seconds, entering at 11:22:08 and exiting at 11:23:00.5, approximately 79.5 seconds prior to the collision. The target aircraft was shielded by cockpit structure for 5.5 and 12 seconds from the view of the left and right seat pilot’s respectively. Figure 100 and Figure 101 show the left and right seat pilot’s views with a -9° degree azimuthal rotation.

Figure 98: JQF left seat pilot FOV Az 9° El 0°
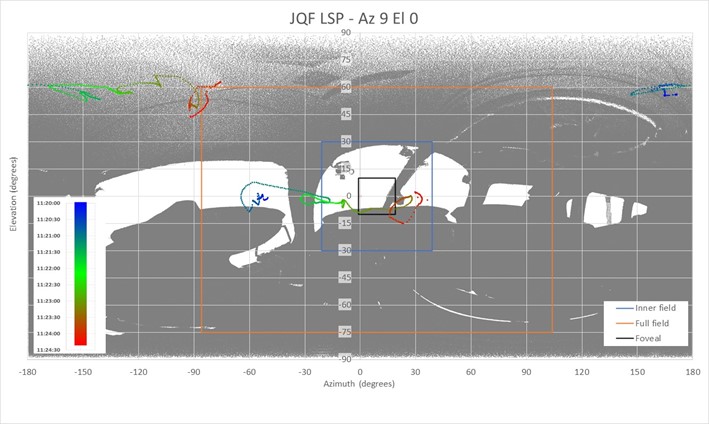
as-2022-001-pic-98.jpg

Source: ATSB

Figure 99: JQF right seat pilot FOV Az 9° El 0°
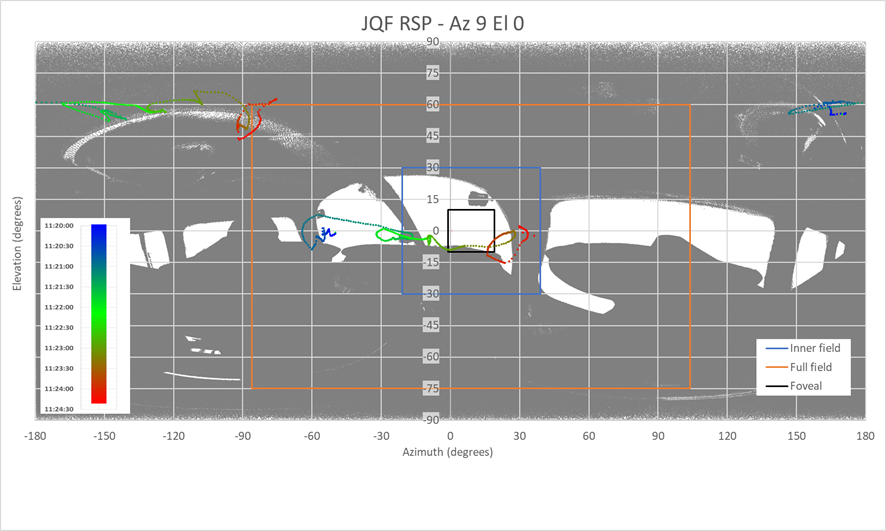
as-2022-001-pic-99.png

Source: ATSB

Figure 100: JQF left seat pilot FOV Az -9° El 0°
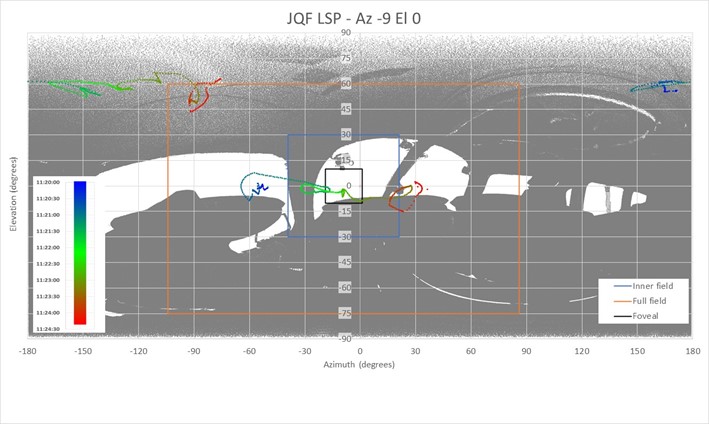
as-2022-001-pic-100.jpg

Source: ATSB

Figure 101: JQF right seat pilot FOV Az -9° El 0°
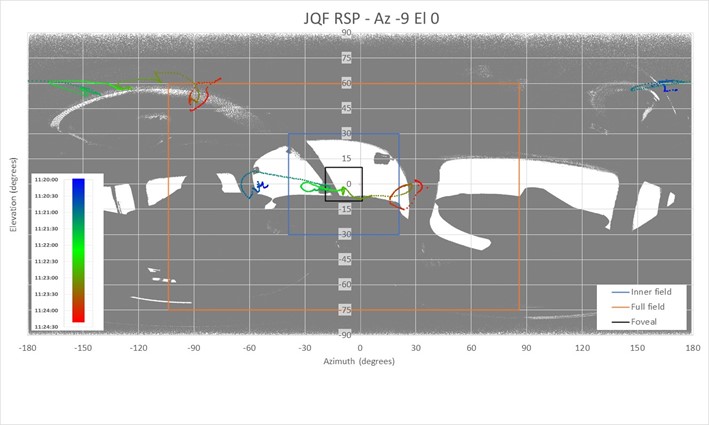
as-2022-001-pic-101.jpg

Source: ATSB

The maximum and minimum elevation values of the target aircraft were 7 and -15° respectively. Therefore, rotations in this direction were less likely to affect the pilot’s visibility windows than movements in azimuth. A rotation of 9° below the elevational origin indicated 3 windows in which the target aircraft was in the pilot’s inner visual field and one where it was in the pilot’s foveal region.

The first window, between 11:21:16.5 and 11:21:50.5 (34 seconds), finishing approximately 210 seconds before the collision. Within this period, the target aircraft was shielded by structure for 11 and 17 seconds for the left and right pilot’s respectively. Through this window the maximum angular size of the aircraft was 0.033°, well below the detectable threshold.

The second window was 128 seconds, between 11:21:57 and 11:24:05, ending approximately 15 seconds before the collision. Throughout this window the target aircraft was shielded by structure for 52.5 and 39.5 seconds to the left and right seat pilot’s respectively. At the time the aircraft exited the inner field it had an angular size of approximately 0.35°.

The final entry into the inner field was 0.5 seconds at 11:24:18 approximately 2 seconds before the collision. The target would have been visible to the right seat pilot and shielded from the left seat pilot. The angular size of the aircraft would have been approximately 4.5°, making it easily detectable. However, by this time it would not have been possible to execute a successful evasive manoeuvre.

During the second movement of the target aircraft through the inner visual field it also traversed the foveal region between 11:22:19.5 and 11:23:10. Within these 51.5 seconds the aircraft was shielded by cockpit structure for 14.5 and 11.5 seconds for the left and right seat pilots respectively. Figure 102 and Figure 103 show the left and right seat pilot’s views with a -9° elevational rotation.

The final rotation that has been considered in the sensitivity analysis is positive elevation rotation of 9°. This rotation was considered important to review as the location the target aircraft was just below the elevational origin leading up to the final part of the track. The data indicated that with this rotation the aircraft entered and exited the inner field at the same times as the previous rotation. This was to be expected due to the relatively small changes in elevation over time compared to azimuth and the size of the inner visual field.

Due to the position of the target aircraft in the visual field for this eye position the target aircraft did not enter the foveal region at any during time during the final 260 seconds leading up to the collision. As shown in Figure 102 and Figure 103, the rotation at certain points would only have to be slightly less in this direction and it would have fallen into the pilot’s foveal field.

Figure 102: JQF left seat pilot FOV Az 0° El -9°
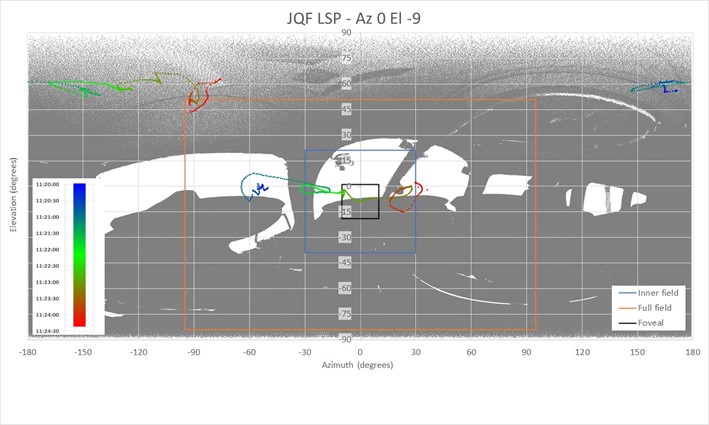
as-2022-001-pic-102.jpg

Source: ATSB

Figure 103: JQF right seat pilot FOV Az 0° El -9°
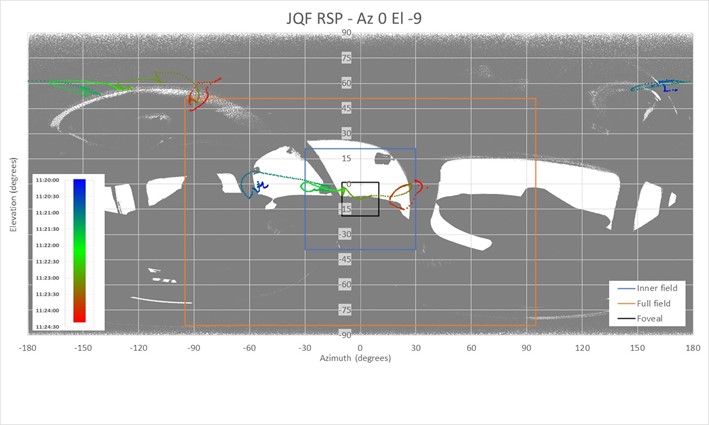
as-2022-001-pic-103.jpg

Source: ATSB

Figure 104: JQF left seat pilot FOV Az 0° El 9°
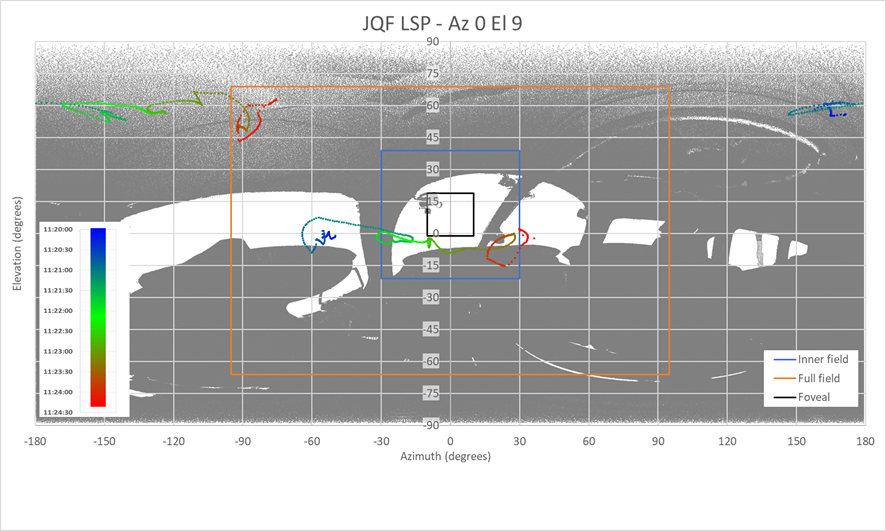
as-2022-001-pic-104.png

Source: ATSB

Figure 105: JQF right seat pilot FOV Az 0° El 9°
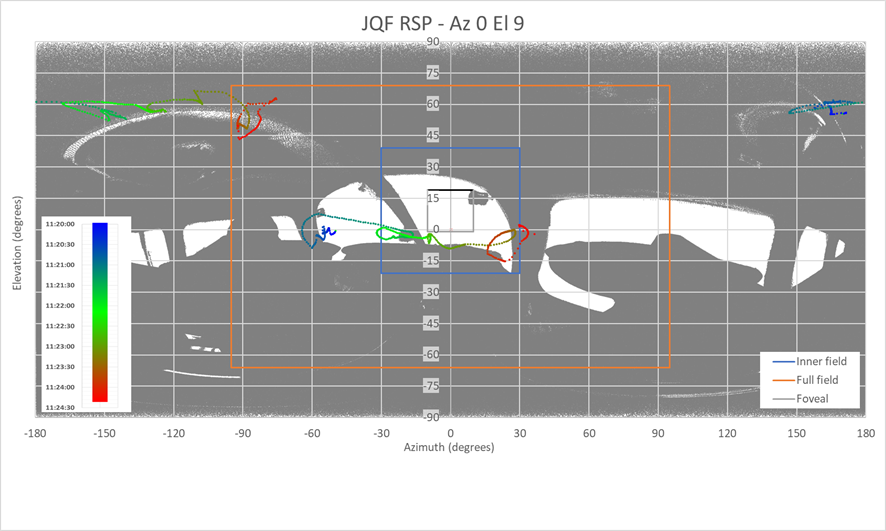
as-2022-001-pic-105.png

Source: ATSB

Evaluation

Accurately tracking the movement of the pilots’ head and eyes, was not possible with the available information. Based on the previous positional analysis of the pilots’ eyes, an optimised eye location was chosen and subsequently a series of rotations of the eyes were considered to assess what effect they might have had on the target aircrafts visibility. The presentation of the extremities of these rotations indicates what the maximum effect was likely to be. However, as previously stated, the actual rotation would probably have been constantly changing as the pilot scanned both inside and outside the aircraft.

For the occupants of AEM these rotations were only likely to have altered when the target aircraft was within the region of highest visual perception (foveal region). Additionally, they also had the potential to alter where in the field of view parts of the aircraft structure sat and subsequently affected the possibility of detection of the aircraft through either the identification of relative movement or the creation of a possible focal trap near the position of the aircraft.

For JQF’s pilots, due to the amount of the field of view that the target aircraft traversed, the impact of these rotations on the time that the aircraft was in the inner field of view was more significant. The negative azimuthal rotations brought the target aircraft into the inner field sooner. For the left seat pilot this was negated by the presence of aircraft structure but for the right seat pilot it was unshielded.

However, the target aircraft also departed the inner visual field sooner when its relatively smaller size made it less detectable. Conversely, the earlier detection opportunity by the right seat pilot had minimal impact on them due to shielding of the aircraft structure, for the final part of the flight path. The left seat pilot had less obstructions once the target aircraft moved out of the inner visual field, but the position of the target aircraft, first behind the centre windscreen spline and then behind the instrument panel further limited opportunity for detection.

The movement of the foveal fields of view with the elevational change was most pronounced with the increase in elevation. The movement of the eyes upward took the target aircraft entirely out of the foveal region. While this would not have prevented the aircraft from being detected, as it could still be in the inner field, at distance and during daylight the foveal area offers the best opportunity for detection.

Cockpit display of traffic information study

Alerting

The concept of internal and external alerting was previously discussed in the Avoidance Alerting section. This section will focus on internal alerting systems but as detailed previously, these work in conjunction with external alerts to assist in the development of the mental model. In the lead up to this accident the occupants of both JQF and AEM were provided with radio advice (external alerts) via air traffic control identifying the presence and approximate location of the other aircraft.

In addition to these alerts, in the 4 minutes leading up the collision the controller also received 2 short term conflict alerts (STCA) on the 2 aircraft. [21] These were not passed through to the pilots, nor were they required to be (refer to investigation report for further details). Subsequently, they were not considered further as a potential source of external alerting.

The radio communications provided by the controller were one potential source of external alerting. Communications on a common frequency (CTAF), whether directed to the receiver or simply overheard, also assists pilots to develop an accurate mental model of the surrounding traffic. The pilots of JQF and AEM were managing 2 or 3 different frequencies respectively. Both aircraft communicated with the Melbourne Centre controller, and procedurally were required to broadcast on the Mangalore Airport CTAF.

Additionally, as they were inbound to Mangalore Airport, the pilots’ of AEM, would probably have accessed broadcast weather information, which was on a separate frequency. Even with dual radios, the need to engage with different frequencies limited the pilots’ opportunity to establish communications with one another or hear information from another aircraft (or ATC) that may have assisted in the development of their mental model.

As the ATSB concluded that the pilots did not establish communications with each other on the CTAF or other frequencies, it was assumed for the purposes of this study that the only external alerts received were the individual communications with the controller on the Melbourne Centre frequency. Considering this scenario, the pilots’ mental model of the location of the other aircraft was developed with limited information. Further, in the key moments just before the collision, when the aircraft were of a detectable size, the only provided traffic information was 2‑5 minutes old, limiting its effectiveness to assist visual acquisition.

Internal alerting

The ATSB considered 2 options for internal alerting systems that were available, but not fitted or in use at the time of the accident. The first was an EFB application and attached ADS-B IN device providing information to the pilot. However, due to the lack of alerting functions on commonly utilised EFBs at the time of the accident, and the number of different available options, replication of one EFB application would not necessarily have been representative. It was therefore decided to replicate an approved and RTCA DO-317B‑compliant system [22] (see the following section) to demonstrate a best practise example of how ADS-B IN traffic alerting can significantly enhance situational awareness.

The presented imagery illustrates the system as it would have appeared to the pilots and how it would have reacted to the presence of the other ADS-B OUT equipped aircraft. It will also detail what alerts and associated information would have been displayed in accordance with the standard. The appearance and displayed information for individual systems, or implementations, may be different to that presented.

CDTI and ATAS in built – RO-317B compliant

Using the ADS-B position and altitude data calculated in the Aircraft performance study, the ATSB developed input data for a simulation program based on material provided by the RTCA (formerly Radio Technical Commission for Aeronautics) and NTSB for demonstration purposes. To improve the realism of the simulation, the ATSB also added in ADS-B returns for other aircraft in the area that were detected by the Airservices network.

The presented display (Figure 106) depicts 3 range rings at 15, 6 and 2 NM around the viewer aircraft. These range rings are normally adjustable using the zoom level of the display however, for the purposes of this demonstration the zoom functionality has been disabled. The simulated CDTI display shows the position and orientation of each aircraft (target) relative to the viewer aircraft. Beside the traffic icon (blue unfilled arrowhead), there is information about the aircraft. This can display a range of parameters, but in this case has been limited to only show vertical proximity and tendency. The number beside the aircraft shows the vertical proximity in 100 ft increments either above (+) or below (-) and the arrow shows vertical tendency - up arrow, indicating climbing, and down arrow, indicating descending, at more than 500 feet per minute.

The display has 3 levels of alert or display change to assist the pilot. The first is a transition from traffic to proximal traffic. This identifies that another aircraft has moved to within 6 NM and 1,200 ft of the viewer aircraft. This does not trigger an aural alert but changes the display of the target aircraft from a blue outlined arrowhead to a blue filled arrowhead. Within this zone the ATAS system calculates 2 separate radii around each of the target aircraft called the protected airspace zone (PAZ) based on target closing speed and distance and the collision airspace zone (CAZ) defined as a 500 ft radius around the target and 200 ft vertically. These zones are continuously redefined based on updated ADS‑B information received about each target aircraft.

Once the aircraft is projected to breach either the PAZ or CAZ around a target aircraft within the next 15 seconds an audible alert is triggered in the ATAS system. If the system is linked to a CDTI, the CDTI will also show a change in the target aircraft symbol. If the breach is projected to occur in more than 15 seconds the ATAS will hold the alert until a second predicted breach is received at which point the system will alert. This is designed to limit nuisance alerts.

This alert tells the pilot the relative bearing (in clock co-ordinates), distance to, relative vertical position, and current activity (climbing, descending or level) of the target aircraft. The identifier on the CDTI screen also changes from a blue filled arrow to a yellow arrowhead in a circle.

Based on these requirements and the calculated aircraft positions for both aircraft the ATSB has developed CDTI and ATAS simulations of the final 260 seconds of the accident flight.

The following figures show the exemplar CDTI displays at key moments throughout the sequence. Specifically, when the aircraft would have become visible on each other’s CDTI displays and when PAZ and CAZ breach alerts, provided audibly to the pilot as well as displayed on the CDTI, would have been triggered.

Figure 106 shows the CDTI displays of both AEM and JQF at 11:20:01, (259 seconds before the collision), the approximate take‑off time of JQF. At that time, no ADS-B equipped targets would have been displayed.

Figure 106: CDTI displays at 11:20:01
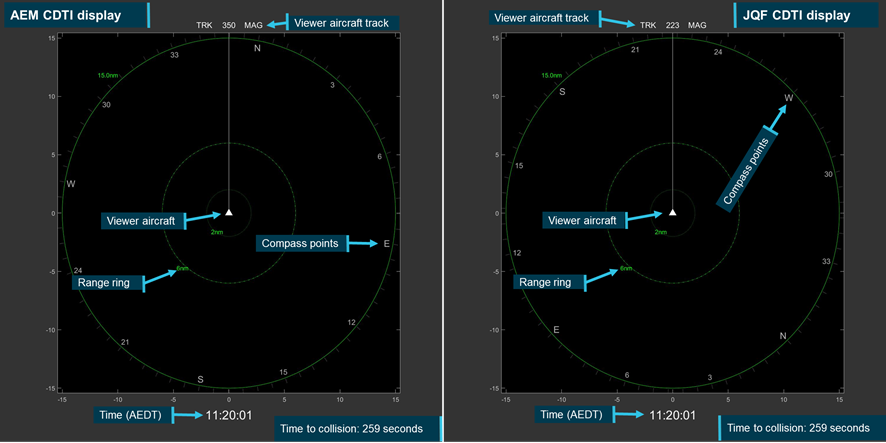
as-2022-001-pic-106.png

Source: ATSB

Figure 107 shows the CDTI displays at 11:20:43 (3 minutes and 37 seconds before the collision) when the target aircraft first became visible on the display at 15 NM from the viewer aircraft with about 4,600 ft vertical proximity.

Figure 107: CDTI displays at 11:20:43
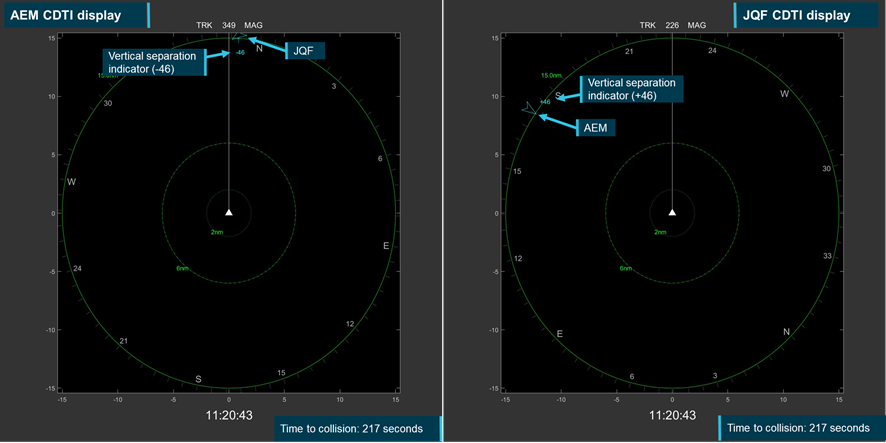
as-2022-001-pic-107.png

Source: ATSB

Figure 108 shows the CDTI displays when the aircraft transitioned to proximal traffic, with the target aircraft showing as a blue filled arrowhead while other ADS-B traffic on the screen remained unfilled. Note: at that time the target aircraft was inside the 6 NM range ring and had a vertical proximity indication of +/- 12 (indicating traffic is 1 200 ft above or below). The one second time difference between the change to proximal traffic on the displays (11:23:38 – JQF and 11:23:39 - AEM) was due to the resampling during the data processing for the animation making the transition appear one second later on the AEM display.

Figure 108: CDTI displays at change to proximal traffic
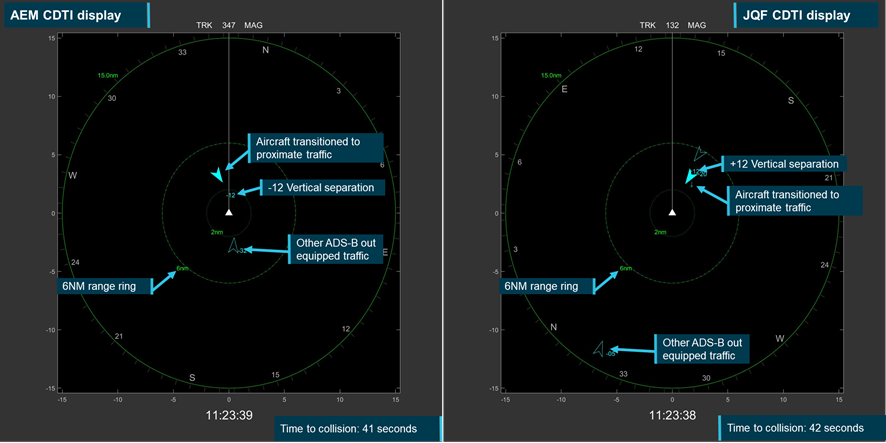
as-2022-001-pic-108.png

Source: ATSB

Figure 109 shows CDTI displays and associated alert at the time the aircraft were projected to breach the PAZ the around the target aircraft as defined by the closing speed of approximately 245 kt. Note the change in display of the target aircraft to the more prominent yellow, clearly identifying it from other ADS-B traffic. The text shown on the display would have been enunciated through the pilot’s headset or the internal communications system and is not displayed on screen.

There is also a slight variation in the times that this alert occurs for the 2 aircraft (2 seconds, 11:23:48 – JQF and 11:23:50 – AEM). This is most likely due to differences in estimation of future track points for each aircraft and associated projected PAZ breaches.

Figure 109: CDTI displays at the time of the PAZ breach alert
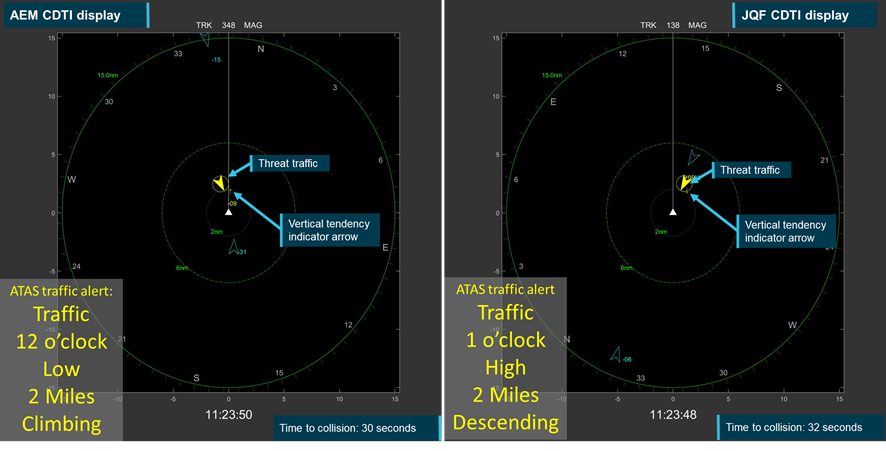
as-2022-001-pic-109.png

Source: ATSB

Figure 110 show CDTI displays and associated alert at the time that the viewer aircraft projected a breach of the CAZ around the target aircraft. Note the aircraft remained in the highly visible yellow colouring. Again, there is a slight variation in the times that this alert occurs for the 2 aircraft (2 seconds, 11:23:54 – JQF and 11:23:56 – AEM). This is most likely due to differences in estimation of future track points for each aircraft and associated projected CAZ breaches.

Figure 110: CDTI displays at the time of the CAZ breach alert
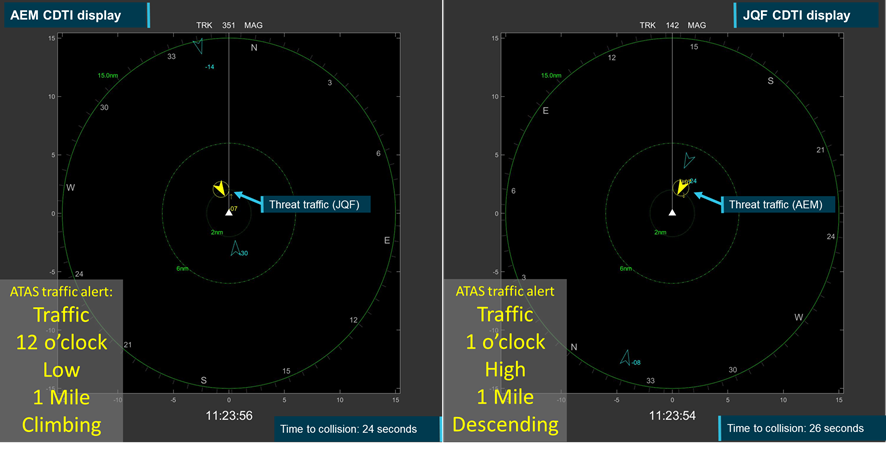
as-2022-001-pic-110.png

Source: ATSB

Animation Development

To assist in the visualisation and understanding of the accident sequence and to give a more realistic visualisation of what pilots may have seen, the ATSB developed an animation of the final 260 seconds leading up to the accident. This animation was developed using Microsoft Flight Simulator X (FSX) software using the optimised eye position of each of the 4 pilots involved. The animation development consisted of 4 parts:

  • flight path development and integration
  • cockpit visualisation and modelling
  • environmental condition modelling and visualisation
  • recording and integration with animated CDTI display.

The following sections briefly outline how each of these were carried out and what information was used in their development.

Flight path development and integration

Through the Aircraft performance study, the ATSB developed a smoothed flight path based on ADS-B data for both aircraft. FSX does not have a native ability for flight paths to be imported and have aircraft fly them. To enable this, the ATSB utilised a third party add‑on application called FS Recorder [23] to import and record the flight paths with cockpit views from each pilot’s position.

Cockpit visualisation and modelling

Aircraft selection

The animation relied on the viewer seeing a representative target aircraft. Neither a D95A Travel Air or a PA-44 Seminole were native to FSX and so representative models had to be sourced. Due to functionality built into FSX users could develop or modify aircraft to suit their needs. A Piper PA-44 Seminole model was able to be located and freely available for download. [1] This model was utilised for external modelling purposes, with the cockpit panels replaced with ATSB developed cockpit masks (see the section below titled Cockpit masks).

An FSX‑compatible model of a D95A Travel air was not able to be located. Consequently, a Beechcraft Baron, which was provided native with FSX, was used for this animation. The Baron fuselage is approximately 600 mm longer than the Travel Air, but both have the same twin engine, low wing configuration. The ATSB assessed that the differences between the 2 aircraft would have little impact on the animation. Internal cockpit views were removed and replaced with the ATSB cockpit mask of the Travel Air.

Aircraft lighting

As discussed previously in the Aircraft lighting section, lights provide enhanced opportunity for visual acquisition of the target aircraft. FSX has functionality to allow aircraft lighting to be simulated and activated, this included landing, position, and anti-collision strobe lights. As it was determined that JQF’s landing light may have provided AEM’s pilots an improved opportunity for visual acquisition, consideration was given to utilising lighting on the model of JQF. However, testing identified that the simulated lights were lower power than those on the aircraft and unlikely to be representative of that fitted to JQF. Consequently, the final animation was created with all lighting switched off.

The model used to simulate AEM also had lighting available however this lighting was not representative of that which was fitted to the accident aircraft. Due to this and the previous determination that lighting installed on AEM was unlikely to have provided any detection advantage for the JQF pilots it was also switched off for the development of the animation.

Camera positions

The camera position of FSX was used to replicate the pilots eye positions. The standard FSX camera position provided visualisation of a maximum of 90° horizontally and approximately 54° vertically. [25] The process of calculating these angles was developed by the NTSB and is described in Appendix B of O’Callaghan, 2020 supported by Hestnes 2011. Horizontally, the 90° was split either side of the zero-point, giving a view of azimuth values from -45 to 45°. Where objects lay outside this, they were not visible to the viewer unless the camera was rotated, or the field of view was expanded.

Rotating the field of view allows the viewer to see objects within that new area, however it removes the portion of the screen that the camera has been rotated away from. To best recreate the visual field a second camera, and in this case a third, co-located with the first but rotated through a set angle was used. The second camera was rotated 90° positive giving a view of 45 through 135° of azimuth. The third camera was rotated through 90° negative giving a view of -45 through -135° of azimuth. The view of the second and third cameras were located on separate displays of the same resolution placed to the appropriate side of the main displays. This provided a view of 270° of azimuth with 54° of elevation, further cameras and screens can be used to show more of the visual field however in this case it was not considered necessary. The simulated views on each screen were recorded concurrently.  

It is important to note that the rotation of the cameras leads to discontinuities in the visualised image, most notably the apparent rotation and position of the horizon line as viewed from the cockpit. This apparent rotation is due to the projection of the horizon line onto a flat surface as they are recorded. If the 2 screens to either side of the main view are located physically at 90° to one another, the effect is less pronounced. Figure 111 and Figure 112 show the 270° from both AEM and JQF at the start of the animation.

Figure 111: 270° view from AEM depicting terrain and meteorological conditions

as-2022-001-pic-111.jpg

Source: ATSB

Figure 112: 270° view from JQF depicting terrain and meteorological conditions

as-2022-001-pic-112.jpg

Source: ATSB

Cockpit masks

With cameras positioned, cockpit masks were developed and placed over the cameras view to represent the physical obstruction to the pilots’ sight lines from the cockpit structure. FSX and the various aircraft came with native cockpit layouts or panels that aimed to provide the user with a realistic experience. However, the dimensional accuracy of these cockpit layouts was not known so they could not be relied upon for visualisation. These cockpit views are stored within the aircraft file structure as image files that are loaded for the aircraft when the flight is created.

Using the cockpit imagery, the 3-dimensional models developed from the laser scan data and optimised pilot’s eye position, the ATSB created dimensionally accurate cockpit masks as the pilots would have experienced them. The masks were then scaled to the correct size for the visual field displayed by each camera view and placed in the aircraft’s file structure in place of the existing panels.

The cockpit mask was created as a single bitmap image. FSX defines a specific colour (black) as transparent, giving an unobstructed view in these areas. Any other colours in the mask will show as solid colour with their transparency able to be adjusted from solid to fully transparent. To allow the viewer to get a better understanding of when the target aircraft is shielded by the structure and where it is located behind the structure, for the purposes of the animation, the transparency of the cockpit mask was set to 30%.

Figure 113 shows a single panel cockpit mask as developed for the left seat pilot of AEM. Note the black areas that FSX recognises as fully transparent. This mask was overlaid on the central screen depicting azimuth angles of -45° through 45°. Figure 114 shows the complete mask that is sectioned for the 3 screens and depicts as 270° of azimuth -135° through 135°. Figure 115 and Figure 116 show the cockpit mask panels with a transparency of 30% overlaid on the simulated views from AEM and JQF at the start of the animation.

Screen resolution

When projected onto a display the target aircraft can only become visible to the viewer when it reaches the size of one pixel. With a full high definition screen (resolution of 1920 x 1080 pixels) and a FOV of 90° per screen, each pixel makes up approximately 0.047° (approximately 3 arc minutes) of azimuth. This is well below even the ideal size of human perception of 0.2° (12 arc minutes), as discussed in the Object perception section. Due to this, the utilisation of a higher resolution screen was not considered necessary. Based on the ATSB analysis, JQF occupied one pixel in the AEM animation at approximately 11:22:29.50 (129.5 seconds into the animation), and AEM reached the size of a pixel in the JQF animation at 11:22:31.50 (131.5 seconds into the animation).

Figure 113: Scaled central cockpit mask left seat pilot (LSP) of AEM (depicting azimuth -45 through 45°)
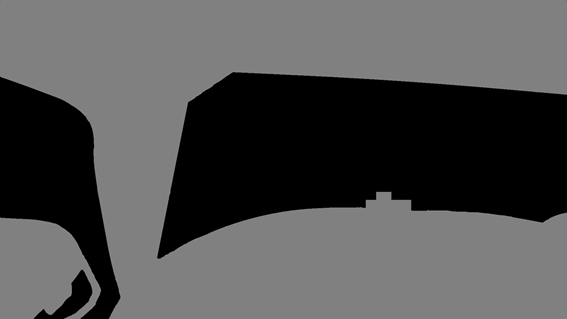
as-2022-001-pic-113.png

Source: ATSB

Figure 114: Scaled cockpit mask of LSP of AEM (depicting azimuth -135 through 135°)

as-2022-001-pic-114.png

Source: ATSB

Figure 115: Cockpit mask overlaid on 270° view from AEM (260 Seconds before collision)

as-2022-001-pic-115.jpg

Source: ATSB

Figure 116: Cockpit mask overlaid on 270° view from JQF (260 Seconds before collision)

as-2022-001-pic-116.jpg

Source: ATSB

Condition modelling and visualisation

FSX has the capability to model terrain, sun position, based on date and time, and meteorological conditions. While this is designed to improve the user’s simulation experience it also allows for more accurate recreation of real-world conditions. To accurately represent the desired conditions wind, cloud, rain, and certain other parameters can be modified based on the user’s preference. Using this functionality, the ATSB developed 3 scenarios.

The first was in accordance with the conditions recorded by the Mangalore Airport weather station at the time of the accident. The conditions were inputted into the FSX weather simulation process using base altitudes, cloud types and ceilings estimates based on available imagery and an assessment of whether the cloud layers continued to the base of the next layer.

The second considered the scenario outlined at the start of the Cockpit visibility assessment section, with a cloud layer being present but at a sufficient altitude that the aircraft’s line of sight was not be obscured. An overcast cloud level was set at 5,000 ft and the animation was repeated with these conditions. Finally, to give an indication of the effect of the cloud compared to a clear day, all weather was switched off and the simulation was repeated with sky clear conditions. Figure 117, Figure 118 and Figure 119 show the conditions from AEM at the start of the 3 simulations and Figure 120, Figure 121 and Figure 122 show the conditions from JQF at the start of the simulations. These figures use the left seat pilot’s viewpoint.

Figure 117: View from AEM with simulated conditions – 260 seconds before collision

as-2022-001-pic-117.jpg

Source: ATSB

Figure 118: View from AEM with 5,000 ft cloud level – 260 seconds before collision

as-2022-001-pic-118.jpg

Source: ATSB

Figure 119: View from AEM with clear conditions – 260 seconds before collision

as-2022-001-pic-119.jpg

Source: ATSB

Figure 120: View from JQF with simulated conditions – 260 seconds before collision

as-2022-001-pic-120.jpg

Source: ATSB

Figure 121: View from JQF with 5,000 ft cloud level – 260 seconds before collision

as-2022-001-pic-121.jpg

Source: ATSB

Figure 122: View from JQF with clear conditions – 260 seconds before collision

as-2022-001-pic-122.jpg

Integration of CDTI displays

As outlined in the CDTI section, the ATSB developed cockpit displays and alerting functionality for both aircraft for the final 260 seconds of the flight. The timestamps between the CDTI data and the cockpit animations were aligned, and the 2 animations were overlayed to show the alerts in real time.

Results

The animation, combined with the CDTI displays, were played back in real time and recorded by investigators. The following show the views from both AEM and JQF at critical times in the lead up to the collision. The figures below show the outlook from AEM and JQF, as per the accident conditions simulation, (centre panel of the animation) at:

  • the times that the target aircraft transitioned to proximal traffic on the CDTI
  • the times that the PAZ and CAZ breaches were projected and the accompanying ATAS alerts received
  • 13 (chosen as based on the research it is the last opportunity to detect and have sufficient time to avoid), 10, 5 and 1 second before the collision.

The target aircraft’s location has been identified with a red circle. Figure 123 to Figure 136 [26] show views from AEM at these key times and Figure 137 to Figure 150 [27] show the view from JQF. Examples showing the same set of imagery, but for clear skies, can be found in an attachment to this report.

While the animation resolution is not as great as the human eye, it clearly shows the limitations of visual acquisition of target aircraft, regardless of the external conditions. The alerting capability of the CDTI and ATAS not only gives the pilot significantly greater warning about the presence of an aircraft but also provides them with a location and altitude to assist in visual acquisition and avoidance of the target.

Video animation 1: The collision as viewed from VH-AEM right seat.


Source: ATSB

Video animation 2: The collision as viewed from VH-AEM left seat.


Source: ATSB

Video animation 3: The collision as viewed from VH-JQF right seat.


Source: ATSB

Video animation 4: The collision as viewed from VH-JQF left seat.

Source: ATSB

Conclusion

The collision between AEM and JQF was the first mid-air collision of 2 IFR aircraft in Australia. In supporting the investigation, the ATSB sought to better understand the potential for visual acquisition of each aircraft considering the:

  • information that was available to the pilots
  • structure, performance and systems of each aircraft
  • human performance limitations
  • environmental conditions at the time.

The ATSB also reviewed other technologies that, if available, may have provided additional information to the pilots and enhanced their mental model of the surrounding airspace and traffic.

To do this the ATSB:

  • undertook a literature review of human factors and the involved technological elements
  • reviewed and conducted significant analysis on ADS-B data from the Airservices Australia receiver network
  • reviewed aircraft structural, equipage and wreckage information, air traffic control recordings and personnel information.

The ATSB then developed exemplar cockpit displays using RTCA DO-317B‑compliant CDTI displays and analysed their likely effectiveness in alerting the pilots to the impending collision had they been fitted.

Key conclusions

  • Analysis of the ADS-B data and on-site wreckage examination identified that the aircraft collided approximately 2,645 meters east and 6,820 meters south of the runway 05 threshold at Mangalore Airport with a relative angle of approximately 140° and at an altitude of approximately 4,125 ft, with JQF colliding with the top of AEM.
  • Meteorological information indicated that cloud likely obscured the aircraft up until the collision, or until immediately before the collision, meaning that the pilots had insufficient time to visually acquire the opposing aircraft before the collision.
  • Based on analysis of the flight paths, regardless of cloud conditions and aircraft structural considerations, the size, closing speed and contrast meant it was unlikely that the pilots would have been able to visually locate the target aircraft, determine it was a threat and initiate a manoeuvre in sufficient time to avoid the collision.
  • Based on the ATSB’s optimised pilot eye positions, the pilots of JQF would likely have had the aircraft structure obscuring the target aircraft at critical times as AEM approached. This would have limited visual acquisition opportunity to either earlier times when the aircraft was smaller in the visual field or later when there was insufficient time to initiate and complete an avoiding manoeuvre.
  • Based on the optimised eye positions, the viewpoints of the pilots in AEM were not obstructed by cockpit structure in the 260 seconds leading up to the collision.
  • Sensitivity analysis of pilot eye position indicated that relatively small movements had a significant effect on aircraft structural obscuration of the target aircraft and where in the visual field the aircraft appeared.
  • The 60,000 candle power landing light fitted to JQF provided the best opportunity for visual acquisition of the aircraft. Despite its position set back in the nose cowl limiting its effective arc there were multiple windows during which it could have been visible to the pilots of AEM and at its rated power it could draw the pilot’s attention even without a strobe functionality.
  • Neither aircraft was fitted with an internal alerting capability. While one of the pilots of AEM had an electronic flight bag application available, it was not paired with an ADS-B IN device. This limited the traffic information that was available to the pilot and the version of the application which was used did not have an alerting function for nearby traffic.
  • The pilots of both aircraft were reliant on external alerting, such as radio communications, to provide traffic information on aircraft that could not be visually acquired to develop their mental model of the operating environment.
  • Utilising ADS-B IN enables pilots to accurately locate other aircraft without the need for an external alert and at significantly greater distances than are possible with the human eye. In this case, the presence of ADS-B IN equipment, combined with a suitable cockpit display would have provided accurate speed and position information on the aircraft well before it was detectable visually, while also aiding the sighting of an approaching aircraft.
  • The animation developed by the ATSB using Flight Simulator X and FS Recorder clearly illustrates the limitations of visual acquisition and the significant additional alerting time provided by ADS-B IN displays.

References

Aerion. (2021). It’s Just ADS-B. Retrieved from Aerion: https://aireon.com/resources/overview-materials/its-just-ads-b/

Aerion. (2021). Technical Specifications. Retrieved from Aerion

AeroLEDS. (2021). SUNSPOT 36-4000 TECHNICAL SPECIFICATIONS. Retrieved from AeroLEDS: https://aeroleds.com/products/sunspot-36-4000-landing-light/

AeroLEDS. (2021). The LED Advantage. Retrieved from AeroLEDS: https://aeroleds.com/the-led-advantage/

Airservices Australia. (2016, December). ADS-B - Questions and Answers for Owners of General Aviation Aircraft. Retrieved from Airservices Australia: https://www.airservicesaustralia.com/wp-content/uploads/FAQ_ADS-B_DEC16…

Airservices Australia. (2020, May). ADS-B coverage. Retrieved from Airservices Australia: https://www.airservicesaustralia.com/about-us/projects/ads-b/ads-b-coverage/

ATSB. (2002). AVIATION SAFETY INVESTIGATION REPORT 200201846 - Piper PA-28-161, VH-IBK, Socata TB-9, VH-JTV, Bankstown Airport, NSW, 5 May 2002. Canberra: ATSB.

Bullough, J. D. (2011). Aviation Signal Lighting: Impacts of Lighting Charactaristics on Visibility. Advances in Applied Science Research, 16-26.

CASA. (2019). Airspace Review of Hobart - December 2019. Canberra: CASA.

CASA. (2020). Civil Aviation Order 20.18 (Aircraft equipment — basic operational requirements) . Canberra: CASA.

Civil Aviation Safety Authority. (2021, July). VFR Equipment Survey Results. Retrieved from Civil Aviation Safety Authority: https://consultation.casa.gov.au/stakeholder-engagement-group/vfr-equip…

Colvin, K., Dodhia, R., & Dismukes, R. K. (2005). Is Pilots Scanning Adequate to Avoid Mid-Air Collisions? International Symposium on Aviation Psychology, (pp. 141-146). Dayton.

Device Technologies Inc. (2019, May 3). Extending Your Squitter – A Key Part of ADS-B. Retrieved from Device Technologies, Inc.: https://www.devicetech.com/aerospace/extending-your-adsb-squitter/

FAA. (2011). Introduction to TCAS II Version 7.1. Washington D.C.: U.S. Department of Transportation - Federal Aviation Administration.

FAA. (2017). Scanning for Other Aircraft. In FAA, Aeronautical Information Manual (pp. 8-1-7). Washington DC: Department of Transportation.

FAA. (2017). Section 5. Surveillance Systems. In FAA, Aeronautical Information Manual (pp. 4-5-1 - 4-5-21). Washington DC: FAA. Retrieved from FAA.

FAA. (2020). Night Operations - Aircraft Lighting and Equipment. In FAA, FAA Airplane Flying Handbook (pp. 10-5). Washington DC: US Department of Tranportation.

Federal Aviation Administration. (2016). Pilots' Role in Collision Avoidance. Advisory Circular 90-48D.

Francis, R., Vincent, R., Noel, J.-M., Tremblay, P., Desjardins, D., Cushley, A., & Wallace, M. (2011). The Flying Laboratory for the Observation of ADS-B Signals. International Journal of Navigation and Observation, 1-5.

Garmin Aviation. (2021). Garmin Aviation - ADS-B academy. Retrieved from Garmin: https://www.garmin.com/en-AU/aviation/adsb-FAQ/

Gibb, R., Gray, R., & Scharff, L. (2010). Aviation Visual Perception. Surrey: Ashgate Publishing Limited.

Hestnes, I. (2011, March). Visual system tutorial - Flightdeck737. Retrieved from ivarhestnes.com: https://www.google.com/url?sa=t&rct=j&q=&esrc=s&source=web&cd=&cad=rja&…

Hobbs, A. (2004). Limitiations of the See-and-Avoid Principle. Canberra: Australian Transport Safety Bureau.

Morris, C. (2005). Midair collisions: Limitations of the see-and-avoid concept in civil aviation. Aviation Space and Environmental Medicine, 357-365.

NTSB. (1988). AIRCRAFT ACCIDENT REPORT - Midair Collision of Skywest airlines Swearingen Metro II, N163SW, and Mooney M20, N6485U, Kearns, Utah, January 15, 1987. Washington DC: NTSB.

O’Callaghan, J. (2020). Aircraft Performance & Cockpit Visibility Study. Washington DC: NTSB.

OzRunways. (2022, 4 25). SkyEcho Portable VFR ADS-B IN and OUT. Retrieved from OzRunways

uAvionics. (2022, 4 25). SkyEcho Electronic Conspicuity - Tech Specs. Retrieved from uAvionics: https://uavionix.com/products/skyecho/#specs

US DOE. (2022, March 25). LED Lighting. Retrieved from United States Department of Energy - Energy Saver: https://www.energy.gov/energysaver/led-lighting

Sources and submissions

Sources of Information

The sources of information during the investigation included:

  • ATSB investigation AO-2020-012
  • ATSB investigation report AO-2020-051
  • ATSB investigation report 200201846
  • United States National Transportation Safety Board
  • Civil Aviation Safety Authority
  • Airservices Australia
  • United States Federal Aviation Administration
  • United States Department of Energy
  • operators of VH-AEM and VH-JQF
  • manufacturers of VH-AEM and VH-JQF
  • aircraft and maintenance documentation from VH-AEM and VH-JQF
  • operators of VH-NLO and VH-IJM
  • RTCA (formerly Radio Technical Commission for Aeronautics)
  • Recorded Raw and filtered ADS-B data as provided by Airservices Australia
  • Bureau of Meteorology
  • National Oceanic and Atmospheric Administration of the United States
  • Microsoft Flight Simulator X and supporting documentation
  • FS Recorder and supporting documentation

Submissions

Under section 26 of the Transport Safety Investigation Act 2003, the ATSB may provide a draft report, on a confidential basis, to any person whom the ATSB considers appropriate. That section allows a person receiving a draft report to make submissions to the ATSB about the draft report.

A draft of this report was provided to the following parties:

  • Airservices Australia
  • Civil Aviation Safety Authority
  • United States National Transportation Safety Board

Submissions were received from

  • Airservices Australia
  • Civil Aviation Safety Authority
  • United States National Transportation Safety Board

The submissions were reviewed and, where considered appropriate, the text of the report was amended accordingly.

Attachment A

Attachment A - Extremities of pilot’s eye position

This attachment contains imagery showing the cockpit views for the extremities of each pilot’s eye position as developed for the Refining the pilot’s eye position section. The images show the right, left, upper, lower, forward, and rearward extremities considered when refining the eye position

      -    Figures 1 to 6 show the extremities for AEM’s left seat pilot
      -    Figures 7 to 12 show the extremities for AEM’s right seat pilot
      -    Figures 13 to 18 show the extremities for JQF’s left seat pilot
      -    Figures 19 to 24 show the extremities for JQF’s right seat pilot

All images developed by the ATSB.

Figure 1 AEM left seat pilot - right extremity
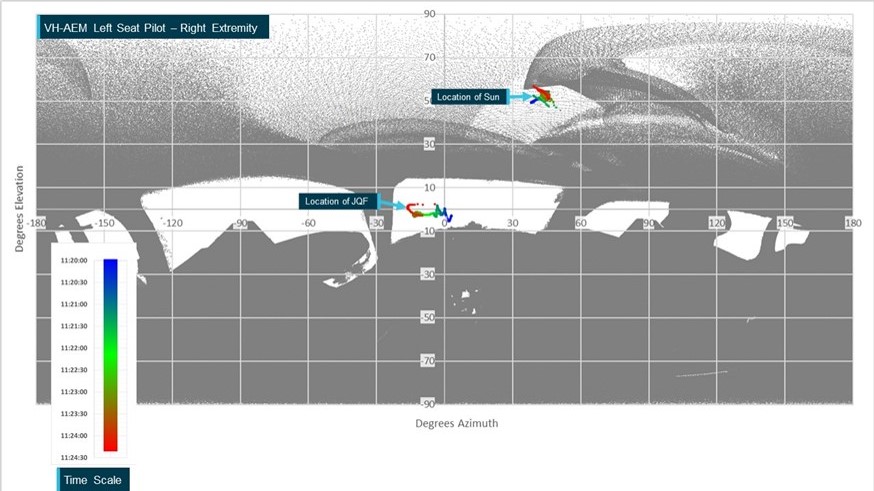
picture1-aa.jpg

Figure 2 AEM left seat pilot - left extremity
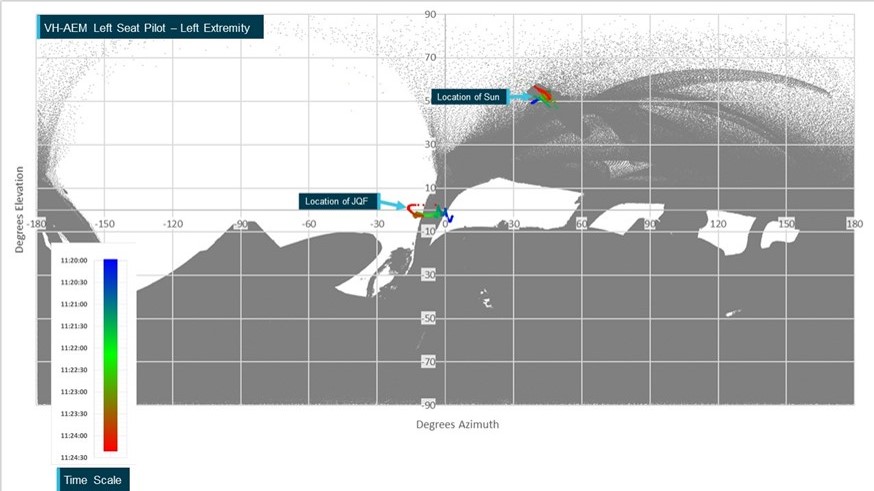
picture2-aa.jpg

Figure 3 AEM left seat pilot - upper extremity
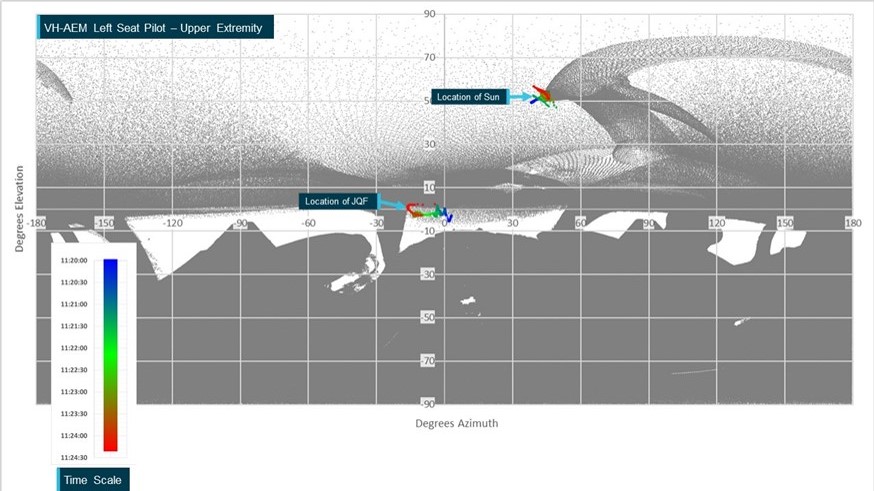
picture3-aa.jpg

Figure 4 AEM left seat pilot - lower extremity
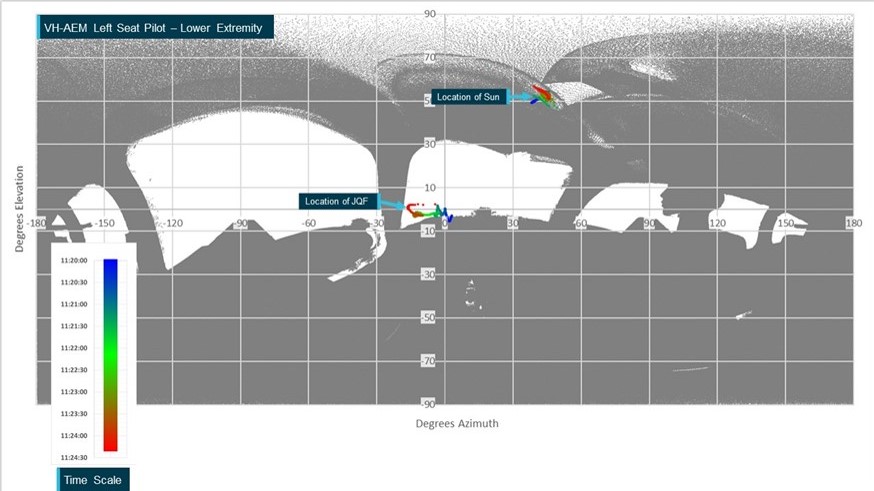
picture4-aa.jpg

Figure 5 AEM left seat pilot - forward extremity
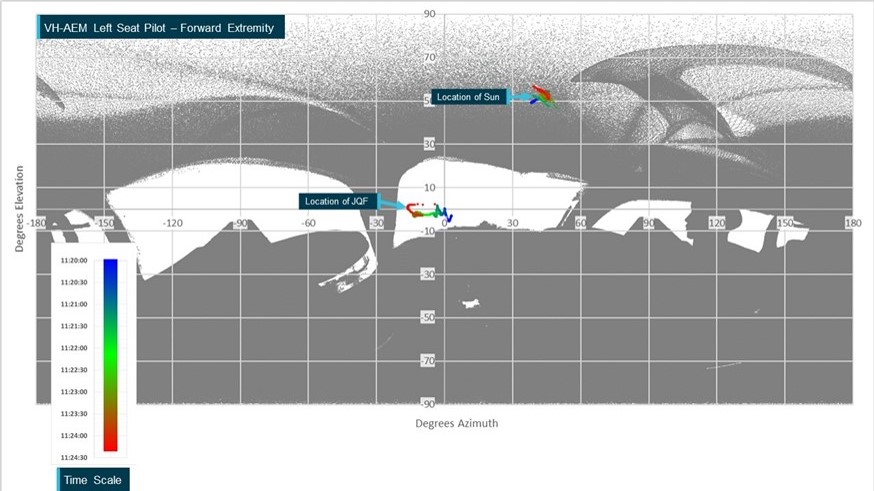
picture5-aa.jpg

Figure 6 AEM left seat pilot - rearward extremity
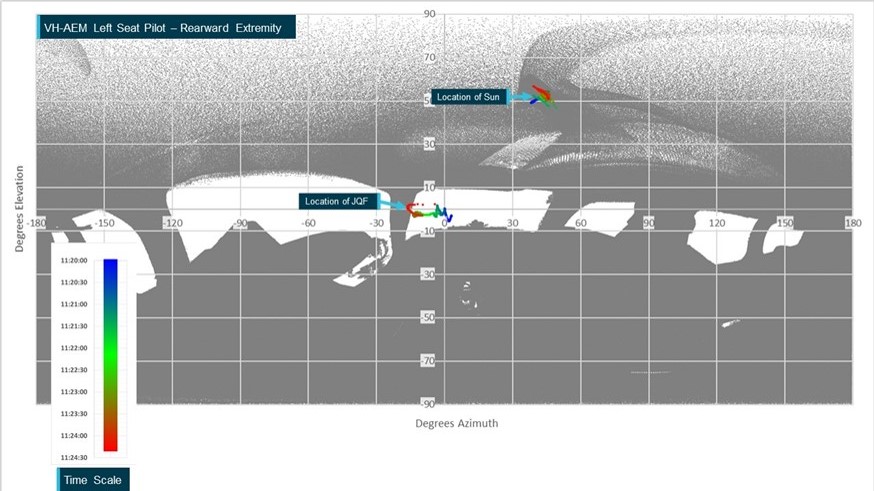
picture6-aa.jpg

Figure 7 AEM right seat pilot - right extremity
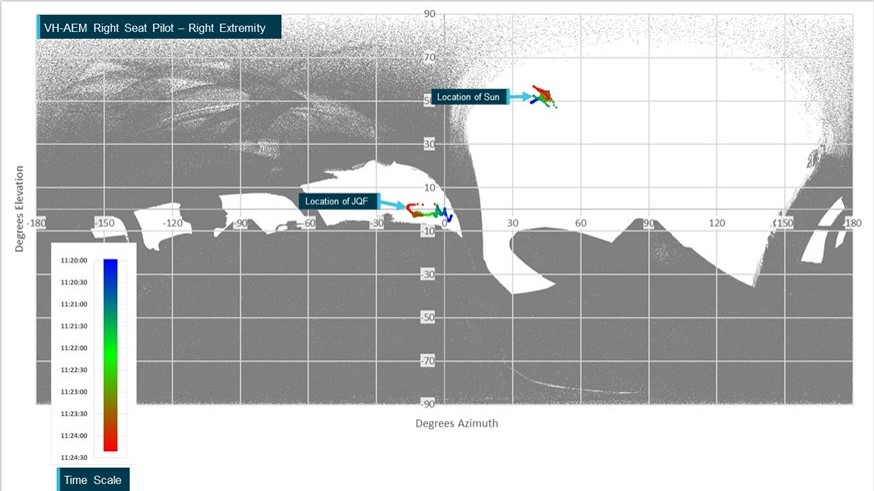
picture7-aa.jpg

Figure 8 AEM right seat pilot - left extremity
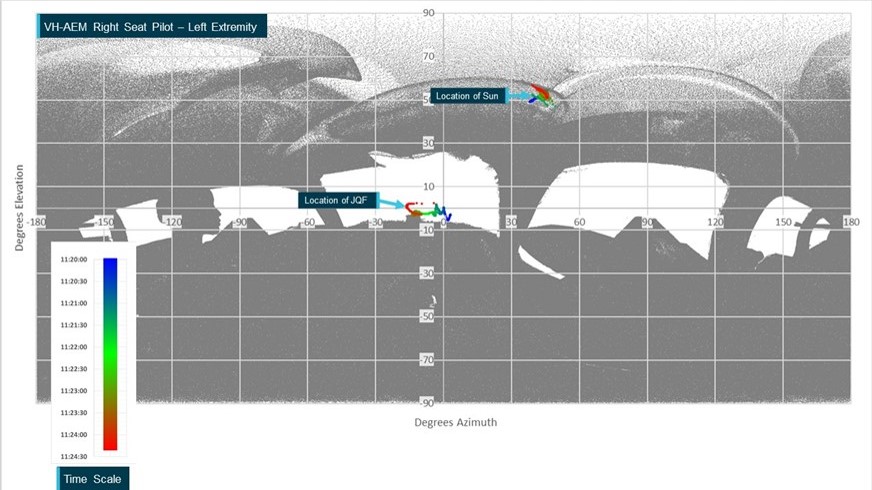
picture8-aa.jpg

Figure 9 AEM right seat pilot - upper extremity
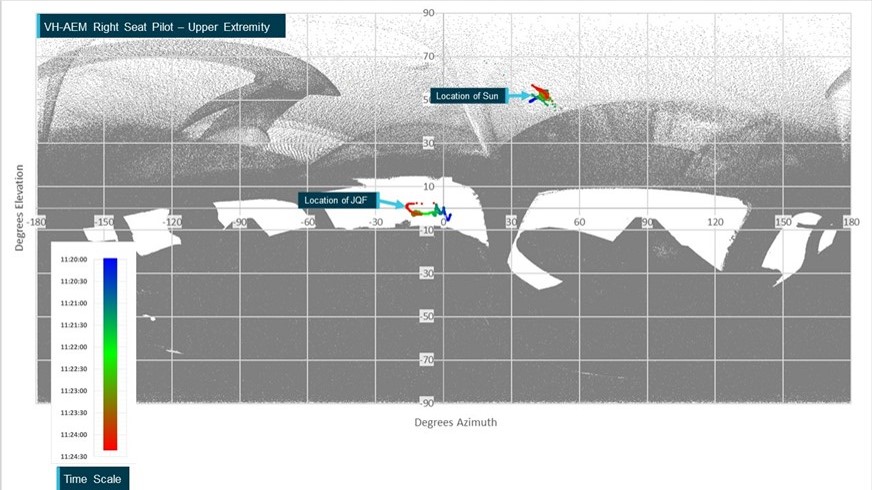
picture9-aa.jpg

Figure 10 AEM right seat pilot - lower extremity
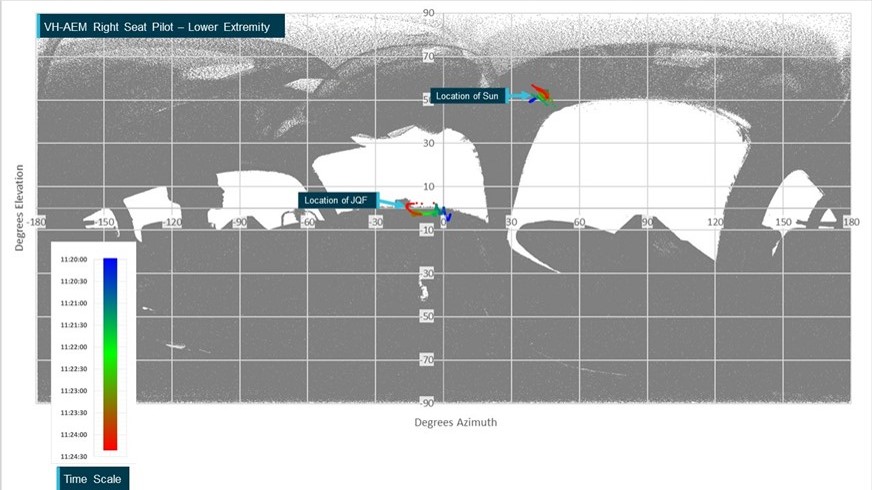
picture10-aa.jpg

Figure 11 AEM right seat pilot - forward extremity
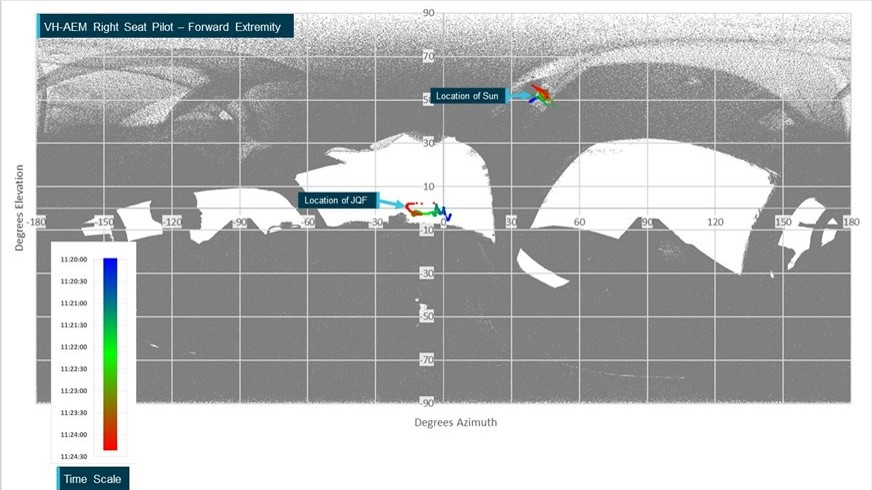
picture11-aa.jpg

Figure 12 AEM right seat pilot - rearward extremity
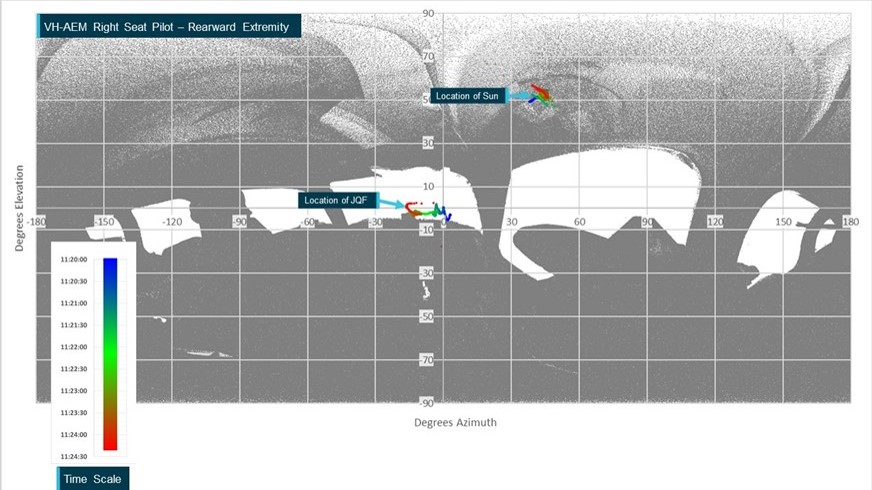
picture12-aa.jpg

Figure 13 JQF left seat pilot - right extremity
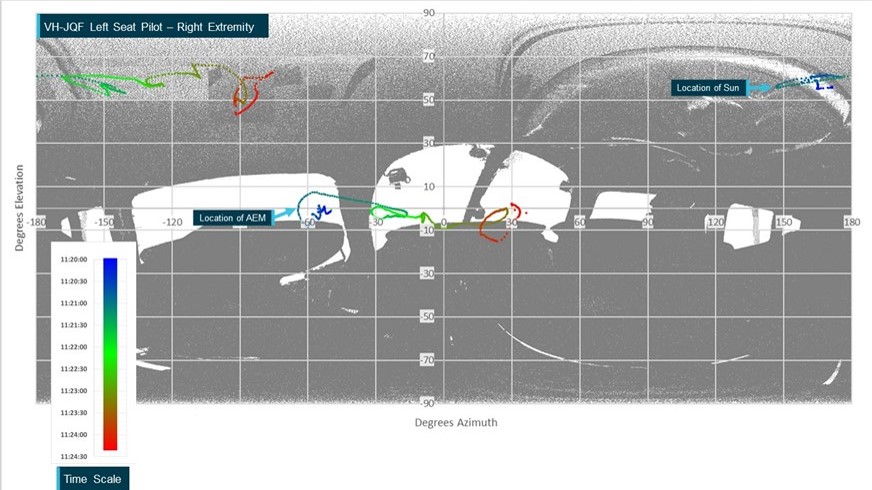
picture13-aa.jpg

Figure 14 JQF left seat pilot - left extremity
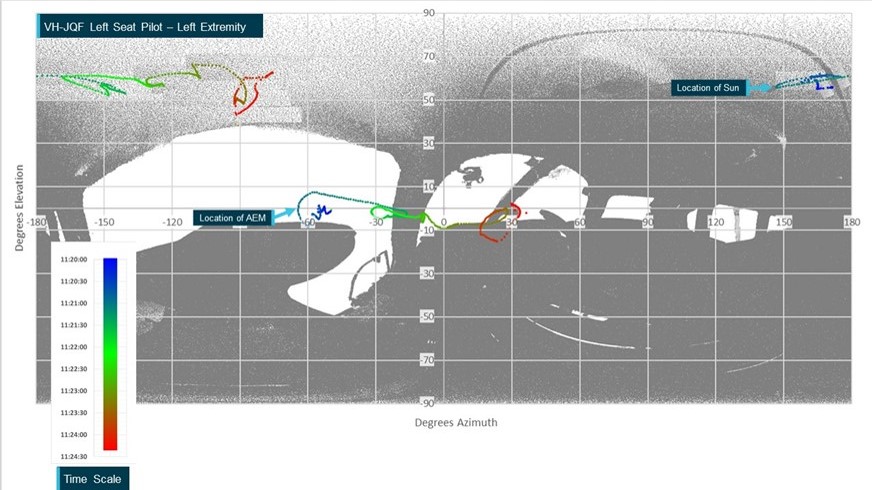
picture14-aa.jpg

Figure 15 JQF left seat pilot - upper extremity
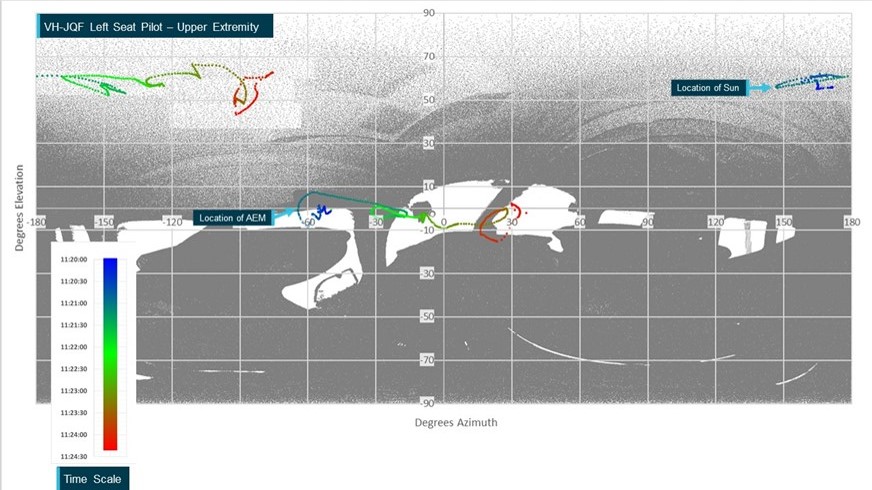
picture15-aa.jpg

Figure 16 JQF left seat pilot - lower extremity
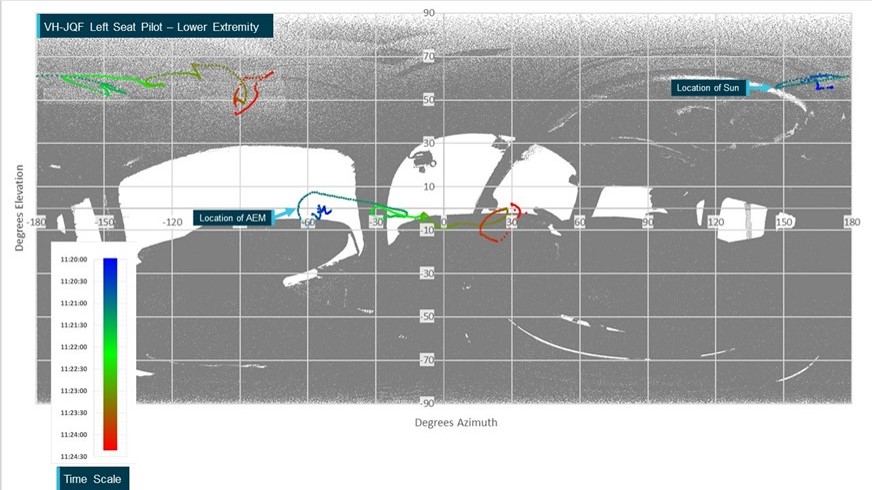
picture16-aa.jpg

Figure 17 JQF left seat pilot - forward extremity
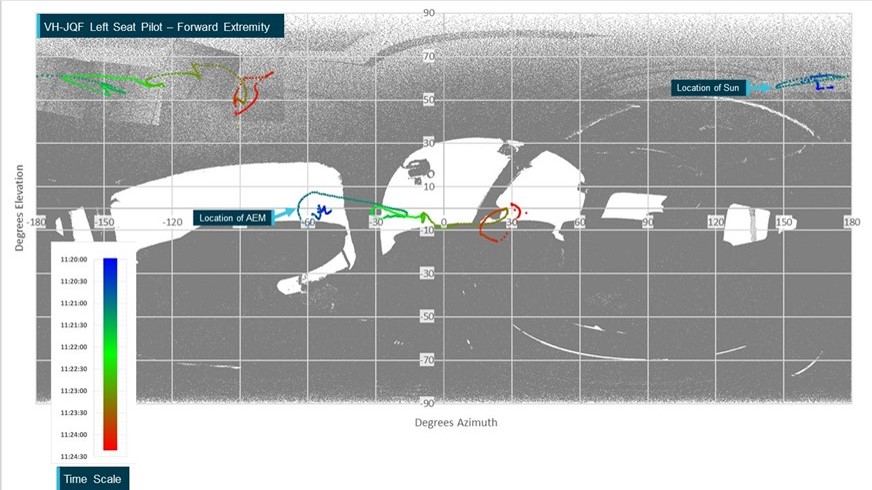
picture17-aa.jpg

Figure 18 JQF left seat pilot - rearward extremity
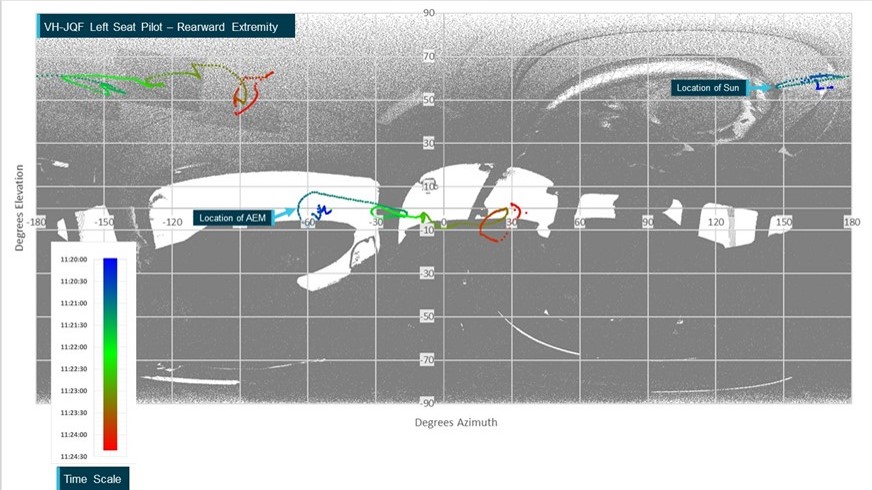
picture18-aa.jpg

Figure 19 JQF right seat pilot - right extremity
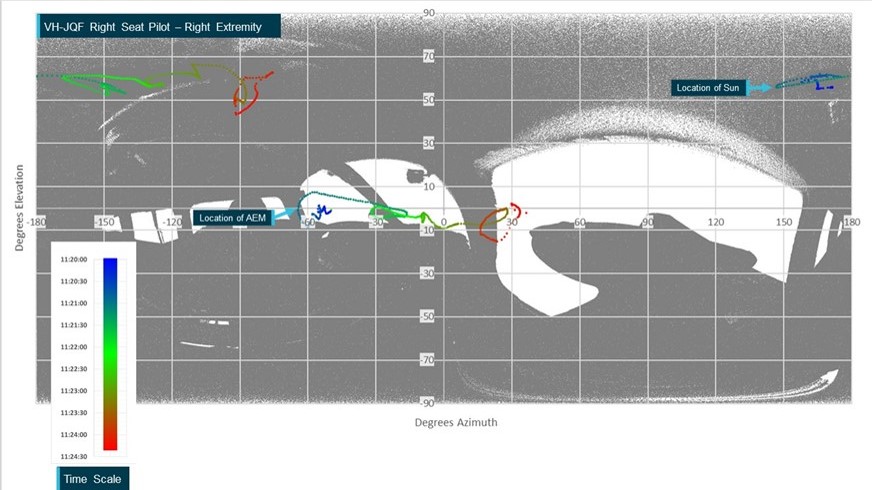
picture19-aa.jpg

Figure 20 JQF right seat pilot - left extremity
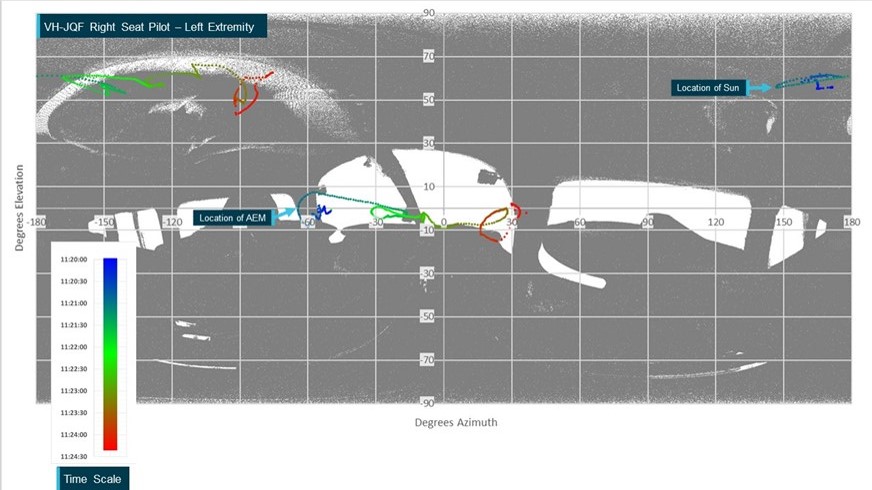
picture20-aa.jpg

Figure 21 JQF right seat pilot – upper extremity
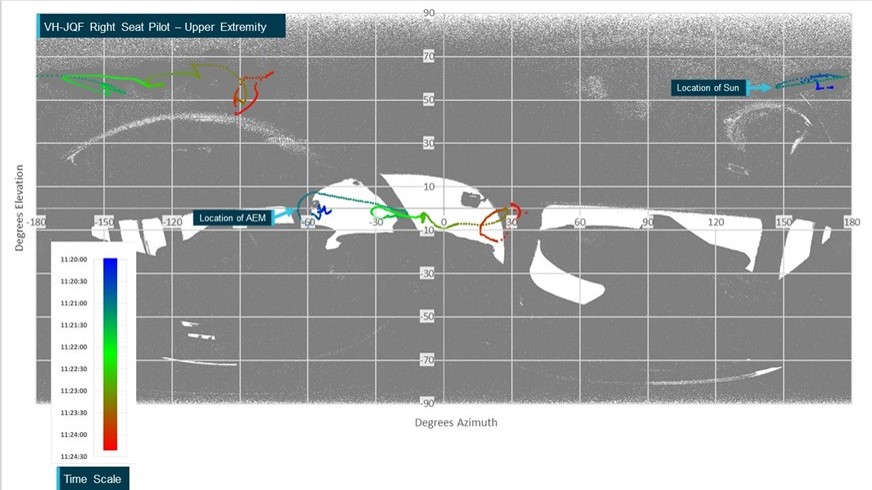
picture21-aa.jpg

Figure 22 JQF right seat pilot - lower extremity
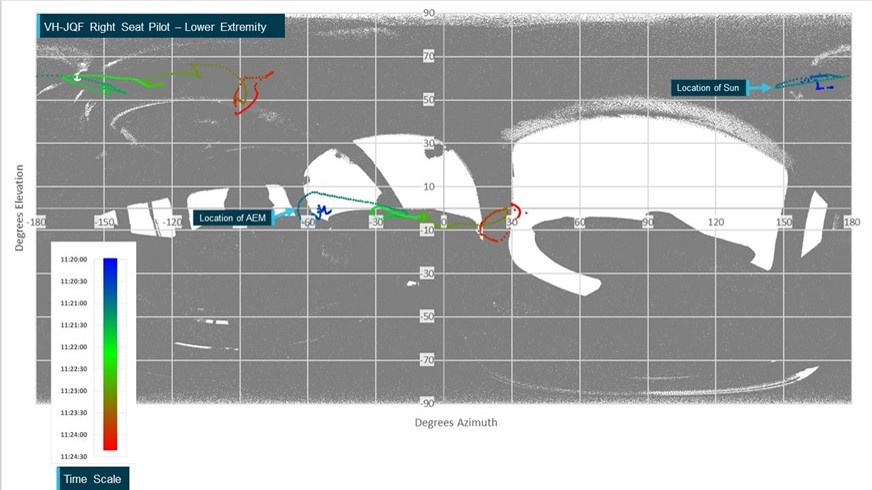
picture22-aa.jpg

Figure 23 JQF right seat pilot - forward extremity
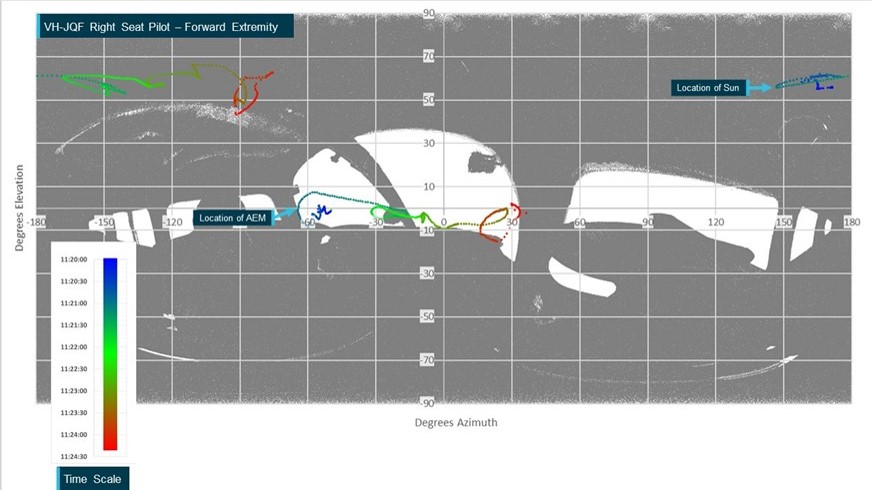
picture23-aa.jpg

Figure 24 JQF right seat pilot - rearward extremity
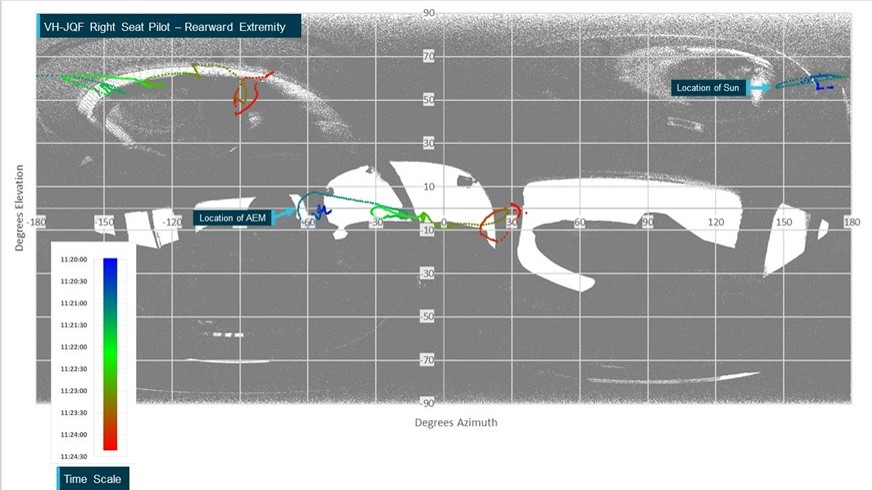
picture24-aa.jpg


Attachment B

This attachment contains imagery that is the equivalent of figures 121 – 148 of the report with the simulated weather conditions altered to show a ‘sky clear’ day. As per the images in the report they show the main view from each pilot’s eye position at key moments in the sequence, including the CDTI displays and cockpit masks of the areas that would have been shielded.

  • Images A through N show the view from AEM 42, 30, 24, 13, 10, 5 and 1 second before the collision.
  • Images O through AB show the view from JQF 42, 32, 26, 13, 10, 5 and 1 second before the collision.

These images were used for a comparison with those in the report considering the visibility of the target aircraft but also as confirmation of the location of the aircraft against topography or the sky for aircraft contrast considerations.

Image A: View from AEM left seat pilot (LSP) when JQF transitions to proximal traffic on CDTI display
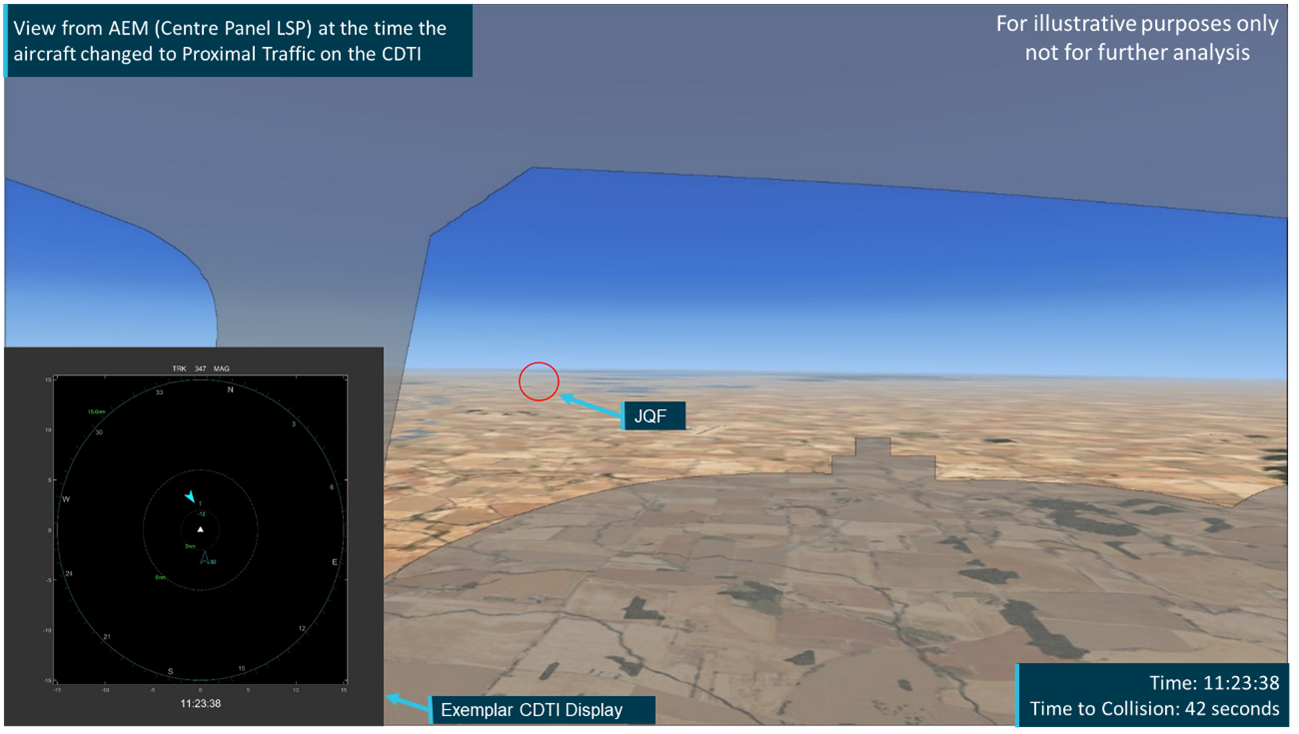
ab-001.png

Source: ATSB

Image B: View from AEM right seat pilot (RSP) when JQF transitions to Proximal Traffic on CDTI display
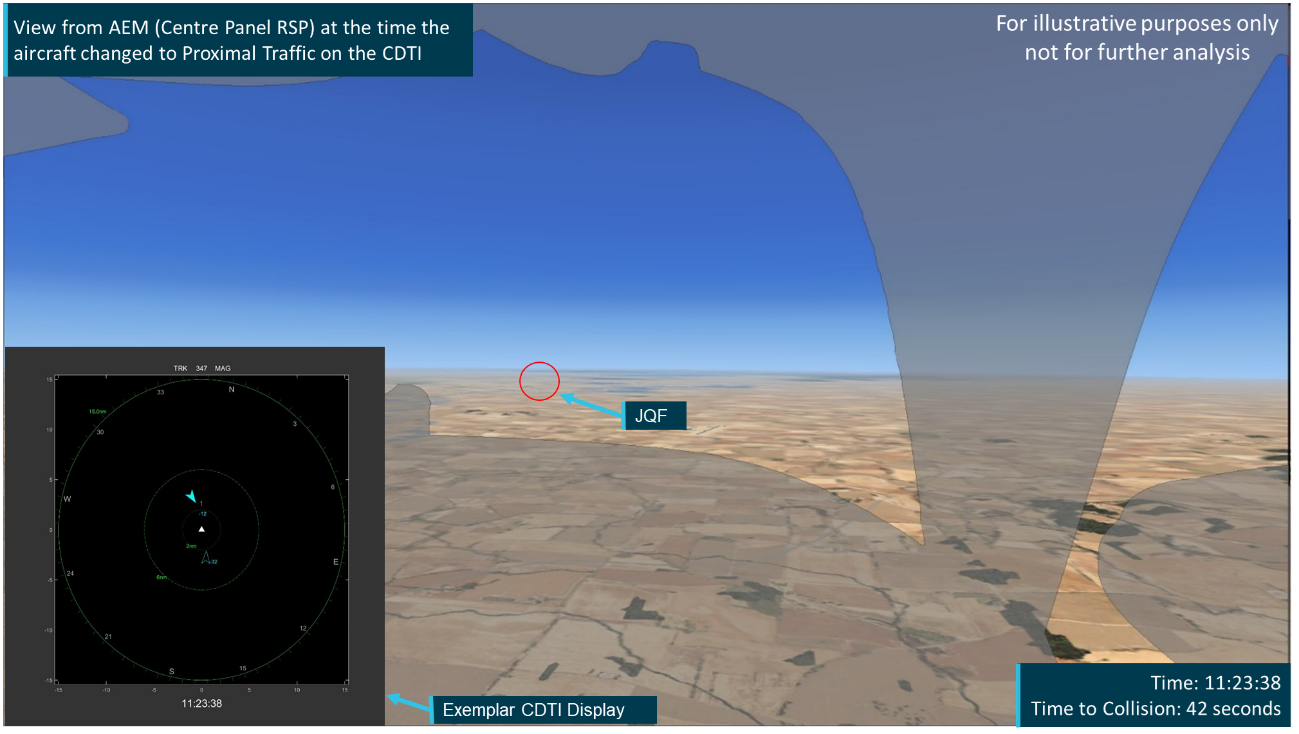
ab-002.png

Source: ATSB

Image C: View from AEM LSP when JQF triggered PAZ breach and ATAS alert
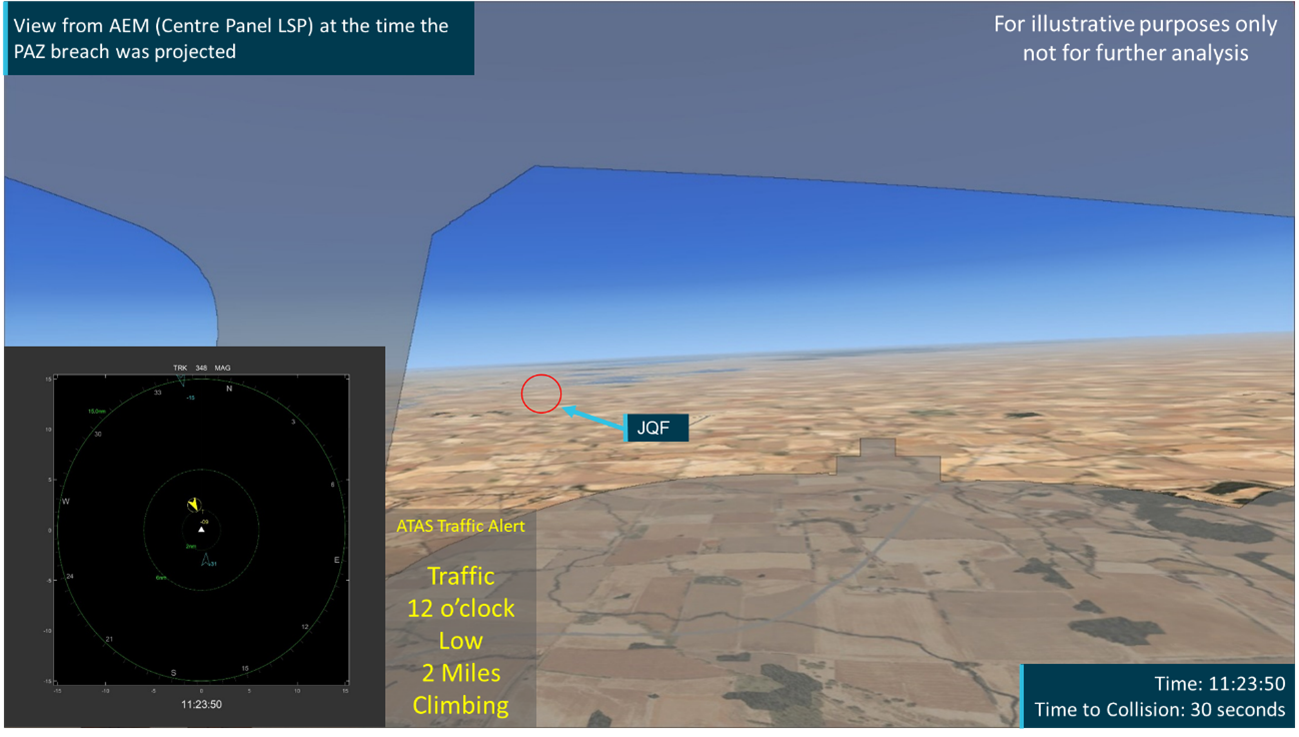
ab-003.png

Source: ATSB

Image D: View from AEM RSP when JQF triggered PAZ breach and ATAS alert
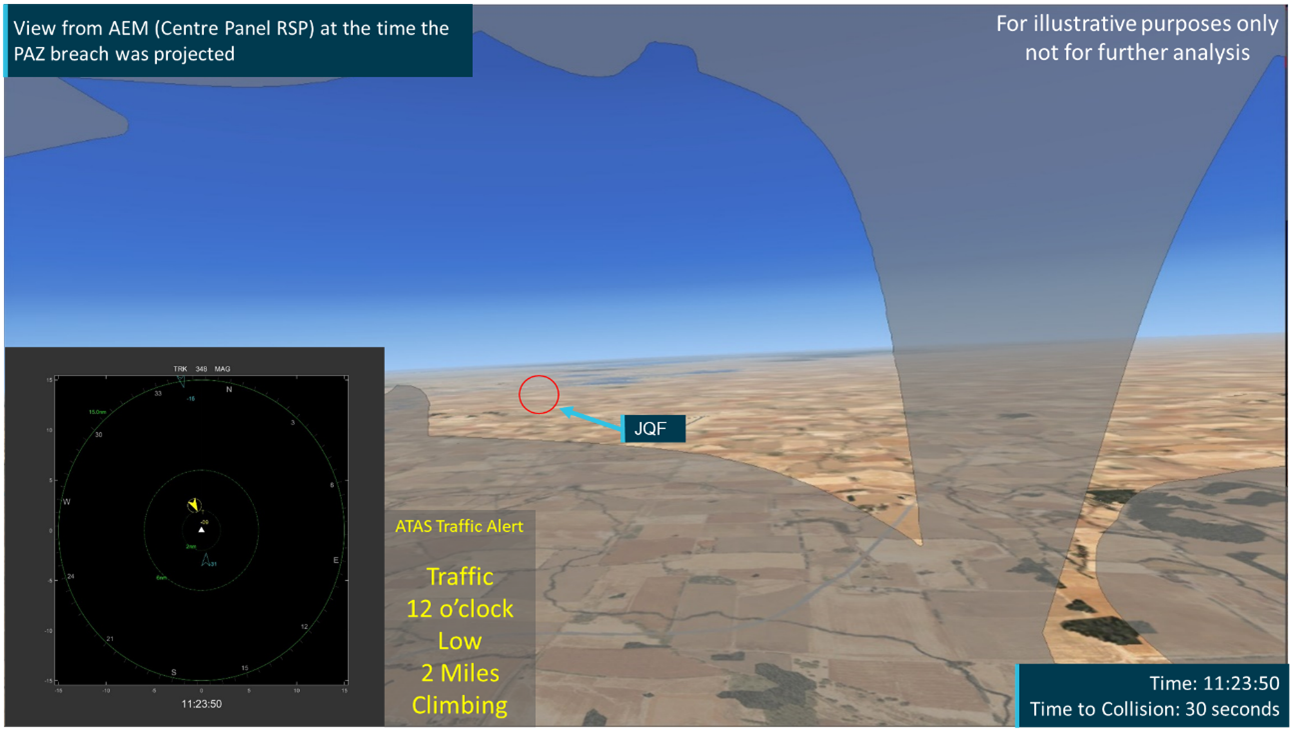
ab-004.png

Source: ATSB

Image E: View from AEM LSP when JQF triggered CAZ breach and ATAS alert
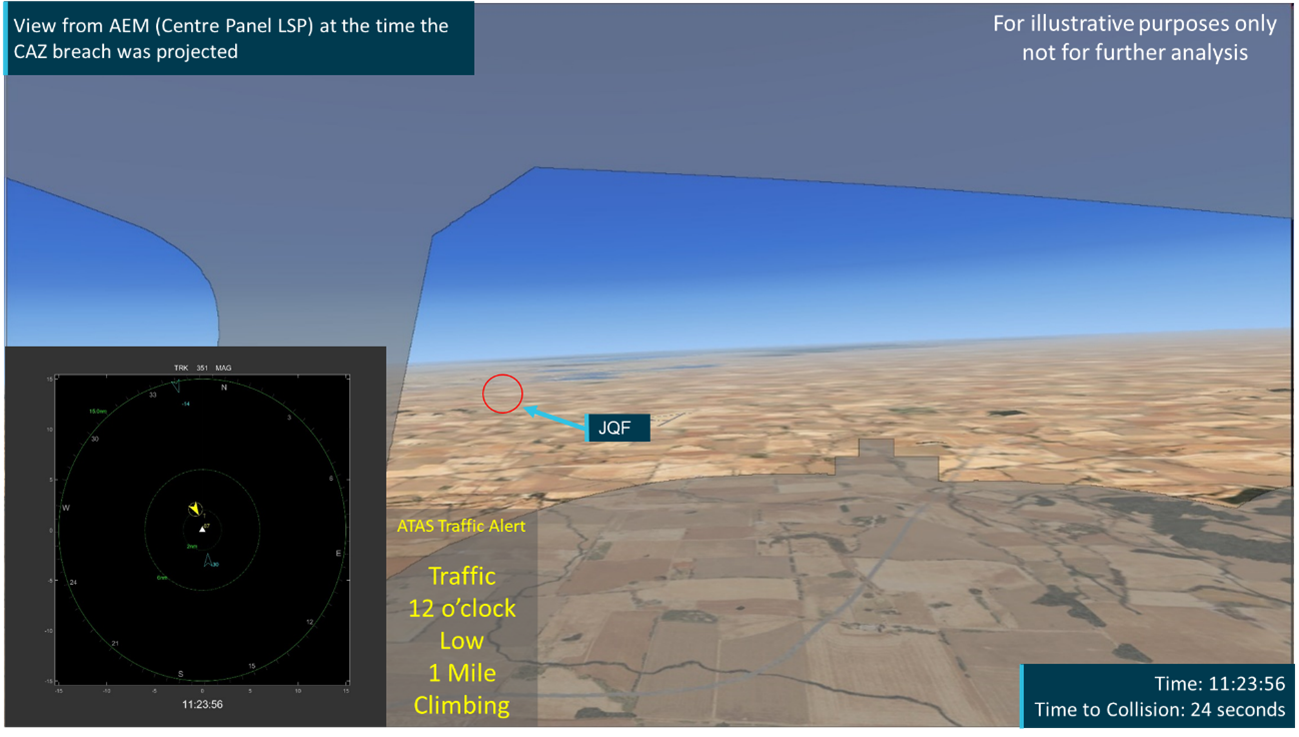
ab-005.png

Source: ATSB

Image F: View from AEM RSP when JQF triggered CAZ breach and ATAS alert
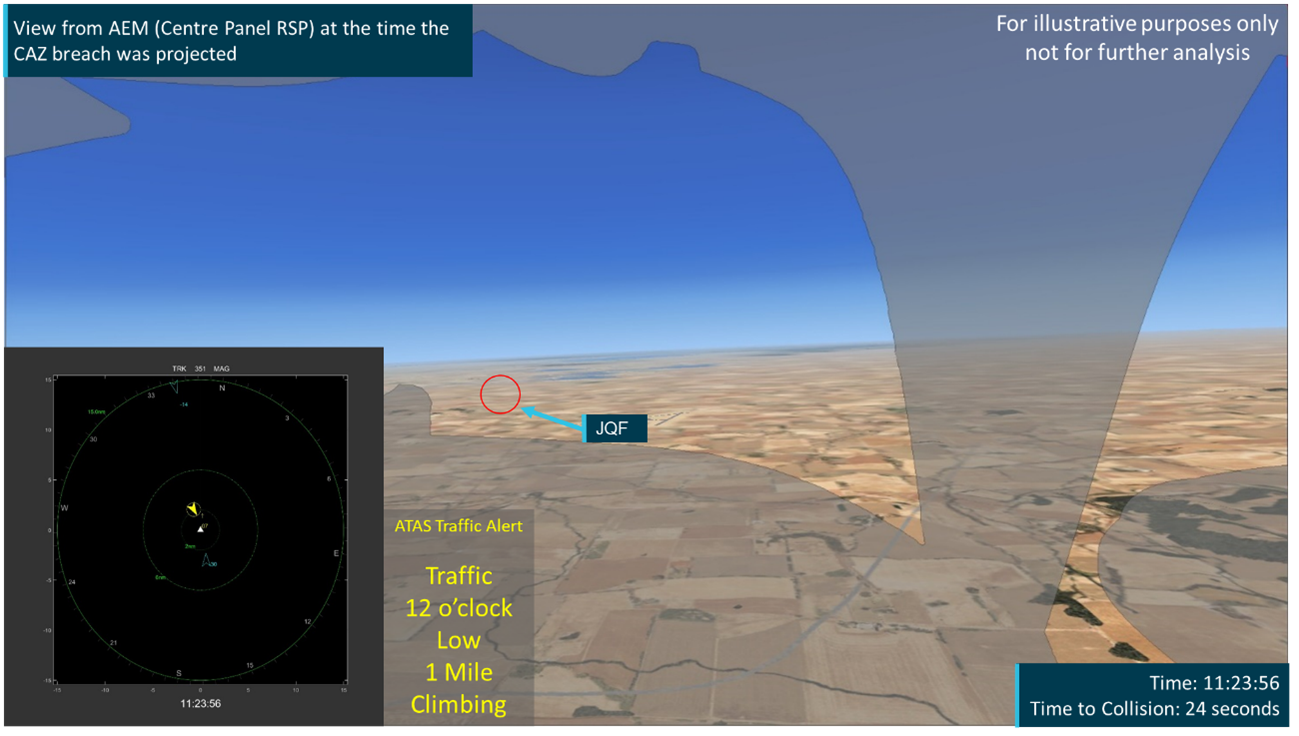
ab-006.png

Source: ATSB

Image G: View from AEM LSP 13 seconds before the collision
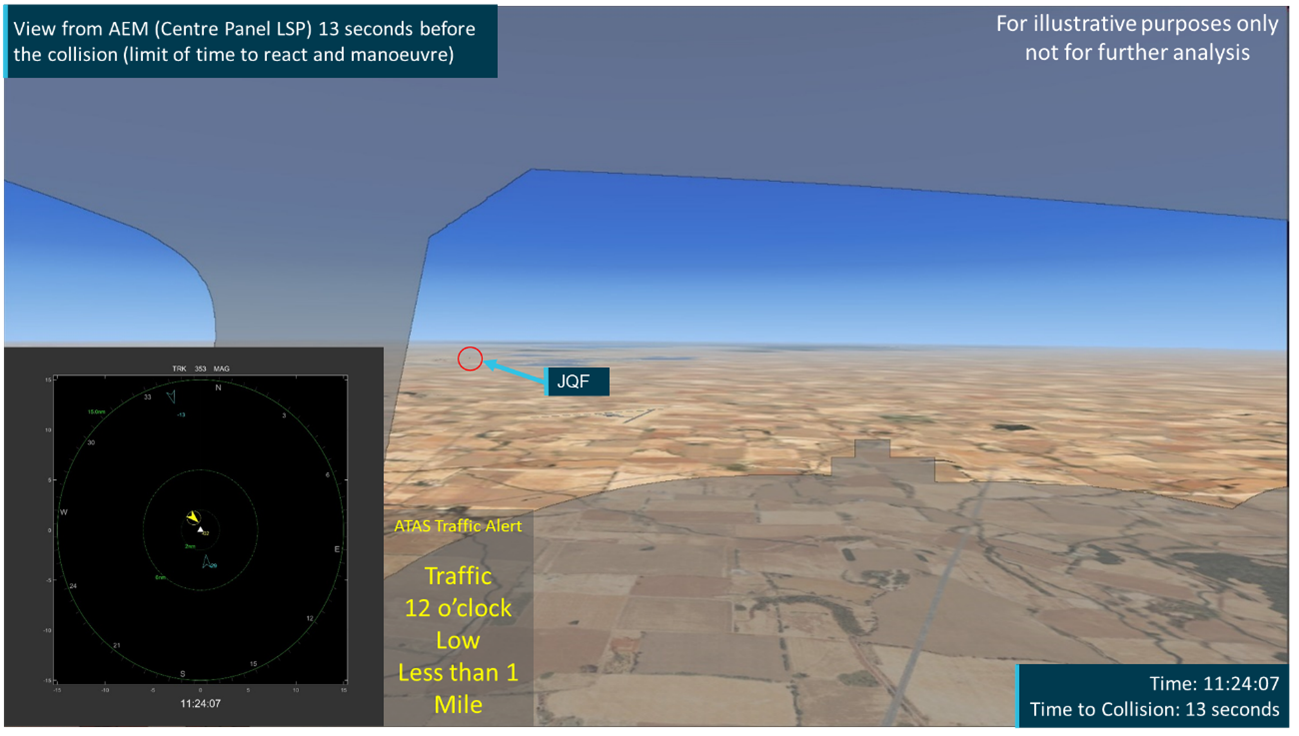
ab-007.png

Source: ATSB

Image H: View from AEM RSP 13 seconds before the collision
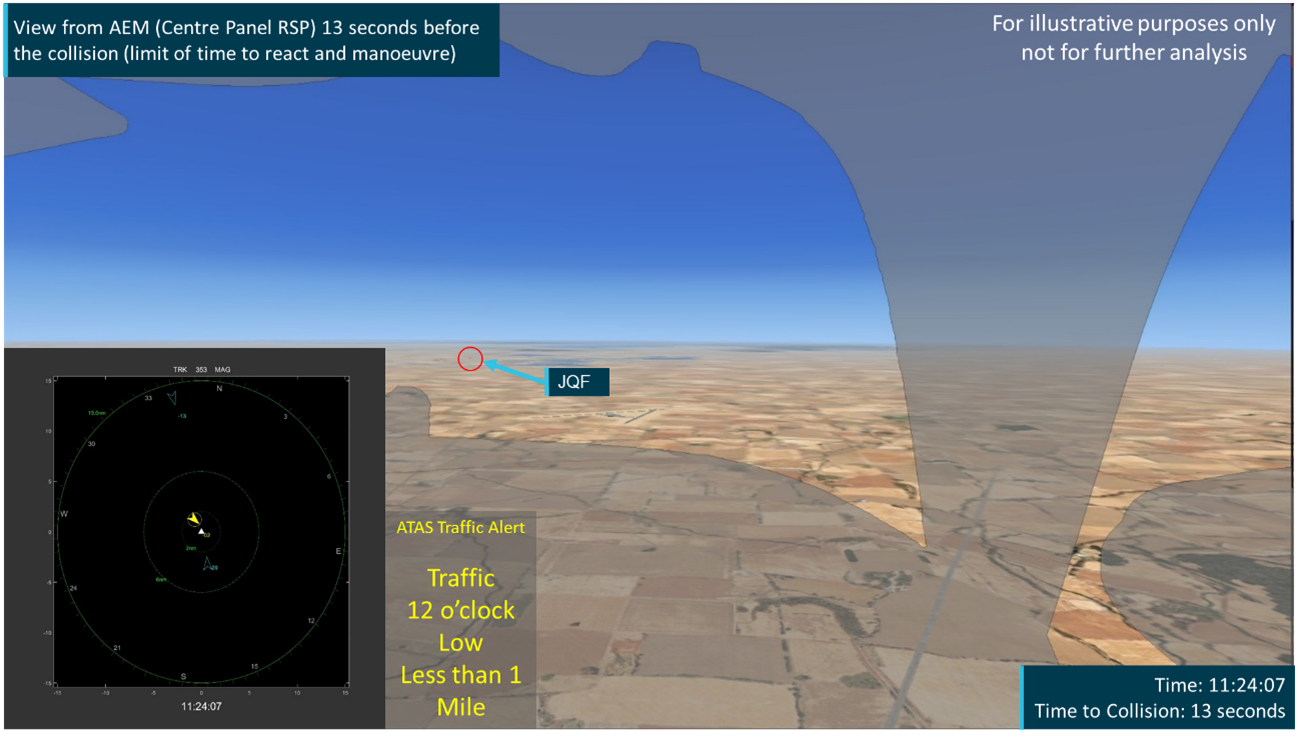
ab-008.png

Source: ATSB

Image I: View from AEM LSP 10 seconds before the collision
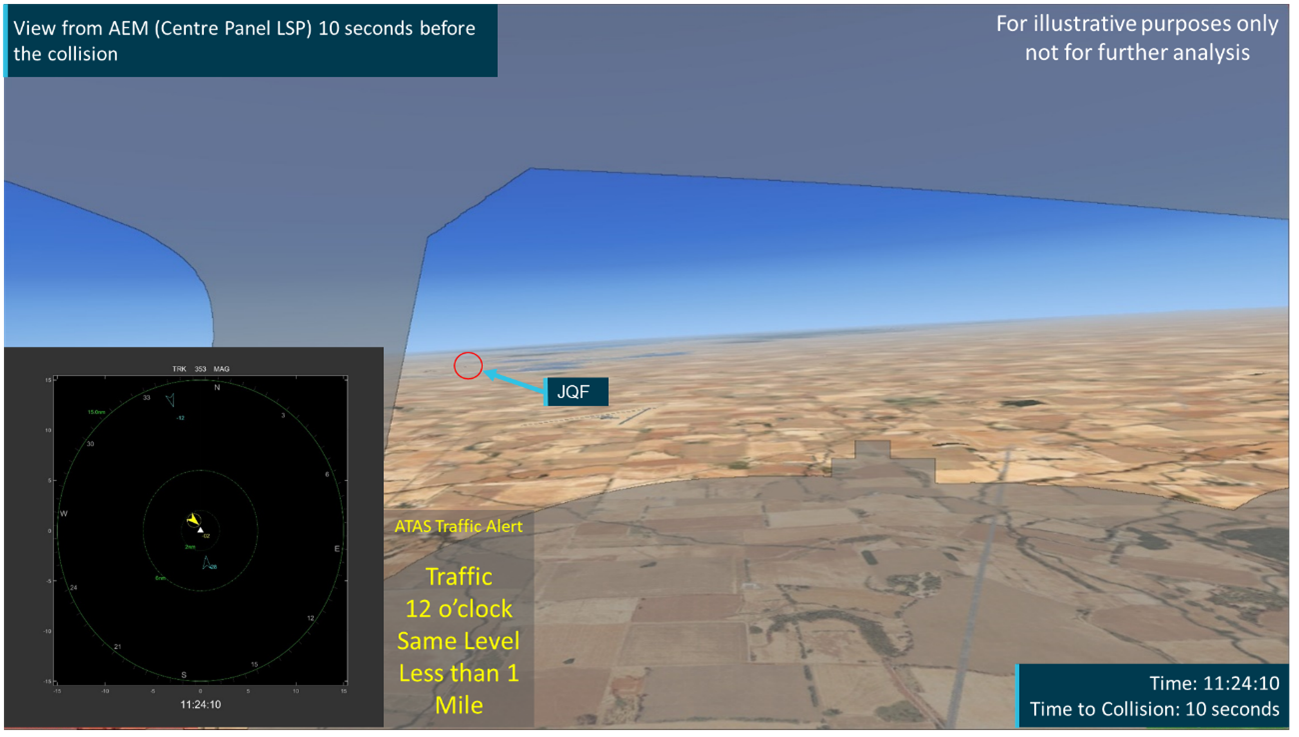
ab-009.png

Source: ATSB

Image J: View from AEM RSP 10 seconds before the collision
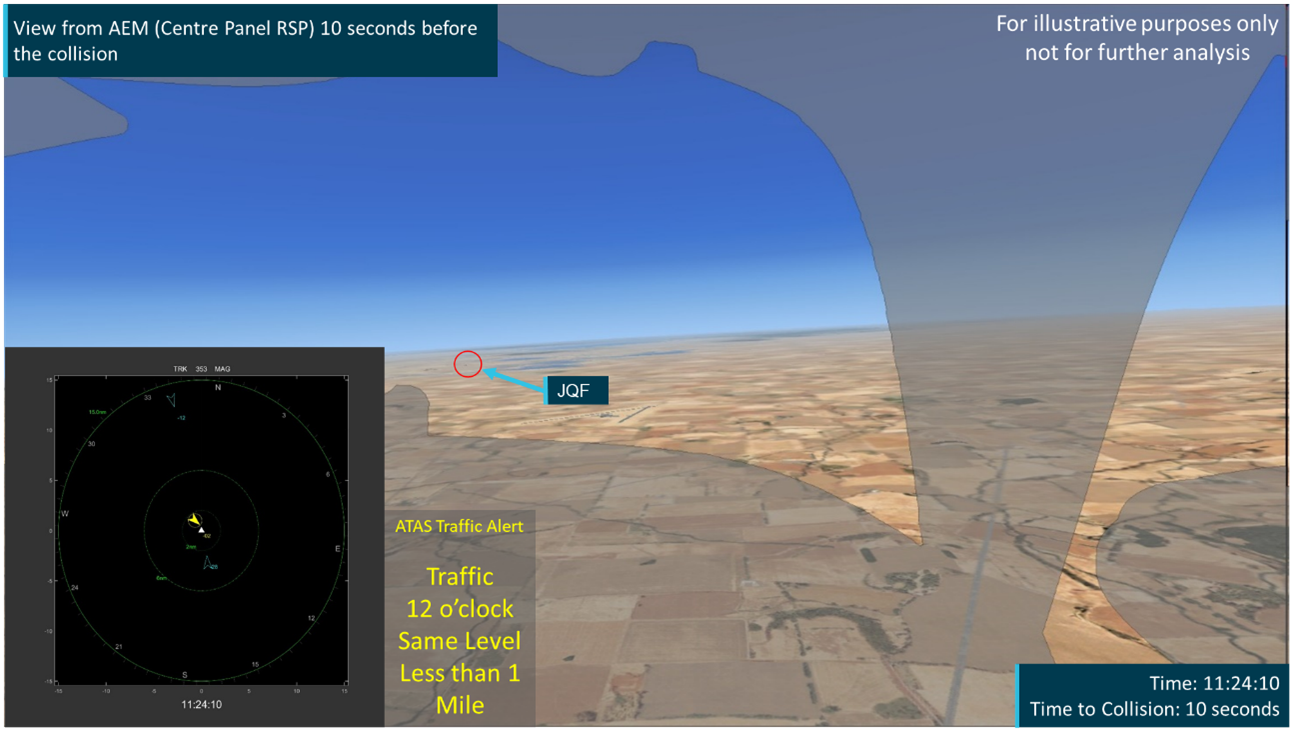
ab-010.png

Source: ATSB

Image K: View from AEM LSP 5 seconds before the collision
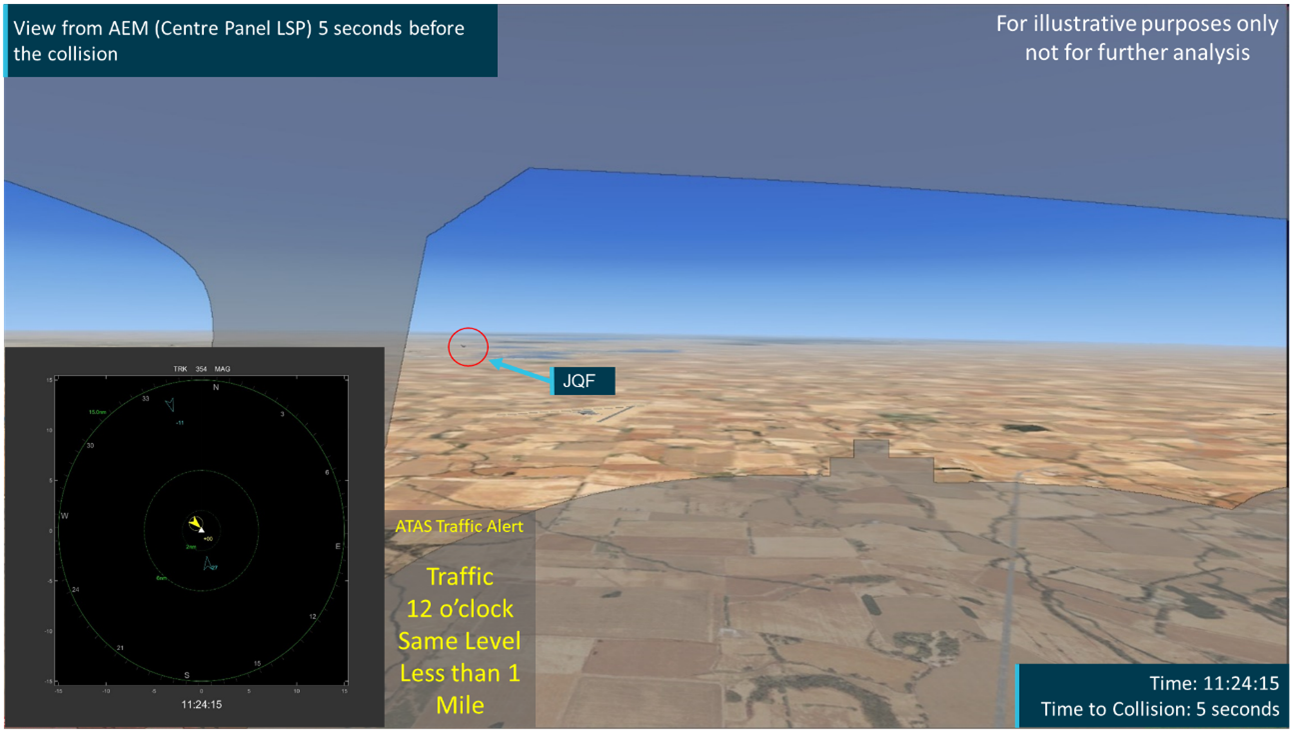
ab-011.png

Source: ATSB

Image L: View from AEM RSP 5 seconds before the collision
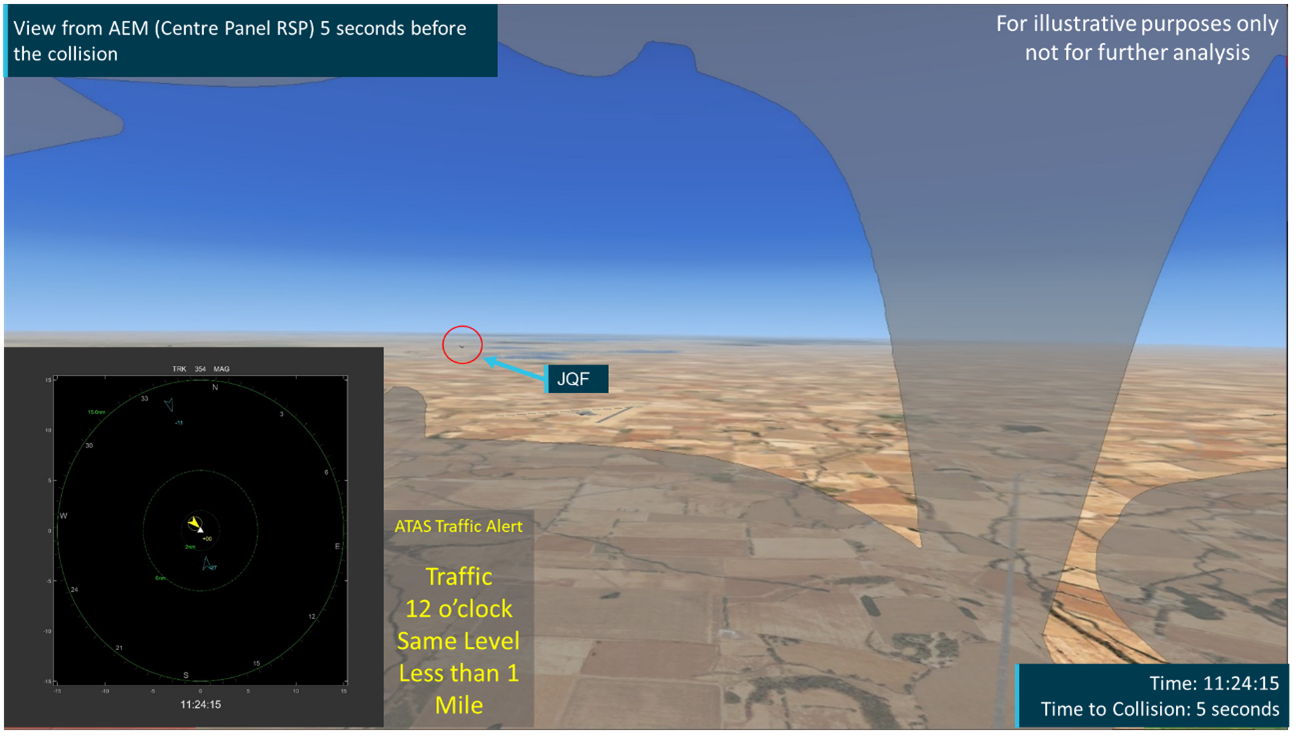
ab-012.png

Source: ATSB

Image M: View from AEM LSP 1 second before the collision
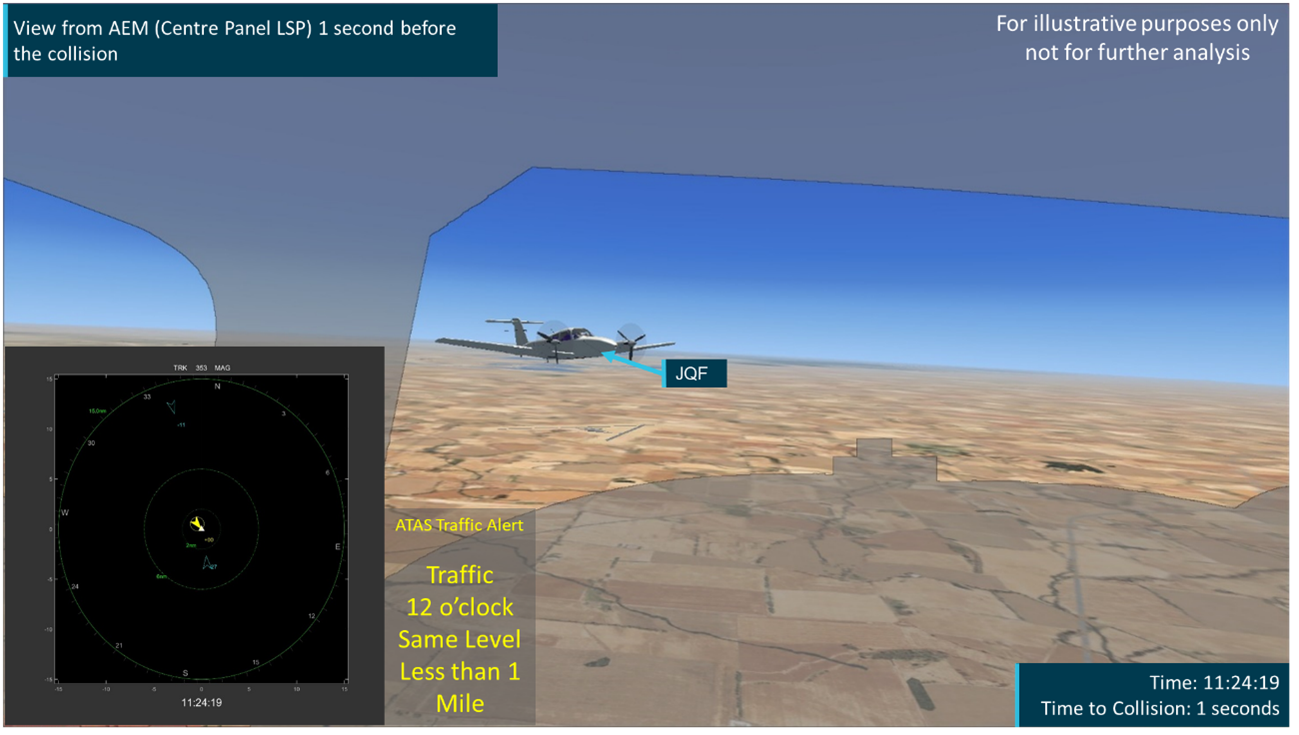
ab-013.png

Source: ATSB

Image N: View from AEM RSP 1 second before the collision
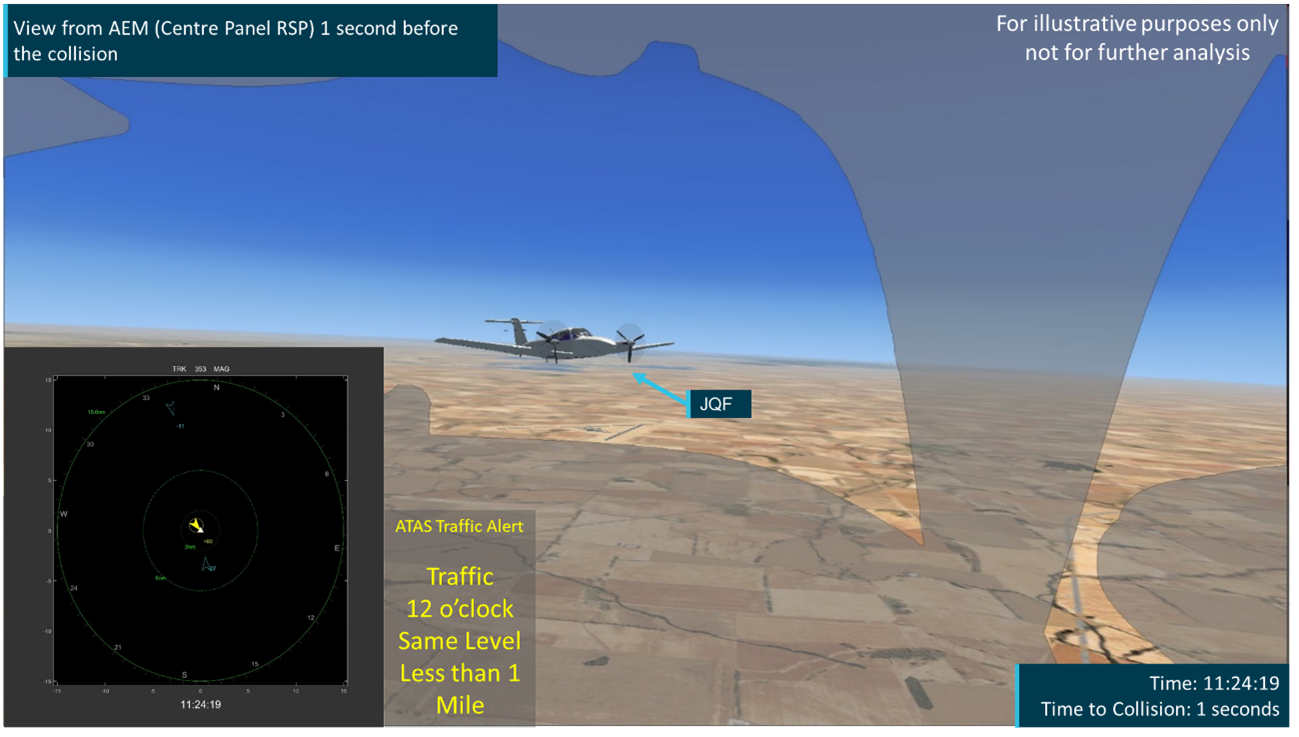
ab-014.png

Source: ATSB

Image O: View from JQF LSP when AEM transitions to Proximal Traffic on CDTI display
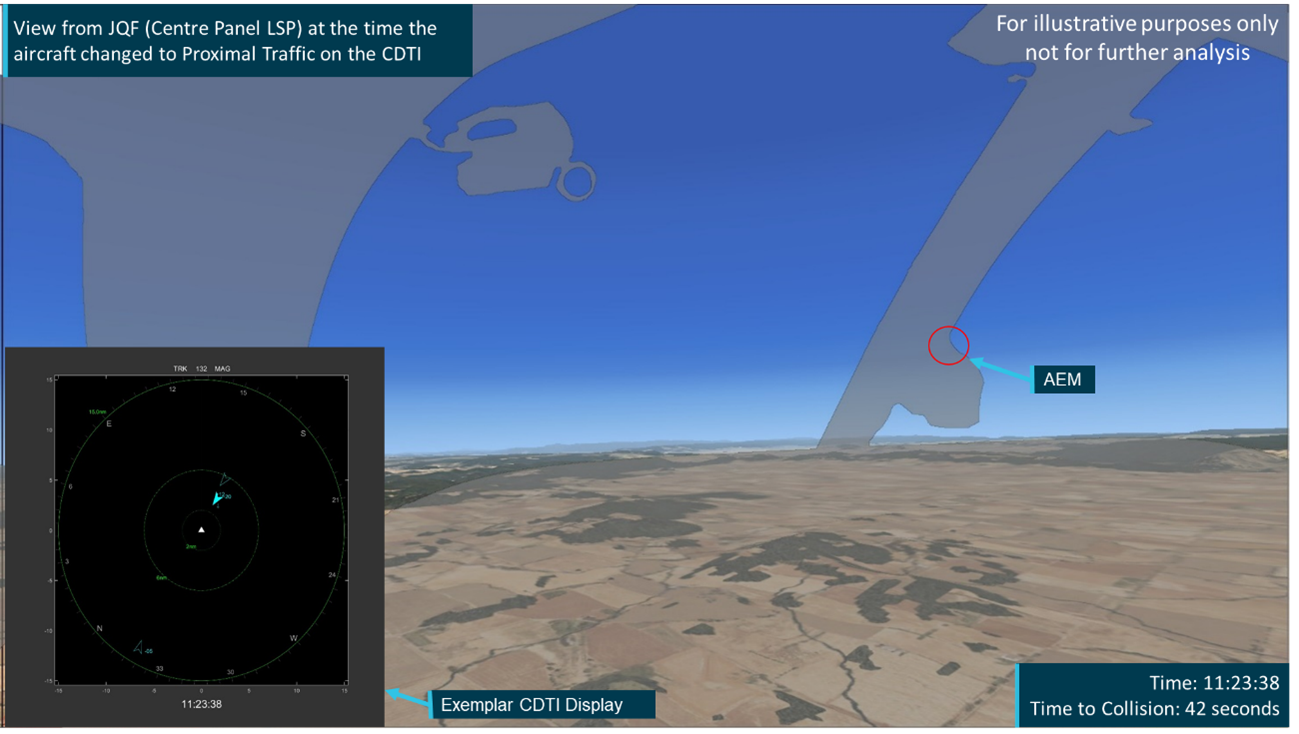
ab-015.png

Source: ATSB

Image P: View from JQF RSP when AEM transitions to Proximal Traffic on CDTI display
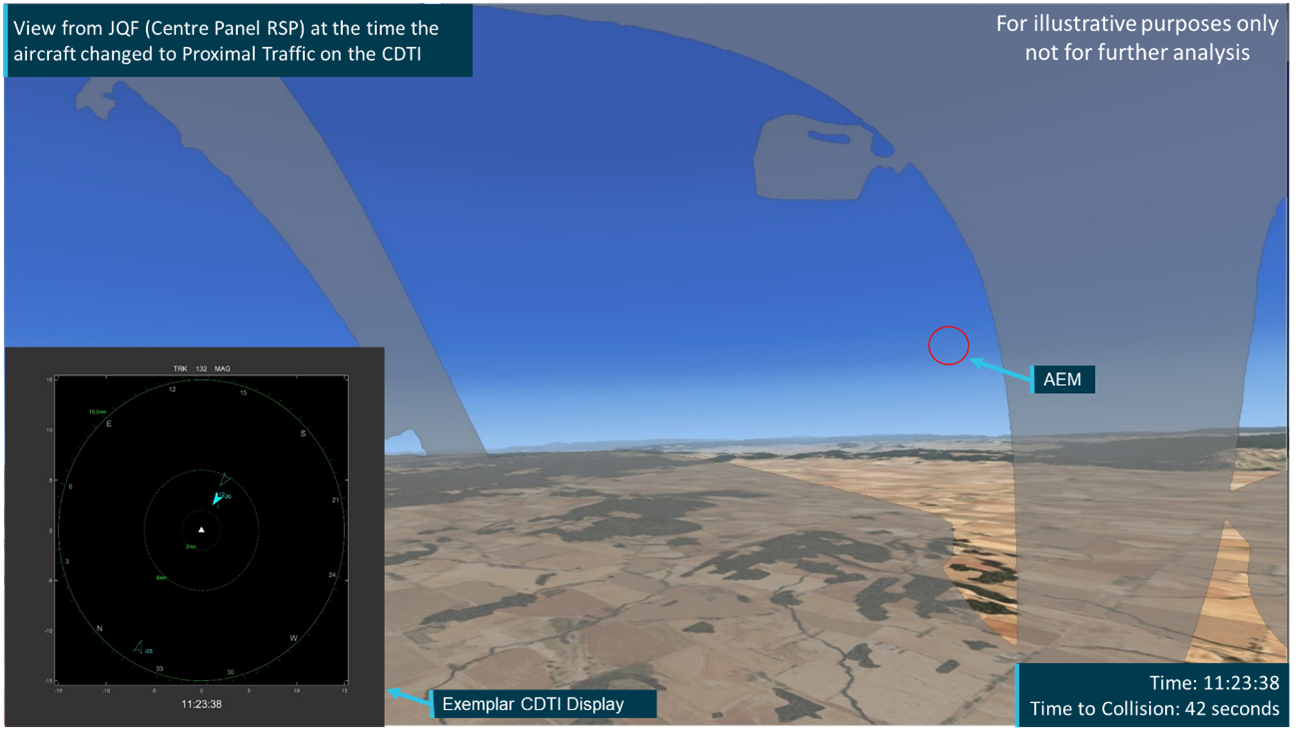
ab-016.png

Source: ATSB

Image P: View from JQF RSP when AEM transitions to Proximal Traffic on CDTI display
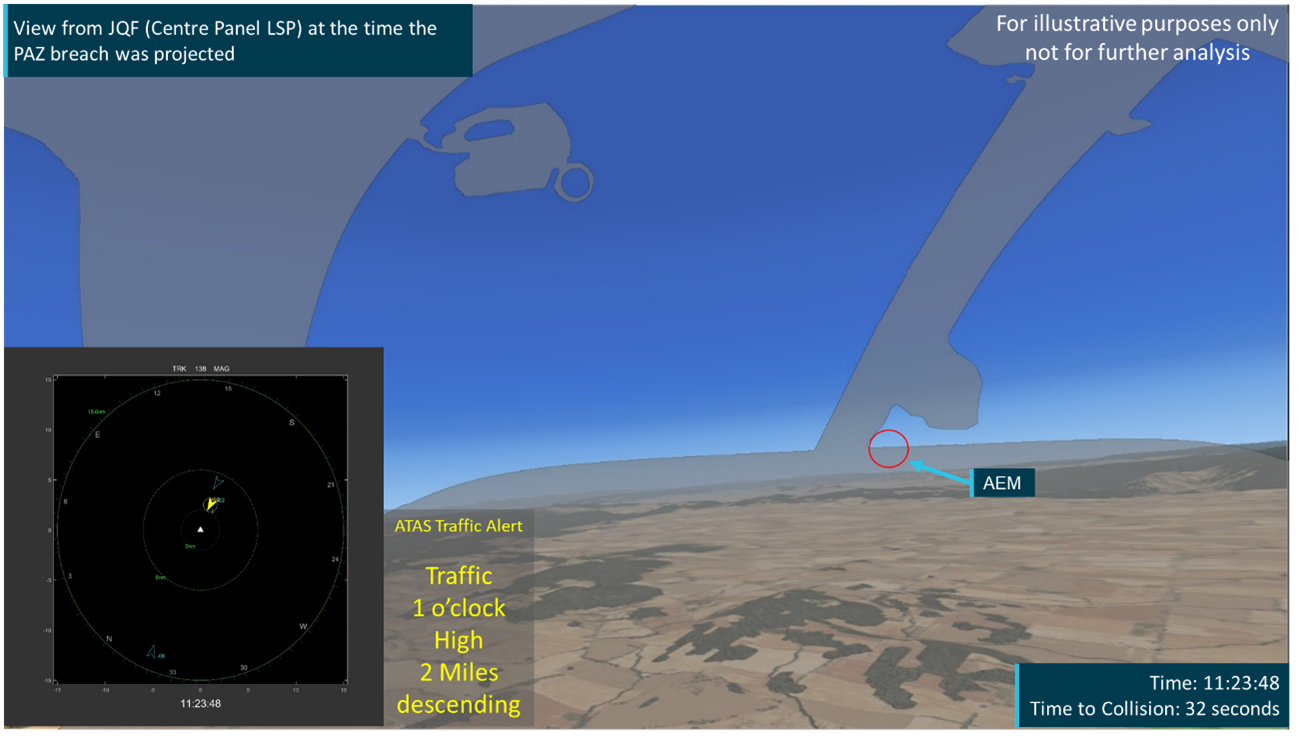
ab-017.png

Source: ATSB

Image Q: View from JQF LSP when AEM triggers PAZ breach and ATAS alert
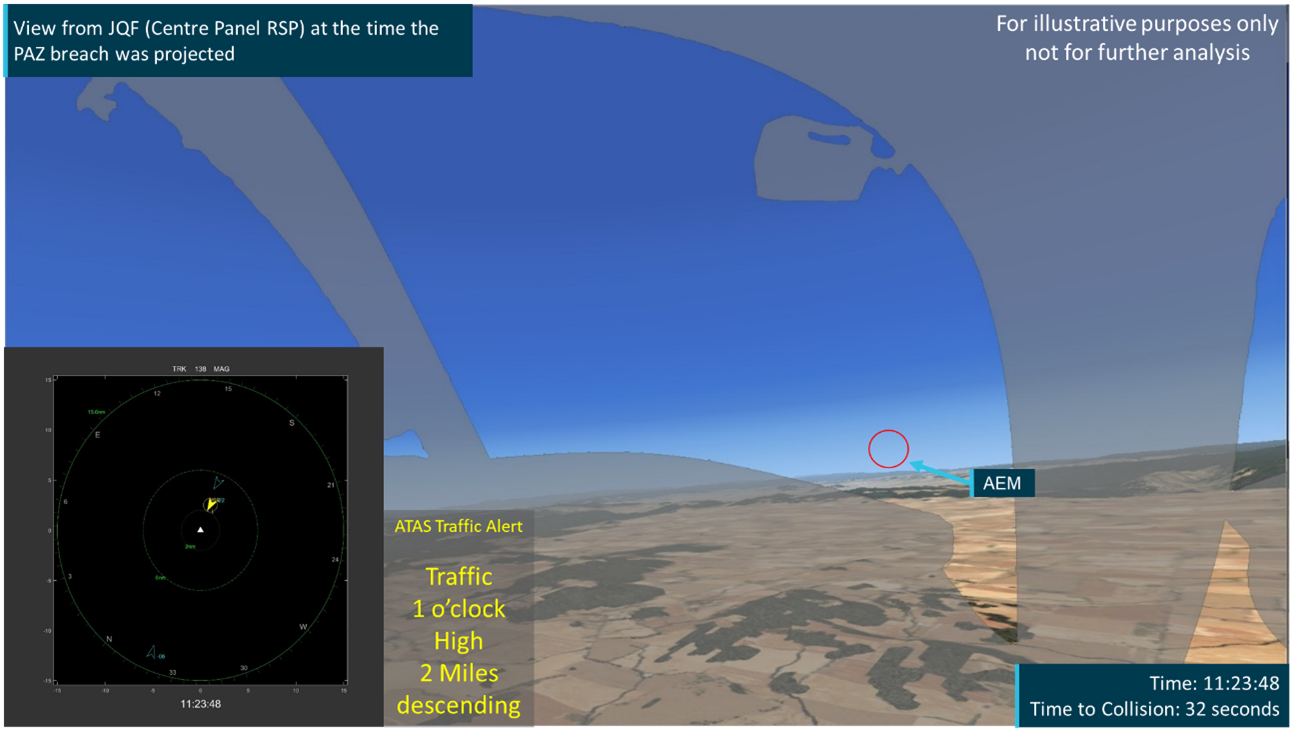
ab-017.png

Source: ATSB

Image R: View from JQF RSP when AEM triggers PAZ breach and ATAS alert

ab-018.png

Source: ATSB

Image S: View from JQF LSP when AEM triggers CAZ breach and ATAS alert
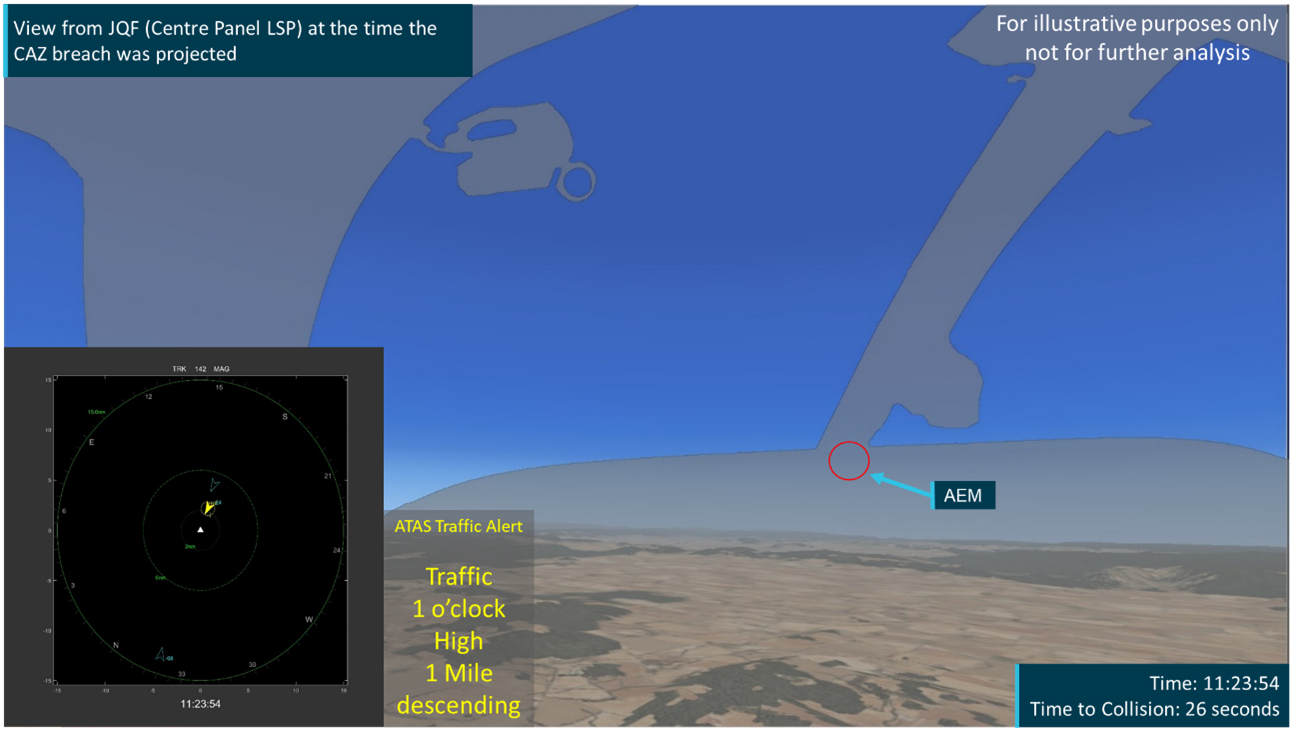
ab-019.png

Source: ATSB

Image T: View from JQF RSP when AEM triggers CAZ breach and ATAS alert
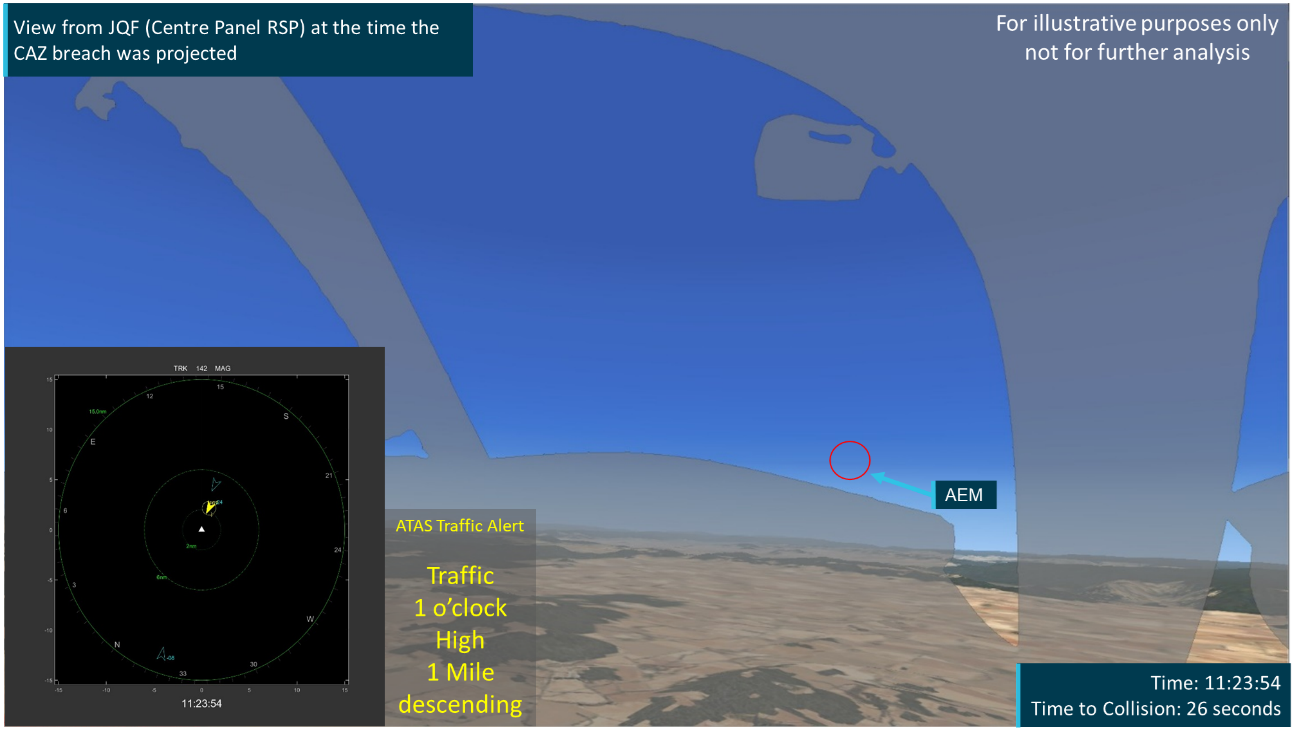
ab-020.png

Source: ATSB

Image U: View from JQF LSP 13 seconds before the collision
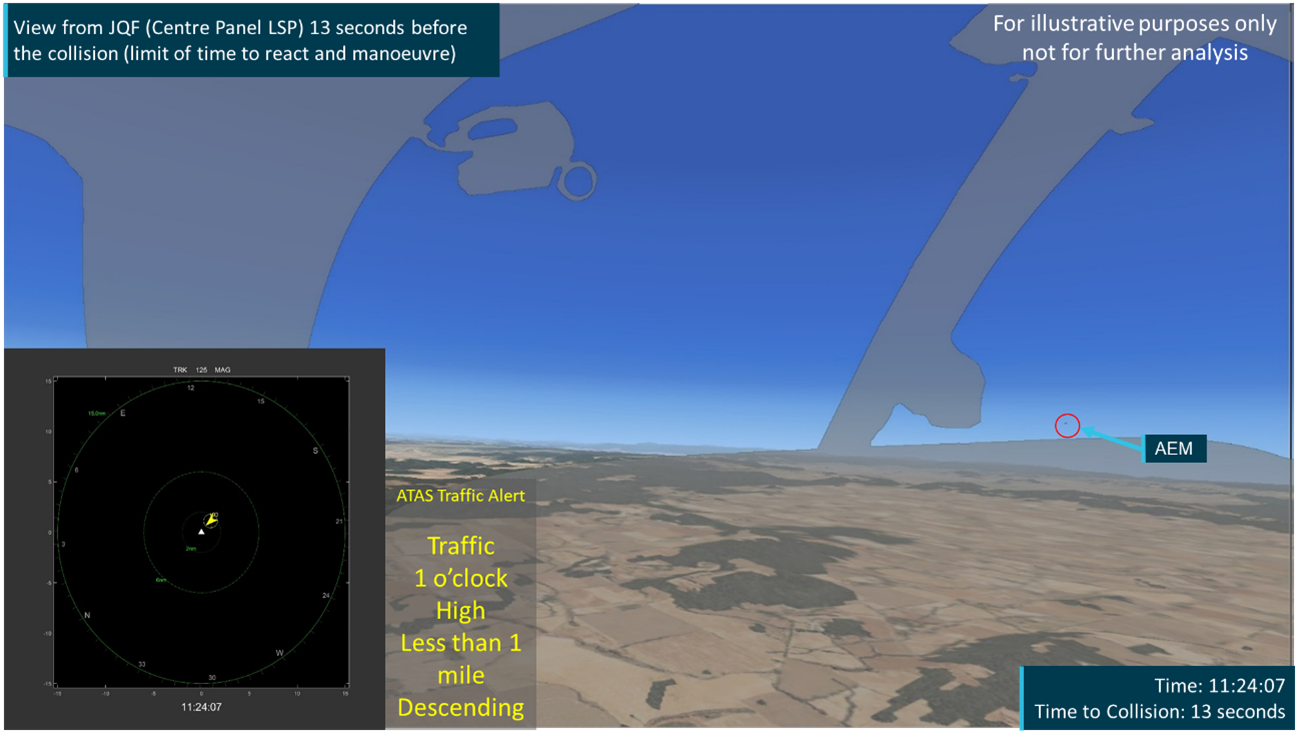
ab-021.png

Source: ATSB

Image V: View from JQF RSP 13 seconds before the collision
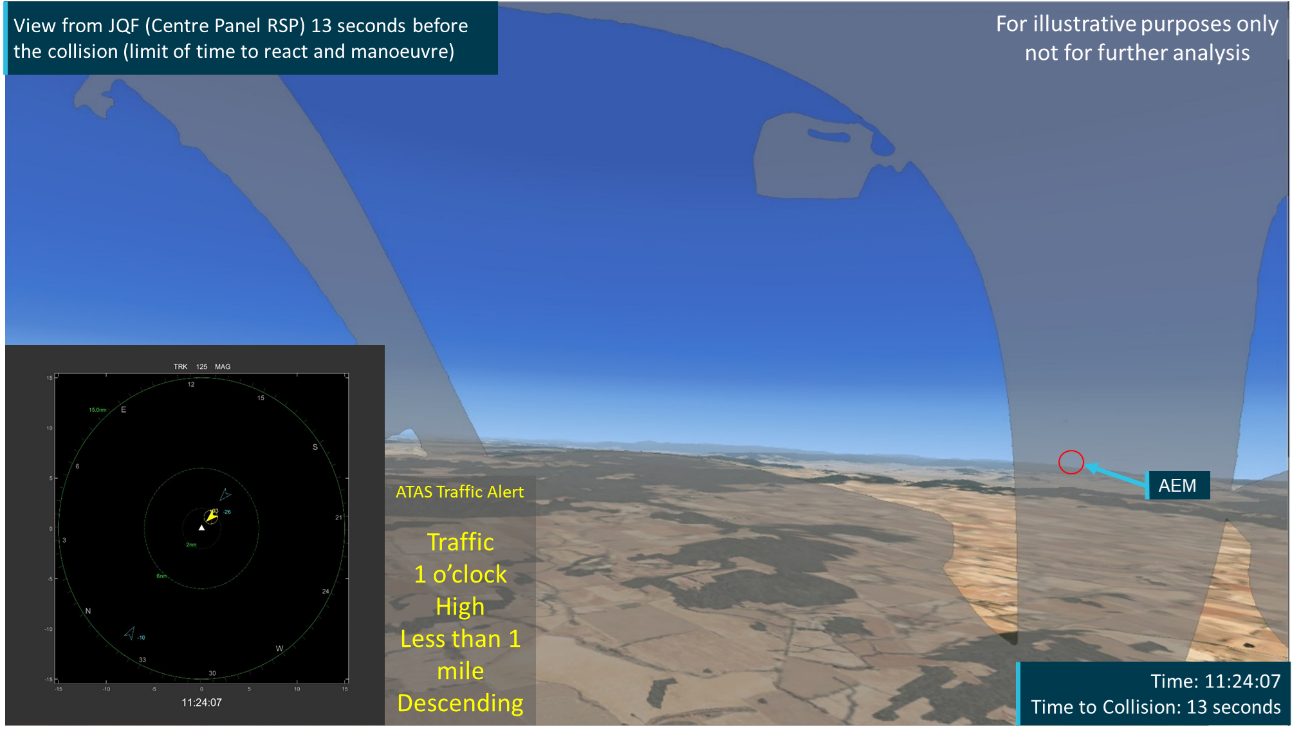
ab-022.png

Source: ATSB

Image W: View from JQF LSP 10 seconds before the collision
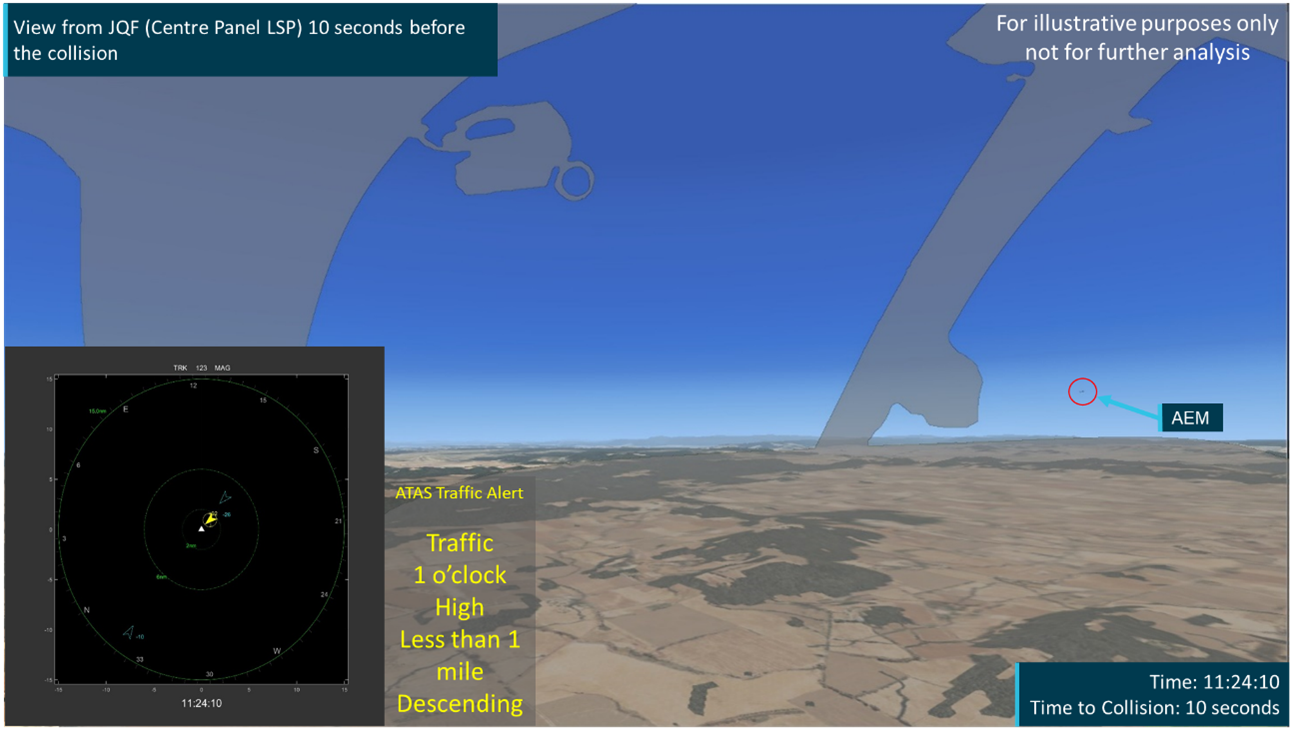
ab-023.png

Source: ATSB

Image X: View from JQF RSP 10 seconds before the collision

ab-024.png

Source: ATSB

Image Y: View from JQF LSP 5 seconds before the collision
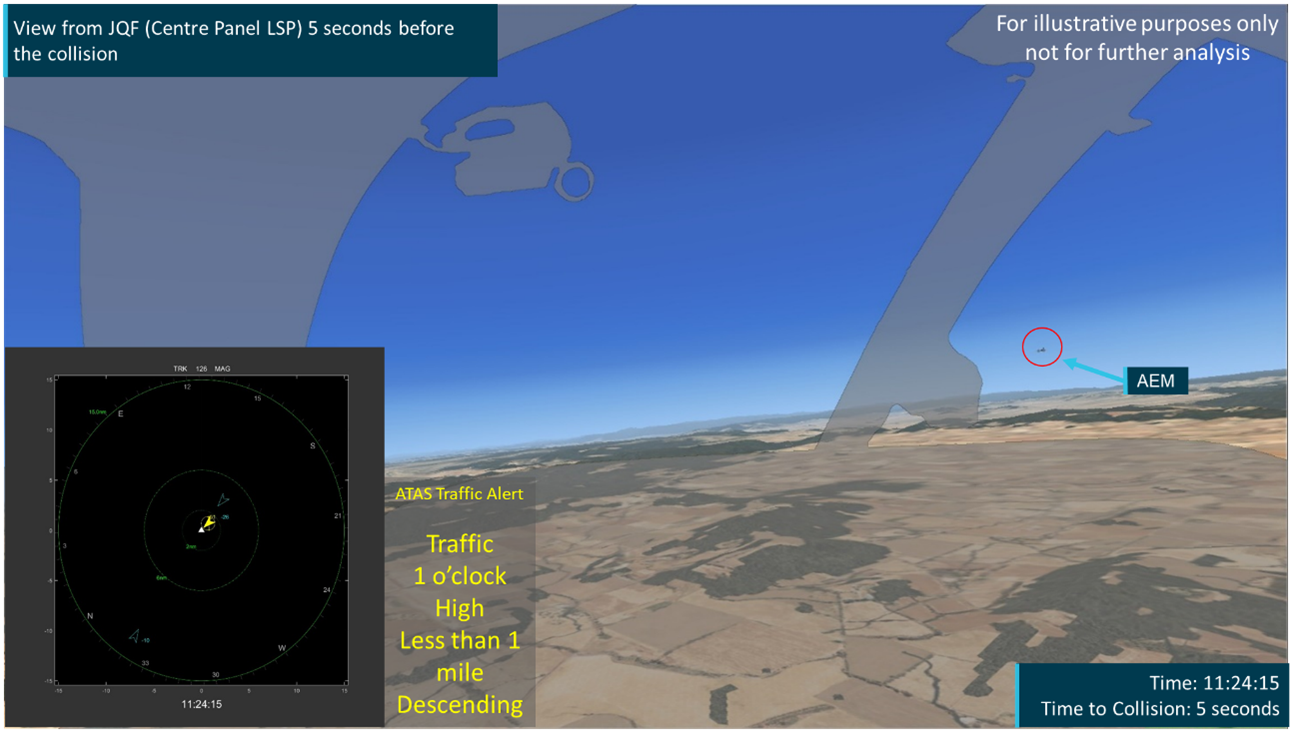
ab-025.png

Source: ATSB

Image Z: View from JQF RSP 5 seconds before the collision
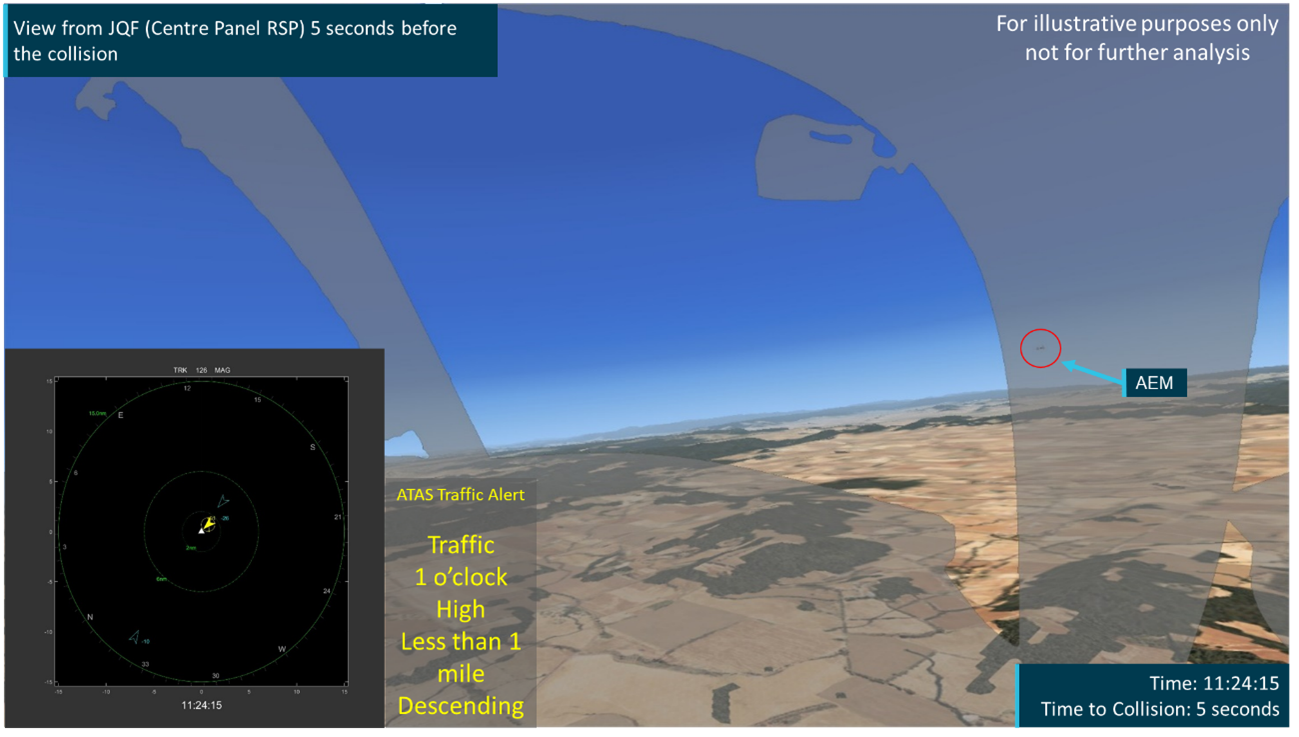
ab-026.png

Source: ATSB

Image AA: View from JQF LSP 1 second before the collision
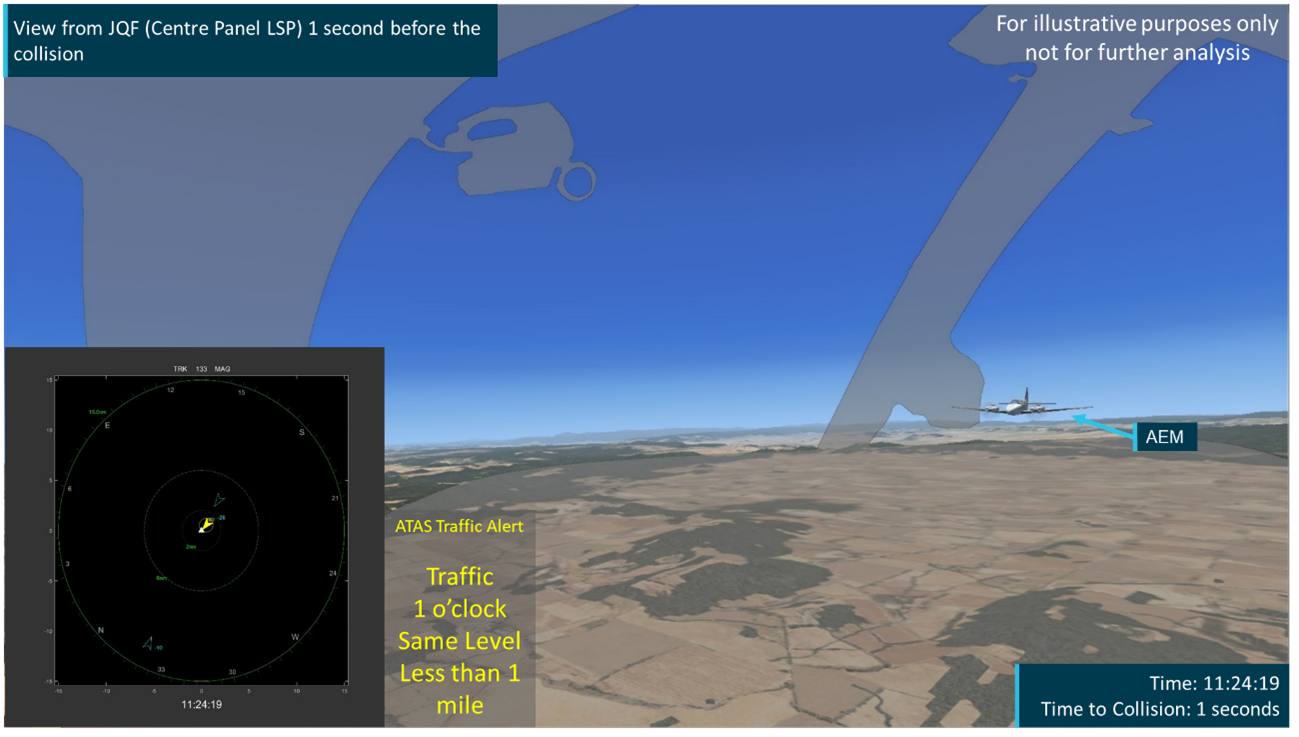
ab-027.png

Source: ATSB

Image AB: View from JQF RSP 1 second before the collision
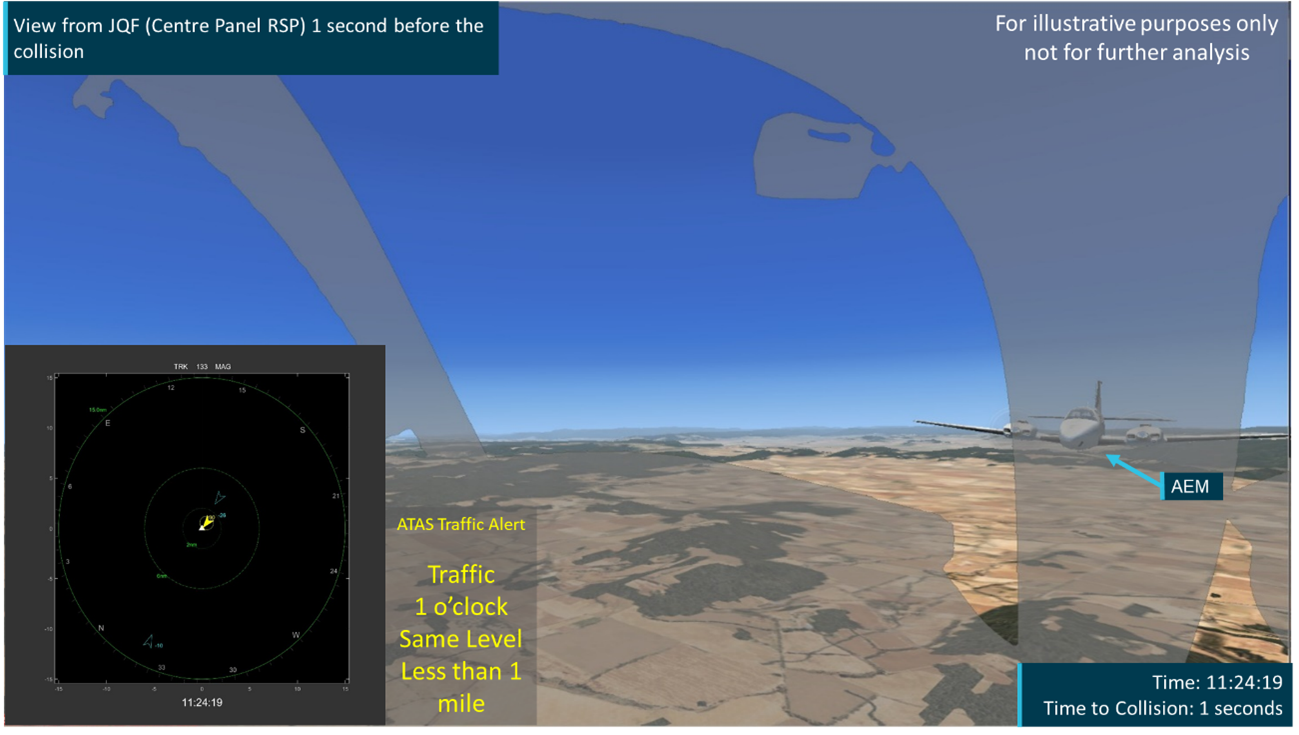
ab-028.png

Source: ATSB


Glossary

AbbreviationExpanded FormDefinition (Where applicable)
ACAdvisory CircularIn Australia – documents that provide advice and guidance to explain particular regulatory requirements of the Civil Aviation Safety Regulations 1998 (CASR) or associated Manual of Standards (MOS).
In the United States – documents to provide guidance for compliance with airworthiness regulations, pilot certification, operational standards, training standards, and any other rules within the 14 CFR Aeronautics and Space Title.
ACASAirborne Collision Avoidance SystemA system that operates independently of ground-based equipment and air traffic control in warning pilots of the presence of other aircraft that may present a threat of collision.
ADS-BAutomatic Dependent Surveillance - Broadcasta means by which aircraft, aerodrome vehicles and other objects can automatically transmit or receive data such as identification, position, and additional data, as appropriate, in a broadcast mode via data link. (AIP GEN 2.2 Definition)
ADS-B IN A system in an aircraft, ground vehicle or other object designed to receive, and process ADS-B signals transmitted by other equipped vehicles. Usually used in conjunction with a CDTI and/or ATAS system
ADS-B OUT A system in an aircraft, ground vehicle or other object that transmits ADS-B Information
ADS-RAutomatic Dependent Surveillance - RebroadcastSystem in the United States that retransmits ADS-B messages from aircraft to those operating a different type of ADS-B transceiver (Universal Access Transceiver). Not currently utilised in Australia
EDTEastern Daylight‑Saving TimeTimezone of the occurrence (UTC +11hrs)
AEMTravel Air D95A VH-AEMAccident Aircraft
AirservicesAirservices AustraliaAustralia’s Air Navigation Service Provider
ANSPAir Navigation Service ProviderOrganisations that manages air traffic or provides services within a particular area or region.
ATASADS-B Traffic Alerting SystemACAS System that uses ADS-B in messages transmitted by other aircraft to provide alerts to pilots about traffic that is a collision risk.
ATCAir Traffic ControlOrganisation that provides air traffic management/ monitoring within a particular area or zone
AWISAerodrome Weather Information ServiceThe AWIS provides actual weather conditions, via telephone or radio broadcast, from Bureau of Meteorology (BoM) automatic weather stations, or weather stations approved for that purpose by the BoM.
AzAzimuth Angle 
BOMBureau of MeteorologyAustralia's Aviation Meteorology Provider
CASACivil Aviation Safety AuthorityAustralia's Aviation Regulator
CDTICockpit Display of Traffic InformationDisplay in aircraft cockpit that allows for the display of received ADS-B information. Also displays alerts attached to the ATAS.
CTAFCommon Traffic Advisory FrequencyA designated frequency on which pilots make positional broadcasts when operating in the vicinity of a non-controlled aerodrome or within a Broadcast Area (AIP Gen 2.2 Definitions)
ECElectronic Conspicuity Devicea device that transmits Automatic Dependent Surveillance-Broadcast information about the position of an aircraft to other airspace users operating similar equipment.
EFBElectronic Flight Bag ApplicationElectronic flight bags applications can electronically store and retrieve documents required for flight operations on a digital device, such as maps, charts, the Flight Crew Operations Manual, Minimum Equipment Lists and other control documents.
ElElevation Angle 
ERSAEn-route Supplement AustraliaPart of the Airservices Australia Aeronautical Information Service suite of documents.
Euler Angle Angles describing the rotation of a body in 3 dimensional space. For aircraft this is pitch, roll and yaw.
FAAFederal Aviation Administration of the United States 
ftfeetmeasure of altitude
GNSSGlobal Navigation Satellite SystemGeneric term for any satellite constellation that provides location, altitude or speed information to a receiver on the ground. The Global Positioning System (GPS) is an example.
GPWTGrid Point Wind and Temperature ForecastBOM issued forecast providing a text-based display of forecast wind speed and direction and temperature forecasts at specified heights above mean sea level, presented in a gridded format.
IFRInstrument Flight Rulesa set of regulations that permit a pilot to operate an aircraft in instrument meteorological conditions (IMC), which have much lower weather minimums than visual flight rules (VFR). Procedures and training are significantly more complex as a pilot must demonstrate competency in IMC conditions while controlling the aircraft solely by reference to instruments. IFR-capable aircraft have greater equipment and maintenance requirements.
IJMTravel Air E95 VH-IJMexemplar aircraft for VH-AEM
JQFPiper PA-44-180 Seminole VH-JQFaccident aircraft
ktknotsmeasure of speed in nautical miles per hour
LEDLight Emitting Diode 
LSPLeft Seat Pilot 
METARAerodrome Meteorological Reporta routine report of meteorological conditions at an aerodrome.
NLOPiper PA-44-180 Seminole VH-NLOExemplar aircraft for VH-JQF
NMNautical Milesmeasure of distance
NTSBUnited States National Transportation Safety BoardTransportation safety investigation agency of the United States
RAResolution AdvisoryAlert provided by the TCAS system if an approaching aircraft breaches a defined area around the host aircraft and poses a collision risk. Alert provides crew with instructions as to appropriate manoeuvring to avoid a collision.
RSPRight Seat Pilot 
RTCAFormerly Radio Technical Commission for AeronauticsStandards development organisation for various aviation electronics and components
STCSupplemental Type Certificatea type certificate (TC) issued when an applicant has received regulatory approval to modify an aeronautical product from its original design.
STCAShort Term Conflict Alerta system intended to assist the controller in preventing a collision between aircraft by generating, in a timely manner, an alert of a potential or actual infringement of separation minima.
TATraffic AlertAlert provided by a TCAS system if another aircraft breaches a defined area around the host aircraft. Enunciated as ’traffic, traffic’.
TCType CertificateA regulators approval of the airworthiness of a particular aircraft or component design.
TCASTraffic Collision Avoidance Systema type of airborne collision avoidance system (ACAS)
TIS-BTraffic Information Service - BroadcastSystem whereby position and altitude information from transponder equipped aircraft is retransmitted for reception by ADS-B In equipped aircraft.
UATUniversal Access TransceiverADS-B device in the United States used for transmission and reception of ADS-B and associated messages on the 978MHz frequency.
UTCUniversal Co-ordinated TimeGlobal Aviation time standard based on the time around 0° longitude.
VFRVisual Flight Rulesa set of regulations that permit a pilot to operate an aircraft in visual meteorological conditions.

Purpose of safety investigations

The objective of a safety investigation is to enhance transport safety. This is done through:

  • identifying safety issues and facilitating safety action to address those issues
  • providing information about occurrences and their associated safety factors to facilitate learning within the transport industry.

It is not a function of the ATSB to apportion blame or provide a means for determining liability. At the same time, an investigation report must include factual material of sufficient weight to support the analysis and findings. At all times the ATSB endeavours to balance the use of material that could imply adverse comment with the need to properly explain what happened, and why, in a fair and unbiased manner. The ATSB does not investigate for the purpose of taking administrative, regulatory or criminal action.

Terminology

An explanation of terminology used in ATSB investigation reports is available here. This includes terms such as occurrence, contributing factor, other factor that increased risk, and safety issue.

Publishing information 

Released in accordance with section 25 of the Transport Safety Investigation Act 2003

Published by: Australian Transport Safety Bureau

© Commonwealth of Australia 2022

image_5.png

Ownership of intellectual property rights in this publication

Unless otherwise noted, copyright (and any other intellectual property rights, if any) in this report publication is owned by the Commonwealth of Australia.

Creative Commons licence

With the exception of the Coat of Arms, ATSB logo, and photos and graphics in which a third party holds copyright, this publication is licensed under a Creative Commons Attribution 3.0 Australia licence.

Creative Commons Attribution 3.0 Australia Licence is a standard form licence agreement that allows you to copy, distribute, transmit and adapt this publication provided that you attribute the work.

The ATSB’s preference is that you attribute this publication (and any material sourced from it) using the following wording: Source: Australian Transport Safety Bureau

Copyright in material obtained from other agencies, private individuals or organisations, belongs to those agencies, individuals or organisations. Where you wish to use their material, you will need to contact them directly.

  1. Euler angle: Angles describing the rotation of a body in three-dimensional space
  2. Times depicted are in EDT and altitudes in feet above mean sea level (AMSL)
  3. STCA: Short Term Conflict Alert - a system intended to assist the air traffic controller in preventing a collision between aircraft by generating, in a timely manner, an alert of a potential or actual infringement of separation minima.
  4. The National Oceanic and Atmospheric Administration Solar position calculator is available online at - ESRL Global Monitoring Laboratory - Global Radiation and Aerosols (noaa.gov)
  5. Azimuth angle – Angular measurement horizontally from position directly ahead of the viewer through a full revolution (-180° through 180°). Angles to the right are positive and angles to the left are negative.
  6. Elevation angle – Angular measurement vertically from a point directly in front of the viewer to a point directly above or below them (-90° through 90°). Angles above the horizontal are positive and angles below are negative.
  7. Wingspans of accident aircraft - AEM 37.82 ft and JQF 38.5 ft
  8. An equirectangular image is where a 360-degree image is projected onto a flat 2D surface with equal azimuth and elevation angle.
  9. Visual Trap – When the viewers gaze becomes focussed on a particular object in the foreground of the field of view neglecting objects in the distance. For example, a pilot becoming focussed on a blemish on the windscreen rather than scanning the whole visual field for traffic.
  10. ARO Scene 2019 version was used for the merging the scan data and processing the models.
  11. A mathematical process that translates and rotates in 3 dimensions for conversion between co-ordinate systems.
  12. Global Navigation Satellite System (GNSS) is a constellation of satellites used for locating a receiver on the earth. The Global Positioning System (GPS) is one example.
  13. ICAO 24-bit address is a unique airframe code that is issued to an aircraft when it is registered.
  14. Airspace in Australia is separated into different classes that may be either controlled (Class A, Class C, Class D, Class E) or non-controlled (Class G). Different services are offered to aircraft that operate in these airspace classes, based on the flight rules the aircraft is operating under (see the section titled Airspace in the investigation report).
  15. The images showing ADS-B network coverage do not include the coverage patterns for the 7 TASWAM stations.
  16. While there have been attempts to harmonise the traffic functionality between application providers to assist pilots in traffic awareness they have, as of the time of publication, been unsuccessful.
  17. Clock co-ordinate: A method of communicating relative position using the numbers of an analogue clock face to identify relative position usually with the pilot’s aircraft at the central axis of the face.
  18. Geoscience Australia’s Geodetic calculators can be found at Geodetic Calculators (ga.gov.au).
  19. The threshold of runway 05 at Mangalore Airport is located at 36.893415o S, 145.173053o E which converts to 337211 m E, 5915392 m S (Zone 55) in rectangular cartesian co-ordinates.
  20. Extremities were considered as the furthest point on the grid in a specific direction where the eye position was still within the structure of the cockpit. In some cases, the movements of the eye position shifted the visual position outside the cockpit structure either into or through a door or the roof. In these cases, the next position closer to the initial estimate was considered as the extremity.
  21. A third STCA was received by the controller on JQF and VFR traffic in the circuit. This was determined to be a nuisance alert and not relevant..
  22. RTCA DO-317B was the standard that outlined the operational performance requirements of aircraft surveillance applications, including performance standards for ADS-B IN systems (including CDTI and ATAS).
  23. FS Recorder is a Freeware add-on to FSX developed by Matthias Neusinger for recording and replay of flights in FSX. It was previously available at http://www.fs-recorder.net/, however the website is no longer available.
  24. Piper Seminole Model was downloaded from Fly Away Simulation Piper PA-44-180 Seminole for FSX (flyawaysimulation.com)
  25. These values are for an FSX window with an aspect ratio of 1.78 (monitor resolution of 1920 x 1080 pixels), at a ’zoom’ setting of 0.3.
  26. for the online version of the report figures 123-136 have been replaced with video animation’s 1 and 2 showing the view from the right and left seats, respectively, of AEM in the final 260 seconds in the lead up to the collision. The time of the PAZ and CAZ breaches are annunciated in the video and the location of JQF 12 seconds before the collision is shown with a light blue circle. The still frame images as described above are in the PDF version of the report or by pausing the video.
  27. for the online version of the report figures 137-150 have been replaced with animation video’s 3 and 4 showing the view from the right and left seats, respectively, of JQF in the final 260 seconds in the lead up to the collision. The time of the PAZ and CAZ breaches are annunciated in the video and the location of AEM 12 seconds before the collision is shown with a light blue circle. The still frame images as described above are in the PDF version of the report or by pausing the video.

Occurrence summary

Investigation number AS-2022-001
Occurrence date 27/10/2022
Report release date 22/06/2022
Report status Final
Investigation level Defined
Investigation type Safety study
Investigation phase Final report: Dissemination
Investigation status Completed
Mode of transport Aviation

Derailment of freight train 6MB4, Bethungra, New South Wales, on 15 January 2022

Discontinuation notice

Report release date: 07/10/2022

Section 21 (2) of the Transport Safety Investigation Act 2003 (TSI Act) empowers the ATSB to discontinue an investigation into a transport safety matter at any time. Section 21 (3) of the TSI Act requires the ATSB to publish a statement setting out the reasons for discontinuing an investigation. This statement is published as a report in accordance with section 25 of the TSI Act, capturing information from the investigation up to the time of discontinuance.

Overview of the investigation

At approximately 0323 on 15 January 2022, the driver of 6MB4 reported losing air on the Up Main at 452.000 km, at Bethungra, NSW. Shortly after, the driver reported that three wagons (RRAY07213S, RRQY08515T and QQCY01120F), in the centre of the consist of 33 wagons, had derailed. The wagons sustained substantial damage with major damage to the track infrastructure. The train crew were uninjured.

Australian Rail Track Corporation was the rail infrastructure manager for the line.

ATSB’s preliminary evidence collection identified that:

  • the derailment of train 6MB4 resulted from a screwed journal. The cause of the bearing failure could not be determined due to the large amount of consequential damage sustained, preventing a complete teardown and analysis of the failed bearing
  • wheelset 7E3S080144 was fitted to wagon wheelset position 5 of QQCY01120F within bogie QRYE2079. New bearings were installed at the rolling stock maintainer’s facility and released to service on 2 September 2020. Records from the maintainer documented that the bearings fitted were an ‘Class E’ (6” x 11”) packaged bearing manufactured by Timken on 01/2020 and 12/2019. The bearings were fitted new and had not received a reconditioning maintenance event. These bearings covered 370,907 km to the point of failure
  • there were no issues identified with the train management of train 6MB4
  • there were no identified track defects in the region of or approaching the derailment site
  • the condition monitoring equipment available on the operational route did not provide indications of a bearing showing signs of distress.

Reasons for the discontinuation

The ATSB considered the contributing factors to the derailment were a result of a failed bearing. The reasons for that failure were unable to be conclusively determined.

In response to the incident, Pacific National have proposed the following safety actions be initiated:

  • work collaboratively with ARTC to implement further Hot Bearing Detector wayside equipment across the Melbourne to Brisbane corridor, to assist with identifying bearing failure modes that do not produce acoustic signals
  • undertake a review of the practices and processes at their rolling stock maintenance provider, with particular focus on techniques and tooling used to measure journal diameter.

Based on this information, the ATSB considered it was very unlikely that further investigation would identify any systemic safety issues or identify opportunity for the enhancement of transport safety. Consequently, the ATSB has discontinued this investigation.

Occurrence summary

Investigation number RO-2022-002
Occurrence date 15/01/2022
Location Bethungra
State New South Wales
Report release date 07/10/2022
Report status Discontinued
Investigation level Short
Investigation type Occurrence Investigation
Investigation status Discontinued
Mode of transport Rail
Rail occurrence category Derailment
Occurrence class Accident
Highest injury level None

Train details

Train operator Pacific National
Train number 6MB4
Type of operation Freight
Rail vehicle sector Freight
Departure point Melbourne, Victoria
Destination Brisbane, Queensland
Train damage Substantial

In-flight propeller loss involving Jabiru J170, 24-7496, near Muchea/Greenside ALA, Western Australia, on 22 December 2021

Final report

Report release date: 14/11/2020

Executive summary

What happened

On 22 December 2021, at around midday, a student pilot departed Muchea/Greenside ALA, Western Australia, on a training area solo flight in the Jabiru J170-C aircraft registered 24-7496. On return, during the downwind leg of the circuit, the pilot commenced configuring the aircraft for landing, at which point a vibration from the engine was felt. The engine gauges read as normal and the vibration reduced with throttle reduction.

Shortly after, while on final approach, the pilot observed emus crossing the runway around the normal touchdown point and conducted a go-around. While on climb at around 800 feet, there was a loud ‘bang’ and the pilot observed that the propeller had separated from the aircraft. The pilot subsequently landed in a paddock, approximately 2.5 km from the end of the runway. The aircraft suffered minor damage and the pilot was uninjured. The propeller was not recovered.

What the ATSB found

The propeller separated as a result of fracture of the propeller bolts that was likely related to a loss of bolt tension. However, the factors contributing to any loss of tension were not able to be determined.

The student pilot had recently undertaken several hours’ worth of flight emergency training, which positively influenced the pilot’s actions and contributed to the safe outcome.

Safety message

Pilots should remain vigilant to transient or persistent changes to the normal operation of their aircraft. Such changes may be indicative of an impending failure of a critical component or system. As such, a prudent course of action would be to land as soon as practicable and have the aircraft inspected. Even so, in-flight emergencies will continue to occur, and when faced with such an event, emergency training practice and recurrence will increase the likelihood of pilots achieving a safe outcome.


The investigation

Decisions regarding whether to conduct an investigation, and the scope of an investigation, are based on many factors, including the level of safety benefit likely to be obtained from an investigation. For this occurrence, a limited-scope investigation was conducted in order to produce a short investigation report, and allow for greater industry awareness of findings that affect safety and potential learning opportunities.

The occurrence

On 22 December 2021, at around midday, a student pilot departed Muchea/Greenside aeroplane landing area (ALA), Western Australia, on a training area solo flight in the Jabiru J170-C aircraft registered 24-7496. The pilot flew for approximately 70 minutes before returning to land at Greenside ALA. During this time, the pilot did not observe anything unusual with the aircraft’s performance.

The pilot joined the downwind leg of the circuit (heading west) and around this time, observed a burning pine smell, which was significant enough for the pilot to look around the cabin and outside for a source. The smell dissipated and was not observed for the remainder of the flight. Shortly after observing the smell, the pilot commenced configuring the aircraft for landing, at which point a significant vibration from the engine was felt. The pilot immediately checked the engine gauges and noted everything was normal. The vibration lessened significantly upon reduction of the throttle. As a result, the pilot re-checked the gauges, which were still normal, and focused on continuing the circuit.

While on final approach, the pilot observed emus crossing the runway around the normal touchdown point, which prompted the pilot to conduct a go-around. The pilot then flew down the remainder of the runway, cleared the hangars and then the highway at the eastern end of the airstrip, climbing through approximately 500­-600 feet. No abnormal vibration was observed at any point during the go-around.

Between 5­ and 10 seconds after clearing the highway, at an altitude of around 800 feet, there was a loud ‘bang’ which was heard by witnesses back at the hangars. At the same time, the pilot noted that the propeller had separated from the aircraft.

After securing the engine, the pilot elected to land ahead and configured the aircraft for a glide to reach some cleared paddocks. The pilot then made a MAYDAY[1] call that was received nearby at Pearce RAAF base, who contacted the chief flying instructor at Muchea. The pilot subsequently conducted an uneventful landing in a paddock, approximately 2.5 km from the end of the runway. The aircraft suffered minor damage to the nose cowl (Figure 1) and right, main landing gear. The pilot was uninjured.

Figure 1: Propeller flange and nose cowl damage

Propeller flange and nose cowl damage

Source: Aircraft operator

Context

Pilot information

The student pilot had approximately 70 hours flying experience, all of which was on the Jabiru J170. The pilot had recently undertaken an area training flight with an instructor and had 3 hours of emergency procedures training, including engine failure, over the previous 5 weeks. The pilot commented that the training positively influenced their actions, helped them remain calm and contributed to the safe outcome.

The pilot also had a debrief with the operator after the event and made the following comments to the ATSB:

  • They had not experienced anything like the vibration previously. Despite this, everything appeared to be safe to fly the aircraft in the short term because the vibration had reduced rapidly with throttle reduction and the engine gauges read as normal. Nevertheless, after landing, the pilot had planned to discuss with the chief pilot what was experienced.
  • In hindsight, recognising the vibration as an indicator of impending failure, there was an opportunity to cut the circuit short and land as soon as possible. Alternatively, there was an opportunity to land long, past the emus. However, the pilot was also concerned about the possibility of more emus further down the runway, which had been encountered previously.

Aircraft information

The Jabiru J170-C is a 2-seat, light sport aircraft with a high-wing and fixed undercarriage. The subject aircraft was manufactured and first registered in 2010. It was powered by a Jabiru 2200B 4-cylinder engine, with a Jabiru C000242-series, 2-blade, fixed-pitch propeller, constructed of hoop pine, sheathed in fibreglass.

The occurrence propeller, serial number 3050, was manufactured in January 2009. The operator estimated that it had 1,500-1,600 hours in service. The propeller was overhauled by the manufacturer in February 2021. The leading-edge urethane wear strip started to disbond after about 50 hours post-overhaul and was returned to the manufacturer for repair. After the repair, the operator visually inspected the propeller, checked the balance, and re-fitted it to the aircraft. The propeller subsequently accumulated 7.9 hours up to the occurrence.

Operator information

The operator held RAAus Level 2 maintenance authority and had owned and maintained Jabiru aircraft since 2009. The operator advised that

  • Propellers are fitted and inspected in accordance with the Jabiru maintenance manual, including a check of the propeller bolt torques after the first flight following fitment.
  • Prior to the occurrence flight, the chief pilot conducted a thorough pre-flight inspection, as a demonstration to a new student pilot. The propeller was inspected for damage and security, including a check for any play or movement of the propeller on the end of the crankshaft. There were no anomalies noted.
  • There were no reported unusual engine or propeller vibrations in the flights since the most recent propeller fitment.
  • The propeller attachment hardware was periodically replaced when displaying any significant wear.

Physical evidence examination

Propeller assembly and maintenance

The Jabiru C000242-series wooden propeller was attached to the propeller flange by 6 propeller bolts (Figure 2). The propeller bolts were specified as either AN4-37 or AN4-40, meaning they were approximately 4 inches (10 cm) in length. They were installed with the bolt heads facing rearwards. The gap between the rear of the flange and the front of the engine cowl did not allow for the bolts to be installed or removed with the cowl in place.

The bolts were installed through stainless steel guide bushes, inserted into the flange. The bushes are a close fit (no free-play) in the rear of the propeller hub. A woven fibreglass composite backing plate sits between the flange and propeller hub and provides for attachment of the spinner.

In this installation, the bolts were assembled with Belleville washers,[2] which was a recommended alternate propeller mounting system, introduced by Jabiru in 2005. The purpose was to allow the assembly to better account for seasonal changes in the wooden hub dimensions and as such, reduce the frequency of inspections of propeller bolt tension. Jabiru maintenance manual JPM3L1-4 indicated that the propeller bolts must be checked after the first flight following installation and then recommended every 100 hours and/or annually thereafter. Jabiru Service Bulletin JSB014-1 indicated that a loss of bolt tension can cause the propeller to move and fret[3] on the mounting flange.

Figure 2: Propeller assembly

Propeller assembly

Source: Jabiru (annotated by ATSB)

Examination

In an effort to locate the separated propeller, the operator conducted an extensive aerial photographic survey (approximately 89 hectares), covering the flightpath and surrounding area to the east of the airstrip. Despite this, the separated propeller assembly was not recovered. As a result, component examination by the ATSB was limited to the propeller flange and 5 (of 6) remaining guide bushes (Figure 3).

Figure 3: Propeller flange detail

Wear from drive bush on propeller flange

Source: Aircraft operator, modified by the ATSB

The examination found that:

  • The flange forward face exhibited abrasive wear patterning consistent with the fibreglass weave of the backing plate, on one-half of the forward face of the flange. The wear had removed the surface contamination from the flange and microscopic grooves were worn into the surface in some areas. The presentation of the wear indicated that it likely predated the first indications of vibration observed by the pilot.
  • Localised fretting wear was present between the guide bush and the rear face of the flange (Figure 4). The greatest amount of wear was associated with those bushes on the opposite half of the flange from the wear on the forward face. Surface contamination from the flange had also transferred to the bushes. This was most notable on those holes with the most wear indications.
  • One of the bushes had a section of the wall fractured laterally and the remaining bushes had small amount of deformation on the inside rim of the forward face. This was a result of contact with the bolt shank at the point of the propeller separation.
  • There were no indications of how the missing bush separated from the flange, however wear around the associated hole indicated that it was in situ in the time leading up to the occurrence.

Figure 4: Wear from drive bush on propeller flange

Wear from drive bush on propeller flange

Source: ATSB

Previous occurrences

Review of the ATSB aviation occurrence database found five other instances of in-flight propeller separation, involving Jabiru aircraft:

  • The ATSB investigated a March 2013 occurrence (AO-2013-046), involving a propeller separation as a result of fatigue fracture of the bolts securing the propeller flange to the engine crankshaft, and therefore a different point of fracture to the subject occurrence. In response to that occurrence and safety issues identified, Jabiru took several safety actions to reduce the likelihood of reoccurrence.
  • Another 2013 event, a wooden propeller separated from a J200B aircraft while in the cruise phase of flight. Four of the bolts had fractured at the heads and two remained in situ, having torn through the hub. It was a reported as probable maintenance issue, related to over‑tensioning the propeller bolts.
  • In 2021, the flight crew of a J230 aircraft experienced noticeable, but not severe vibration that did not respond to a reduction in throttle. The engine operation was normal. The pilots continued the flight and because of the continued vibration, they assessed alternative landing options. Approximately 20 minutes after the vibration onset, the propeller departed the aircraft. The pilots subsequently identified a suitable landing area and conducted a forced landing on a track through a paddock.
  • Also in 2021, the pilot of a J160 aircraft reported a very rough running engine and after 30 seconds, the engine stopped. The pilot conducted a forced landing into a clearing and, upon exiting the aircraft, observed that the propeller had separated from the aircraft and that the propeller mounting bolts had fractured.
  • In January 2022, a propeller separated as a result of broken propeller bolts after a reported bird-strike. That incident is the subject of ATSB investigation AO-2022-013.

No injuries were sustained in any of the above occurrences.

Safety analysis

Propeller separation

The operator indicated that the propeller bolts were installed in the correct orientation, and as such, there was insufficient clearance between the propeller flange and nose cowl for the bolts to back out of the flange. Therefore, the absence of propeller bolts retained in the flange indicted that the propeller ultimately separated from the aircraft due to fracture of the bolts.

Without the bolts available for examination, the reason for the propeller bolt fractures was not conclusively determined. However, the evidence of movement and fretting on the flange was consistent with a loss of clamping force or low bolt tension. The pilot-observed vibration and smell of burnt pine in the minutes prior to the separation was also evidence of relative movement between the wooden propeller and the mounting hardware. Vibration in a normally rigid system will introduce abnormal loading conditions, subjecting components to stresses beyond design considerations. Additionally, fretting wear can significantly reduce the fatigue limit and hence, the working life of components in the assembly.

The ATSB considered several possible reasons for the loss of bolt tension, including an error in the installation, worn or defective hardware, or an undiagnosed issue with the propeller itself. However, in the absence of further physical evidence or any indication of assembly or maintenance issues, the factors contributing to the loss of bolt tension were not able to be conclusively determined.

Decision-making

The engine vibrations and burning timber smell alerted the pilot to the abnormal situation from the powerplant. However, the pilot’s decision-making in relation to the developing situation was influenced by a combination of their experience (having had no similar encounters) and the information presented to them, indicating that the engine had returned to normal. Therefore, when faced with wildlife crossing the runway, the pilot applied the otherwise appropriate adage ‘if it’s not right – go-around’. As a result, the pilot was faced with an emergency off-field landing when the propeller subsequently separated. Despite this, the pilot executed the landing calmly and safely, which they attributed to their recent emergency training.

Findings

ATSB investigation report findings focus on safety factors (that is, events and conditions that increase risk). Safety factors include ‘contributing factors’ and ‘other factors that increased risk’ (that is, factors that did not meet the definition of a contributing factor for this occurrence but were still considered important to include in the report for the purpose of increasing awareness and enhancing safety). In addition ‘other findings’ may be included to provide important information about topics other than safety factors. 

These findings should not be read as apportioning blame or liability to any particular organisation or individual.

From the evidence available, the following findings are made with respect to the In-flight propeller loss involving Jabiru J170, registration 24-7496, 2.6 km north-east of Muchea, Western Australia on 22 December 2021.

Contributing factors

  • The propeller separated as a result of fracture of the propeller bolts that was likely related to a loss of bolt tension. The mechanism for the loss of bolt tension was not determined.

Other findings

  • The student pilot had recently undertaken several hours’ worth of flight emergency training, which positively influenced the pilot’s actions and contributed to the safe outcome.

Sources and submissions

Sources of information

The sources of information during the investigation included the:

  • Pilot of the accident flight
  • Topfun Aviation
  • Jabiru Aircraft Pty Ltd

Submissions

Under section 26 of the Transport Safety Investigation Act 2003, the ATSB may provide a draft report, on a confidential basis, to any person whom the ATSB considers appropriate. That section allows a person receiving a draft report to make submissions to the ATSB about the draft report.

A draft of this report was provided to the following directly involved parties:

  • The pilot of the accident flight
  • Topfun Aviation  
  • Jabiru Aircraft Pty Ltd

Any submissions from those parties will be reviewed and, where considered appropriate, the text of the draft report will be amended accordingly.

Purpose of safety investigations

The objective of a safety investigation is to enhance transport safety. This is done through:

  • identifying safety issues and facilitating safety action to address those issues
  • providing information about occurrences and their associated safety factors to facilitate learning within the transport industry.

It is not a function of the ATSB to apportion blame or provide a means for determining liability. At the same time, an investigation report must include factual material of sufficient weight to support the analysis and findings. At all times the ATSB endeavours to balance the use of material that could imply adverse comment with the need to properly explain what happened, and why, in a fair and unbiased manner. The ATSB does not investigate for the purpose of taking administrative, regulatory or criminal action.

Terminology

An explanation of terminology used in ATSB investigation reports is available here. This includes terms such as occurrence, contributing factor, other factor that increased risk, and safety issue.

Publishing information 

Released in accordance with section 25 of the Transport Safety Investigation Act 2003

Published by: Australian Transport Safety Bureau

© Commonwealth of Australia 2022

image_5.png

Ownership of intellectual property rights in this publication

Unless otherwise noted, copyright (and any other intellectual property rights, if any) in this report publication is owned by the Commonwealth of Australia.

Creative Commons licence

With the exception of the Coat of Arms, ATSB logo, and photos and graphics in which a third party holds copyright, this publication is licensed under a Creative Commons Attribution 3.0 Australia licence.

Creative Commons Attribution 3.0 Australia Licence is a standard form licence agreement that allows you to copy, distribute, transmit and adapt this publication provided that you attribute the work.

The ATSB’s preference is that you attribute this publication (and any material sourced from it) using the following wording: Source: Australian Transport Safety Bureau

Copyright in material obtained from other agencies, private individuals or organisations, belongs to those agencies, individuals or organisations. Where you wish to use their material, you will need to contact them directly.

[1]     MAYDAY: an internationally recognised radio call announcing a distress condition where an aircraft or its occupants are being threatened by serious and/or imminent danger and the flight crew require immediate assistance.

[2]     Conical disc spring washers.

[3]     Fretting refers to wear involving small amplitude relative movement or vibration between contact surfaces.

Occurrence summary

Investigation number AO-2022-004
Occurrence date 22/12/2021
Location Near Muchea/Greenside ALA
State Western Australia
Report release date 14/11/2022
Report status Final
Investigation level Short
Investigation type Occurrence Investigation
Investigation status Completed
Mode of transport Aviation
Aviation occurrence category Propeller/rotor malfunction
Occurrence class Serious Incident
Highest injury level None

Aircraft details

Manufacturer Jabiru Aircraft Pty Ltd
Model J170-C
Registration 24-7496
Serial number 291
Sector Piston
Operation type Part 103 Sport and recreational aircraft
Departure point Muchea/Greenside ALA, Western Australia
Destination Muchea/Greenside ALA, Western Australia
Damage Minor

Hard landing involving Kavanagh Balloons B-350, VH-BSW, 2 km south of Lilydale Airport, Victoria, on 31 December 2021

Final report

Report release date: 18/08/2022

Executive summary

What happened

On 31 December 2021, a Kavanagh B-350 hot-air balloon, registered VH BSW and operated as a scenic charter flight by Picture This Ballooning (PTB), was being prepared near Glenburn, north of the Yarra Valley, Victoria, with one pilot and 16 passengers. The pilot conducted a pre-flight safety briefing and departed shortly after, intending to land near Yarra Glen.

About 42 minutes into the planned 1‑hour flight, the pilot received a report that the surface wind near the landing area was increasing. The pilot assessed multiple landing options over the next 17 minutes while the wind was increasing. The pilot then made an approach to a landing field and the balloon landed hard with 2 passengers seriously injured.

What the ATSB found

The ATSB found that the pilot rejected several suitable landing fields to avoid possible post‑landing logistical and operational difficulties. This progressively reduced the safe landing sites available to the pilot.

The field in which the pilot decided to land contained fences not previously known to the pilot, powerlines downwind, and no known landing sites further along the balloon's track. This landing site presented high risks in the prevailing windy conditions.

The landing was complicated by the balloon descending faster than intended, bouncing off the ground back into the air, and then manoeuvres to clear fences. These factors, in combination with the prevailing winds and nearby power lines, led to the pilot descending the balloon rapidly from an excessive height resulting in the hard landing.

The investigation also found that all required actions of the pre-flight passenger safety briefing were not completed, probably due to time pressure and the pilot’s assumption that all passengers would understand an abbreviated briefing. The incomplete briefing probably resulted in 2 passengers adopting a deep squat position during the hard landing, causing their injuries.

The ATSB further identified that the maximum number of passengers that the balloon operator allowed to be carried on the balloon meant that there was insufficient room in the basket for them to adopt the landing position specified in the operator's procedures to reduce the risk of injury.

What has been done as a result

The balloon operator has reduced the maximum number of passengers that the balloon can carry to ensure that all passengers can achieve the required backwards facing landing position. The operator is also reviewing maximum passenger capacities on all of its balloons.

Safety message

This accident demonstrates the importance of passengers adopting the correct body position during landing to reduce the likelihood and severity of injury. The pre-flight briefing is critical in ensuring passenger preparation, particularly as opportunities to reinforce the information during flight may be limited. Pilots should use all available resources (such as, passenger demonstrations and safety briefing cards) to ensure that each passenger understands the landing position and its importance. Further, commercial balloon operators are reminded to ensure that all passengers can physically achieve the required landing positions to reduce the risk of injury.

When faced with deteriorating wind conditions, pilots should prioritise occupant safety in the selection of a landing field. This reduces the risk of a hard landing or accident. Post flight logistical or operational considerations are of secondary importance.


The occurrence

Early on the morning of 31 December 2021, a Kavanagh B-350 hot-air balloon, registered VH‑BSW and operated as a scenic charter flight by Picture This Ballooning (PTB), was being prepared for departure near Glenburn, north of the Yarra Valley, Victoria, with one pilot and 16 passengers. Another balloon of the same operator, and four other balloons from different operators, were also being prepared for take-off at the same location.

At about 0420 Eastern Daylight-saving Time,[1] the pilot of VH-BSW obtained relevant weather information from both the Bureau of Meteorology and another balloon pilot and assessed the conditions as suitable to depart. The pilot intended landing south-east of Yarra Glen (Figure 1).

Figure 1: Balloon flight track

Figure 1: Balloon flight track

Source: Google Earth, annotated by ATSB

After the passengers had climbed into the basket, the pilot conducted a pre-flight safety briefing and, at 0547, the balloon departed for an anticipated 1-hour flight. Shortly after, the balloon’s ground crew member travelled in a car towards the intended landing area to assist with balloon and passenger retrieval.

The pilot climbed the balloon to a cruise altitude of between 2,500 and 2,700 ft above mean sea level (AMSL), before allowing the balloon to descend into the Yarra Valley to reduce the balloon’s speed. The balloon levelled off at about 200 ft above ground level (AGL) at 0620 and a speed of 15 kt.

At about 0629, the pilot heard the radio broadcast of a ground crew member from another balloon operator that the surface winds were increasing to about 10 kt near the intended landing area. At this time, the pilot started looking for landing sites.

At about 0632, the pilot instructed the passengers to take up landing positions and made an approach to the intended landing area. As the balloon descended, the wind turned the balloon west, away from the site, preventing the landing from being completed. The pilot continued to assess landing options over the next 14 minutes (see the section titled Potential landing sites). During this time, the balloon’s groundspeed varied between 9 and15 kt.

At about 0646, the balloon’s flight continued over a small hill before the pilot instructed the passengers to again get into the landing positions. The pilot intended to float above a seeded field, and land in an adjacent field further along the balloon’s track (Figure 2). Shortly before reaching the seeded field, the pilot pulled the parachute vent line for about 10 seconds to descend for landing (see the section titled Balloon information).

Shortly after, the balloon started descending faster than the pilot anticipated. The pilot operated the burners but was unable to arrest the balloon’s descent and the bottom of the basket contacted the ground. The balloon then started rising so the pilot pulled on its rip line, opening the vent to deflate the balloon (see the section titled Balloon information), intending to touchdown over a nearby fence.

Figure 2: Balloon approach and landing

Figure 2: Balloon approach and landing

Only relevant fences have been marked. Source: Google Earth, annotated by ATSB

After the balloon climbed into the air, the pilot noticed another fence running diagonally across the intended landing area along the flight path. The pilot held the rip line to maintain the size of the vent opening, and the balloon continued over this fence, reaching a height of about 40 ft. The pilot then resumed pulling the rip line, opening the vent further and the balloon descended rapidly, landing hard in the field at about 0648. After the basket touched down, it tipped over and was dragged for 30-40 metres along the ground before coming to rest.

The balloon and basket were not damaged during the hard landing, but two passengers sustained serious leg injuries. There was another occurrence reported to the ATSB involving one of the other balloons that had departed Glenburn that morning, but the circumstances of that event were unrelated to the development of this accident.

__________

  1. Eastern Daylight-saving Time (EDT): Coordinated Universal Time (UTC) + 11 hours

Context

Balloon information

VH-BSW was a Kavanagh B-350 balloon which included an envelope, double T‑partitioned basket with 32 rope handles (Figure 3) and 4 passenger compartments, a three burner system and 3 propane fuel tanks.

Figure 3: Double-T partitioned basket (example)

 Double-T partitioned basket

The depicted basket has a four-burner system. Source: Kavanagh Balloons

The balloon was equipped with a Lite Vent deflation system. In-flight venting was achieved by pulling on the parachute vent line which in turn pulled the vent panel at the top of the balloon for a controlled release of air. Releasing the vent line allowed the vent panel to close. The parachute vent was used to descend the balloon, such as when approaching to land. For final landing, when the balloon was close to the ground, the rip line was pulled so that the centre of the vent panel was pulled down into the balloon for rapid deflation. The more the rip line is pulled, the larger the vent opening, and the more air allowed to escape through the vent. Releasing the rip line does not close the vent panel.

The balloon’s flight manual included the following information about the rip line:

The centre pull rip line must not be activated if the basket floor is more than 2 metres (six feet) above ground level unless during an emergency landing.

WARNING: Operation of the Lite Vent or Smart Vent centre pull rip line will cause the balloon to empty very quickly and could cause damage and/or injuries if this limitation is ignored.

The balloon was also fitted with rotation vents on the side of the envelope which the pilot could operate to orientate the balloon during flight. These vents were used to ensure that the long side of the basket was perpendicular to the direction of travel during landing.

Pilot information

The pilot held a commercial pilot licence (balloon), with significant balloon piloting experience which included 3,000 hours of flying, of which 300 hours were on the Kavanagh B-350. In the previous 90 days, the pilot had flown 26 hours, including 18 on the B-350.

Meteorological information

Weather considerations

A temperature inversion is a layer of air in which the temperature increases with height, rather than decreasing as is normal. A low-level or surface inversion occurs when the ground cools overnight by radiating heat, also cooling the layer of air closest to the ground. These low-level inversions form a stable layer of air, typically extending a few hundred feet and prevent the higher altitude wind from mixing with the lower level winds near the ground.

An inversion layer can dissipate when the ground is heated by the sun, which allows the higher altitude winds, with relatively higher speed, to mix down towards the earth’s surface. It is for this reason that balloon pilots aim to conduct flights before an inversion layer breaks down and wind conditions deteriorate.

The Civil Aviation Safety Authority (CASA) advisory circular AC 131-02v2.0 Manned free balloons - Operations provided the following guidance on the stability of the atmosphere:

Paragraph 3.2.18. Thermals and atmospheric instability can seriously affect the safety of flight in lighter‑than‑air aircraft. In conditions of higher ambient temperatures, such as can exist in the summer months, pilots should be aware of the possibility that flying conditions may change very quickly as the temperature rises.

Paragraph 3.2.19. Pilots preparing to conduct a flight in higher ambient temperatures, when atmospheric instability may exist during the planned flight or on landing, should access as many local weather information sources and meteorological forecasts as practicable. Pilots should pay attention to any forecast temperature and humidity increases in the forecast period and be prepared to amend the flight plan.

Pre-flight

The pilot recorded the information provided by the Bureau of Meteorology (BoM) telephone briefing on the morning of the flight. These included:

  • Coldstream temperature observation 12.9 °C (at 0420)
  • Surface wind from north-northeast at 5 kt for the expected flying time (0600-0700)
  • 2,000 ft wind from north-northwest at 20-25 kt

The pilot also received information from another balloon pilot[2] that the inversion layer would be starting to break down earlier than usual but still after the expected landing time.

The pilot completed a pre-flight load chart, recording a surface temperature of 16 °C and with sufficient lifting capacity available to conduct the flight. The ATSB review of the balloon’s load chart indicated that the lifting capacity for the balloon was sufficient to conduct flights up to 4,000 ft with a surface temperature of up to 23 °C.

Forecast

The Yarra Valley Meteogram[3] showed 100 ft wind from north-northeast at 5 kt for the expected flying time. The F160 model forecast indicated a temperature inversion at about 800 ft AMSL, with wind speeds above the inversion increasing with height (10-30 kt). The inversion was forecast to break down between 0900 and 1100.

Data and observations

The balloon’s GPS unit recorded the balloon’s velocity (and thus wind speed and direction) during the flight. In the final 10 minutes of the flight between 0 and 150 ft AGL, the balloon’s speed varied between 9 and 17 kt.

The pilot described the wind conditions during the latter portion of the flight as ‘gusty’ and that the reason for the unintended touchdown with the ground just before the final landing might have been due to turbulent wind on the leeward side of the small hill the balloon floated over.

Passenger safety briefings

The operator’s Operation’s Manual (OM) and Emergency Procedure’s Manual (EPM) contained the following information on passenger safety briefings:

Passengers are to be briefed on the ballooning experience in general and safety aspects of ballooning (for example, the fan, landing positions, exiting the basket). Pilots should make use of the PTB checklists and briefing cards found on board all PTB balloon baskets.

Brief passengers inside the basket on landing positions before take-off (passengers must practise and demonstrate the landing position)

Assume you will always have a difficult landing so be confident that all passengers can take their landing positions without a further briefing.

Before landing, brief the passengers on the landing procedure.

During emergency landings, advise passengers to expect a hard landing and instruct them into the brace position with knees bent.

Safety briefing cards

Civil Aviation Order 20.11[4] (Emergency and lifesaving equipment and passenger control in emergencies) required that passenger safety information cards be available to passengers on any charter flight with a seating capacity greater than 6. It stated that the cards must be carried in a convenient location and detail the passenger brace position for an emergency landing.

The operator’s OM and EPM manuals outlined that each balloon was to carry a passenger briefing card which was to be mounted inside the basket and available at the meeting point.

The briefing cards provided information on balloon safety, including landing instructions, and a pictorial representation of the body position to adopt during landing (Figure 4).

Figure 4: Operator safety briefing card

Operator safety briefing card


Source: Picture This Ballooning, annotated by ATSB

Pre-flight briefing

Advisory circular AC 131-02v2.0 provided guidance on pre-flight briefings:

Paragraph 4.1.6.2…The safety briefing will usually be conducted by the PIC and should include the following:

an instruction and demonstration of the landing position, appropriate to the balloon design, that a passenger must adopt for landing.

…an instruction to flex the knees on touch down to minimise the effect of any impact during landing.

The pilot reported that a verbal pre-flight briefing about the landing positions was provided to the passengers while they were in the basket and included instructions to hold onto the rope handles, bend the knees, that there might be multiple bounces during the landing, and that the basket might tip over and drag.

The balloon was fitted with a video camera that captured images before and during the flight at 5 second intervals. The images during the pre-flight briefing did not appear to show the passengers demonstrating the landing position, and not all passengers reported being asked to provide the pilot with a physical demonstration. The pilot advised that the passengers were possibly not asked to demonstrate the landing positions as there was some time pressure during take-off due to the forecast weather. The pilot also assumed that verbal instructions for the passengers on‑board (all reported to be English speaking) would be sufficient to understand the landing positions. The two passengers injured during the hard landing reported that the briefing felt rushed without a lot of emphasis on the landing position.

The passengers were not asked to review the safety briefing cards before or during the flight. The pilot reported not using the cards during recent pre-flight briefings because the passengers on these flights had primarily been English speaking and the pilot believed that the briefing cards were only effective with non-English speaking passengers.

Pre-landing briefing

Advisory circular AC 131-02v2.0 provided guidance on pre-landing briefings:

Paragraph 4.1.6.5. On final approach to landing the PIC should ensure all passengers are comfortable in the landing position and be prepared to correct any anomalies before touch-down.

During the pre-landing briefing, the pilot:

  • instructed passengers to adopt the landing positions during the approach
  • visually checked that the passengers were in the landing positions
  • re-iterated at appropriate times to stay in the landing positions
  • warned that there was going to be a hard landing.

Most passengers recalled being verbally instructed to adopt the landing positions and after the initial bounce, being told to brace for a hard landing. Both passengers that were subsequently injured interpreted the hard landing instruction to mean they needed to crouch down deep into the basket and brace.

Landing positions

The landing position on the operator’s safety briefing cards was a similar position to that recommended by the United Kingdom Civil Aviation Authority (CAA)[5] for the double T-partitioned basket and required a passenger’s back to be facing the direction of travel with knees bent at an angle of less than 90 degrees (Figure 5). The research conducted to support the CAA recommendation[6] found the backwards facing landing position reduced the risk of injury compared to the sideways facing position (Figure 6) during heavy and tip-over landings.[7]

Figure 5: Recommended landing position (double T-partitioned basket)

Figure 5: Recommended landing position (double T-partitioned basket)


Source: United Kingdom Civil Aviation Authority, annotated by ATSB

Figure 6: Sideways landing position (double T-partitioned basket)

Sideways landing position (double T-partitioned basket)

Source: United Kingdom Civil Aviation Authority, annotated by ATSB

Flight camera images showed the passengers facing sideways during the pre-flight briefing, and before the initial touchdown. Just before this touchdown, the two passengers that were subsequently injured lowered themselves further into the basket than the other passengers who remained more upright. The long side of the basket was orientated perpendicular to the direction of flight during the initial touchdown as shown (Figure 6). After the first touchdown, the two injured passengers, and another one, lowered themselves further into the basket, probably crouching in a deep squat position with the knees bent more than 90 degrees. They remained in those positions during the final landing.

The basket contained internal padding to support passengers’ backs during landing but did not extend all the way to the basket floor. One of the injured passengers reported that one foot slid under the padding during the hard landing and possibly contributed to the injury.

The Australian Ballooning Federation Pilot Training Manual stated that a descent rate greater than 400 feet per minute on landing could cause personal injury and damage the equipment. The ATSB determined that during the final landing the average descent rate was at least 470 feet per minute. Just before the balloon landed, the balloon had turned such that the long edge of the basket was orientated about 50° from the direction of travel (Figure 7).

Figure 7: Basket orientation during final landing

Basket orientation during final landing

Source: United Kingdom Civil Aviation Authority, annotated by ATSB

Number of passengers

The balloon’s flight manual included the following passenger limitations:

Partitioned baskets are limited to a maximum of 6 people per passenger compartment and 2 flight crew in the pilot compartment.

All occupants must have access to a minimum of one hand hold eg: rope handle or tank rim.

All occupants must have reasonable space to achieve a safe landing position and reasonable comfort levels during the flight.

The operator’s OM included information on the maximum ‘passenger seats’ available for each balloon within the fleet. The passenger capacity for VH-BSW was 17. The operator advised that the following factors were used when determining the maximum passenger capacity:

  • maximum total passenger weight for each balloon envelope based on its condition.
  • number of rope handles – minimum of 2 handles per passenger
  • flight manual considerations

The camera images showed that there were 4 passengers located in each passenger compartment, and review of the passenger load charts were all within balloon weight limitations.

The pilot stated that the passengers were instructed into sideways facing landing positions during the pre-flight briefing because the number of passengers on board meant that they physically could not adopt a backwards facing position. A review of the camera images confirmed that it was unlikely that all passengers could have physically achieved a backwards facing landing position. The images and passenger weights indicated that some passengers were of above average size, and some below average, so combined represented a typical group of passengers.

The pilot reported instructing passengers into the backwards facing position for previous flights on VH-BSW as there were less passengers and enough space for them to achieve this position.

Balloon landing considerations

The United States’ FAA Balloon Flying Handbook, Chapter 8 – Landing and Recovery provided the following advice on landing considerations:

When selecting a landing site, three considerations in order of importance are: safety of passengers, as well as persons and property on the ground; landowner relations; and ease of recovery.

The best landing site is one that is bigger than the balloon needs and has alternatives. If the balloon has three prospective sites in front of it, the pilot should aim for the one in the middle in case the surface wind estimate was off. If the balloon has multiple prospective landing sites in a row along its path, the pilot should take the first one and save the others for a miscalculation. Unless there is a 180° turn available, all the landing sites behind are lost.

When faced with a high wind landing, the balloon pilot must remember that the distance covered during the balloon’s reaction time is markedly increased… A pilot who is not situationally aware and fails to recognize hazards and obstacles at an increased distance may be placed in a dangerous situation with rapidly dwindling options.

The balloon’s flight manual also stated the following regarding the approach to land:

A suitably large landing site should be selected, free of obstacles such as power lines, buildings and livestock. The overshoot area (downwind of the landing) should be free from high obstacles where possible in case the landing has to be aborted.

When a fast landing is anticipated extra space will be required for the potential drag and deflation of the balloon and a low approach should be favoured to minimise the vertical speed during landing.

Landowner relationships

Much of the land within the Yarra Valley suitable for hot air balloon use was privately owned, potentially containing the source of the livelihood of the landowners (for example, livestock and crops). In order to avoid problems such as trespassing, commercial balloon operators developed good relationships with landowners to permit take-offs, landings, and recovery of passengers and equipment from their properties. Some properties were approved for landing while others were not. Balloon pilots generally avoid landing in fields with livestock and crops to maintain good landowner relationships.

Information on maintaining positive landowner relationships was contained in the operator’s OM:

Good landowner/farmer relationships are imperative for the continued operation of Picture This Ballooning.

Maintain a map marked with the landing sites wherein the owner has given approval where practicable.

Select a landing field that should cause the least possible inconvenience to the landowner.

The pilot stated that in an emergency, the primary concern was the safety of passengers, and a landing could be made at any place considered practical – even if this occurred on a property not approved by a landowner. If there was no emergency, landing a balloon on a crop or a non‑approved property could create problems for future balloon operations.

Potential landing sites

The pilot acknowledged that apart from the final landing location, there were other potentially suitable landing sites along the balloon’s path but did not consider that the wind conditions warranted an attempt to land in these fields. These sites were rejected as one had cattle, another had locked gates that would have posed logistical problems with passengers and balloon retrieval, while others had been seeded for crops (Figure 8). These fields were longer than the final landing site and had no power lines nearby.

The pilot also stated that the final landing field was the last known landing site along the balloon’s path, and that beyond this, the potential landing fields were smaller. A review of the flight track indicated that built up suburban areas were about 3 km further along the flight path from the balloon’s final landing location.

Figure 8: Flight track with potential landing sites

Flight track with potential landing sites

Source: Google Earth, annotated by ATSB

Power lines

The Australian Ballooning Federation ABF Pilot Training Manual, Part 5 – Aerostatics and Airmanship included the following information regarding power lines:

Contact with power lines should be very carefully avoided. Any voltage can cause fatal or very serious injuries.

IF IN DOUBT, RIP OUT. If there is any doubt about your ability to clear the wires, make an emergency landing without hesitation. Pull the ripline as you warn passengers to hold on for landing, and turn off pilot lights and vent fuel hoses if there is time. There is considerably less risk of injury, fire and electrocution if the envelope contacts the wires than if the basket does.

The pilot was aware of the location of power lines downwind of the final landing field before committing to land in that field. The pilot stated that although using the parachute vent was standard procedure during an approach to land, its use during the final landing sequence might not have descended the balloon fast enough to avoid contacting the power lines. Further, attempting to ascend over the lines would be dangerous given the balloon’s distance and height from the lines. The pilot considered that the immediate use of the rip line was necessary to avoid contacting the power lines.

Similar occurrences

ATSB Investigation AO-2011-045

On 2 April 2011, during a scenic charter flight and while operating at low level, the pilot of a Kavanagh Balloons E‑210 hot-air balloon, registered VH-OTZ, was unable to arrest the balloon's descent and initiate a climb in time to avoid powerlines, requiring an emergency descent and landing. The balloon landed hard in a paddock with the basket not orientated correctly to the direction of flight. It bounced, dragged and inverted along a distance of 60 m, resulting in injuries to the occupants and minor damage to the basket.

ATSB investigation AO-2018-016

On 8 February 2018, a Kavanagh Balloons B-350, registered VH-EUA, departed Glenburn, Victoria for a scenic charter flight with a pilot and 15 passengers on board. About 45 minutes into the flight, over the Yarra Valley, the balloon experienced a sudden wind change with associated turbulence. The pilot decided to land immediately resulting in a hard and fast landing. Eleven passengers were injured, 4 of them seriously.

Although some passengers were provided with a safety briefing prior to boarding the balloon, the operator’s normal safety briefing for passenger’s post boarding was not conducted. In addition, the briefing prior to boarding was not effective in ensuring all passengers understood the required landing position to use for an emergency landing. The ATSB identified a safety issue with the operator’s risk controls which did not provide assurance that all passengers would understand the required procedures for emergency landings.

__________

  1. That balloon pilot had reportedly received this weather information from the BoM.
  2. The BoM had not retained a copy of the Yarra Valley Meteogram available on the morning of the flight. However, a Meteogram was generated for the investigation using archived weather data.
  3. Civil Aviation Safety Regulation Part 131 was released on 2 December 2021. However, because the Part 131 Manual of Standards was deferred, CAO 95.53 was still effective at the time of the accident which included the requirement to comply with CAO 20.11.
  4. United Kingdom Civil Aviation Authority (2007), Balloon Notice 1/2007, Passenger Landing Position Guidance to Operators, available from the UK CAA website
  5. United Kingdom Civil Aviation Authority (2006), CAA Paper No. 2006/06, Evaluation of and Possible Improvements to Current Methods for Protecting Hot-Air Balloon Passengers During Landings, available from the UK CAA website.
  6. When an obstacle is hit in the double T-partitioned basket, the backwards landing position was found to increase the risk of injury when compared to the sideways facing position. However, heavy and tip-over landings were found to be more common, so the backwards facing position was considered the overall safest position to adopt. A heavy landing was defined as having a horizontal speed of 10 kt and descent rate of 500 feet per minute. A tip-over landing was defined as having a horizontal speed of 10 kt and descent rate of 300 feet per minute.

Safety analysis

On 31 December 2021, a Kavanagh B-350 hot-air balloon, registered VH BSW and operated as a scenic charter flight by Picture This Ballooning (PTB), was being prepared near Glenburn, north of the Yarra Valley, Victoria, with one pilot and 16 passengers. The pilot conducted a pre-flight safety briefing and departed shortly after, intending to land near Yarra Glen.

About 42 minutes into the planned 1‑hour flight, the pilot received a report that the surface wind near the landing area was increasing. The pilot assessed multiple landing options over the next 17 minutes while the wind was increasing. The pilot then made an approach to a landing field and the balloon landed hard with 2 passengers seriously injured.

Landing areas

The forecast weather indicated that the conditions were suitable for the flight. However, after descending into the valley, the balloon’s relatively high speed at low level indicated that the inversion layer had started to break down earlier than forecast. Despite this, the wind conditions were still suitable to conduct a safe landing.

Since the wind conditions would probably degrade further, it would have been prudent for the pilot to select a large field with minimal obstacles and alternative landing sites nearby as a backup. However, the pilot rejected several large landing sites to avoid probable logistical difficulties with passenger and balloon retrieval or perceived negative impact on future operator-landowner relationships, which progressively reduced the number of safe landing sites available. Rejecting these landing sites, particularly the last two large seeded fields, in favour of a relatively small field with fences, power lines downwind, and no known alternate sites, increased the risk of obstacle collision and a hard landing in the prevailing wind conditions.

Hard landing

The final approach to land was initially complicated by the balloon descending faster than intended and touching down unintentionally in a seeded field before rising back into the air. Whether this descent was from excessive use of the parachute vent during the approach, insufficient burner application, the turbulent wind on the leeward side of the small hill, or a combination of all three, could not be determined.

The burner application to arrest the initial descent would have slowed the vertical descent rate, which was desirable, but also filled the balloon with hot air, increasing the rate of ascent after the touchdown and risk of contacting the power lines. After the balloon rose back into the air, the normal landing procedure was to use the parachute vent, and then pull the rip line when the balloon was close to the ground. However, the pilot started pulling immediately on the rip line to quickly descend the balloon and avoid the power lines. Although different to standard procedure, the use of the rip line was reasonable in the situation, but reduced control of the balloon’s final rate of descent.

Further complicating the situation was the late identification of a fence during the approach. This fence needed to be manoeuvred over and probably contributed to an increase in the maximum height that the balloon reached after the first touchdown. With the relatively high wind conditions and the distance to the powerlines reducing, the pilot pulled the rip line further resulting in the rapid descent and hard landing. While undesirable, the hard landing was the safer option instead of risking contact with the power lines.

During the final landing sequence, the balloon turned so that the long side of the basket was not orientated optimally, ideally with the direction of flight, possibly due to the wind or rapid loss of air through the vent. This orientation during the hard landing probably reduced the effectiveness of the handholds and landing position in preventing passenger movement, increasing the risk of injury. Further, although the pilot might have visually checked the passenger positions during the initial approach to land, it is unlikely the pilot re-checked their positions after the initial balloon touchdown. While rechecking passenger positions and orientating the basket correctly would have reduced the risk of injury, there was little time available, and the pilot was focussed on the more important task of controlling the balloon to avoid hazardous obstacles.

Pre-flight briefing

On every balloon flight, passengers need to adopt a specific body position during landing to reduce the likelihood and severity of injury. There are limited opportunities for a pilot to demonstrate or reinforce this briefing during flight so passenger preparation during the pre-flight briefing is critical. Although the pilot provided a verbal briefing of the landing position to the passengers before the flight, the required passenger landing position demonstration and use of briefing cards were omitted. The pilot probably missed these important steps because of time pressure and an incorrect assumption that all passengers would fully understand a verbal briefing.

This incomplete briefing reduced the likelihood of all passengers understanding the landing position, and probably resulted in some passengers not adopting the instructed body position during the hard landing, resulting in injuries to 2 passengers who adopted a deep squat position.

Passenger landing positions

Being able to achieve a safe landing position is an important consideration for every flight. Although the passengers:

  • represented a typical group of adult passengers
  • had sufficient handholds
  • were within the balloon’s weight limitations
  • were within the operator maximum passenger limits

the operator’s required safe landing positions (backwards facing) could not be physically achieved by all the passengers. Consequently, during the pre-flight briefing, the pilot instructed all the passengers to take a sideways facing landing position. This positioning in that type of basket increased the risk of injury during landing. However, since all the passengers were in a sideways facing position during the hard landing without any reported injuries, except for the 2 passengers injured who were also crouching down in a deep squat position, it is unlikely that the sideways facing position contributed to their injuries.

Findings

ATSB investigation report findings focus on safety factors (that is, events and conditions that increase risk). Safety factors include ‘contributing factors’ and ‘other factors that increased risk’ (that is, factors that did not meet the definition of a contributing factor for this occurrence but were still considered important to include in the report for the purpose of increasing awareness and enhancing safety). In addition ‘other findings’ may be included to provide important information about topics other than safety factors. 

Safety issues are highlighted in bold to emphasise their importance. A safety issue is a safety factor that (a) can reasonably be regarded as having the potential to adversely affect the safety of future operations, and (b) is a characteristic of an organisation or a system, rather than a characteristic of a specific individual, or characteristic of an operating environment at a specific point in time.

These findings should not be read as apportioning blame or liability to any particular organisation or individual.

From the evidence available, the following findings are made with respect to the hard landing involving Kavanagh Balloons B-350, VH BSW, 2 km south of Lilydale Airport, Victoria on 31 December 2021.

Contributing factors

  • The pilot rejected several suitable landing fields to avoid possible post-landing logistical and operational difficulties. This progressively reduced the safe landing sites available to the pilot.
  • The field in which the pilot decided to land contained fences not previously known to the pilot, powerlines downwind, and no known landing sites further along the balloon's track. This landing site presented high risks in the prevailing windy conditions.
  • The landing was complicated by the balloon descending faster than intended, bouncing off the ground back into the air, and then manoeuvres to clear fences. This, in combination with the prevailing winds and nearby power lines, led to the pilot descending the balloon rapidly from an excessive height resulting in the hard landing.
  • All required actions of the pre-flight passenger safety briefing were not completed, probably due to time pressure and the pilot’s assumption that all passengers would understand an abbreviated briefing. The incomplete briefing probably resulted in 2 passengers adopting a deep squat position during the hard landing, causing their injuries.

Other factors that increased risk

  • The balloon landed hard with the basket not orientated optimally to the direction of flight, increasing the risk of injury.
  • The maximum number of passengers that the balloon operator allowed to be carried meant that there was insufficient room in the basket for them to adopt the landing position specified in the operator's procedures to reduce the risk of injury. (Safety issue)

Safety issues and actions

Central to the ATSB’s investigation of transport safety matters is the early identification of safety issues. The ATSB expects relevant organisations will address all safety issues an investigation identifies.

Depending on the level of risk of a safety issue, the extent of corrective action taken by the relevant organisation(s), or the desirability of directing a broad safety message to the aviation industry, the ATSB may issue a formal safety recommendation or safety advisory notice as part of the final report.

All of the directly involved parties were provided with a draft report and invited to provide submissions. As part of that process, each organisation was asked to communicate what safety actions, if any, they had carried out or were planning to carry out in relation to each safety issue relevant to their organisation.

Descriptions of each safety issue, and any associated safety recommendations, are detailed below. Click the link to read the full safety issue description, including the issue status and any safety action/s taken. Safety issues and actions are updated on this website when safety issue owners provide further information concerning the implementation of safety action.

Passenger brace positions

Safety issue number: AO-2022-003-SI-01
Safety issue description: The maximum number of passengers that the balloon operator allowed to be carried meant that there was insufficient room in the basket for them to adopt the landing position specified in the operator's procedures to reduce the risk of injury.

Glossary

AGL                 Above Ground Level

AMSL               Above Mean Sea Level

BoM                 Bureau of Meteorology

CAA                 Civil Aviation Authority (United Kingdom)

CASA               Civil Aviation Safety Authority

EM                   Emergency Procedure’s Manual

GPS                 Global Positioning System

OM                   Operation’s Manual

Sources and submissions

Sources of information

The sources of information during the investigation included the:

  • pilot
  • passengers
  • Picture This Ballooning (the operator)
  • Civil Aviation Safety Authority
  • Bureau of Meteorology
  • video images from the accident flight
  • recorded data from the GPS unit on the aircraft.

References

ABF (Australian Ballooning Federation) (2019), ABF Pilot Training Manual, ABF

FAA (Federal Aviation Administration) (2008), Balloon Flying Handbook, FAA-H-8083-11A, FAA

CAA (Civil Aviation Authority) (2006), Evaluation of and Possible Improvements to Current Methods for Protecting Hot-Air Balloon Passengers During Landings, CAA Paper No. 2006/06, CAA United Kingdom

CAA (Civil Aviation Authority) (2007), Passenger Landing Position Guidance to Operators, Balloon Notice 1/2007, CAA United Kingdom

CASA (Civil Aviation Safety Authority), (2021), Manned free balloons – Operations, Advisory Circular AC 131-02v2.0, CASA

Submissions

Under section 26 of the Transport Safety Investigation Act 2003, the ATSB may provide a draft report, on a confidential basis, to any person whom the ATSB considers appropriate. That section allows a person receiving a draft report to make submissions to the ATSB about the draft report.

A draft of this report was provided to the following directly involved parties:

  • pilot
  • Picture This Ballooning (the operator)
  • Civil Aviation Safety Authority
  • Australian Ballooning Federation
  • the injured passengers.

Submissions were received from:

  • Civil Aviation Safety Authority
  • the injured passengers.

The submissions were reviewed and, where considered appropriate, the text of the report was amended accordingly.

Purpose of safety investigations

The objective of a safety investigation is to enhance transport safety. This is done through:

  • identifying safety issues and facilitating safety action to address those issues
  • providing information about occurrences and their associated safety factors to facilitate learning within the transport industry.

It is not a function of the ATSB to apportion blame or provide a means for determining liability. At the same time, an investigation report must include factual material of sufficient weight to support the analysis and findings. At all times the ATSB endeavours to balance the use of material that could imply adverse comment with the need to properly explain what happened, and why, in a fair and unbiased manner. The ATSB does not investigate for the purpose of taking administrative, regulatory or criminal action.

Terminology

An explanation of terminology used in ATSB investigation reports is available here. This includes terms such as occurrence, contributing factor, other factor that increased risk, and safety issue.

Publishing information 

Released in accordance with section 25 of the Transport Safety Investigation Act 2003

Published by: Australian Transport Safety Bureau

© Commonwealth of Australia 2022

image_5.png

Ownership of intellectual property rights in this publication

Unless otherwise noted, copyright (and any other intellectual property rights, if any) in this report publication is owned by the Commonwealth of Australia.

Creative Commons licence

With the exception of the Coat of Arms, ATSB logo, and photos and graphics in which a third party holds copyright, this publication is licensed under a Creative Commons Attribution 3.0 Australia licence.

Creative Commons Attribution 3.0 Australia Licence is a standard form licence agreement that allows you to copy, distribute, transmit and adapt this publication provided that you attribute the work.

The ATSB’s preference is that you attribute this publication (and any material sourced from it) using the following wording: Source: Australian Transport Safety Bureau

Copyright in material obtained from other agencies, private individuals or organisations, belongs to those agencies, individuals or organisations. Where you wish to use their material, you will need to contact them directly.

Occurrence summary

Investigation number AO-2022-003
Occurrence date 31/12/2021
Location 2 km south of Lilydale Airport
State Victoria
Report release date 18/08/2022
Report status Final
Investigation level Defined
Investigation type Occurrence Investigation
Investigation status Completed
Mode of transport Aviation
Aviation occurrence category Hard landing
Occurrence class Accident
Highest injury level Serious

Aircraft details

Manufacturer Kavanagh Balloons
Model B-350
Registration VH-BSW
Serial number B350-399
Aircraft operator PICTURE THIS BALLOONING PTY. LTD.
Sector Balloon
Operation type Part 131 Balloons and hot air airships
Departure point Glenburn, Victoria
Destination Yarra Valley, Victoria
Damage Nil

Cabin crew incapacitation involving Fokker F100, VH-FNU, near Mount Magnet Airport, Western Australia, on 27 December 2021

Discontinuation notice

Report release date: 12/04/2022

Section 21 (2) of the Transport Safety Investigation Act 2003 (TSI Act) empowers the ATSB to discontinue an investigation into a transport safety matter at any time. Section 21 (3) of the TSI Act requires the ATSB to publish a statement setting out the reasons for discontinuing an investigation The statement is published as a report in accordance with section 25 of the TSI Act, capturing information from the investigation up to the time of discontinuance.

Overview of the investigation

On 27 December 2021, a Fokker F100, registered VH-FNU, was being operated on a scheduled passenger flight between Newman and Perth, Western Australia. There were 5 crew and 7 passengers on board.

During cruise at flight level (FL) 340 (34,000 ft), a cabin crew member began to feel unwell and was treated with portable oxygen by the other cabin crew members. Suspecting air sickness due to light turbulence, the flight crew climbed to FL350. A few minutes later the other two cabin crew members also began feeling unwell and reported to the flight crew that they suspected possible hypoxia.

The first officer later reported that they also felt light-headed and experienced slight nausea. As a precaution, the flight crew donned oxygen masks, manually deployed the passenger oxygen masks and conducted an emergency descent to 10,000 ft. The aircraft landed at Perth Airport and one cabin crew member was taken to hospital for assessment. The passengers did not report any symptoms to the crew.

As part of its investigation, the ATSB:

  • interviewed the flight and cabin crew
  • analysed recorded data from the aircraft’s flight data recorder (FDR)
  • reviewed the aircraft maintenance records
  • reviewed air traffic control recordings
  • reviewed other depressurisation occurrences involving Fokker 100 aircraft
  • reviewed post-occurrence testing and evaluation reports from the aircraft manufacturer for the cabin indication panel
  • reviewed the material safety data sheets and the possibility of a dangerous goods spill.

Additional information

Recorded data

According to the FDR data, about 50 minutes after establishing cruise at FL340 the aircraft climbed to FL350, which took about 1 minute. The aircraft remained at this level for 3.5 minutes and then descended to 10,000 ft over a 5-minute duration (during the emergency descent). This aligned with flight crew and cabin crew recollections.

The parameters that were available for analysis from the FDR did not include the cabin altitude or cabin differential and did not provide detail about the cabin altitude at the time of the event. The FDR recorded any cabin altitude warnings; none activated during the flight. 

Pressurisation system

  • The normal cabin altitude for the Fokker F100 at FL350 is 8,000 ft.
  • The flight crew recalled that the cabin altitude reached about 8,300 ft.
  • The excessive cabin altitude warning (which activates at 10,000 ft) did not activate during the flight.
  • The drop-down cabin oxygen masks automatically deploy at a cabin altitude of 13,500 ft on the Fokker F100 aircraft. The masks did not automatically deploy and were manually deployed by the flight crew.

Maintenance inspection results

Inspections and tests were conducted in accordance with the aircraft maintenance manual and in consultation with the aircraft manufacturer. Although there were defects identified, none were considered contributory to a depressurisation event or to the symptoms and subsequent incapacitation reported by the crew members. Several components were changed as a precaution.

ATSB comment

The available evidence indicates that the aircraft’s cabin altitude remained below 10,000 ft. The reasons for the cabin crew and flight crew symptoms could not be established.

The decision by the flight crew to don oxygen masks and descend to a safe altitude was sound. If there is any doubt as to whether the flight crew’s ability to operate the aircraft may be affected by a possible oxygen supply problem, the safest course of action is to go onto oxygen as soon as possible.  

Reasons for the discontinuation

Based on a review of the available evidence, the ATSB considered it was unlikely that further investigation would identify any systemic safety issues or important safety lessons. Consequently, the ATSB has discontinued this investigation.

The evidence collected during this investigation remains available to be used in future investigations or safety studies. The ATSB will also monitor for any similar occurrences that may indicate a need to undertake a further safety investigation.

Occurrence summary

Investigation number AO-2022-002
Occurrence date 27/12/2021
Location 28 NM 209 degrees from Mount Magnet Airport
State Western Australia
Report release date 12/04/2022
Report status Discontinued
Investigation level Short
Investigation type Occurrence Investigation
Investigation status Discontinued
Mode of transport Aviation
Aviation occurrence category Crew incapacitation
Occurrence class Serious Incident
Highest injury level Minor

Aircraft details

Manufacturer Fokker B.V.
Model F28 MK 0100
Registration VH-FNU
Serial number 11373
Aircraft operator VIRGIN AUSTRALIA REGIONAL AIRLINES PTY LTD
Sector Jet
Operation type Air Transport High Capacity
Departure point Newman Airport, Western Australia
Destination Perth Airport, Western Australia
Damage Nil

Collision between banking locomotives and grain train 5446, near Werris Creek, New South Wales, on 6 January 2022

Final report

Report release date: 20/08/2024

Office of Transport Safety Investigations logo
This investigation was conducted under the Transport Safety Investigation Act 2003 (Commonwealth) by the Office of Transport Safety Investigations (NSW) on behalf of the ATSB in accordance with the Collaboration Agreement. 

Executive summary

What happened

On 6 January 2022, freight train 5446, operated by Southern Shorthaul Railroad (SSR), departed from Narrabri West for Bullock Island at Newcastle, New South Wales. Due to a steep uphill gradient en route, three additional (banking) locomotives were attached to the rear of 5446 at Werris Creek.

Shortly after departure from Werris Creek, the banking locomotives separated from the rear of the train. Although the brakes automatically applied on both the lead portion of 5446 and the separated banking locomotives, the driver of the banking locomotives released this brake application. As a result, after the lead portion of 5446 had stopped, the banking locomotives collided with the rear of 5446. Significant damage to rolling stock resulted from the collision. 

What the ATSB found

The cause of the train separation was highly likely due to the knuckle on the bottom operated coupler of the lead banking locomotive remaining unlocked after coupling. A stretch test, which would have identified the unlocked state of the knuckle, was not performed. It was found that the crew member who performed the shunt did not have a full understanding of automatic coupler operation. In addition, it could not be determined that the banking locomotive crew had previously demonstrated a sufficient level of competence in a stretch test procedure, either with SSR or previous operators. 

After the separation event, the response taken by the banking locomotive’s driver in relation to the sudden loss of brake pipe pressure was, while inappropriate for the situation, consistent with their training and SSR’s emergency response procedures. These procedures did not differentiate between head end only and banking train operations. The appropriate response during an emergency for these differing operations can be vastly different. 

Lastly, it was found that SSR’s risk assessments for this operation were mostly performed by members of the management team. While the team had varying levels of operational experience, consultation with operational staff directly affected by the operation did not occur. This had the potential for risks to be missed during the risk assessment process.

What has been done as a result

In response to the safety issues raised, SSR took safety action to:

  • provide train crew with reference materials related to coupler functionality
  • defined the process for a ‘stretch test’ after coupling and other shunting terms
  • contextualised emergency procedures for banking operations
  • further defined the need for adequate consultation during material change.

While not related to a safety issue, both Southern Cross Civil and Rail Training and Pacific National took the opportunity to review and update their training materials in shunting operations, in response to safety factors identified within the report.

Safety message

The competence of rail safety workers is critical to safe railway operations. Where competency assessments are aligned to the Australian Qualifications Framework (AQF), certain standards must be met. These include, in part, that sufficient assessment evidence be collected to ensure a reliable competency decision can be made. In the absence of an alternative and equivalent method, rail transport operators should follow these same principles when delivering enterprise‑based assessments.

Further, during assessment of risk, consultation consisting of effective and meaningful engagement with stakeholders is key to ensuring risks are identified and appropriate controls are implemented. In instances of unique operations, this engagement becomes critical in identifying novel risks which may not be immediately apparent. Particular attention should be given to procedures utilised in past operational environments, to ensure their ongoing appropriateness in these unique operational circumstances.


The occurrence

Arrival at Werris Creek

On 6 January 2022, freight train 5446, operated by Southern Shorthaul Railroad (SSR), departed from Narrabri West (565.750 km),[1] New South Wales for Bullock Island (170.298 km) at Newcastle, New South Wales. The train was powered by three diesel electric locomotives hauling 49 wagons loaded with export wheat.

About 0620,[2] train 5446 stopped on the mainline at Werris Creek (410.800 km) clear of the station platform to allow for a crew change and the attachment of three banking locomotives,[3] based at Werris Creek. The banking locomotives were to be attached to the rear of 5446 to provide additional traction power for the heavy uphill grade from Chilcotts Creek (372.300 km) to Ardglen (363.300 km) (see Figure 1).

Figure 1: Location of banking operations

Figure 1: Location of banking operations

 Source: John Holland, annotated by OTSI

The crew of the banking locomotives consisted of a trainee driver (driving) who signed on at Muswellbrook at 0315, and a mentor driver (supervising), who signed on at Werris Creek at 0445. 

At 0623, the network control officer (NCO) cleared the signal to allow the awaiting banking locomotives on the Armidale side of the station platform to proceed onto the rear of 5446 and attach. The trainee driver of the banking locomotives then moved the locomotives towards the rear of 5446, stopping about 20 m short to allow the mentor driver to alight and perform the on-ground coupling duties.

The trainee driver, under radio instruction from the mentor driver, then moved the banking locomotives onto the rear of 5446 and coupled. Closed circuit television (CCTV) showed that the banking locomotives moved slightly away from the rear of 5446 after coupling, with the mentor driver briefly looking away from the train at this time. The locomotive’s data logger confirmed that the banking locomotive’s independent brake[4] was partially applied. The direction controller remained in reverse which meant a stretch test[5] of the couplers was not performed at that time. The CCTV also showed that the weather was fine, with morning daylight conditions.

The mentor driver then coupled the brake pipe hoses between the last wagon of 5446 and the lead banking locomotive (L277) for train braking purposes. The lead crew of 5446 then performed a brake pipe continuity test[6] with the banking locomotive crew, which verified the brakes were continuous and working throughout the train.

At 0640, the lead crew of 5446 was changed. The rear banking locomotive crew remained unchanged.

Departure from Werris Creek

At 0642, train 5446 departed Werris Creek with three locomotives at the front hauling the 49 loaded grain wagons, and three locomotives attached at the rear for banking purposes. The trainee driver and mentor driver were in the banking locomotive at the very rear of the train, facing the track in the opposite direction of travel. Communications between train crew en route (between the lead and banking crews) regarding signal aspects observed at the front and power requirements from the banking locomotives at the rear, was conducted using radio communications on a discrete SSR channel. The driver of the lead locomotive initiated all train braking commands.

As there was an uphill grade for almost 4 km on departure from Werris Creek, both the front and banking locomotives had power applied on departure, with full power (eight notches) selected at both the front and back of the train about one minute after departure.

After about 407.000 km, the gradient peaked in height and changed to a downhill grade, with two short sections of level/near level grade en route to Quipolly (402.000 km). As a result, at 0647 the lead locomotive commenced a reduction in traction power setting, with idle selected at about 406.500 km. The banking locomotives remained temporarily in full power before the trainee driver commenced traction power reductions, which kept the train under compression.

At 0648:31, with the train now on a downhill gradient, the driver of the lead locomotive engaged dynamic braking[7] and made an automatic brake application at 63 km/h. This enabled a test of the effectiveness of the train’s brakes, in preparation for the steep downhill grade from Ardglen to Pages River. This automatic brake application took effect on the banking locomotives 4 seconds later (Figure 2).[8]

Figure 2: Track profile from Werris Creek to Quipolly 

Figure 2: Track profile from Werris Creek to Quipolly

Overview of the track gradients on departure from Werris Creek, and coinciding events relating to the banking locomotives on 5446.  
Source: ARTC, annotated by OTSI

At 0649:09, with the train’s speed stable at 64 km/h and, coinciding with the banking locomotives tractive power being reduced to a minimum (one notch), the driver of the lead locomotive released the train’s brakes. Seven seconds later, this brake release command took effect on the banking locomotives at the rear of the train.

Separation event

Coinciding with reaching a relatively level piece of track and slowing slightly, at 0649:46 the banking locomotives separated from the rear of train 5446, 7 mins and 5 kms from departure. Most of the train was now on a downhill grade towards Quipolly. 

The consequent separation of the brake pipe hose between the banking locomotives and the train resulted in a sudden loss of all brake pipe pressure on the banking locomotives, resulting in a power control switch (PCS)[9] warning light activation and the three banking locomotives’ brakes automatically applying. The trainee driver observed the PCS warning light and advised the mentor driver of the light activation, with both checking their rear-view mirrors for any issues along the length of the train. As the train was on straight track the separation event was not observed. As no issue had been identified, the trainee driver ‘bailed-off’[10] the brake application to avoid flat wheels[11] as per their training. During this time, the speed of the banking locomotives reduced from the 51 km/h at the time of train separation to 26 km/h. 

Meanwhile, the driver of the leading portion of 5446 observed that the flowmeter[12] on the lead locomotive was registering an air pressure loss to the brake pipe. Although a high brake pipe pressure was maintained, the loss of some brake pipe pressure resulted in the brakes beginning to slowly apply on the wagons, and the train to gradually reduce speed. The driver of the leading portion of the train believed there had been a false activation of the vigilance penalty[13] on one of the trailing lead locomotives, a situation they had encountered with a previous rolling stock operator.[14] The driver, based on this assumption, elected to maintain dynamic braking in anticipation of 5446 coming to a stop. 

At 0650:21, almost 40 seconds after the train separation event, the brakes automatically reapplied on the banking locomotives. The variation in speeds between the two portions of the train had now resulted in a separation distance of 129 m between the rear of 5446 and the banking locomotives. The trainee driver again bailed-off this brake application releasing the brakes on the banking locomotives at 23 km/h. 

At 0650:39, 5446 came to a stop at 404.239 km due to the uncommanded automatic brake application. A 58 m distance now separated the rear of 5446 from the banking locomotives. 

Eight seconds later, as the lead portion driver contacted the banking locomotive crew by radio to advise that 5446 had stopped due to a suspected false vigilance penalty, the banking locomotives collided with the rear of 5446 at 28 km/h. The trainee driver on the banking locomotives immediately advised the lead portion driver that they believed they had derailed. Upon inspection, the banking locomotive crew identified there had been a collision between the banking locomotives and the rear of 5446. 

As a result of the collision, the mentor driver on the banking locomotives suffered a minor head injury, after being struck by an unrestrained item in the locomotive cabin. In addition, severe damage occurred to the rear grain wagon of 5446, and the lead banking locomotive.

Context

Weather and environmental information

The nearest weather observations were taken at Quirindi, about 12 km from the accident site. On the morning of the accident sunrise was at 0559, almost one hour prior to the incident. Later, at 0900, there were light winds recorded, with clear conditions and no cloud cover for the area. No rain was recorded for the day.

Weather and environmental conditions were not considered contributory to the accident.

Train crew information

Mentor driver

The mentor driver commenced in the rail industry in 1999. In 2015, after working in various depots, the driver was based at Werris Creek with another rolling stock operator (RSO). In mid‑2020, the driver joined Southern Shorthaul Railroad (SSR), operating trains on the Narrabri North, New South Wales to Sydney corridor, including over the Ardglen Bank. In December 2021, the driver became a mentor driver in preparation for becoming a driver trainer once they had completed the required training.

The mentor driver held a Certificate IV in Train Driving, which was obtained under recognition of prior learning. As this was issued prior to the mentor driver joining SSR, they undertook a driver’s practical assessment on joining SSR to ensure that they met SSR’s specific operational competency requirements. In addition, the mentor driver held all required route and safeworking qualifications.

On the day of the accident, the mentor driver started at Werris Creek at 0445 after a 4 day break, which included both rostered days off and shifts on standby. Fatigue was not considered a factor for the mentor driver on the day. 

Trainee driver

The trainee driver commenced in the rail industry in 2017 as a driver’s assistant at Werris Creek, which included operations over the Ardglen Bank. In August 2020, the trainee driver joined SSR as a driver’s assistant, becoming a trainee driver two months later.[15] They were based at Muswellbrook and Ulan, New South Wales, before transferring back to Werris Creek in June 2021. Since that time, the trainee driver had mainly operated the banking engines between Werris Creek and Pages River/Murrurundi.

The trainee driver held a statement of attainment for units of competency which could apply to a driver’s assistant. As this was issued prior to the trainee driver joining SSR, they undertook a driver’s assistant practical assessment to ensure that they met SSR’s specific operational competency requirements. In addition, the trainee driver held the required safeworking qualification for the route.  

On the day of the accident, the trainee driver started at Muswellbrook at 0315 after a 3 day break, which included both rostered days off and a shift on standby. Fatigue was not considered a factor for the trainee driver on the day. 

Train information

General

Train no 5446 consisted of three locomotives (controlled by the lead driver) hauling 49 x BGKF wagons loaded with export wheat, weighing an estimated 4,263 t. At Werris Creek, three additional locomotives were attached at the rear of 5446 for banking purposes (controlled by the trainee driver). The train length on departure from Werris Creek was 943.60 m. 

Locomotive cabin 

The banking locomotives’ train crew were in locomotive C506, which was at the very rear of the train. They were facing opposite to the direction of travel. Visibility of the train was limited to that available from the rear facing side mirrors.

At the driver controls was the trainee driver, who could observe several warning light indications and pressure gauges to monitor the train consist. These included pressure changes in the train’s brake pipe and C506’s brake cylinders, and warning lights associated with C506’s PCS function and brake cylinder pressure (Figure 3).

Figure 3: Locomotive C506 control indications

Figure 3: Locomotive C506 control indications

Control indications on C506 as applied during banking operations.
Source: OTSI

The mentor driver, who was seated in the observer’s seat, had access to basic functions such as the locomotive horn and light switches. Although the speedometer had a side panel to enable speed monitoring by the mentor driver (Figure 3), they relied on the trainee driver to advise them of gauge and warning light indications. 

Network information

General

The section of track between Werris Creek and Quipolly (the accident section), was managed by the Australian Rail Track Corporation (ARTC). Network control services were provided by ARTC’s Upper Hunter no 2 control board, based at Broadmeadow, New South Wales. The safeworking system that applied was ‘rail vehicle detection’, using track circuits to detect trains and colour light signals.  

Werris Creek Yard

On most occasions and on the day of the accident, prior to the arrival of 5446 at Werris Creek, the banking locomotives exited the yard and waited at the platform on the Armidale side of the station, as depicted in Figure 4. On arrival from Narrabri, 5446 proceeded via the northwest main line onto the main line at Werris Creek, stopping at signal 15-34 and clear of signal 15-39 at the rear. Once 5446 had stopped, the banking locomotives proceeded on the authority of the shunt signal attached to signal 15-44 and coupled to the rear of 5446, clear of signal 15-39.

Figure 4: Routes taken by 5446 and banking locomotives

Figure 4: Routes taken by 5446 and banking locomotives

The route taken by the banking locomotives prior to the arrival of 5446 at Werris Creek is depicted by the light green dotted line, with the route taken by 5446 on arrival shown by the light blue dotted line. Once 5446 had stopped clear of signal 15-39, the banking locomotives attached to the rear of 5446 as depicted by the purple dotted line. 
Source: ARTC, annotated by OTSI

The distance between signals 15-34 and 15-39 was 1,012 m, with the length of 5446 (including the attached banking locomotives) being about 944 m. When interviewed, the mentor driver described this as problematic. At least a ‘couple of times’ stretch tests were unable to be performed due to the proximity of the banking locomotives to signal 15-39 in the rear, after the grain train had stopped a greater distance than usual from signal 15-34 on arrival (Figure 5). This was not a factor on the day of the accident.

Figure 5: Banking locomotives’ attachment location

Figure 5: Banking locomotives’ attachment location

Source: ARTC, annotated by OTSI

Werris Creek to Murrurundi

The track profile from Werris Creek (410.800 km) to Willow Tree (375.735 km) was undulating with interspersed short sections of uphill gradient. As depicted in Figure 6, from Willow Tree a moderate uphill grade was encountered to Chilcotts Creek (372.302 km), from where a steep 1:40 uphill grade[16] applied to the Ardglen Tunnel (362.572 km).

Figure 6: Track profile from Willow Tree to Murrurundi

Figure 6: Track profile from Willow Tree to Murrurundi

Dotted vertical lines are in 1 km increments.
Source: ARTC, annotated by OTSI

From Ardglen Tunnel, the track commenced a steep downhill grade of about 1:45 to Pages River (354.915 km), where it reduced to a moderate downhill grade to Murrurundi (352.327 km). 

The track speed was generally 115 km/h on the straight sections between Werris Creek and Chilcotts Creek, however, grain trains were limited to 80 km/h. From Chilcotts Creek to Ardglen Tunnel, banked trains were limited to a maximum of 50 km/h. As there was a steep uphill gradient on this section, grain trains operated up the grade substantially below the speed limit.

Ardglen banking operations

General

ARTC general train operation requirements were included in its train operating conditions (TOC) manual. Section 2 of the TOC manual (locomotive operations) described locomotives placed throughout a train consist as a ‘distributed power’ configuration. Where there was insufficient tractive effort available to haul the train up a steep grade, additional locomotives could be temporarily placed at the rear of the train to assist. In this instance, the configuration was considered a ‘banking’ operation. Limits on tractive power at the rear and minimum wagon mass within the consist applied to banking operation trains. These restrictions were in place to prevent excessive L/V ratio[17] in-train forces that may result in wagon lift and derailment if not observed.

For the Ardglen Bank, specific banking requirements between Chilcotts Creek and Murrurundi were contained in ARTC’s Route Access Standard (RAS) H2 (Muswellbrook–Werris Creek). As discussed further in this section, SSR’s banking operations were required to commence at Werris Creek, rather than Chilcotts Creek. To facilitate this, ARTC published supplementary instructions in TOC waiver 18060 (Operation of SSR grain trains between Newcastle and Moree & return) in April 2018, which was replaced by TOC waiver 21004 (Operation of SSR trains and light engines between Newcastle and Moree & return) in January 2021. These waivers were partly based on an independent assessment of in-train forces during banking, which was provided to ARTC in June 2017.

Chilcotts Creek based operators

In addition to SSR, two other rolling stock operators (RSOs) banked trains on the Ardglen Bank. Their banking locomotives were stowed in sidings at Chilcotts Creek provided for this purpose. As their banking locomotives were attached to the rear of their trains at the commencement of the steep uphill grade, the banked train was always in a compressed state to the Ardglen Tunnel.

Consistent with the requirements of ARTC document RAS H2, the knuckle of the automatic coupler on the banking locomotives pressed against the train to be banked was not required to be locked during coupling. Rather, an anti-locking device was placed around the top lifter pin of the banking locomotive’s coupler to prevent this from occurring (see Automatic couplers for further information). In addition, the brake pipe was not connected between the train and the banking locomotives (see Automatic brake). 

When the banked train reached the summit of the Ardglen Bank on the western approach to the Ardglen Tunnel, the banking locomotives for these operators slowed to a stop, automatically separating from the rear of the train. This allowed the banked train to continue its journey without stopping.

Southern Shorthaul Railroad

History

SSR commenced grain train banking operations between Werris Creek and Pages River in about October 2017, ceasing about 6 months later due to drought conditions impacting loading availability. It recommenced banking operations in October 2020, and changed the location of the train crew from the lead banking locomotive to the rear banking locomotive.[18] This change altered the vision of the banking locomotive train crew from viewing the rear wagon and coupler during banking operations, to a rear view of the track, in the opposite direction of travel.

As there was no spare siding accommodation at Chilcotts Creek to store SSR’s banking locomotives between duties, the locomotives were stored and attached to the rear of SSR’s grain trains at Werris Creek. In October 2020, SSR approached ARTC to change its banking locomotive stabling location from Werris Creek to Willow Tree (see Figure 6). The change request was made to improve operational efficiency by reducing non-revenue running of the banking locomotives. ARTC did not agree to this request, and the stabling location of SSR’s banking locomotives remained at Werris Creek.

Operation

Although banking was only required between Chilcotts Creek and Ardglen, the banking locomotive crews would take the opportunity to assist loaded trains over other uphill grades on the undulating terrain between Werris Creek and Chilcotts Creek. In addition, to limit instances of slack[19] run‑out,[20] it was common practice to maintain 1­–2 notches of traction power to assist in keeping the banking locomotives compressed against the rear of the train being banked.

Consistent with TOC waiver 21004, SSR required the banking locomotive’s automatic coupler to be connected and locked to the rear grain train wagon’s coupler during banking operations. This was due to the train traversing the undulating grade between Werris Creek and Chilcotts Creek (Figure 7), to ensure that the banking locomotives would not separate from the rear of the grain train en route. In addition, the brake pipe was also connected between the banking locomotives and the rear grain wagon, with all train braking and release commands on the train being initiated by the driver at the front of the train.

Figure 7: Track profile from Werris Creek to Chilcotts Creek

Figure 7: Track profile from Werris Creek to Chilcotts Creek

Source: ARTC, annotated by OTSI

Once the grain train had reached the Ardglen Tunnel, the banking locomotives would cease assisting with traction power. On arrival at Pages River, the grain train would stop, and the banking locomotives would be uncoupled to allow for their return to Werris Creek for storage in preparation for their next banking duties.

Automatic couplers

General

Couplers are fitted to both ends of most rolling stock to enable coupling to adjacent vehicles when marshalling a train. Automatic couplers are frequently fitted to freight rolling stock, automatically closing and locking the knuckle/s of open couplers when rolling stock are pushed together (Figure 8), at which point the rolling stock are ‘coupled’. 

Figure 8: Open and closed automatic coupler

Figure 8: Open and closed automatic coupler

An open knuckle (left image) and a closed and locked knuckle (right image). The locking block keeps the knuckle from opening once closed. If adjacent rolling is coupled, the pairing knuckle of the adjacent rolling stock would lock in behind the pictured knuckle.

Source: OTSI

To couple up to other rolling stock, either one or both automatic couplers on the rolling stock to be coupled should have their knuckles fully opened prior to coupling the rolling stock together. When uncoupling, at least one of the knuckles is to be unlocked to allow this to occur. 

Although automatic couplers perform the mechanical function of coupling, any air, electrical and hydraulic connections are required to be manually performed by the shunting personnel. 

Operation

When shunting, the person conducting shunting operations on the ground operates the control rod which acts on the lifter (Figure 9). This either pulls or pushes the locking block clear of the knuckle (Figure 10), thereby unlocking it. 

Figure 9: External coupler components

Figure 9: External coupler components

Main external coupler components. The area circled orange is magnified in Figure 11.
Source: ATSB

Figure 10: Locking block and lifter

Figure 10: Locking block and lifter

Source: OTSI

Figure 11 illustrates the sequence of mechanical events internal to the coupler body when performing coupling operations, as follows:

  • Image 1: As the locking block moves upward during unlocking, it contacts with and thereby engages the kicker, which assists in pushing open the unlocked knuckle. In addition, the tongue of the locking block (see also Figure 10), rests on the set shelf within the coupler, keeping the locking block raised and the knuckle in an unlocked state. This allows the shunting personnel to release the control rod without the knuckle immediately re-locking. The purpose of this safety design feature is to allow shunting personnel to: 
    • manually open the knuckle for coupling in instances where the kicker has not sufficiently opened the knuckle
    • stand clear of the rolling stock profile while uncoupling operations occur. 
  • Image 2: As the knuckle opens fully, a raised contact point on the top side of the inner knuckle contacts the locking block, pulling the locking block and its tongue outwards, dislodging it from the set shelf. This effectively arms the locking block to automatically drop in front of the inner knuckle once the knuckle is closed.
  • Image 3: Once the locking block drops in front of the inner knuckle, it locks it in place, preventing it from reopening (see also right-hand image in Figure 8). 

Figure 11: Internal coupler mechanisms

Figure 11: Internal coupler mechanisms

This image shows operation of the internal mechanisms within the coupler body. Image numbers 1 and 3 have had the knuckle physically removed to allow visibility of the locking block.

Source: OTSI  

Importantly, once the locking block tongue has come to rest on the set shelf, the knuckle must be fully opened to dislodge the tongue from the set shelf, thereby enabling the knuckle to be relocked. If the knuckle remains closed but unlocked, it will not lock again regardless of how much inwards pressure is exerted, as the locking block tongue will not dislodge from the set shelf. So, if both automatic couplers on adjacent rolling stock are unlocked for coupling, but only one knuckle is fully opened, only the fully opened knuckle will lock when the rolling stock are pushed together regardless of the buff (compressive) force applied. This will result in the closed but unlocked knuckle remaining in an unlocked state after coupling, and a train separation when the train is next moved with a draft (stretched) force.

Top versus bottom operated couplers

While the operation of the automatic coupler remains the same, there is a subtle design difference in the way the locking block is lifted for a top versus a bottom lifter operation. The top lifter pulls up the locking block when operating the control rod, whereas bottom lifter pushes up the locking block. While top lifter operation is more common, the bottom lifter design allows for a lower control rod and lifter position, providing clearance from pipework (on locomotives) and reduced obstruction during loading (container wagons) (Figure 12). 

Figure 12: Comparison of top lifter (left) versus bottom lifter (right) automatic couplers

Figure 12: Comparison of top lifter (left) versus bottom lifter (right) automatic couplers

Source: OTSI

As described in Operation, although the locking block can be visually observed in the locked position when uncoupled (Figure 8), this is not possible when coupled to another knuckle on adjacent rolling stock. 

For top lifter operation, the lifter and control rod linkage are mounted on the top of the automatic coupler body. As shown in Figure 13Figure 13, the lifter gives a clear and reliable visual indication of the position of the locking block. Unless the locking block has fully engaged in the locked position in front of the inner knuckle, the lifter will appear in a raised position. 

Figure 13: Top lifter operated automatic coupler

Figure 13: Top lifter operated automatic coupler

Visual appearance of the lifter in various operational knuckle states for a top lifter operated automatic coupler.

Source: OTSI

For bottom lifter operation, conversely the lifter and control rod linkage are mounted on the bottom of the automatic coupler body. As shown in Figure 14, the lifter provides almost no appreciable difference in indication of the position of the locking block, irrespective of whether it is in the locked or unlocked position. There is no reliable visual representation of the position of the locking block available for a bottom lifter operated automatic coupler.

Figure 14: Bottom lifter operated automatic coupler

Figure 14: Bottom lifter operated automatic coupler

Visual appearance of the lifter in various operational knuckle states for the bottom lifter operated automatic coupler that was fitted to locomotive L277, the accident locomotive. Note: the coupler has been bent downwards from the accident.

Source: OTSI

Shunting requirements

As a result of the visual limitations of the status of the locking block on bottom lifter operated automatic couplers, a common industry practice for these types of couplers is to perform a stretch test after coupling. This ensures that the locking block has fallen into place in front of the inner knuckle, locking it in place. If the couplers separate during a stretch test, it indicates that one or both knuckles remained unlocked after the coupling operation. Alternatively, if the couplers remain coupled, it indicates that both knuckles have been locked correctly.

As with many rail industry procedures, how a stretch test was conducted was determined by individual rolling stock operators (RSOs), rather than detailed within an industry standard. Two of the largest rail freight RSOs in Australia required that light locomotive traction power be applied in the direction away from the coupled location to perform a stretch test. This was to provide assurance that sufficient tension had been applied to the knuckles, thereby ensuring physical train separation in the event one or both couplers had not locked.

SSR advised that it considered sufficient strain on the couplers could be provided by a ‘… gravitational “bump”’, not necessarily with the application of accompanying traction power. 

SSR shunting procedures

SSR had several procedures relating to its shunting requirements, which were supported by training and assessment, including:

  • WIM 63001 (Policies and general train operations work instruction manual), section 20 ‘coupling and uncoupling rolling stock’ which described shunting operations, including the requirement for stretch tests to be performed. The instruction did not detail SSR’s process for a stretch test.
  • Notice 62269 (Ardglen banking procedures), which specified banking engines were to be hard coupled to the rear of banked grain trains. After coupling, the bank engines were to ‘…“ease off” to ensure that the coupler on the bank engine has become coupled’ to prevent uncoupling while the train was in transit. In this case an ‘ease off’ rather than a stretch test was referred to. The process as applied to SSR operations was not described. 

For new employees without prior shunting qualifications, SSR provided training and assessment aligned to the national unit of competency TLIC4074 (shunt, couple and uncouple rail vehicles).[21] The assessments included theoretical questions regarding the purpose of a stretch test, and a practical evaluation of the tasks involved.

The training and assessment aligned to TLIC4074, the supporting instructions contained within WIM 63001 and notice 62269, did not explain details of:

  • the coupler safety design feature, which required an unlocked knuckle to be fully opened to allow relocking
  • visual limitations relating to the locking block position on bottom operated couplers
  • SSR’s process for a stretch test/ease off.

Of note, the SSR learner’s resource material for TLIC4074 stated that locking blocks could ‘jam’, resulting in the coupler knuckle remaining unlocked. In these instances, employees were required to separate the train and investigate the cause. However, it did not detail what the possible causes were, or how these may be rectified.

Coupler inspections

The coupler on the accident end of L277 had a casting date of August 2002 and was likely fitted shortly after casting by its then owner, Rio Tinto. SSR acquired L277 in 2020, with the couplers inspected and deemed compliant during the locomotive’s previous 30-day inspection. 

Both couplers on BGKF 1122F (the accident wagon) were replaced in November 2019. A major biennial ‘B service’ was conducted on the wagon 3 months before the accident, which included a full wagon lift. The couplers were inspected during this service and deemed compliant.

An inspection of the couplers after the accident by Bradken at Newcastle, New South Wales, found that the:

  • Accident end coupler of L277, while worn, was within wear limits and was mechanically fully functional.
  • Accident end coupler of BGKF 1122F showed minimal signs of wear, but due to significant deformity resulting from the accident was no longer functional. 

Accident site

A review of evidence taken at the accident site was used to determine the mechanical state of the automatic couplers leading up to the accident. After the accident, the air brake hoses were found to be undamaged and disconnected consistent with separation having occurred between the banking locomotives and the rear of the train prior to the collision. The automatic couplers of locomotive L277 and BGKF 1122F were found to be coupled together and the knuckles locked (Figure 15), indicating that the physical structure of the couplers was sound and the knuckle locking mechanisms functional.[22] In addition, both couplers were fitted with bottom interlocking shelves, which prevented vertical disengagement of the knuckles while in transit. 

Figure 15: Coupling between L277 and BGKF 1122F

Figure 15: Coupling between L277 and BGKF 1122F

Note: Both the locomotive and wagon’s brake pipe taps were closed post-accident.
Source: SSR, annotated by OTSI

All coupling components were accounted for at the accident site including the coupler, yoke pin, follower, draft pack and yoke, indicating that there had not been a catastrophic mechanical failure of the coupling mechanisms en route (Figure 16). 

Figure 16: Wagon BGKF 1122F coupler components

Figure 16: Wagon BGKF 1122F coupler components

Note: The wagon’s brake pipe tap was closed post-incident.
Source: SSR, annotated by OTSI

Finally, the bent nature of the striker, sheared-off pin carrier plate and upward bend of the coupler and yoke of BGKF 1122F, was consistent with the coupling mechanism being located within the wagon body at the time of the collision and upward lift of the wagon as it lodged into the long hood of locomotive L277.

Damage to 5446 was limited to the rear wagon of the grain train (BGKF 1122F), including a significant grain spill, and the leading banking locomotive (L277). ARTC advised that there was no track damage from the accident which required repair.

Training and assessment

Introduction of the national system in the rail environment

In 2006, the National Transport Commission (NTC) released the model Rail Safety Bill as a first step in rail safety legislation harmonisation across all the Australian states and territories. One aspect of the harmonised laws was the requirement for rail transport operators to assess rail safety worker competence[23] against available national competency units (see Australian Qualifications Framework (AQF)). This requirement was embedded in s.21 of the Rail Safety Act 2008 No 97 (NSW) that subsequently followed. 

In January 2013, the Rail Safety National Law (NSW) (RSNL) came into effect and was administered by the Office of the National Rail Safety Regulator (ONRSR). For compliance with the RSNL,[24] ONRSR advised, in part, that once a position was identified as rail safety work, a rail transport operator was required to:

  • Perform a task analysis to understand the competence requirements of the position, specifically, a defined list of tasks and, required technical and non-technical knowledge and skills.
  • Assess the risk of the tasks to determine appropriateness and applicability of training as a risk control.
  • Ascertain the extent to which competency gaps could be addressed through an AQF unit of competency.
  • Utilise enterprise assessments to assess competence where an AQF competency did not exist or fully meet requirements.[25]
Australian Qualifications Framework (AQF)

The AQF provided the standards required for nationally recognised qualifications through policy and the standardisation of learning outcomes for each qualification type. This ranged from a Certificate I (level 1) to a Higher Doctoral Degree (level 10). For Vocational Education and Training (VET), AQF levels 1–8 applied for qualifications ranging from a Certificate I to a Graduate Diploma. 

At the time of the accident, training packages were developed by skills service organisations in consultation with industry. Approved training packages were endorsed for use by the Council of Australian Governments Industry and Skills Council. For the rail industry, the TLI10 (transport and logistics training package) applied, which detailed available units of competency which could be packaged into a nationally recognised, portable qualification. 

National recognition of VET units of competency and qualifications was the result of quality assurance by the national VET regulator, the Australian Skills Quality Authority (ASQA),[26] through:

  • registration of registered training organisations to authorise delivery and assessment of VET 
  • monitoring of compliance to the VET standards[27]
  • accreditation of nationally recognised courses, where a training package did not apply. 

A VET qualification typically comprised of a minimum number of core and a mix of elective units of competency. At the time of the accident, the VET qualification TLI42621: Certificate IV in Train Driving was available for train crew. This qualification consisted of 21 units of competency, as follows:

  • 12 core units.
  • 5 units aligned to specialised elective groupings, which contextualised the operational environment, i.e. A) freight, B) urban electric, C) country passenger operations, D) steam locomotive and E) heritage motive power.
  • 4 units from a list of 35 electives, chosen by the registered training organisation as determined by the operational requirements of the employing rail transport operator. 

There was no equivalent VET qualification for the driver’s assistant position. Instead, units of competency from TLI42621 were selected by the registered training organisation to reflect the competencies required by the operator, based on the knowledge and skills necessary to perform the role specific to its operations. In this case, a Statement of Attainment was issued allowing national recognition of these individual units of competency.

In relation to competency assessment of skills and knowledge for shunting operations, the AQF provided the unit of competency TLIC4074 (shunt, couple and uncouple rail vehicles). This unit was available as a general elective within TLIC42621.

AQF assessment

The requirements for assessment when imparting VET competencies and qualifications, including through recognition of prior learning,[28] was detailed in the Standards for registered training organisations 2015 (Cwlth).[29] These consisted of:

  • Principles of assessment: where assessment was fair, flexible, valid and reliable.
  • Rules of evidence: where evidence collected was valid, sufficient, authentic and current.

This ensured integrity of the competency assessment decision and judgments and, gave confidence that assessments of competence were sound, reliable and consistent across the VET sector.

To ensure these requirements were met, registered training organisations (those delivering and assessing VET)[30] were required to undertake assessment validation activities. This involved periodically reviewing a sample of assessments previously undertaken to ensure the assessment tool, process and judgements reliably met the requirements of the principles of competency assessment and rules of evidence. Registered training organisation validators were required to be independent of the training delivery and competency assessments being reviewed.

In relation to assessment judgements, sufficient assessment evidence was to be retained to enable review and validation of the competency judgement decision. The purpose was to ensure that assessment decisions would be consistent across assessors (‘reliable’), based on the evidence gathered (‘sufficient’), thereby allowing sound competency decisions to be made. Guidance for this and other requirements of registered training organisations in meeting their VET obligations was contained in ASQA’s guidebook Users’ guide to the standards for registered training organisations 2015.[31]

For theory assessments, the ASQA user’s guide suggested that model answers could be provided to assessors to enable evaluation against responses provided. For practical assessments, it was recommended that ‘practical skills are well described and include observable behaviours’, in addition to assessing the underpinning knowledge of the observed task by ‘asking the student why they are doing something’. This assured the assessor that the person being assessed was not solely mimicking a previously demonstrated task.

Enterprise attainment

VET units of competency could be used as transportable qualifications for rail safety work. However, individual rail transport operators were required to ensure that competency was assessed for all its specific knowledge and skill requirements, such as:

  • the contents of the operator’s safety management system 
  • specific operational task risks and risk controls
  • safeworking[32] for the operator’s particular operation and geographic location
  • local track route knowledge
  • motive power and rolling stock operations (types of locomotives and wagons in use)
  • train operations (whether they be passenger or freight operations).

Further, the Rail Safety National Law (RSNL) allowed rail transport operators to assess competency through other means where complying with the AQF was not reasonably practicable,[33] for example, where:

  • not all units of competency within the qualification were necessary
  • a suitable VET unit of competency or qualification was not available
  • the costs associated with complying with the AQF were prohibitive.

While formal requirements for assessment of VET qualifications applied to registered training organisations when issuing a VET qualification (see AQF assessment), it did not apply to enterprise-based assessments (that is, enterprise attainment) conducted by rail transport operators. Even so, ONRSR’s policy Application of the AQF to rail safety worker competence assessment did provide guidance to rail transport operators in this regard. ONRSR’s expectations in this case included that:

  • training and assessment remained ‘consistent with the principles of competence-based training and assessment’
  • sufficient assessment evidence to ensure ongoing consistent performance was obtained
  • competence assessment was conducted by a person with a Certificate IV in training and assessment (or equivalent), who was independent of the person who conducted the training.
Competence retention

The ONRSR guideline, safety management system, outlined ONRSR’s expectation that there was periodic reassessment of rail safety worker competency. This was consistent with correcting degradation of worker knowledge, skill and competence, particularly where safety critical tasks were conducted irregularly (Vlasblom et al. 2020). These expectations applied to competencies achieved through both VET and enterprise attainment.

Of interest, VET attained qualifications and units of competency in rail safety work did not expire and were recognised across industry. Importantly however, the proven competency at time of qualification did expire – irrespective of how the initial competency in rail safety work was achieved (either through AQF based or enterprise attainment). As such, periodic reassessment of competence was to be conducted. The operator’s safety management system (SMS),[34] determined the intervals for reassessment to ensure workers remained competent to carry out rail safety work.

Credit transfer and additional training

As previously described, the Standards for registered training organisations 2015 (Cwlth) required national recognition and therefore portability of VET units of competency previously achieved.  

The mentor driver of 5446 held an earlier qualification TLI42615: Certificate IV in Train Driving, which they had obtained while working for Pacific National in September 2019. While this qualification had been superseded by TLI42621 by the time of the accident, it remained an equivalent qualification. The mentor driver’s TLI42615 included the unit of competency TLIC4074 (shunting).

The trainee driver of 5446 held a Statement of Attainment, which they had obtained as a driver’s assistant through Southern Cross Civil and Rail Training (SCCRT) in September 2017. It included assessed competence in 18 units of competency which were aligned to TLI42615. Their Statement of Attainment also included assessed competence in TLIC4074 (shunting).

While a rail safety worker was required to demonstrate competency against performance criteria (defined in the unit of competency) and provide performance and knowledge evidence (defined within the assessment requirements), the VET requirements were generic in nature. This allowed registered training organisations to contextualise the training and assessment of a unit of competency to the unique operating environment within which the work was conducted.

As such, although SSR (which was both a rolling stock operator and registered training organisation), recognised the previously attained VET competencies and qualifications of both the mentor driver and trainee driver, this did not satisfy its requirements for the demonstration of competence regarding its own operations; for example, SSR policies, procedures, instructions, and its unique operating equipment and environment. SSR advised OTSI that after training in SSR’s requirements, all new employees were assessed to ensure they met and were therefore current, in all required rail safety worker competencies. These assessments were enterprise‑based rather than aligned to AQF qualifications. Where competency gaps were identified during this process, further training would occur prior to reassessment of competency. 

Of note in relation to TLI42621, were the units of competency specialist elective groupings. As previously described in Australian Qualifications Framework (AQF), these five groupings contextualised the operational environment in which the qualification was originally obtained. This was important due to the specific train driving skillsets which applied to different motive power operations. For example, the method of operating a steam locomotive (specialist elective group D) was entirely different to that of an electric passenger train (specialist elective group C). Through a review of the units of competency achieved in TLI42621, a rail transport operator could determine the specific train driving skillset a driver presenting a VET qualification had previously demonstrated. During the investigation, it was identified that specialist elective groupings A (freight) and C (country passenger) were identical. This meant that a VET qualification in train driving held by a country passenger train driver, for example, a self-propelled 2-carriage diesel multiple unit, had the potential to appear identical when presented to a hiring rail transport operator as that of a heavy-haul freight train driver.

ATSB observation

While VET qualifications were theoretically portable across industry, in practice this was of limited value due to the significant operational differences between rail transport operators. Though specialist elective groupings (including for the Certificate IV in Train Driving) gave further context, this too was problematic and was not necessarily reflective of the rail operating environment within which it was obtained. Further, reliability of the VET qualification in demonstrating competency in rail safety work quickly diminished due to the requirement to periodically reassess these initially proven competencies. 

Given these limitations, additional enterprise-based training and assessment was always required by rail transport operators.

Training and assessment of shunting duties 

Unit of competency TLIC4074

As previously described, the VET unit of competency TLIC4074 provided a nationally recognised shunting qualification. Within this unit of competency were several assessable requirements related to coupler operation, understanding of coupler design features and testing of a successful coupling activity (a stretch test). These were:

  • coupling systems are identified and applied appropriately to couple and/or uncouple rail vehicles in accordance with manufacturer and organisational requirements [performance criteria]
  • operating and adapting to differences in equipment in accordance with operating procedures [performance evidence]
  • shunting, coupling, uncoupling and securing rail vehicles [performance evidence]
  • principles of operation for protective devices, air and electrical couplings, handbrakes, derailers and coupling equipment [knowledge evidence].

Mentor driver

The mentor driver’s assessment of competence against TLIC4074 (within their TLI42615) was achieved through recognition of prior learning (RPL). The purpose of RPL was to assess competence which had been achieved through prior formal, non-formal or informal learning.[35] This avoided training and assessment against a unit of competency where skills and knowledge were already achieved. The RPL assessment was conducted by Pacific National in September 2019. The assessment included consideration of a prior VET qualification, prior enterprise assessments, and an RPL checklist, interview and third-party report; specifically:

  • Recognition of a Statement of Attainment previously issued by Asciano (Pacific National) in March 2013 which included a Certificate III aligned unit of competency TLIC3017A (shunt rolling stock). 
  • In July 2016 and September 2017, Pacific National assessed the mentor driver using an enterprise-based verification of competency checklist. The mentor driver was found competent in different coupling systems and performed a stretch test on both occasions however, evidence was limited to a checkbox that this was ‘performed correctly’. There was no evidence recorded that described their understanding of these or what actions were observed.
  • In July 2019, Pacific National conducted an RPL checklist, interview and third-party report which found the driver competent in shunting. As with prior assessments, evidence was limited to checkboxes that did not describe the mentor driver’s understanding of coupling systems or observed actions during a stretch test. 

Pacific National advised OTSI that the RPL checklist and interview were aligned with the training materials for TLIC4074 as delivered by it in July 2019. A review of these training materials found that while coupler operation and stretch tests were referenced, it did not describe the principles of operation of a coupling safety design feature or explain how a stretch test was conducted. Pacific National did not at that time have an instruction detailing the process for conducting a stretch test.

As mentioned in Credit transfer and additional training, SSR recognised the mentor driver’s TLI42615 issued by Pacific National. However, it required the mentor driver to be practically assessed for rail safety worker competency in its own operations. It conducted this assessment in August 2020, finding the mentor driver was competent in ‘shunting the train together’ and ‘performing a train inspection’ in accordance with the requirements of WIM 63001 (see Shunting requirements). However, evidence was again limited to checkboxes that did not describe what actions were observed, or record the underpinning knowledge that was assessed. 

In relation to a stretch test, the mentor driver advised during interview that for the previous 20 years they had been taught that this was conducted by gravity/roll back. That is, where the newly coupled portion of a train rolled back from the rolling stock it had coupled to, and remained coupled, this indicated a successful coupling. The mentor driver advised that newer staff often used a notch of power during the stretch test for purposes of recording an action on the data logger, but no SSR procedural document required this. Since the accident, the mentor driver advised that SSR required the application of power as part of a stretch test. 

In a follow-up conversation, the mentor driver advised they had been previously taught that the knuckle would only be manually opened in instances where there had been trouble in locking it. In this case the problem knuckle was to be fully opened and then closed (locked), with the other coupler’s knuckle then used to perform the coupling manoeuvre. Further, the mentor driver advised that while stretch tests had been assessed as part of their practical competency assessments, it was unclear to them what functions the assessor was observing during the test.

Trainee driver

The trainee driver was assessed as competent as a driver’s assistant against TLIC4074 by Southern Cross Civil and Rail Training (SCCRT) in September 2017, which formed part of their Statement of Attainment. The assessment consisted of both theory questions and on the job observations. A review of the theory assessment found that it did not address coupler operation, design features or the method of conducting a stretch test. The practical assessment indicated that two successful demonstrations of shunting had been observed. However, these observations did not describe the driver’s assistant’s understanding of coupling systems or, if a stretch test had been conducted, and if it had, what actions were observed.

SSR conducted a practical assessment of the trainee driver’s competence for driver’s assistant rail safety work in its operations in August 2020. On three occasions, it was recorded that the trainee driver could correctly ‘couple and uncouple rolling stock in a safe manner’ in accordance with the requirements of WIM 63001. The evidence of this was limited to nominating the yard where the actions had been observed and a checkbox of completion. The assessment did not describe what actions were observed, or the underpinning knowledge that was assessed.

Specifically, in relation to a stretch test, the trainee driver advised during interview that they understood this to be conducted by gravity. However, if the coupled rolling stock did not roll back after coupling, the trainee driver advised power would then be applied for the stretch test. 

Train braking systems

General

On SSR banked grain trains, the driver of the lead portion operated the controls from within a locomotive cabin at the front of the train consist. Tractive effort to move the train was commanded from the front of the train, with the banking locomotives (at the rear of the train) providing further tractive effort (separately commanded by its driver) when uphill gradients were encountered. For train braking however, all braking commands to slow and stop the train were commanded by the driver of the lead portion only. 

There were two pneumatically operated, ‘airbrake’ control systems fitted to 5446:

  • automatic brake (controlled brakes on the entire train)
  • independent brake (controlled brakes on the locomotive/s only).

The use of each of these two braking systems depends on the circumstance during which braking effort is required. For both airbrake systems, braking is achieved by the application of brake blocks directly to the locomotive or wagon wheels.

The following sections provide basic detail of these two braking systems and how they interact.[36] 

Automatic brake

The ‘automatic brake’ controls the brakes on the entire train, including the wagons and locomotive/s. Central to this system is the brake pipe, which runs along the length of the train. Changes to air pressure within the brake pipe regulate the application and release of the train’s brakes. When fully charged (brakes released), the brake pipe pressure is about 500 kPa. 

The driver regulates the pressure within the brake pipe through operation of the automatic brake handle in the driver’s cabin. To apply the brakes, the driver reduces pressure in the brake pipe. Equipment which is fitted to the locomotive/s and wagons senses this brake pipe pressure reduction and effects a corresponding air pressure increase in the locomotive and wagon brake cylinders. This pressure increase results in application of the vehicle’s brakes through the brake rigging mechanism.

It is termed the ‘automatic’ brake because the brakes will automatically apply when brake pipe air pressure is lost, such as in a major derailment or train separation where the brake pipe is broken.

Independent brake

The ‘independent brake’ applies pneumatic brakes to the locomotive/s only, independently of any trailing wagons. It is operated by the driver using the independent brake handle in the driver’s cabin. In the ‘apply’ position, air pressure is increased in the locomotive’s brake cylinders, whereas in the ‘release’ position, locomotive brake cylinder air pressure is exhausted to the atmosphere.

When pressure is reduced in the brake pipe, for example, during an automatic brake application, the locomotive’s brakes will also apply. For train handling purposes,[37] this brake cylinder pressure is usually released by the driver on hauling locomotives, without affecting the brake application on any trailing wagons. This is known as ‘bailing-off’ the automatic brake application and is achieved by the driver depressing the independent brake handle. 

Dynamic brake 

The electrical dynamic brake provides a supplementary means of train-speed control that complements the train’s pneumatic automatic brake. When selected by the driver, it alters the locomotive’s traction motor fields from a tractive power to a generator configuration, resulting in a retarding force. This retarding force is limited to the locomotive wheelsets only, rather than dispersed across the entire train. 

Operation of the dynamic brake suppresses any locomotive brake cylinder pressure which applies during an automatic brake application. This is to prevent excessive braking effort on the locomotive wheelsets, resulting in wheel lock and slide.

Banking requirements

While all train braking commands (apply and release) were commanded by the driver on the lead portion via the brake pipe, the driver of the banking locomotives also had duties to perform in relation to the airbrake system. These were described in SSR work instruction WIM63001 (Policies and general train operations work instruction manual): 

  • Section 26 ‘losing the air’, in instances of sudden loss of brake pipe pressure to 0 kPa, the driver was to bail-off the automatic brake‑applied locomotive brake cylinder pressure and allow the train to stop. This procedure was generic and did not distinguish between the driver requirements for lead only consists versus banked train consists.
  • Section 81 ‘3-man push pull operations’ (also banking),[38] the banking locomotive driver was to bail-off the automatic brake‑applied locomotive brake cylinder pressure en route ‘…to prevent wheel skidding on trailing locomotives’. 

In interview, the trainee driver advised that they bailed off auto applications as per Section 81 and also recalled that they bailed-off the banking locomotives’ brake cylinder pressure on two occasions prior to impact in accordance with Section 26. That action was taken having observed the sudden loss of brake pipe pressure and checking the mirrors for any issues. The trainee driver advised that bailing-off banking locomotive brake cylinder pressure was common practice to prevent the brakes from applying and causing locomotive wheel lock, slide and resultant flat spots. 

The trainee driver added that about a month prior to the accident, they had encountered another sudden loss of brake pipe pressure while on the banking locomotives and also bailed-off during that event. In this instance, the brake pipe had parted between the two lead locomotives, with bailing-off preventing unnecessary wheel skid on the banking locomotives.

In interview, the mentor driver advised that bailing-off banking locomotive brake cylinder pressure was accepted practice, stating ‘… all the [SSR] training is, if you get a penalty, you always bail-off because you don’t want to skid the wheels [cause flat spots]’. While a sudden loss of brake pipe air pressure and PCS light could indicate a broken brake pipe, the mentor driver had not considered that the train could have separated. The mentor driver advised that like the trainee driver, they would have bailed-off the banking locomotives’ brake cylinder pressure, given the same circumstances. However, they stated that in hindsight although this was what was trained, in this circumstance it wasn’t the right action to take. 

Wheel skid events

SSR advised that locomotive wheel lock, resulting in slide and flat spots (wheel skids), was a significant operational concern. While minor flat spots could be addressed through trim blocks,[39] flat spots requiring repair by a wheel lathe could cost up to $100,000 per locomotive due to reduced wheel life.

As a result, SSR trained its drivers to ensure locomotive brake cylinder pressure was bailed-off during all automatic brake applications, including on banking locomotives. As a result, it had not had a ‘class 3’[40] or worse wheel skid event in over 10 years. The last major wheel skid event had occurred in 2011, when the driver on the rear locomotive of a push-pull consist had not consistently bailed-off the automatic brake applications. 

Emergency response procedures

Several events may result in a sudden loss of brake pipe pressure[41] on a train including separated brake pipe hoses, derailment, vigilance penalty or train separation. In certain circumstances a train separation can result in an emergency event, namely a collision. This is due to the separated portions separating from each other by a distance, followed by a collision in circumstances where the front portion stops prior to the detached rear portion coming to a stop (as in this accident). To prevent this, RSOs have procedures in place to deal with train separation events.

SSR’s procedure WIM 63001 section 26 (losing the air), which related to sudden loss of brake pipe pressure stated:

If there is a sudden reduction in brake pipe pressure to zero [kPa] whilst a train is underway, bail off with the locomotive independent brake [handle] and allow the train to come to a stand. Keep the independent brake [handle] bailed off for a short period after your train comes to rest in case the rear portion of the train collides with the now stationary front portion of the train. 

This process was to be followed in all cases where there was a sudden loss of brake pipe pressure. Where the cause of the pressure loss was not immediately known, drivers were to presume a derailment had occurred and take immediate protective actions. The driver’s assistant was then to walk the train to ascertain the cause of the sudden pressure loss. Both the mentor driver and trainee driver were aware of this procedure.

SSR advised that this instruction applied to all operations, with no specific instruction related to banking locomotive actions when observing a sudden loss of brake pipe pressure. However, SSR added that it had by that stage obtained extensive experience in both banking and push-pull operations. SSR advised its push-pull arrangements alone totalled more than 100 services per year since 2004. Also that this accident was the first instance of a separation between its banking/push-pull locomotives and the previously coupled train in an estimated 3,000 banking and push‑pull events.

Risk management

General

For the purposes of the Rail Safety National Law (RSNL), a Rail Transport Operator (RTO) was required to ensure the safety of its railway operations ‘so far as is reasonably practicable’.[42] The Office of the National Rail Safety Regulator’s (ONRSR’s) guideline Meaning of duty to ensure safety so far as is reasonably practicable, provided RTOs guidance on how to apply this concept to their operations. Within this guideline, ONRSR considered ISO 31000 (Risk management – guidelines) as ‘good practice’ in the management of risk, in addition to requirements of the RSNL. ISO 31000 described risk management as:

…the systematic application of policies, procedures and practices to the activities of communicating and consulting, establishing the context and assessing, treating, monitoring, reviewing, recording and reporting risk. 

RTOs were required to implement a safety management system (SMS) to comply with their risk management obligations. This was to include formal processes for the identification, assessment, control, monitoring and review of risk.[43]

Communication and consultation

A key component of the risk management process was communication and consultation with internal and external stakeholders. ISO 31000 described the aims of communication and consultation as bringing together different areas of expertise and views, and to gather sufficient information during the risk management process. It was an integral part of:

  • establishing the scope and context within which the risk to be managed resided
  • identification, analysis and evaluation of the risk
  • identification and implementation of effective risk controls.

A companion handbook HB 327:2010 (Communicating and consulting about risk) applied to ISO 31000.[44] It described the benefit of effective communication and consultation as ‘… a shared and better understanding of the risks faced and the range of treatment options.’ It further noted that consultation would help to comprehensively identify risks, increase acceptance of implemented controls and encourage feedback of effectiveness after implementation.

The importance of consultation was recognised within the RSNL, with an objective of the Act ‘to promote the effective involvement of relevant stakeholders, through consultation and cooperation, in the provision of safe railway operations.’ To achieve this, the RSNL advised that participation and consultation in establishing, reviewing or varying an RTO’s SMS (risk management), should include:

  • those who may be affected by the SMS, such as rail safety workers 
  • health and safety representatives (where applicable)
  • relevant unions
  • other RTOs (where interface agreements were required) 
  • the public (where appropriate).

It was a requirement of the Rail Safety National Law National Regulations 2012 that an RTO’s SMS contained systems and procedures to ensure this consultation occurred.[45]

SSR risk assessments

Shunting

SSR conducted a risk assessment for train operations including shunting in February 2017, which was reviewed in March 2019. The review team consisted of an executive general manager, general manager, director and assistant general manager, most of whom had previous experience as either a driver or driver’s assistant. Stakeholders such as rail safety workers were not identified within the risk assessment.

Hazards of general shunting duties, for example, incorrectly set points, insufficiently secured rolling stock and communications failure were assessed. The hazard of incorrect / unsuccessful (unlocked knuckles) after coupling was not identified or assessed. SSR advised that the hazard of incorrect/unsuccessful coupling was addressed through:

  • the shunting procedure contained in WIM 63001 (Policies and general train operations work instruction manual)
  • competency of rail safety workers in shunting tasks
  • experienced traincrew performing shunting tasks (addressed through assessed competency).

As discussed in Shunting requirements, WIM 63001 described the need for a ‘stretch test’ after shunting, but not how this was to be conducted. 

More information relating to competency assessment of the mentor driver and trainee driver in SSR’s shunting procedures is contained in Training and assessment of shunting duties.

Banking operations

SSR conducted a risk assessment for its Ardglen banking operations in November 2018, with a review coinciding with recommencement of its banking operation in October 2020.[46] The review team consisted of an executive general manager, general manager, director and service manager. In addition to the review team holding either current or prior driver or driver’s assistant qualifications, in the case of the executive general manager and service manager, the former had operated over the route as a driver’s assistant in 2008, and the latter as a driver in 2018. Identified stakeholders were SSR traincrew, SSR service planners and ARTC train control.

At this time, SSR changed the location of the banking crew from being in the lead banking locomotive to the rear banking locomotive. This eliminated the requirement for the traincrew to change ends after detaching from the grain train at Pages River before returning to Werris Creek. The change was in response to a runaway event which occurred after another RSO’s crew had changed ends at Ardglen after banking operations were complete 4 months previously.[47] 

In this assessment the risk of ‘separation and collision’ during banking operations was identified, with potential causes being:

  • undulating terrain between Werris Creek and Ardglen, likely resulting in separation without crew awareness
  • couplers not engaged correctly (knuckles unlocked) after coupling at Werris Creek 
  • lack of awareness of train separation en route due to both the lead train locomotive and banking locomotives having simultaneous control of the braking system.

The implemented risk controls for these hazards were, respectively:

  • hard coupling with, and the brake pipe air connected between the banking locomotives and the rear of the banked train
  • stretch test and confirmation of the coupler condition after coupling
  • the lead locomotive on the banked train to be in full control of the braking system, with a brake pipe continuity test after coupling.

Train parting occurrences

One of the operational occurrences that RTOs were required to report to ONRSR related to instances where trains separated while in service, that is, an unintended uncoupling event. A review of these reports over the 5 year period from 2017 to 2021 inclusive, found that there were 1,261 train separation events nationally. These were attributed to:

  • mechanical failure of the coupling – 44%
  • the knuckle opening through various means – 27%
  • track anomalies causing vertical disengagement of the knuckles – 6%
  • a shunt having just been completed – 2%
  • cause not determined – 21%

Of the 25 instances of train separation occurring immediately after a shunt had been completed, 7 were attributed to the locking block not having dropped fully in front of the inner knuckle after coupling, that is, the knuckle had remained unlocked.

Safety analysis

Introduction

On 6 January 2022, freight train 5446, operated by Southern Shorthaul Railroad (SSR), departed from Narrabri West for Bullock Island at Newcastle, New South Wales. The train was powered by 3 locomotives hauling 49 wagons loaded with grain.

Due to the steep uphill gradient from Chilcotts Creek (about 40 km south of Werris Creek) to the Ardglen Tunnel, extra traction power was required to assist the 3 locomotives to ascend the gradient. As such, on arrival at Werris Creek a further 3 ‘banking’ locomotives were attached to the rear of the grain train. After the banking locomotives were coupled to the rear of 5446, airbrake tests were conducted to ensure braking system continuity. Once confirmed, the train departed Werris Creek.

This safety analysis will discuss the train separation and collision which occurred shortly after departure from Werris Creek, including aspects of procedure, training and assessment of risk.

Train separation event

Separation of L277 from the rear of 5446

Although banking was only required between Chilcotts Creek and Ardglen, in practice, the banking locomotive crews would take the opportunity to assist loaded trains over other uphill grades en route. In this case, the gradient leaving Werris Creek (410.800 km) was uphill for about the first 4 km. As was common practice, on the day of the accident the trainee driver on the banking locomotives assisted 5446 with additional traction power after leaving Werris Creek. Full traction power (eight notches) was provided by the banking locomotives, in addition to full traction power at the lead of the train. Consequently, the banking locomotives were in a compressive state against the rear of 5446.

After about the 407.000 km mark, the gradient changed to a downhill grade. As a result, the lead locomotive driver commenced a reduction in traction power setting, with the trainee driver on the banking locomotives also commencing traction power reductions shortly afterwards.

At 0648:31, the driver of the lead locomotive engaged dynamic braking and made an automatic brake application at 63 km/h to test the effectiveness of the train’s brakes. At this stage, the entire train was on the downhill grade. At 0649:09, with the train’s speed stable at 64 km/h and, coinciding with the banking locomotive’s traction power being reduced to a minimum (one notch), the driver of the lead locomotive released the train’s brakes. Seven seconds later, this brake release command took effect on the banking locomotives. 

The trainee driver on the banking locomotives maintained the one notch of traction power on the banking locomotives to limit any slack runouts that may have resulted as the grades changed. However, while this maintained a level of compressive force against the rear of 5446, this was insufficient when the banking locomotives reached a relatively level piece of track at about 405.700 km, allowing them to slow slightly. This slight reduction in speed resulted in the banking locomotives separating from the rear of train 5446 at 0649:46.

Release of automatically applied banking locomotive brakes 

As the brake pipe was connected and continuous between 5446 and the coupled banking locomotives at Werris Creek, the separation of the banking locomotives from the rear of the train resulted in a disconnection of the brake pipe and sudden loss of air pressure as recorded on the locomotive dataloggers. At the lead of the train, the driver observed this loss of brake pipe pressure as a flow rate on the cabin flowmeter. Consistent with the SSR procedure contained in WIM63001 (policies and general train operations work instruction manual), the driver maintained dynamic braking to assist in stopping the lead portion of the train.

Concurrently, on the banking locomotives, the trainee driver observed a loss of traction power and all brake pipe pressure with a resultant rise in locomotive brake cylinder pressure. The trainee driver and mentor driver advised at interview they checked their rear-view mirrors, but due to the straight nature of the track were unable to identify that a train separation had occurred. Consistent with their training and WIM63001, the trainee driver ‘bailed off’ the automatically applied locomotive brakes. SSR’s analysis of the data logger data indicated that the distance between the lead portion and the detached banking locomotives was now 47m. After a short period, the locomotive brake cylinder pressure again started to rise, applying the locomotive’s brakes. In response, the trainee driver again bailed off this locomotive brake cylinder pressure, with the distance between the lead portion and the detached banking locomotives now 126 m. As there were no wagons which had separated with the banking locomotives (the brakes of which would not have been affected by bailing off), this resulted in a loss of all braking effort on the detached rear portion. Although the datalogger indicated the speed of the banking locomotives reduced from 51 km/h to 23 km/h due to the 2 momentary applications of locomotive brake cylinder pressure, the banking locomotives continued to roll.

By this time the automatically applied brakes on the lead portion of 5446 were starting to take effect causing it to slow. The gap between the front and detached rear portion of 5446 started to reduce. Once the lead portion had stopped and, without any braking effort on the still rolling banking locomotives, collision between these and the stationary lead portion of the train was inevitable.

By contrast, had the banking locomotive’s brake cylinder pressure been retained and not bailed off by the trainee driver after the separation event, it is certain that the banking locomotives would have stopped relatively quickly, and the collision avoided.

Emergency response to brake pipe pressure loss

SSR notice 62269 (Ardglen banking procedures) contained specific requirements for the Ardglen banking operation for their train crew. While it contained instruction on coupling and the banking operation, it did not contain any contextualised emergency response procedures unique to this operational environment. 

Rather, the procedure to be followed by drivers when confronted with a sudden loss of brake pipe pressure en route, such as during a train separation or derailment, was contained in SSR’s general operational document WIM63001, Section 26 (losing the air). It did not differentiate between head end only or banking train operations. In all cases of a sudden loss of brake pipe pressure en route, drivers were required to:

  • bail off any locomotive brake cylinder pressure
  • allow the train to come to a stop.

Of note, WIM63001 Section 81 (3-man push pull operations), did contain instructions specific to banking operations. This section required drivers on the banking locomotives to bail off all automatic brake‑applied locomotive brake cylinder pressure en route during routine operations to prevent wheel skids. SSR explained that this was due to wheel skids causing significant operational costs during wheel lathe rectification, including substantial loss of wheel life. Both the trainee driver and mentor driver on the banking locomotives were aware of the requirements within WIM63001 as applied to banking operations. During interview, both advised these instructions had informed the decision to bail off the banking locomotive brake cylinder pressure in response to the sudden loss of brake pipe pressure. This resulted in loss of braking on the banking locomotives after the separation event.

Wheel skid events can cause significant operational expense and SSR’s procedures were specifically designed to avoid any unnecessary occurrences. However, there are significant differences between head end only and banking operations which were not covered in the procedures. For example, a sudden loss of brake pipe pressure in transit, resulting from a derailment, was not an identified scenario within a banking operations context, so the procedures were missing risk controls to address the most appropriate response to this type of event. 

Banking locomotives were required to be hard coupled to the train

Due to the steep uphill gradient between Chilcotts Creek and Ardglen, several rolling stock operators (RSOs) banked their trains over this section. Two storage sidings were provided at Chilcotts Creek for accommodating banking locomotives between banking duties – both storage sidings were used by SSR’s competitors. 

In this case, as the banking locomotives were attached to the rear of the trains at the commencement of the steep uphill grade, the banked train was always in a compressed state to the Ardglen Tunnel. Consequently, the knuckle of the automatic coupler on the banking locomotives pressed against the train to be banked was not required to be locked during coupling. Once the banked train reached the summit of the Ardglen Bank, the banking locomotives slowed to a stop, automatically separating from the rear of the train. This allowed the banked train to continue its journey without stopping.

When SSR commenced banking operations on the Ardglen Bank in about October 2017, no spare storage siding accommodation was available at Chilcotts Creek. Approaches were therefore made by SSR to ARTC for use of a storage siding at Willow Tree. These approaches were unsuccessful. As a result, SSR’s banking locomotives were required to be attached to the rear of its trains at Werris Creek. 

The grade between Werris Creek and Willow Tree was undulating, which meant the train forces would alternate between compressed (bunched) and tensile (stretched) states en route. For this reason, both SSR’s notice 62269 (Ardglen banking procedures) and ARTC train operating conditions (TOC) waiver 21004 (operation of SSR trains and light engines between Newcastle and Moree & return), required the banking locomotives to be hard coupled to the rear of the train being banked, with the brake pipe connected. 

The hard coupling requirement was a control for the bespoke risk of SSR’s Ardglen banking operations, when compared to that of its competitors, of a potential separation between the banking locomotives and the rear of the banked train while traversing undulating territory. However, this risk control introduced an added risk: a train separation en route if the hard coupling at Werris Creek was performed incorrectly, such as on the day of the accident.

Drivers did not perform a stretch test 

Inspections onsite and post-accident testing found that the couplers on locomotive L277 and wagon BGKF 1122F were mechanically sound, intact and in place at the time of the collision. As such, it is highly likely that the cause of the separation was that one or both knuckles of the couplers, on L277 or BGKF 1122F, had remained unlocked after coupling of the banking locomotives to the rear of 5446 at Werris Creek. 

The design of automatic couplers requires that the locking block be moved clear of the inner knuckle to allow the knuckle to be opened to uncouple or couple. Operating the coupler’s control rod acts on the lifter, moving the locking block clear of the inner knuckle. After coupling, the locking block falls back in front of the inner knuckle as the knuckle closes, locking it in place. The lifter can be either top or bottom operated. The lifter fitted to L277 was bottom operated, whereas the lifter on BGKF 1122F was top operated.

While a top operated lifter provides a clear visual indication of the position of the locking block, a bottom operated lifter does not always do so. For the latter, the visual difference of the lifter between a locking block in a locked versus unlocked state can be difficult to confirm, due to both limited lifter movement and obstructed view of the positioning of the lifter underneath the coupler. As a result, the lifter position on a bottom operated coupler is not a reliable indicator of the locking block position, requiring a stretch test to prove the knuckle is locked.

In interview, both the mentor driver (who was on the ground for the shunt) and the trainee driver (who was operating the banking locomotives), advised that they had performed a gravity stretch test after coupling to the rear of 5446. They stated they had observed the banking locomotives roll away slightly from the rear of 5446 until the slack in the coupler knuckles had stretched out, with the couplers remaining coupled.

A review of the CCTV at Werris Creek, which recorded the coupling of the banking locomotives to the rear of 5446, showed that:

  • after coupling to the rear of 5446, the banking locomotives rolled away slightly
  • at the time of this slight roll back, the mentor driver had momentarily looked away from the coupler and locomotive, meaning they did not observe this movement.

A review of the data logger found that after coupling:

  • the direction controller stayed in reverse and was not placed in neutral or forward, which would be expected if conducting a gravity stretch test
  • brake cylinder pressure was present on the banking locomotives during and after coupling, meaning its brakes were partially applied, limiting movement.

Due to the brake cylinder pressure on the banking locomotives at time of coupling, it is highly likely the slight movement observed after coupling related to a spring back of the coupler draft packs, rather than a stretch out of slack between the coupler knuckles. The latter was required to verify that the knuckles had locked in the closed position.

Based on the above information, it is highly likely that the bottom operated coupler on L277 had remained unlocked after coupling to the rear of 5446 at Werris Creek. This was not identified at the time of coupling due to limited visual cues of the locking block state, nor was it verified by performing and observing the outcome of a stretch test. 

Knowledge and competency in shunting  

Assurance of competency 

Procedural differences between rolling stock operators 

Had a stretch test been performed at Werris Creek, L277 would likely have separated from the rear of 5446 verifying that the knuckle on the coupler was unlocked. This would have allowed a re‑coupling to occur until the knuckle on L277 was proved to be locked.

During interview, both the mentor driver and trainee driver advised that they understood a stretch test to be conducted by gravity. That is, if the rolling stock rolled apart after coupling but remained secured, it was proved to be successful. However, there was an awareness that low traction power could be applied in instances where gravity was insufficient to create a roll apart force.

While this was consistent with SSR’s stated expectations, by contrast, two of Australia’s largest rail freight operators required the application of low traction power during a stretch test to ensure a sufficient tensile force was applied to the knuckles. Irrespective of method, the purpose of a stretch test is to provide confidence that the knuckle is fully locked and will not separate on entering traffic. 

The difference in stretch test method between RSOs illustrates that, as with many rail industry procedures, it was determined by individual operators rather than by an industry standard. Given the frequent procedural differences between operators the assessment of competence against and thereby meeting the RSO’s specific procedural requirements becomes of particular importance. This is particularly relevant in instances where personnel have transferred into an organisation holding previously attained qualifications from another operator, which may be aligned to different procedural requirements to that of the new organisation.

Assessment evidence

The mentor driver formally received shunting qualification TLIC3017A (shunt rolling stock) in 2013. This competence was later verified through verification of competency checklists (2016 and 2017), recognition of prior learning assessments to align with TLIC4074 (shunt, couple and uncouple rail vehicles) in 2019 with Pacific National, and a practical assessment when joining SSR in mid-2020. In all instances, the mentor driver was found competent in performing a stretch test. However, a review of the assessments found that evidence was limited to checkboxes that the task was completed, rather than recording detail of the mentor driver’s understanding of the stretch test process, or their observed actions when conducting it.

The trainee driver was initially qualified in shunting qualification TLIC4074 in 2017. On joining SSR in August 2020, they undertook a practical assessment in shunting where they were found competent in performing a stretch test. As with the mentor driver, a review of these assessments found that the assessments were limited to the checkboxes that the task was completed, rather than recording detail of the trainee driver’s understanding of the stretch test process, or their observed actions when conducting it.

For nationally recognised units of competency such as TLIC3017A and TLIC4074, assessments were required to follow the ‘principles of assessment’ and ‘rules of evidence.’ Key to these principles and rules was that sufficient evidence was gathered at the time of assessment to enable a sound, reliable and consistent competency decision to be made by all assessors. That is, based on the evidence collected, other assessors would come to the same competency assessment decision. By contrast, in the absence of following these protocols, sound, reliable and consistent competency decisions were unlikely to be made by assessors, which had the potential to undermine the integrity of the VET qualifications that were subsequently issued. 

To assist in meeting assessment requirements, the Australian Skills and Quality Authority (ASQA) provided a guidebook. It suggested that for a:

  • Theory assessment, model answers could be provided to enable the assessor to evaluate against responses provided.
  • Practical assessment, well described skills and observable behaviours should be defined, with underpinning knowledge of the task assessed by questioning how the task was being performed and why. The latter provided assurance to the assessor that the candidate was not mimicking a previously demonstrated task.

While these requirements for assessment applied to nationally recognised units of competency and qualifications, it did not apply to enterprise-based assessments conducted by rail transport operators. This included the practical assessments of the mentor driver and trainee driver performed by SSR in 2020. For these assessments, it was up to SSR to satisfy itself that the practical assessment adequately proved competence of its rail safety workers. It is worth noting that SSR was a registered training organisation and therefore familiar with the national assessment requirements. As such, it would be reasonable, and consistent with ONRSR’s Application of the AQF to rail safety worker competence assessment policy, that SSR would follow these same assessment principle and rule requirements during the delivery of its own enterprise‑based assessments, in the absence of any comparable alternative. 

In short, assessments which limited recorded evidence of demonstrated competency to a checkbox of successful completion, were not compatible with the requirements of VET assessments or, with ONRSR’s expectations in instances of enterprise attainment.  

Underpinning procedures

Critical to the training and assessment process is an underpinning procedure with which to benchmark these against. Without a formal procedure to reference, it is not possible to reliably deliver consistent training or assessment; rather, it relies on an individual trainer or assessor’s knowledge, skills, experience and judgement. This is not consistent with competency-based training and assessment principles and, has the potential to result in impartment of non-standard work practices and deficient skill sets.

While Pacific National expected light traction power during a stretch test, this was not contained in formal procedure, training, or assessment documents at the time the mentor driver was assessed as competent in shunting. Of note, after the accident the mentor driver stated that they had always understood stretch tests to be conducted by gravity/roll back, with light traction power used where there was a desire to capture the action on the data logger. This is at odds with what should have been trained and assessed while the mentor driver worked for Pacific National.

Similarly, while SSR stated to OTSI that it considered a successful stretch test could be conducted by a gravitational ‘bump’, without necessarily applying traction power, this too was not contained in any formal procedure, training, or assessment documents. As such, it is unclear how SSR’s trainers, assessors and train crew could have been aware of SSR's expectation, and therefore been consistently applying its expectations in practice. 

In summary, the mentor driver and trainee driver were assessed by several organisations as competent in the stretch test process, utilising both VET and enterprise-based assessments. It is acknowledged that, according to SSR, their understanding of the stretch test process was consistent with its expectations. However, assurance they did so prior to the accident was largely ineffective given that:

  • no benchmark existed to inform these competency judgements
  • insufficient evidence of competency had been collected
  • SSR’s unwritten procedural expectation (on which the competency was stated to be based) differed somewhat to other larger rail freight operators. 

In the case of the latter, this applied to the mentor driver given they were employed by one of these operators immediately prior to commencing with SSR.

Driver knowledge of coupler functionality

An integral design characteristic of automatic couplers is for the knuckle to remain unlocked after the control rod has been operated and released. The purpose of this safety design feature is to allow the knuckle to be manually opened by hand for coupling where it has not sufficiently opened, and to allow workers to stand clear of the rolling stock profile during uncoupling. 

However, this safety design feature requires the knuckle to be fully opened to dislodge the locking block tongue outwards off the set shelf, allowing the locking block to again drop and lock the knuckle when it is again closed. If this does not occur, the knuckle will remain closed but unlocked at the end of coupling operations regardless of how much inwards pressure is exerted. As a result, the train will separate when it is next moved with a draft (stretched) force as occurred in this accident.

The mentor driver’s previous shunting competency assessments (2016, 2017, 2019 and 2020) and associated training materials from both their previous employing operator and SSR, did not contain an explanation or operational requirements of this safety design feature. This was confirmed in a follow-up conversation with the mentor driver, who advised they had been taught only to open the knuckle in instances where there had been trouble in locking it during a coupling operation. In this case the ‘problem knuckle’ was to be fully opened and then closed (locked), with the other coupler’s knuckle then used to complete the coupling manoeuvre. As such, it is quite possible that identified instances of knuckles not locking previously may well have been related to the safety design feature operating as designed, that is, keeping the knuckle unlocked as it had not yet been fully opened.

In summary, the mentor driver had a misunderstanding of how an aspect of the automatic coupler’s safety design features operated. The knowledge and competency in operation of this would be a reasonable expectation for the role. 

Coupler instruction, training and assessment

A full understanding of the equipment is key in ensuring its correct operation. With this consideration, a review of SSR’s training and assessment materials was undertaken for the national unit of competency TLIC4074 (shunt, couple and uncouple rail vehicles) in relation to automatic coupler functionality and stretch tests. This unit of competency would be delivered to new employees who did not have prior shunting qualifications. 

It was found that the training materials did not explain:

  • a coupler design safety feature, which required an unlocked knuckle to be opened to allow relocking
  • visual limitations relating to the locking block position on bottom operated couplers.

While the training materials referenced an ability for locking blocks to jam, resulting in a knuckle remaining unlocked, it did not provide an explanation as to a possible cause (for example, the tongue of the locking block remaining on the set shelf), or how to rectify the situation. 

To identify situations where the locking block had not dropped, multiple references to stretch tests were made throughout the training materials. However, they did not describe the process by which these stretch tests were to be conducted. This was also reflected in the practical assessment of a stretch test, where no detail was provided of which skills and observable behaviours were to be demonstrated, or a record made of the underpinning knowledge of the task. SSR’s TLIC4074 training and assessment materials did not contain details of how to conduct a stretch test, as it did not have a procedure which described how it was performed. Therefore, there was no benchmark with which to underpin this competency. 

As a result, it was possible that learners could misunderstand the process of a stretch test and automatic coupler operation at the completion of their training. Further, it would be possible to go an extended period without these knowledge deficiencies being detected, given that SSR’s driver and driver’s assistant practical re-assessments did not contain these provisions. 

Risk identification and assessment

SSR, as an accredited rail transport operator (RTO), was required by the Rail Safety National Law (NSW) to manage its risks ‘so far as is reasonably practicable.’ Management of risk requires a formal process of identification, assessment, control, monitoring and review of all risks as they apply to the assessed task. A key component of this process is communication and consultation with internal and external stakeholders. For this reason, the Rail Safety National Law (NSW) stated that risk management consultation should include:

  • those that may be affected by the SMS, such as rail safety workers 
  • health and safety representatives (where applicable)
  • relevant unions
  • other RTOs (where interface agreements were required) 
  • the public (where appropriate).

SSR conducted a review of the risk assessment for its shunting operations in March 2019. The review team consisted of SSR managers and directors, most of who had previous experience as either a driver or driver’s assistant, with no stakeholders identified. Although incorrect coupling was not identified as a hazard, a risk control of competency in shunting was noted within the risk assessment. Issues surrounding the assurance of this competency are discussed in Assurance of competencywithin this safety analysis.

In relation to its Ardglen banking operations, SSR conducted a risk assessment review in October 2020. Although stakeholders for this operation were identified as SSR traincrew, SSR service planners and ARTC train control, the review team consisted of SSR managers and directors, who had a variety of previous operational experience. While this risk assessment identified the risk of train separation due to incorrect coupling, the risk control was limited to a stretch test at the time of the shunt. That is, the possibility of a train separation en route from other causes, such as rough track or mechanical failure, resulting in a collision was not considered. 

SSR highlighted during the investigation that it had extensive experience in both banking and push-pull operations, with this being the first accident due to a train separation during that time. An analysis of 1,261 rolling stock operator reports to ONRSR of train separation events nationally during the 5 year period of 2017 to 2021, found that the cause of 21% (264) could not be determined, with a further 44% (560) attributable to mechanical failure of the coupling. With an average of over 200 separation events a year, train separation events are a foreseeable risk in rail operations. 

For the SSR banking operation between Werris Creek and Pages River, the crew of the banking locomotives were seated in the rear locomotive, facing opposite to the direction of travel. Given the separation event happened on a straight section of track, the crew did not identify the separation when checking the rear facing mirrors at the time of the brake pipe pressure loss. Instead, had the crew been in the lead banking locomotive, facing the rear of 5446, the separation would have been identified and appropriate action taken to avert a collision. 

It is critical to note however, that a train separation can occur at any location within a train. If the separation were to have occurred on one of the last few wagons, the crew would similarly have had no vision of the separation event. In this case, while any detached wagons on the rear portion would have retained their braking capacity if the crew had bailed off the banking locomotive’s brake cylinder pressure, the wagon brakes would have needed to act not only on their own weight, but also the added weight of the banking locomotives with brakes fully released. That is, deceleration would have been at a reduced rate to that if the banking locomotive’s brake cylinder pressure had been retained.

As discussed in Emergency response to brake pipe pressure loss, SSR had not considered emergency response procedures for banking locomotives and the uniqueness of that operating environment in the case of train separation or derailment. It cannot be said with certainty that these risks during banking operations would have been identified and controlled had consultation with operational stakeholders occurred, given that the SSR managers and directors involved generally came from operational backgrounds. However, the risk of reasonably foreseeable risks such as these being missed during the risk assessment process is increased when consultation is limited to predominantly management staff, without the inclusion of those directly affected by the operation, and with recency in similar tasks.

Findings

ATSB investigation report findings focus on safety factors (that is, events and conditions that increase risk). Safety factors include ‘contributing factors’ and ‘other factors that increased risk’ (that is, factors that did not meet the definition of a contributing factor for this occurrence but were still considered important to include in the report for the purpose of increasing awareness and enhancing safety). In addition, ‘other findings’ may be included to provide important information about topics other than safety factors. 

Safety issues are highlighted in bold to emphasise their importance. A safety issue is a safety factor that (a) can reasonably be regarded as having the potential to adversely affect the safety of future operations, and (b) is a characteristic of an organisation or a system, rather than a characteristic of a specific individual, or characteristic of an operating environment at a specific point in time.

These findings should not be read as apportioning blame or liability to any particular organisation or individual.

From the evidence available, the following findings are made with respect to the separation of, and subsequent collision between, banking locomotives and grain train 5446 near Werris Creek, New South Wales, on 6 January 2022. 

Contributing factors

  • As the banking locomotives were placed on the rear of train no 5446 at Werris Creek and not Chilcotts Creek, the lead banking locomotive was required to be hard coupled to the train. This added an additional risk to SSR’s operations compared to that of other banking operations conducted on the Ardglen Bank.
  • After coupling the banking locomotives to the rear of train no 5446 in Werris Creek Yard, the trainee driver and mentor driver did not perform a stretch test for the bottom operated coupler to confirm the knuckle was locked.
  • While en route and shortly after cresting the hill leaving Werris Creek, coinciding with a release of the grain train's brakes, the banking locomotives separated from the rear of train no 5446.
  • After separation of the banking locomotives from the rear of train no 5446, the banking locomotive's brakes automatically applied. The trainee driver of the banking locomotives released the automatically applied locomotive brakes on two occasions before the collision.
  • The risk assessments conducted by Southern Shorthaul Railroad (SSR) for shunting and banking operations did not include consultation consisting of effective and meaningful engagement with all relevant stakeholders. This increased the potential that risks could be missed during the risk assessment process. (Safety issue)
  • Southern Shorthaul Railroad's (SSR's) emergency response procedures did not include requirements for banking locomotive operations. (Safety issue)

Other factors that increased risk

  • Southern Shorthaul Railroad's (SSR's) training and assessment did not include coupler functionality and the process to ensure correct coupling had occurred. Further, an underpinning procedure for the stretch test (effectively coupled) process did not exist. (Safety issue)
  • The mentor driver was not aware of the safety design feature in automatic couplers which required the knuckle to be opened fully to ensure it would lock after coupling. 
  • Several rolling stock operators (RSOs) assessed the mentor driver and trainee driver as competent in shunting operations through both VET and enterprise-based assessments. However, assurance that the skillset demonstrated had met all the RSO’s competency requirements was largely ineffective, as:
    • there was an absence of national procedures in shunting, resulting in differing procedural requirements between RSOs 
    • RSO procedural guidance for shunting was not always complete, resulting in undeterminable assessment benchmarks
    • competency decisions were reached with insufficient evidence collected to support these assessment decisions, whereby skills and observable behaviours were not defined and the underpinning knowledge of the task observed was not assessed.

Safety issues and actions

Central to the ATSB’s investigation of transport safety matters is the early identification of safety issues. The ATSB expects relevant organisations will address all safety issues an investigation identifies. 

Depending on the level of risk of a safety issue, the extent of corrective action taken by the relevant organisation(s), or the desirability of directing a broad safety message to the rail industry, the ATSB may issue a formal safety recommendation or safety advisory notice as part of the final report.

All of the directly involved parties were provided with a draft report and invited to provide submissions. As part of that process, each organisation was asked to communicate what safety actions, if any, they had carried out or were planning to carry out in relation to each safety issue relevant to their organisation. 

Descriptions of each safety issue, and any associated safety recommendations, are detailed below. Click the link to read the full safety issue description, including the issue status and any safety action/s taken. Safety issues and actions are updated on this website when safety issue owners provide further information concerning the implementation of safety action.

Coupler instruction, training and assessment

Safety issue number: RO-2022-001-SI-01

Safety issue description: Southern Shorthaul Railroad's (SSR's) training and assessment did not include coupler functionality and the process to ensure correct coupling had occurred. Further, an underpinning procedure for the stretch test (effectively coupled) process did not exist.

Safety advisory notice to rolling stock operators

SAN number: RO-2022-001-SAN-01

Knowledge of the design features of automatic couplers, their differences and limitations, particularly with regards to locking mechanisms, is key to understanding the importance of conducting a positive stretch test at the conclusion of a coupling manoeuvre. The ATSB advises that rolling stock operators should ensure their operational staff are advised and assessed on coupler locking design features which assist in maintaining a knuckle in an unlocked state and methods required to ensure the knuckle has again locked after coupling has occurred.

Emergency response to brake pipe pressure loss

Safety issue number: RO-2022-001-SI-02

Safety issue description: Southern Shorthaul Railroad's (SSR's) emergency response procedures did not include requirements for banking locomotive operations.

Risk identification and assessment

Safety issue number: RO-2022-001-SI-03

Safety issue description: The risk assessments conducted by Southern Shorthaul Railroad (SSR) for shunting and banking operations did not include consultation consisting of effective and meaningful engagement with all relevant stakeholders. This increased the potential that risks could be missed during the risk assessment process.

Safety action not associated with an identified safety issue

Whether or not the ATSB identifies safety issues in the course of an investigation, relevant organisations may proactively initiate safety action in order to reduce their safety risk. The ATSB has been advised of the following proactive safety action in response to this occurrence.
Additional safety action by Southern Cross Civil and Rail Training

In mid to late 2019, SCCRT reviewed and updated all TLI42615 (Certificate IV in Train Driving) materials to meet the individual units of competence. Prior to that time, legacy training materials were facilitated as grouped modules with a clustered approach. Included in the 2019 updates was the requirement for supporting evidence to be provided with on-job workbooks demonstrating the trainee had undertaken each task, for example, photographs and video footage of the performance of shunting tasks. Since 2020, further amendments have been undertaken to reflect changes to TLI42621 and TLI42622 (Certificate IV in Train Driving).

In addition to the above, after reviewing the draft report, SCCRT plans to make further amendments to its training materials for TLIC4074 (shunt, couple and uncouple rail vehicles) to strengthen student learning, knowledge, understanding and competence in relation to a ‘stretch test’.

Additional safety action by Pacific National

Pacific National advised that after reviewing the draft report, it had reviewed its training content regarding ‘stretch tests’. As a result, it was in the process of compiling new training materials to incorporate findings with the report.

ATSB comment

ATSB/OTSI welcomes the proactive safety action taken by both Southern Cross Civil and Rail Training and Pacific National, in response to findings within the report.

Safety advisory notice to rail transport operators

SAN number: RO-2022-001-SAN-02

The Australian Transport Safety Bureau strongly encourages rail transport operators, and registered training organisations acting on their behalf, to review and validate their rail safety worker competency assessments. This is to ensure these assessment tools, processes and judgements are reliably meeting the principles and requirements of competency-based training and assessment.

Glossary

AQFAustralian Qualifications Framework. Provided standards and policy for nationally recognised qualifications.
ASQAAustralian Skills Quality Authority. The regulator of the VET sector (except in Victoria and Western Australia).
ARTCAustralian Rail Track Corporation. The rail infrastructure manager for this accident.
CCTVClosed-circuit television.
NCONetwork control officer. Coordinates and manages train paths and track occupancy authorities.
OTSIOffice of Transport Safety Investigations. Based in Sydney, NSW, OTSI undertakes rail accident/incident investigations in NSW on behalf of the ATSB. In this capacity it operates under the provisions of the Transport Safety Investigation Act 2003 (Cwlth).
ONRSROffice of the National Rail Safety Regulator. Administered and enforced compliance with the Rail Safety National Law and Regulations.
PCSPower control switch. Caused by low brake pipe pressure, this automatically removes traction power and dynamic brake from the locomotive.
RPLRecognition of prior learning. Allowed for the assessment and recognition of competence which had been achieved through prior formal, non-formal or informal learning.
RSNLRail Safety National Law. Legislation which provided for safe railway operations in Australia.
RSORolling stock operator. Operates above rail assets, for example locomotives and wagons.
RTORail transport operator. Encompasses both rail infrastructure managers (track, signalling etc.) and rolling stock operators (locomotives, wagons etc.).
SCCRTSouthern Cross Civil and Rail Training. A registered training organisation that could impart VET qualifications.
SSRSouthern Shorthaul Railroad. The rolling stock operator for this accident.
SMS Safety management system. A systematic approach to organisational safety encompassing safety policy and objectives, risk management, safety assurance, safety promotion, third party interfaces, internal investigation and SMS implementation.
TOCTrain Operating Conditions.
VETVocational Education and Training. A practical alternative to university (higher education) studies, it provided workplace skills and technical knowledge.

Sources and submissions

Sources of information

The sources of information during the investigation included:

  • Aurizon
  • Australian Rail Track Corporation 
  • lead driver of 5446 
  • Office of the National Rail Safety Regulator
  • onsite visits by OTSI
  • Pacific National
  • photographs taken on the day of the accident
  • recorded data from the locomotives on 5446 
  • Southern Cross Civil and Rail Training
  • Southern Shorthaul Railroad
  • trainee driver and mentor driver on the banking locomotives attached to 5446
  • various documents and resources available in the public domain.

References

Vlasblom J, Pennings H, van der Pal J and Oprins E (2020) ‘Competence retention in safety‑critical professions: a systematic literature review’, Educational Research Review, 
(30):1–40, doi.org/10.1016/j.edurev.2020.100330.

Submissions

Under section 26 of the Transport Safety Investigation Act 2003, the ATSB may provide a draft report, on a confidential basis, to any person whom the ATSB considers appropriate. That section allows a person receiving a draft report to make submissions to the ATSB about the draft report. 

A draft of this report was provided to the following directly involved parties:

  • Australian Rail Track Corporation
  • Australian Skills Quality Authority
  • driver of the lead portion of 5446
  • mentor driver of the banking locomotives
  • Office of the National Rail Safety Regulator
  • Pacific National
  • Southern Cross Civil and Rail Training
  • Southern Shorthaul Railroad
  • trainee driver of the banking locomotives.

Submissions were received from:

  • Australian Skills Quality Authority
  • Office of the National Rail Safety Regulator
  • Pacific National
  • Southern Cross Civil and Rail Training
  • Southern Shorthaul Railroad

The submissions were reviewed and, where considered appropriate, the text of the report was amended accordingly.

Purpose of safety investigations

The objective of a safety investigation is to enhance transport safety. This is done through: 

  • identifying safety issues and facilitating safety action to address those issues
  • providing information about occurrences and their associated safety factors to facilitate learning within the transport industry.

It is not a function of the ATSB to apportion blame or provide a means for determining liability. At the same time, an investigation report must include factual material of sufficient weight to support the analysis and findings. At all times the ATSB endeavours to balance the use of material that could imply adverse comment with the need to properly explain what happened, and why, in a fair and unbiased manner. The ATSB does not investigate for the purpose of taking administrative, regulatory or criminal action.

Rail safety investigations in New South Wales

Most transport safety investigations into rail accidents and incidents in New South Wales (NSW) are conducted in accordance with the Collaboration Agreement for Rail Safety Investigations and Other Matters between the Commonwealth Government of Australia and the State Government of NSW. Under the Collaboration Agreement, rail safety investigations are conducted and resourced in NSW by the Office of Transport Safety Investigations (OTSI), on behalf of the ATSB, under the provisions of the Transport Safety Investigation Act 2003.

The Office of Transport Safety Investigations (OTSI) is an independent statutory body which contributes to improvements in the safety of bus, ferry and rail passenger and rail freight services in NSW by investigating safety incidents and accidents, identifying system-wide safety issues and sharing lessons with transport operators, regulators and other key stakeholders. Visit www.otsi.nsw.gov.au for more information.

Terminology

An explanation of terminology used in ATSB investigation reports is available here. This includes terms such as occurrence, contributing factor, other factor that increased risk, and safety issue.

Publishing information

Released in accordance with section 25 of the Transport Safety Investigation Act 2003

Published by: Australian Transport Safety Bureau

© Commonwealth of Australia 2024

Title: Creative Commons BY - Description: Creative Commons BY

Ownership of intellectual property rights in this publication

Unless otherwise noted, copyright (and any other intellectual property rights, if any) in this report publication is owned by the Commonwealth of Australia.

Creative Commons licence

With the exception of the Coat of Arms, ATSB logo, and photos and graphics in which a third party holds copyright, this publication is licensed under a Creative Commons Attribution 3.0 Australia licence.

Creative Commons Attribution 3.0 Australia Licence is a standard form licence agreement that allows you to copy, distribute, transmit and adapt this publication provided that you attribute the work.

The ATSB’s preference is that you attribute this publication (and any material sourced from it) using the following wording: Source: Australian Transport Safety Bureau

Copyright in material obtained from other agencies, private individuals or organisations, belongs to those agencies, individuals or organisations. Where you wish to use their material, you will need to contact them directly.

[1]     Distances measured from Central station in Sydney, NSW.

[2]     All time references in this report are in local time (Eastern Daylight-saving Time).

[3]     Banking is the process of temporarily attaching additional locomotives to a consist for additional traction power up steep uphill gradients. See Ardglen banking operations for further information.

[4]     The independent brake applies and releases the brakes on the locomotive/s only.

[5]     Stretch test: a test in which the couplers are physically verified to have locked securely. See Shunting requirements for further information.

[6]     Brake pipe continuity test: a train brake application and release conducted at the front of the train which is verified as also occurring to the rear of the coupled portion, thereby proving a continuous brake pipe without obstructions.

[7]     Dynamic brake alters the locomotive’s traction motor fields to a generator configuration. This results in a retarding force on the locomotive wheelsets, slowing the train.

[8]     The automatic air brake system operates through changes in air pressure in the train’s brake pipe, which runs the length of the train. Consequently, there is a time lag between brake commands initiated at the front of the train taking effect at the rear of the train.

[9]     PCS: automatically removes traction power from the locomotive when low brake pipe pressure is detected. It is designed to stop traction power working against an emergency braking event.

[10]    Bail-off: the action of releasing a locomotive’s brake cylinder pressure from an automatic brake application (see Independent brake).

[11]    Excessive braking can result in wheel lock. When this occurs, the wheel sliding/skidding along the rail head can result in flat spots on the wheel tread. These can result in wheel damage, rail damage, or derailment. 

[12]    The flowmeter (i.e. brake pipe charging flow indicator) indicates a flow of main reservoir air to the brake pipe in response to a brake release command or, uncommanded drop in brake pipe pressure. See Automatic brake.

[13]    Vigilance penalty: an automatic brake application will occur if a control command is not made or, an acknowledgement button is not pressed periodically on the locomotive. It is designed to stop the train if the driver becomes incapacitated. 

[14]    A rolling stock operator (RSO) that operated above rail equipment, for example, locomotives, wagons etc.

[15]    A driver’s assistant was a second person in the locomotive cabin who was to assist the driver with various tasks, for example signal sighting and obeyance, fault rectification, on-ground operational activities etc. A trainee driver (in addition to driver's assistant responsibilities), was in the process of gaining the knowledge and skills necessary to operate a train.

[16]    That is, 1 m rise in elevation for every 40 m travelled.

[17]    L/V ratio: the ratio between the outward lateral forces of the rail wheel against the rail and the downward vertical forces of the rail wheel to the top of the rail.

[18]    See SSR risk assessments in the section Banking operations for further information.

[19]    Slack: both ‘free slack’ (a small gap between successive coupler knuckles) and ‘spring slack’ (draft gear movement to allow for coupler shock absorption), allows free movement which increases as train length is increased.

[20]    Run-out: a ‘stretching out’ of slack (draft force), where the lead of the train is travelling faster than the rear. 

[21]    Further information relating to nationally recognised qualifications is provided in Training and assessment.

[22]    The act of separation resulted in the knuckle on L277 fully opening, allowing it to lock onto the coupler of BGKF 1122F on impact (see Automatic couplers for further information). 

[23]    Competency: the skills, knowledge and/or qualifications that a person performing the task is required to possess to enable them to perform the task without risk to themselves, others or the safe operation of the railway. Source: ONRSR guideline – identifying rail safety work under the RSNL.

[24]    Rail Safety National Law (NSW), ss.52 & 117.

[25]    See Enterprise training and assessment.

[26]    In Victoria and Western Australia, regulation of VET for domestic students (i.e. not overseas or online students), was provided by the Registration and Qualifications Authority (Vic.) and Training Accreditation Council (WA).

[27]    See AQF assessment.

[28]    See Training and assessment of shunting dutiesfor further information.

[29]    This standard was an enforceable legislative instrument, created under the provisions of the National Vocational Education and Training Regulator Act 2011 (Cwlth).

[30]    Registered training organisation: approved by ASQA to issue nationally recognised qualifications and Statements of Attainment once competence of the candidate was proven.

[31]    Version (2.2) was released in October 2019.

[32]    Safeworking: procedures and technology used for the safe separation between trains, people and plant.

[33]    Rail Safety National Law (NSW), s.117(4).

[34]    Rail Safety National Law National Regulations 2012, Sch.1(15).

[35]    Formal, e.g. non-aligned AQF competency; non-formal, e.g. on-the-job training; informal, e.g. structured enterprise‑based training.

[36]    For a more detailed explanation of train airbrake systems, refer to OTSI/ATSB investigation: RO-2020-022, Derailment involving loaded grain train 3966 near Dombarton, NSW on 15 December 2020.

[37]    The braking capacity on locomotives is higher than that of wagons, which will result in the trailing wagons running into the lead locomotive/s if the locomotive brakes are not bailed-off.

[38]    Push-pull: locomotives located at both the front and the rear of the train to enable ease of change in train direction.

[39]    Trim blocks: brake blocks made of a harder compound, designed to remove minor defects from wheels.

[40]    Class 3 skid: identified by SSR as a 40–60 mm skid, maximum 40 km/h to clear the track section only.

[41]    A description of the train airbrake system and its operation is provided in Train braking systems.

[42]    Commonly referred to as ‘SFAIRP,’ the Rail Safety National Law (NSW), s. 47, defined this as ‘…that which is (or was at a particular time) reasonably able to be done in relation to ensuring safety.’

[43]    Rail Safety National Law (NSW), s. 99.

[44]    While this referred to an earlier version of the standard (ISO 31000:2009), at the time of the accident it remained current.

[45]    Rail Safety National Law National Regulations 2012, Sch. 1, item 13.

[46]    See Ardglen banking operations – History.

Occurrence summary

Investigation number RO-2022-001
Occurrence date 06/01/2022
Location Near Werris Creek
State New South Wales
Report release date 20/08/2024
Report status Final
Investigation level Defined
Investigation type Occurrence Investigation
Investigation status Completed
Mode of transport Rail
Rail occurrence category Collision
Occurrence class Accident
Highest injury level Minor

Train details

Train operator Southern Shorthaul Railroad (SSR)
Train number 5446
Type of operation Bulk grain
Rail vehicle sector Freight
Departure point Narrabri North West Commodities, New South Wales
Destination Bullock Island Graincorp, New South Wales
Train damage Minor

Runway overrun involving Gippsland Aeronautics GA-8, VH-WSB, East Wallabi Island, Western Australia, on 26 December 2021

Final report

Report release date: 27/04/2022

Safety summary

What happened

On the morning of 26 December 2021, the pilot of a Geraldton Air Charter, Gippsland Aeronautics GA-8 Airvan prepared for an air-transport flight from Geraldton, Western Australia to East Wallabi Island. During the preparations, the pilot decided to carry an additional passenger from another flight, which was also scheduled to depart for East Wallabi Island. The pilot later reported that the rearrangement of the passengers resulted in the preparations for the flight being rushed.

Earlier in the day, the pilot had operated a flight in a Cessna 172 with an emergency position indicating radio beacon (EPIRB) positioned on their right hip. The pilot was aware that this would obstruct the flap lever in the Airvan and intended to move the EPIRB to their left hip prior to the East Wallabi flight, but during the rushed preparations, forgot to move it.

As the aircraft approached East Wallabi Island, the pilot attempted to select full flap for the landing, but the EPIRB obstructed the flap lever movement and prevented it from locking into the full flap position. Multiple further attempts to select full flap were unsuccessful, and the approach was continued with only the first stage of flap extended.

During the landing flare, the aircraft floated more than the pilot expected and touched down about midway along the runway (about 350 m from the end of the runway). After touch down the pilot applied normal braking but, as the aircraft approached the end of the runway, they realised an overrun was imminent and applied maximum braking. Despite that, the aircraft did not stop on the runway and overran it by about 15 m. The pilot and passengers were not injured, and the aircraft was substantially damaged in the accident.

What the ATSB found

The ATSB found that an emergency position indicating radio beacon worn by the pilot prevented the selection of full flap. The pilot possibly did not comprehend the effect of the reduced flap setting and continued the approach with the inappropriate flap setting.

During the subsequent landing, the aircraft floated significantly beyond the intended landing point. The pilot did not recognise the risk of a runway overrun and did not conduct a go around or apply sufficient braking to stop the aircraft on the remaining runway.

What has been done as a result

Following the accident, the operator modified their operating procedures to recommend that a process of threat and error management be conducted before all flights.

Safety message

This accident emphasises the need for careful flight preparation. Taking time to confirm that all required actions have been completed prior to departure minimises the chance of in-flight complications. To ensure effective flight preparation, the Civil Aviation Safety Authority publication: Visual Flight Rules Guide advises pilots to ‘give yourself time to review information free from distractions when making pre-flight decisions…avoid flying under time pressure’.

It also underlines the importance of commencing a missed approach early when the approach and landing deviate from the plan and a safe landing cannot be assured.

The Civil Aviation Authority of New Zealand publication: Good Aviation Practice, Mountain Flying recommends that pilots ‘always have a clearly defined decision point where you can go-around if you are not happy that a safe landing is achievable.’ This is especially relevant for operations involving short runways.


The investigation

Decisions regarding whether to conduct an investigation, and the scope of an investigation, are based on many factors, including the level of safety benefit likely to be obtained from an investigation. For this occurrence, a limited-scope investigation was conducted in order to produce a short investigation report, and allow for greater industry awareness of findings that affect safety and potential learning opportunities.

The occurrence

On the morning of 26 December 2021, the pilot of a Geraldton Air Charter, Gippsland Aeronautics GA-8 Airvan prepared for an air-transport[1] flight from Geraldton, Western Australia to East Wallabi Island. The flight was planned to carry 6 passengers.

While preparing for the flight, the pilot decided to carry an additional passenger from another flight, which was also scheduled to depart for East Wallabi Island. The pilot later reported that the rearrangement of the passengers resulted in the preparations for the flight being rushed.

Earlier in the day, the pilot had operated a flight in a Cessna 172 with an emergency position indicating radio beacon (EPIRB) positioned on their right hip. The pilot was aware that this would obstruct the flap lever in the Airvan and intended to move the EPIRB to their left hip prior to the East Wallabi flight, but during the rushed preparations, forgot to move it.

At about 1030 Western Standard Time,[2] the flight departed for East Wallabi Island with the pilot and 7 passengers on board (Figure 1).

As the aircraft approached the Island, the pilot positioned the aircraft to join the right base leg of the circuit for runway 36, extended the first stage of flap and observed the windsock indicating a northerly wind.

Figure 1: Flight overview

Figure 1: Flight overview

Source: Google Earth, annotated by ATSB

The pilot turned onto the final leg of the circuit and attempted to select full flap for the landing, but the EPIRB obstructed the flap lever movement and prevented it from locking into the full flap position. Multiple further attempts to select full flap were unsuccessful, and the approach was continued with only the first stage of flap extended.

Runway 36 was 667 m long with a slight downslope. The pilot aimed to touch down in the turnaround area of the runway (Figure 2). As the aircraft crossed the runway threshold at about 70 knots, the pilot reduced engine power to idle and flared [3] the aircraft. During the flare, the aircraft floated more than the pilot expected and touched down near the parking area about midway along the runway (about 350 m from the end of the runway).

Figure 2: East Wallabi Island airstrip

Figure 2: East Wallabi Island airstrip

Source: Google Earth, annotated by ATSB

After touch down, the pilot followed the operator’s normal practice of retracting the flaps and then applied normal braking. As the aircraft approached the end of the runway, the pilot realised an overrun was imminent, and applied maximum braking. Despite that, the aircraft overran the runway by about 15 m (Figure 3). The pilot and passengers were not injured, however the aircraft was substantially damaged, including detachment of a main landing gear leg.

Figure 3: VH-WSB after the runway excursion

Figure 3: VH-WSB after the runway excursion

Source: Operator

Aircraft wing flaps

The Airvan is fitted with manually operated wing flaps with three, selectable positions: retracted, first stage (14° down) and full (38° down). The position of the flaps is determined by notches engaged by the operating lever positioned on the cabin floor to the right of the pilot’s seat. In the retracted and first stage positions, the lever remained below the level of the pilot’s seat bolster. In the full flap position, the lever protruded above the level of the bolster (Figure 4). The aircraft flight manual stated that ‘landings are normally conducted with full flaps’.

Figure 4: Airvan flap lever

Figure 4: Airvan flap lever

Note: The flap lever rests below the pilot seat bolster and is not visible in the retracted and first stage positions (left). The flap lever protrudes above the bolster in the full flap position (right).

Source: Operator

The Civil Aviation Safety Authority publication Flight Instructor Manual (Aeroplane) provides the following information for a landing conducted without flaps which is also applicable (but to a lesser extent) when landing with a flap setting less than full:

The descent path may be flatter, making judgment more difficult…Due to the absence of drag there may be a longer float period.

Landing information

The aircraft departed Geraldton at a calculated take-off weight of about 1,696 kg.[4] The pilot reported the temperature on East Wallabi Island as 28° C. Using this data and assuming no head or tailwind component, the ATSB calculated that after touching down the aircraft required a landing roll of about 190 m to stop using full flaps (the selected first stage flap position should not have significantly altered that distance).

The United States Federal Aviation Administration publication: Airplane Flying Handbook, Chapter 9 Approaches and Landings provided the following information for pilots who encounter floating during landing:

The recovery from floating is dependent upon the amount of floating and the effect of any crosswind, as well as the amount of runway remaining. Since prolonged floating utilizes considerable runway length, it must be avoided especially on short runways or in strong crosswinds. If a landing cannot be made on the first third of the runway, or the airplane drifts sideways, execute a go-around.

Operator’s investigation

The operator’s internal investigation identified that the pilot did not have a full understanding of aircraft drag, effects of flaps, and ground effect. The investigation also noted that the operator’s normal practice of retracting flaps immediately after touchdown to maximise brake effectiveness may have led to the pilot prioritising flap retraction ahead of immediately applying braking action.

Pilot information

The pilot held a Commercial Pilot Licence (Aeroplane) and had a total flying experience of 1,227.6 hours including 528.3 hours in the Airvan. In the previous 90 days, the pilot had flown 80.6 hours, including 29.7 in the Airvan.

The pilot reported being well rested, but mildly unwell on the day. However, there was no indication that the illness reduced their performance. Similarly, the pilot’s general health, fatigue, or distraction were not considered to have contributed to the accident.

Training

The pilot was employed by the operator in July 2019. From that time until November 2019 and again in May 2020 and July 2021, the pilot underwent operator training and proficiency checks that included:

  • stabilised approaches
  • GA-8 Airvan operations
  • East Wallabi Island operations
  • short runway landings
  • go arounds
  • landings

These operator training and checks did not assess the specifics of aircraft drag, effects of flaps or ground effect as they were considered adequately covered during pilot licence testing.

Safety analysis

As the aircraft approached East Wallabi Island, the EPIRB positioned on the pilot’s right hip obstructed the flap lever and prevented their locking in the full flap position. The pilot did not consider a go around to allow for trouble shooting or repositioning of the EPIRB and continued the approach with just the first stage of flap extended. That configuration increased the required landing distance compared to the use of full flaps, although there was still sufficient runway length available to land safely.

During the landing flare the reduced drag of the first stage flap setting, possibly combined with a higher than normal approach speed, led to a longer float. While a go around should again have been considered after the aircraft floated significantly beyond the intended landing point, from the touchdown point it was possible to stop the aircraft in the remaining runway using maximum braking. However, possibly due to the priority given to retracting the flaps and the pilot not immediately recognising the risk of an overrun, maximum braking was not applied until insufficient runway remained to prevent the overrun.

Findings

ATSB investigation report findings focus on safety factors (that is, events and conditions that increase risk). Safety factors include ‘contributing factors’ and ‘other factors that increased risk’ (that is, factors that did not meet the definition of a contributing factor for this occurrence but were still considered important to include in the report for the purpose of increasing awareness and enhancing safety). In addition ‘other findings’ may be included to provide important information about topics other than safety factors. 

These findings should not be read as apportioning blame or liability to any particular organisation or individual.

From the evidence available, the following findings are made with respect to the runway overrun involving Gippsland Aeronautics GA-8, VH-WSB at East Wallabi Island, Western Australia on 26 December 2021

Contributing factors

  • An emergency position indicating radio beacon worn by the pilot prevented the selection of full flap. The reduced flap setting significantly increased the required landing distance.
  • During the landing, the aircraft floated significantly beyond the intended landing point. The pilot did not recognise the risk of a runway overrun and did not conduct a go around or apply sufficient braking to stop the aircraft on the remaining runway.

Safety actions

Whether or not the ATSB identifies safety issues in the course of an investigation, relevant organisations may proactively initiate safety action in order to reduce their safety risk. All of the directly involved parties are invited to provide submissions to this draft report. As part of that process, each organisation is asked to communicate what safety actions, if any, they have carried out to reduce the risk associated with this type of occurrences in the future. The ATSB has so far been advised of the following proactive safety action in response to this occurrence.

Safety action by Geraldton Air Charter

Following the accident, the operator modified operating procedures to recommend a process of threat and error management be conducted before all flights.

Sources and submissions

Sources of information

The sources of information during the investigation included the:

  • aircraft operator
  • pilot

References

Civil Aviation Safety Authority 2006, Flight Instructor Manual Aeroplane

Civil Aviation Safety Authority 2021, Visual Flight Rules Guide

Civil Aviation Authority of New Zealand 2021, Good Aviation Practice - Mountain Flying

Federal Aviation Administration of The United States 2021, Airplane Flying Handbook

Submissions

Under section 26 of the Transport Safety Investigation Act 2003, the ATSB may provide a draft report, on a confidential basis, to any person whom the ATSB considers appropriate. That section allows a person receiving a draft report to make submissions to the ATSB about the draft report.

A draft of this report was provided to the following directly involved parties:

  • operator
  • pilot

Submissions were received from:

  • operator
  • pilot

The submissions were reviewed and, where considered appropriate, the text of the report was amended accordingly.

Purpose of safety investigations

The objective of a safety investigation is to enhance transport safety. This is done through:

  • identifying safety issues and facilitating safety action to address those issues
  • providing information about occurrences and their associated safety factors to facilitate learning within the transport industry.

It is not a function of the ATSB to apportion blame or provide a means for determining liability. At the same time, an investigation report must include factual material of sufficient weight to support the analysis and findings. At all times the ATSB endeavours to balance the use of material that could imply adverse comment with the need to properly explain what happened, and why, in a fair and unbiased manner. The ATSB does not investigate for the purpose of taking administrative, regulatory or criminal action.

Terminology

An explanation of terminology used in ATSB investigation reports is available here. This includes terms such as occurrence, contributing factor, other factor that increased risk, and safety issue.

Publishing information 

Released in accordance with section 25 of the Transport Safety Investigation Act 2003

Published by: Australian Transport Safety Bureau

© Commonwealth of Australia 2022

image_5.png

Ownership of intellectual property rights in this publication

Unless otherwise noted, copyright (and any other intellectual property rights, if any) in this report publication is owned by the Commonwealth of Australia.

Creative Commons licence

With the exception of the Coat of Arms, ATSB logo, and photos and graphics in which a third party holds copyright, this publication is licensed under a Creative Commons Attribution 3.0 Australia licence.

Creative Commons Attribution 3.0 Australia Licence is a standard form licence agreement that allows you to copy, distribute, transmit and adapt this publication provided that you attribute the work.

The ATSB’s preference is that you attribute this publication (and any material sourced from it) using the following wording: Source: Australian Transport Safety Bureau

Copyright in material obtained from other agencies, private individuals or organisations, belongs to those agencies, individuals or organisations. Where you wish to use their material, you will need to contact them directly.

__________

  1.  The flight was operated under Civil Aviation Safety Regulations Part 135 (Air transport operations - smaller aeroplanes).
  2.  Western Standard Time (WST): Universal Coordinated Time (UTC) + 8 hours.
  3.  Flare: the final nose-up pitch of a landing aeroplane used to reduce the rate of descent to about zero at touchdown.
  4.  The maximum take-off weight of the aircraft was 1,814 kg.

Occurrence summary

Investigation number AO-2022-001
Occurrence date 26/12/2021
Location East Wallabi Island
State Western Australia
Report release date 06/05/2022
Report status Final
Investigation level Short
Investigation type Occurrence Investigation
Investigation status Completed
Mode of transport Aviation
Aviation occurrence category Runway excursion
Occurrence class Serious Incident
Highest injury level None

Aircraft details

Manufacturer Gippsland Aeronautics Pty Ltd
Model GA-8
Registration VH-WSB
Serial number GA8-07-125
Aircraft operator GERALDTON AIR CHARTER PTY LTD
Sector Piston
Operation type Part 135 Air transport operations - smaller aeroplanes
Departure point Geraldton Aerodrome, Western Australia
Destination East Wallabi Island, Western Australia
Damage Substantial

Fuel starvation and collision with water involving Rockwell International 114, VH-WMM, 1 km north of Redcliffe aircraft landing area, Queensland, on 19 December 2021

Final report

Report release date: 14/03/2024

Executive summary

What happened

On the morning of 19 December 2021, a Rockwell Commander 114, registered VH-WMM, departed Redcliffe aircraft landing area, Queensland for a private flight. On board were a pilot and 3 passengers. Shortly after take-off, the engine lost power and the pilot elected to return to the airfield. During the return, the aircraft lost altitude and impacted the ocean before becoming inverted. The occupants were unable to escape the aircraft and were fatally injured, and the aircraft was destroyed.

What the ATSB found

The ATSB found that during preparation for the flight, a perceived engine problem distracted the pilot during the conduct of pre-take-off checks. After rectifying the issue, the pilot did not complete the remaining pre-take-off checks (including fuel tank selection) before departure. Before take-off when there was no time pressure (and during the inflight emergency when there was), checks and action items were only done by memory rather than using the pilot operating handbook or third‑party checklists also on board.

While stored in the hangar, most of the fuel moved into the right wing tank. The pilot would have been aware of the fuel imbalance from measuring fuel in both tanks via a dipstick before flight. However, it was likely that the fuel tank selection prior to take-off was to the left fuel tank only, which led to fuel starvation and engine stoppage soon after take-off.

The pilot, likely experiencing the effects of stress and time pressure following the engine power reduction and then stoppage, did not conduct initial emergency actions and attempted to return to the runway for landing. However, the pilot did not maintain glide speed, and the aircraft impacted shallow water prior to reaching the airfield. During the return to the airfield, the pilot had extended the undercarriage for the intended landing. This contributed to the aircraft inverting when it collided with water. This likely resulted in occupant disorientation and added difficulty in operating the exits, reducing their ability to escape.

It is very likely that the passengers did not receive information about the brace position or actions to be taken in the event of a ditching as part of the pre-flight briefing. In the limited time available inflight after the power loss, the pilot also did not provide an emergency briefing or any instructions to passengers prior to impact with the water.

While the pilot was primarily responsible for the operation of the aircraft exits in an emergency, seating a child, who may require assistance, adjacent to an exit instead of an adult meant that a less suitable passenger was available to operate the exit.

Safety message

Use of the approved aircraft checklists, taken from the pilot operating handbook, provides pilots with the appropriate checks to be conducted for the aircraft type. Having these readily available in a written form, for the preparation and conduct of a flight, provides pilots with the detailed normal and emergency checks specific to the aircraft type without having to rely on committing these to memory. This ensures that aircraft are operated in a way that meets aircraft flight manual requirements and limitations.

Distraction can impact proper procedural processes and lead to interruption and omission of safety critical elements before take-off. The habit of restarting an interrupted checklist from the beginning is a means of ensuring that all steps to be performed are done so in order and the checklist is complete.

Proper fuel management will ensure fuel supply to the engine(s) remains uninterrupted at all stages of flight. The ATSB publication, Avoidable Accidents No. 5 - Starved and exhausted: Fuel management aviation accidents (AR-2011-112) outlines strategies and key messages for fuel management.

Thorough pre-flight briefings of passengers on how to operate exits, the brace position and actions that might be required in a ditching or other forced landing are essential to increase post‑impact survivability. Additionally, as supported by guidance, pilots should consider who might be best to assist in the case of an emergency, and brief and seat them accordingly.

The ATSB SafetyWatch highlights the broad safety concerns that come out of our investigation findings and from the occurrence data reported to us by industry. One of the safety concerns is: Reducing the severity of injuries in accidents involving small aircraft. 


The investigation

Decisions regarding whether to conduct an investigation, and the scope of an investigation, are based on many factors, including the level of safety benefit likely to be obtained from an investigation. For this occurrence, a limited-scope investigation was conducted in order to produce a short investigation report, and allow for greater industry awareness of findings that affect safety and potential learning opportunities.

The occurrence

On the morning of 19 December 2021, at the Redcliffe aircraft landing area, Queensland, a Rockwell International 114 aircraft, registered VH‑WMM, was being prepared for a local private flight under visual flight rules.[1] On board for the flight were the pilot and 3 passengers. The weather conditions and visibility were good, with light winds from the east.

Closed circuit television (CCTV) showed the pilot conducting a pre-flight inspection of the aircraft. This included draining a small amount of fuel from each fuel tank drain to check for any water contamination and using a dipstick to check the fuel tank quantity of each tank. 

A passenger video (see Appendix - Sequence of events) was recovered from a mobile phone which showed portions of the taxi, before take-off checks, and the accident flight. Several witnesses at the airfield, in boats near the airfield, and in other aircraft also observed the flight of VH-WMM (Figure 1).

Before the take-off, passenger video showed the pilot conducting before take-off checks (from memory) and did not show the use of any written checklists. While conducting the engine run-ups, the pilot perceived a technical difficulty with the aircraft, and the checks were paused. After notifying a ground crew member by phone, the pilot taxied back toward the ground crew who was walking towards the aircraft on the taxiway. The ground crew member recalled that through hand signals, the pilot identified the issue as misidentification of the mixture control for the propeller pitch control and communicated that they had identified and corrected the problem.

The pilot then taxied again for runway 07 without continuing or restarting the interrupted before take-off checks and continued direct to the runway holding point. The occupants of VH-WMM then discussed where other traffic was in the circuit, before entering and backtracking to the end of the runway. VH-WMM then turned and commenced the take-off at 0908 local time.

After take-off from runway 07,[2] the aircraft’s undercarriage and flaps were retracted, and 62 seconds later, while in a left climbing turn, the engine RPM started to fluctuate, followed by a large drop in engine power 3 seconds later. The (adult) passenger, seated on the rear-right side of the aircraft then asked the pilot about fuel coming out of the top of the right wing; however, the pilot did not respond to the question. The video also did not indicate the pilot conducting any engine troubleshooting activities. The pilot made 2 further left turns, which were consistent with manoeuvring the aircraft back toward the western end of runway 07 (Figure 1), and the stall warning sounded twice. About 17 seconds after the power reduction (1 minute 31 seconds after take-off), the engine stopped. 

Four seconds later, the video recorded the undercarriage warning bell followed by the stall warning. Based on the recorded sounds, it is likely the pilot responded by lowering the landing gear. Another pilot who was on final approach for runway 07 heard the pilot of VH-WMM broadcast on the radio that they were returning to the airfield.[3] 

Figure 1: Redcliffe aircraft landing area and VH-WMM approximate flight path and accident site

Figure 1: Redcliffe aircraft landing area and VH-WMM approximate flight path and accident site

Source: Google Earth, annotated by the ATSB

Over 24 seconds, the stall warning sounded another three times, followed by a turn directly toward the runway and then further stall warnings, two successive drops of the right wing and then the sounding of the ‘stall’ voice alert.

Three seconds later, as the aircraft neared the mangrove tree line to the north of the airfield, it contacted the water, about 170 m from the shoreline. The aircraft overturned and came to rest inverted in about 2 m of water. 

The pilot of another aircraft that was inbound to Redcliffe who had also heard the pilot of VH‑WMM make the returning to the airfield call, was alerted to the possibility of an accident from an unknown person on the radio upon arrival. After observing an aircraft in the water, the pilot contacted Brisbane air traffic control (ATC) to advise them of the accident. The pilot remained overhead the accident site while boats arrived at the scene and continued relaying information to ATC. 

Witnesses at the airfield and on nearby boats contacted emergency services and the Australian Volunteer Coast Guard. After being notified by a witness on a kayak, a nearby vessel made its way to the aircraft, arriving about 5 minutes after the accident. Following the impact with water, the inverted orientation of the aircraft meant that the door handles were submerged. First responders reported that it was difficult to locate the handles to open the doors from the outside. When inverted on the seabed in mud and silt, the upper door latches were also unable to be located. The disturbance of the mud/silt further reduced visibility of the exits and their operating handles. 

A coast guard vessel arrived onsite; however, the crew were also unable to gain access into the aircraft’s cabin. Queensland Police Service divers arrived at the aircraft about 2 hours after the accident. They observed the water to be about 1.5 m deep. Upon entering the water, police observed that visibility was very poor. The pilot’s door was shut and could not be opened. The right door was unlocked and slightly ajar, and police were able to open the door with some difficulty. The pilot and 3 passengers were fatally injured, and the aircraft was destroyed. 

Context

Pilot information

The pilot held a valid Private Pilot Licence (Aeroplane) and a Class 2 aviation medical certificate, valid until February 2023. The pilot held single and multi‑engine aeroplane ratings and endorsements for manual propeller pitch control, retractable undercarriage, and formation flying. At the time of the accident, the pilot had logged 334.3 hours in VH-WMM and had about 505 hours total aeronautical experience. 

The flight instructor who conducted the pilot’s last flight review in July 2021 stated that the pilot was assessed on engine failure after take-off. They also described that the assessed procedures on that review were similar to the accident flight, insofar as location of engine power loss and the actions that were to be taken as a result. During the flight review, the pilot had performed all actions to a satisfactory level.  

Pilot medical history

A review of the pilot’s Civil Aviation Safety Authority (CASA) medical file identified that the pilot had disclosed a hypertension condition and that they had been prescribed medication for it but did not list any other health issues or concerns.

Discussion with the pilot’s next-of-kin and general practitioner (GP) identified that the pilot was a long term, type 2 non-insulin dependent diabetic. The pilot had been prescribed medication for at least 10 years with medical records indicating tracked blood glucose readings back to January 2003, and an immediate family history of non-insulin dependent diabetes. The pilot had also been diagnosed with high cholesterol and had been prescribed medication for its treatment. The GP was also aware of a family history of heart disease. 

Of the last 3 CASA aviation medical examinations, the pilot had not declared their high cholesterol, diabetic status, and diabetes medication to their CASA designated aviation medical examiner (DAME), however had disclosed family history of both diabetes and heart disease to the DAME. Regarding the question in relation to diabetes on the pilot’s pre-examination medical history, the pilot indicated ‘unsure’, which was later changed by the DAME to ‘no’ during the examination.

Toxicology reports showed that the pilot of VH-WMM had detectable quantities of several substances, including a prescribed medication, paracetamol, and an over-the-counter sedating antihistamine. A carbon monoxide concentration of less than 5% was also detected in the analysis.

The ATSB sought advice from a specialist toxicologist regarding the potential effects the detected substances may have had on the pilot during the accident flight. The advice indicated that the level of antihistamine detected in the samples was low and suggested the drug had been used between 12 and 24 hours prior to the accident. They also reported that although the medication the pilot had been prescribed may have increased the sedating effects of the antihistamine, given the low levels detected it was unlikely there was any significant impairment of the psychomotor skills[4] required to fly an aircraft.

The specialist toxicologist also identified that there may have been an interaction between the multiple antihypertensive medications that the pilot had been prescribed[5] to lower blood pressure. However, from the passenger video it was noted that the pilot did not appear to be physically incapacitated, so it is very unlikely the pilot experienced any form of incapacitation prior to the accident.  

Aircraft information 

General information

The Rockwell International 114 is a 4-seat, single-engine aeroplane with fully retractable, trailing link undercarriage. It is powered by a 6-cylinder Lycoming IO-540 fuel-injected engine and is fitted with a 3-blade constant-speed propeller. Passenger and pilot access is by a door on each side of the aircraft cabin (Figure 2).

VH-WMM was manufactured in the US in 1977 and was first registered in Australia in May 2013. The last periodic inspection was conducted on 7 July 2021. At the time of the accident, VH-WMM had accrued a total time in service of 3,431.4 hours and had flown about 11 hours since the last inspection.

Figure 2: VH-WMM

Figure 2: VH-WMM

Source: Nathen Sieben, annotated by the ATSB 

Fuel system

The Rockwell 114 fuel system consists of 2 integral (wet wing)[6] fuel tanks, 1 in each wing, with a fuel gauge for each tank located in the cockpit. The fuel capacity is 132.5 L for each tank, with 128 L considered usable. Both fuel tanks supplied the engine through the fuel selector, gascolator,[7] electric fuel pump and an engine driven fuel pump. The fuel selector valve had 5 positions, which allowed the pilot to select OFF, LEFT, BOTH, RIGHT and OFF positions. 

The last refuelling of VH-WMM occurred before a flight on 16 October with an uplift of about 120 L of AVGAS, taking the total quantity to about full tanks. VH-WMM was then operated for about 2.2 hours over 2 flights, prior to the accident flight. On the day of the accident, the ATSB calculated that about 115 L of fuel remained on board, equivalent to about half tanks. 

CCTV at Redcliffe airfield showed that prior to the flight, the wings of VH-WMM were not level while parked on the tarmac. The right wing at the tip was about 60 cm lower than the left, indicating a fuel imbalance, where the right wing contained a greater fuel quantity than the left wing. The right-wing low condition indicated that fuel crossflow from the left to right fuel tanks may have occurred while VH-WMM was hangered. 

It is a known issue with the Rockwell International 114 that when the fuel selector is not placed in the OFF position when parked, fuel can flow from one tank to the other. Once a crossflow has started, the increasing fuel weight will also increase the lean of the aircraft, further promoting the fuel crossflow. This results in further uneven fuel distribution, and sometimes an overflow of fuel through the wing tank fuel vents when this imbalance fills one tank completely. The ‘local fix’ amongst the Rockwell 114 community to prevent the crossflow was to set the fuel selector to OFF when the aircraft was parked for an extended period of time. The possibility of fuel crossflow in VH-WMM was also known to the pilot. 

A review of the aircraft’s logbooks showed that in April 2011, a maintenance intervention was performed on the fuel system due to a crossflow defect occurring when the fuel selector was set to BOTH fuel tanks. The fuel selector position of VH-WMM was unknown prior to the day of the accident, however it is likely that it was not selected to the OFF position.

Undercarriage system

The Rockwell 114 is equipped with a hydraulically operated undercarriage. The aircraft is fitted with an undercarriage warning system. A switch is mounted on the throttle quadrant which connects to an undercarriage warning bell, activating whenever the throttle is brought to idle while the undercarriage is retracted. 

Stall warning

The Rockwell International 114 is fitted with an aural stall warning system, that provides an audible tone to indicate that the aircraft speed is slowing to a speed that it can no longer produce lift in flight.

On board video recorded the stall warning sounding 13 seconds after the engine experienced the large drop in power. The stall warning continued sounding intermittently throughout the remainder of the flight, indicating that the aircraft was only marginally maintaining airspeed above the stall speed. The stall warning horn activated multiple times during the final approach until impact with water. This indicates that the aircraft would have been within 3-4 kt of the straight and level flapless stall speed of about 63 kt.

VH-WMM was also fitted with a voice alert system. This unit was an electronic device which detected the activation of the existing aircraft stall and undercarriage warning systems. It was configured to place a voice warning directly into the pilot headset and through a built-in speaker in the unit itself. In this situation, a pilot who may not hear the aircraft-generated stall warning horns because of noise cancelling headsets, will have an electronic voice annunciation of the warning. 

A witness who had flown with the pilot previously described the system as functional and that it was an effective warning tool. The passenger video detected one annunciation of ‘stall’ from the built-in speaker, just prior to impact. It is unknown if the system was alerting the pilot through the headsets during the flight, however it is likely that the system was functioning, as other pilots who had been on board for previous flights had observed its operation.

Engine information

The engine fitted to VH-WMM was last overhauled in July 1998 and had accrued about 988 flight hours in operation. The overhaul schedule as listed in Lycoming Service Instruction SI 1009BE was 12 years or 2,000 hours, whichever occurred first.  

Although the engine had exceeded the calendar schedule of the manufacturer’s time between overhaul, this was permissible when the engine was maintained in accordance with the CASA on‑condition[8] requirements. At the last annual inspection in July 2021, the maintenance organisation had completed a piston engine condition report verifying the engine serviceability, which then permitted the engine to continue in service.

Site & wreckage information

Onsite examination

The wreckage was located about 1 km north of the Redcliffe airfield, on a tidal flat (Figure 3). The accident occurred about 40 minutes before high tide, and the water depth at the time of the accident was about 2 m. The aircraft impacted the water on a heading of about 218° in an upright, slight right-wing low, nose-down attitude, with the undercarriage in the extended position, and with the wing flaps retracted. 

Ground scars observed on the tidal flat indicated that after entering the water, the aircraft nose wheel and propeller contacted the seabed leading to the aircraft overturning, resulting in sudden deacceleration and the aircraft coming to rest inverted. Witnesses described the water directly around the aircraft to be murky due to the mud and silt seabed having been disturbed by the aircraft impact. The left door (pilot door) was in a closed and latched condition when the ATSB arrived onsite. The right door was found by police divers to be slightly ajar, and difficult to open during the recovery operation. 

Figure 3: VH-WMM accident site at low tide

Figure 3: VH-WMM accident site at low tide

Source: ATSB

The aircraft fuselage underside and right wing showed evidence of hydraulic[9] compression from impacting the water surface, and the engine had separated from the aircraft. The impact to the fuselage underside damaged the fuselage skins forward and aft of the wing main spar carry‑through, resulting in a large hole. The engine firewall had been punctured by the engine and the left rear side window was broken. The identified damage would have allowed water ingress into the fuselage. Fuel was visibly leaking from the right underwing fuel vent, and a strong fuel smell was evident at the site. 

Wreckage examination

The wreckage was recovered to a secure storage facility for a detailed examination. ATSB investigators established flight control continuity before the rear of the fuselage and empennage were separated to facilitate transport from the recovery point.  

A further flight control examination was performed with no defects noted. All components of the aircraft were identified and accounted for, and no pre-existing defects were noted with the airframe or engine.

Fuel system examination

Examination of the aircraft fuel system was carried out and found that the fuel selector was set to the LEFT tank at the time of the accident, and the auxiliary fuel pump was switched OFF. The gascolator was disassembled and contained water. After recovery of the wreckage, the fuel tanks’ contents were drained and consisted of:  

  • right wing: about 85 L of AVGAS recovered, with no visible water
  • left wing: about 25 L of water, with no visible AVGAS.
Engine & propeller examination

The engine and propeller displayed no pre-existing damage. The propeller damage was indicative of low rotational energy at the time of impact and exhibited damage to the blades and spinner due to impact with the seabed. The engine was externally examined, all components were accounted for, and the engine was able to be rotated. The engine was disassembled and examined at a CASA-approved engine overhaul facility under the supervision of the ATSB. The engine showed no evidence of pre-impact mechanical discontinuity or defects which would inhibit normal operation. 

Examination and testing of the engine fuel system was performed at a separate CASA-approved overhaul facility under ATSB supervision. Some system components had internal corrosion; however, this was most likely due to saltwater immersion. After removal of the corrosion, the system components tested correctly for operation. 

The fuel control unit (FCU) initially could not be tested. A disassembly of the FCU found internal corrosion within the regulating system and the centre body seal was found to be separated. The centre body seal was examined at the ATSB’s technical facilities in Canberra. ATSB determined that the internal seal separation had occurred when the FCU was disassembled for examination and was not a prior defect. 

Rockwell 114 procedures

Before take-off checklist 

At each critical phase of aircraft operation, pilots refer to checklists to guide them through specific items to configure the aircraft for the next planned phase of the flight. The Rockwell 114 pilot’s operating handbook (POH) [10] stated in 3 separate checklists,  ‘interior’, ‘before starting engine’, and ‘before take-off’ checklists, that the fuel selector valve is to be set to the BOTH position before the aircraft is ready for take-off.

Figure 4 shows the Rockwell 114 ‘before take-off’ checklist as detailed in the POH. Annotations highlight where the interruption occurred at the beginning of the accident flight, and the steps not completed as identified in the passenger video. The POH was located at the accident site at the rear of the pilot seatback, and passenger video showed that it was not accessed during the before take-off checks or during the flight.

Figure 4: Before take-off checklist

Figure 4: Before take-off checklist

Source: Rockwell 114 pilot’s operating handbook, annotated by the ATSB

Third-party checklists

CCTV footage showed the pilot passing a folder to the adult passenger who placed it into the rear of the pilot seatback prior to engine start. This folder was found on-site in the rear of the pilot seatback pocket and contained the third-party checklists inside. Both of these checklists had interpretations of the Rockwell 114 POH checklists and had differences to the approved manufacturer’s documentation. This included changes in the checklist sequence, and omissions of some elements including the absence of one of the fuel selector checks. 

CASA issued AC 91-22v2.0 Aircraft checklists, in November 2021 to provide guidance on establishing and using aircraft checklists and is derived from Civil Aviation Safety Regulation 91.095 Compliance with flight manual. This stated that any third-party checklists ‘must concisely convey each procedural step in correct sequence’ to ‘ensure aircraft are operated in a way that meets flight manual requirements and limitations.’ 

The US Federal Aviation Administration released a safety alert for operators (SAFO) 17006, in April 2017, warning pilots and operators of the risks of using commercially available and personally derived, third-party checklists. 

An acquaintance who had regularly flown with the pilot reported that the pilot would also use generic mnemonic checklists that had been committed to memory, instead of the POH or the third‑party checklists. The commonly used mnemonic covered some, but not all of the checks required by the POH checklist.  

Engine failure management

The Rockwell 114 POH emergency procedures checklist for an in-flight engine failure stated that the glide speed of 82 kt should be adopted, the auxiliary fuel pump selected on, mixture full rich, and the fuel selector be placed on the fuller tank to rectify possible fuel starvation. 

Maintaining the published glide speed in flight gives the optimal amount of lift for the least amount of drag, thereby giving the greatest glide distance for the amount of height lost during the descent.

Rockwell 114 ditching procedure 

A ditching is a controlled emergency landing on water. The Rockwell 114 POH ditching procedure identified that on approach to a ditching, the airspeed should be maintained at 82 kt. 

The procedure followed on to list: transponder (if installed) set to 7700, and a mayday call should be made. The emergency locator transmitter should be activated if installed, seats, seatbelts, shoulder straps and loose objects should be secured, flaps should be up, cowl flaps closed, and the undercarriage retracted. 

On final approach, flaps should be set to 20°, airspeed reduced to 74 kt, the undercarriage should remain retracted, and propeller set to high RPM. On touchdown, the elevator should be full aft, and the fuel selected to OFF.

Ditching guidance

In 2004 the ATSB made recommendation R20010258 which stated:

The Australian Transport Safety Bureau recommends that the Civil Aviation Safety Authority educate industry on procedures and techniques that may maximise the chances of survival of a ditching event. Part of that education program should include the development of formal guidance material of the type contained in the UK CAA General Aviation Safety Senses leaflet 21A Ditching.

In response to the recommendation CASA published CAAP 253-1(1) Ditching. This guidance was reissued in the form of AC 91-09 v1.0 and included but was not limited to the following safety advice about conducting a ditching:

For an aeroplane, it is likely to end up in a nose down vertical position after impact. Opening a forward door in these circumstances to escape may cause rapid water entry. Planning for this circumstance should include consideration of which exit might be opened prior to and after impact and briefing passengers on precautions when releasing seat belts. Any briefing should consider the prospect that the pilot may not be able to assist due to their prominent position where impact forces may be concentrated. An able-bodied passenger near an accessible exit would be the best resource for survivability in this situation.

The guidance also recommended unlatching a door prior to impact and providing passengers with a briefing, which included the brace position.[11]

Survival aspects

Passenger seating, exit location, and operation

The pilot (P) was seated in the front left seat location. The 3 passengers consisted of an adult and 2 children.[12] One child (C) was seated in the forward right seat next to the pilot and another child (C) was seated in the left-rear behind the pilot. The adult (A) passenger was seated in the rear‑right (Figure 5). Both aircraft doors were at the front row.

Figure 5: Seating positions

Figure 5: Seating positions

Source: Rockwell annotated by the ATSB

Figure 6 shows the aircraft doors, which were designed as both normal and emergency exits. Both doors had the same operation, which required 2 opening mechanisms to be manipulated, both when operating from inside or outside. One handle was located above the passenger/pilot head that needed to be rotated downwards to unlatch. The second handle was fitted to the forward lower part of the door and was a lever type arrangement, which was required to be pulled inwards to unlatch the 2 lower latches. Each door needed to be pushed outwards to open. There was no emergency jettison mechanism. 

Figure 6: Location of door interior operating handles

Figure 6: Location of door interior operating handles

Source: ATSB

CASA produced guidance for the allocation of passengers to exit row seats in multi-part advisory circular (AC) Passengers seated in emergency exit row seats for parts 121, 133 and 135 operators, however this AC was not applicable to private flights. 

In addition to passenger suitability, the AC identified risks associated with seating inappropriate persons at exits and recommended that operational procedures should be used to address this risk. 

Applicable risks included:

• exits being opened when they should not be e.g., a passenger opens the exit without assessing the outside conditions 

• operation of exits by passengers who are not aware of the instructions specific to that exit e.g. how to open, remove and discard the exit 

• passengers seated in an emergency exit row having an adverse reaction to the emergency due to inadequate briefings 

• passengers that are not suitably able-bodied, lacking the strength and ability to remove the exit, attempting to open the exit, and delaying or impeding an evacuation process. 

In addition, CASA guidance[13] identified that pilots should consider the possibility of incapacitation, and seat and brief an able-bodied person accordingly. However, passenger composition and operational considerations such as weight and balance must always be considered to determine passenger seat allocation. 

Pre-flight, exit and emergency briefings 

Civil Aviation Safety Regulations (CASR) 1998 Part 91 (General Operating and Flight Rules) manual of standards, Division 20.3 Passenger safety briefings and instructions which came into effect just prior to the accident on 2 December 2021,[14] required, among other things, that passengers be briefed on:

(f)    how and when to adopt the brace position;

(g)   where the emergency exits are, and how to use them;

(p)   the requirement that:

             (i)  passengers seated in emergency exit rows must be willing and able to operate the exit in the event of an emergency; and

            (ii)  such passengers must not have a condition that will cause them to obstruct the exit or hinder an emergency evacuation

While they had to be briefed, there was no legislative requirement to assess the suitability of a person[15] in an exit row for a private flight.

Guidance[16] on passenger safety briefings relevant for small aircraft operators included: 

  • to include the brace position in the pre-flight safety briefing
  • to advise passengers to adopt the brace position in an emergency
  • if the flight involves overwater operations, passengers are briefed on ditching procedures.
Briefings in practice

A witness who the accident pilot regularly flew with reported that the pilot would normally provide a briefing about the seatbelts and the operation of the aircraft exits. The instructor who assessed the pilot in their most recent flight review provided confirmation of consistent elements normally included in the pilot’s briefing.

The ATSB was unable to determine what information was provided to the passengers prior to flight on the day of the accident. Video footage captured during the emergency showed that the pilot did not provide an in-flight emergency briefing to passengers about the nature of the emergency or what actions to take.

Occupant injuries

A post-mortem examination of the pilot and passengers was conducted on behalf of the Queensland Coroner. The examination found all occupants had sustained injuries which may have caused some incapacitation but were insufficient to have been fatal. The reports found that the deaths were consistent with drowning. The report also detailed evidence of injuries consistent with being caused by wearing a harness or seatbelt.

Other information

Pilot medical requirements

As outlined above, of the last 3 CASA aviation medical examinations, the pilot had not declared their diabetic status or diabetes medication to their CASA designated aviation medical examiner (DAME).

The disclosure to DAMEs was required due to the nature of type 2 non-insulin dependent diabetes and its effect on aviation participants. The CASA Clinical practice guidelines for type 2 diabetes website stated their concerns:

Effect of aviation on [diabetes] condition:

• Difficulty with regular blood-sugar monitoring

• Irregular meal and sleep times

• Sedentary occupation

• Access to emergency sugar

Effect of [diabetes] condition on aviation:

• Overt incapacitation

- Cardiovascular event

- Cerebrovascular event

• Subtle incapacitation - end-organ damage

- Visual impairment (fields, low contrast sensitivity, colour)

- Impaired motor and sensory nerve function

- Impaired autonomic function (hypoglycaemia awareness). 

Pilots are permitted to hold a licence after a diabetes diagnosis. The CASA website further stated:

Type 2 diabetes is an aeromedically significant medical condition. Pilots and [air traffic] controllers who have been diagnosed with Type 2 Diabetes are required to ground themselves and notify this condition to their DAME.

In cases where the condition can be managed appropriately, and once cleared by the DAME, in accordance with the CASA guidelines, ongoing monitoring of the diabetes must be provided to CASA to prove that it is able to be managed and does not affect the pilot’s ability to fly. 

Safety analysis

Introduction

Shortly after take-off, VH-WMM likely experienced fuel starvation leading to a complete loss of engine power. During the attempted return to the airfield without power, the pilot did not maintain an adequate glide speed, and the undercarriage was extended, thereby reducing glide range, which resulted in the aircraft colliding with water before it reached the airfield and becoming inverted about 170 m from shore. 

This analysis will explore the power loss on take-off, flight planning and decision making of the pilot in command, and post impact survivability factors.

Checklist use

The passenger video identified that the pilot became distracted with a perceived engine problem during the before take-off checks and taxied back towards the groundcrew member. However, after realising that they had mis-identified the wrong engine control, the pilot then proceeded to the runway and conducted the take-off, without further completion of the required checks.

One essential aspect of the POH checklist stated that the fuel selector was to be set to BOTH. This ensures a positive supply of fuel can be delivered to the engine from both fuel tanks during take-off. There were two versions of the checklists on board the aircraft: the official aircraft POH included this item in 3 separate checklists, while the third-party checklists included it twice. While it is likely that the distraction affected the pilot’s completion of the ‘before take-off’ checklist items, the fuel selector was also not set to BOTH on the ‘interior’ or ‘before starting engine’ checks. 

Should a third-party checklist be used, it must be checked to ensure that it contains the correct information that is applicable for the aircraft being operated and that the checklist is verified against the approved POH checklists. The ATSB was advised that the pilot sometimes referred to the third-party checklists, however it is unlikely that the third-party checklists were referred to on the day of the accident as the folder containing the checklists were located in the pilot seat back pocket and not readily at hand.

The POH was carried on board the aircraft on the day of the accident, and the passenger video showed it was not referred to during the flight. 

On this basis, it is likely the pilot performed the before take-off checks from memory or used a mnemonic checklist to perform the before take-off checks which were ultimately interrupted. Before take-off, there is no time pressure (as there was inflight after the engine power loss), so there was opportunity to consult the written checklists to ensure all steps were completed. Conducting aircraft checks from items committed to memory can lead to checks being skipped or an assumption that a check has been completed when it has not. Also, when a checklist is interrupted, the habit of restarting from the beginning is a means of ensuring that all steps to be performed are done so in order and the checklist is complete.

Fuel imbalance

Analysis of CCTV imagery indicated it was likely that VH-WMM had a substantial quantity of fuel in the right wing, and that the pilot would have been aware of the imbalance after physically using a dipstick to check the aircraft fuel tanks during the pre-flight checks on the ground outside the hangar.

The fuel selector was found to be on the left tank after the accident and there was no video evidence of the pilot changing it during the flight. Therefore, the fuel selector was likely on the left tank during take-off. Due to the fuel imbalance, the left tank likely had minimal fuel to sustain engine operation during the climb out, which would result in the engine being starved of fuel, lose power, and begin to surge, and eventually stop. This is consistent with no fuel being found in the left tank after the accident. 

If the fuel selector was placed on BOTH tanks, then it is likely, even with one fuel tank having most of the fuel and the other almost empty, that fuel supply to the engine would remain unaffected. Excess fuel in the right tank may have led to the observed fuel coming from the right wing during the flight.

Therefore, with the aircraft’s remaining fuel supply most likely in the right tank, and with the fuel selector likely set to LEFT prior to take-off, the engine became starved of the available fuel supply in the aircraft’s right fuel tank, leading to the engine stopping. 

Engine power loss management

ATSB found that few, if any, initial emergency actions took place in response to the loss of engine power to rectify a possible fuel starvation as per the Rockwell 114 procedures. The aircraft had sufficient fuel for flight in the right wing, but the fuel selector was found to be selected to the now empty left tank, and the auxiliary fuel pump was off during the emergency. 

In addition, the pilot did not maintain the published glide speed of 82 kt as demonstrated by the numerous stall warnings that sounded repeatedly, indicating a speed within 3-4 kt of the straight and level flapless stall speed (63 kt). Airspeed management was made more difficult by the extension of the landing gear, which may have been an automatic reaction by the pilot in response to hearing the undercarriage warning bell sound while the pilot was managing the emergency.

Not maintaining the glide speed and the landing gear extension increased the vertical rate of descent and reduced the glide range of the aircraft. However, video evidence suggests the pilot continued with their initial plan to glide to the runway. In addition, the extended landing gear was an unfavourable configuration for the subsequent collision with water.

There was no available evidence to indicate that the pilot’s response (actions and inactions) to the emergency was affected by a medical issue, or similar factors. However, the pilot was making decisions during the emergency under a high level of stress and time pressure. A substantial amount of research has shown that people often do not make optimal decisions in such situations.

Some commonly reported effects of stress and/or time pressure include attentional narrowing, with people searching fewer information sources (Staal 2004) and focusing on cues that are perceived to be the most salient or threatening (Burian and others 2005, Wickens and Hollands 2000). Working memory and the ability to perform complex calculations is impaired (Burian and others 2005), and the ability to retrieve declarative knowledge (or facts) from long term memory is affected (Dismukes and others 2015). In addition, a person under stress and time pressure will generally consider fewer alternatives, and not be as systematic when evaluating alternatives (Dismukes and others 2015, Staal 2004).

Collision with water

It is likely that the pilot never intended to ditch the aircraft. Rather, the reduced speed of the aircraft below the glide speed, exacerbated by the undercarriage extension, led to a reduced glide range and inability to reach the runway at Redcliffe. The sounding of the ‘stall’ alert just before the collision indicates the aircraft could no longer maintain lift and the aircraft collided with water 3 seconds later. 

It is likely that under the stress of the situation, the pilot’s attention narrowed and their focus on landing back on the departure runway likely hampered their ability to consider a forced landing on water (ditching). Had the pilot recognised that the aircraft would not be able to glide to the runway, there was a brief opportunity (about 30 seconds) to attempt a controlled landing on water before the aircraft’s speed reduced to the stall speed.

If this had been the case, there were several actions the pilot would have had to remember (due to the limited time remaining) and complete to ensure a safe ditching. From the Rockwell 114 POH procedure, key actions were to ensure the undercarriage was retracted and the flaps were selected to 20° on the final approach to land on the water. 

Use of flap in the final stages of the ditching would have provided a reduced stall speed, therefore allowing the aircraft to touch down at a lower, controlled speed. Touching down on the water while not at the appropriate speed, and with the undercarriage extended, contributed to the aircraft inverting after colliding the water.

Further, although there was no reference in the POH to the pre-impact position of emergency exits (cabin doors) prior to a ditching, unlatching of cabin doors can allow quick egress from the aircraft after ditching. In this accident, given the brief opportunity available for such considerations, it was not considered feasible that all actions were possible. 

Due to the inverted orientation of the aircraft during the crash sequence and its submersion in murky water, the aircraft occupants were probably panicked, confused, and disorientated following the collision. Once the cabin filled with water, visibility would have been extremely low, which would have further reduced the likelihood of occupants being able to visually locate and operate the aircraft door handles. With the aircraft inverted, it is likely the occupants would have also been disoriented to the extent that it made opening the closed doors more difficult, reducing their ability to escape.

Pre-flight and emergency briefings 

Research has shown that more knowledgeable passengers perform better in an emergency (Meng-Yuan, 2014). It could not be determined what information was provided to the passengers prior to flight, however based on accounts from persons who had flown with the pilot previously, including their flight instructor, it is likely that any briefing given did not include any information about the brace position or what to do in the event of a ditching. This meant that the passengers were likely unaware of actions that may assist survival such as opening the aircraft door or adopting a brace position.   

Video footage recorded during the accident sequence showed that the pilot also did not provide passengers an in-flight emergency brief or instruct them on any actions they should take. This accident highlights the importance of providing instructions to passengers before a flight commences as often emergency situations are time limited and there may not be an opportunity to do so once something occurs.  

Providing information on the adoption of the brace position or how to, and when to open an emergency exit in a ditching situation will increase the likelihood of passengers taking appropriate action in an emergency. 

Passenger seating and emergency exit operation

Post-mortem examinations identified that the occupants of the aircraft were not fatally injured during the accident sequence. There was no readily available assistance nearby the accident site, and therefore the occupants would have had to extricate themselves from the aircraft.

The 2 emergency exits available to the occupants were more accessible to persons seated in the front of the aircraft. The exits required manipulation of both a handle on the door and a latch at the top. For the rear passengers, it is likely that they would have had difficulty (particularly with their seatbelt on) to reach the latch at the top of the door if required to operate the exit. The rear seat occupants would have also been restricted in accessing the doors and exiting the aircraft due to the presence of the front seat occupants. 

After the accident, police divers were unable to open the pilot’s left door, and only opened the other (right) door with difficulty. For the injured pilot and right front seat occupant of VH-WMM, who was a child, it is highly unlikely they would have had the post-accident capability to open the doors. The right door was observed unlocked and ajar by police divers following the collision, suggesting the possibility that an attempt had been made to open the door.

Guidance suggests that pilots should determine the most appropriate person to assist in an emergency and to brief that person accordingly, therefore, in this case, seating a child who has less physical and mental capability rather than an adult next to an exit, meant that the most suitable person (the adult) was not in the best position to assist themselves and others in the event of an emergency. 

Diabetes

The pilot had been diagnosed with type 2 non-insulin dependent diabetes which was managed with prescription medication by the pilot’s GP. A review of the pilot’s CASA aviation medical information indicated that this significant medical condition was disclosed in the pilot medical history as ‘unsure’ to the CASA DAME in the previous 3 aviation medical renewals, all of which were changed to ‘no' at the DAME examination prior to submission to CASA.

It was important to note that having type 2 non-insulin dependent diabetes did not mean that this condition would be an immediate disqualification of the pilot’s licence. However, due to the aeromedically significant nature of diabetes, it was important for this to be fully disclosed with the pilot’s DAME and to CASA. Without this interaction, it was a missed opportunity for the pilot’s condition to be monitored at a safe level required to exercise the privileges of a pilot’s licence. 

Findings

ATSB investigation report findings focus on safety factors (that is, events and conditions that increase risk). Safety factors include ‘contributing factors’ and ‘other factors that increased risk’ (that is, factors that did not meet the definition of a contributing factor for this occurrence but were still considered important to include in the report for the purpose of increasing awareness and enhancing safety). In addition, ‘other findings’ may be included to provide important information about topics other than safety factors. 

These findings should not be read as apportioning blame or liability to any particular organisation or individual.

From the evidence available, the following findings are made with respect to the fuel starvation and collision with terrain involving a Rockwell International 114, VH-WMM, 1 km north of Redcliffe aircraft landing area, Queensland, on 19 December 2021. 

Contributing factors

  • An unsafe condition was created by not referring to the approved checklists in the pilot operating handbook. Checklists located in the pilot operating handbook would have prompted the pilot on 3 occasions to set the fuel selector to BOTH prior to take-off.
  • A perceived engine problem distracted the pilot during the conduct of pre-take-off checks. After rectifying the issue, they did not complete the remaining pre-take-off checks (including fuel tank selection) before departure.
  • A fuel imbalance and likely an incorrect fuel tank selection prior to take-off, led to fuel starvation and engine stoppage soon after take-off.
  • The pilot, likely experiencing the effects of stress and time pressure following the engine power reduction and then stoppage, did not conduct initial emergency actions and attempted to return to the runway for landing but did not maintain glide speed, and the aircraft impacted shallow water prior to reaching the airfield.
  • During the return to the airfield, the pilot extended the undercarriage, contributing to the aircraft inverting when it collided with water. This likely resulted in occupant disorientation, difficulty in operating the exits, and reduced their ability to escape.

Other factors that increased risk

  • It is very likely that the passengers did not receive pre-flight information about the brace position or what to do in the event of a ditching. In the limited time available inflight after the power loss, the pilot also did not provide an emergency briefing or any instructions to passengers prior to impact with the water.
  • While the pilot was primarily responsible for the operation of the aircraft exits in an emergency, seating a child, who may require assistance, adjacent to an exit instead of an adult meant that a less suitable passenger was available to operate the exit if required.
  • The pilot had a diagnosed type 2 diabetic condition and did not directly declare this to the DAME during multiple medical renewals. 

Sources and submissions

Sources of information

The sources of information during the investigation included:

  • Civil Aviation Safety Authority
  • Queensland Police Service
  • Australian Volunteer Coast Guard
  • accident witnesses
  • CCTV footage
  • passenger mobile phone recordings
  • the pilot’s general practitioner
  • the pilot’s designated aviation medical examiner
  • the flight review instructor
  • maintenance organisation

References

Australian Government 2021, AC 91-22 Aircraft checklists v2.0, Civil Aviation Safety Authority, Canberra, ACT, viewed 18 December 2023, < AC 91-22 v2.0 - Aircraft checklists (casa.gov.au)>

Australian Government 2022, Type 2 Diabetes - Non-insulin dependent - Low risk of hypoglycaemia, Civil Aviation Safety Authority, Canberra, ACT, viewed 7 February 2022, < Type 2 Diabetes - Non-insulin dependent - Low risk of hypoglycaemia | Civil Aviation Safety Authority (casa.gov.au)>
Australian Government 2023, Avoidable Accidents No. 3 - Managing partial power loss after take-off in single-engine aircraft, Australian Transport Safety Bureau, Canberra, ACT, viewed 8 February 2022, < Avoidable Accidents No. 3 - Managing partial power loss after take-off in single-engine aircraft | ATSB> 
Australian Government 2023, AC 91-09 Ditching v1.0, Civil Aviation Safety Authority, Canberra, ACT, viewed 25 January 2022, < AC 91-09 v1.0 - Ditching (casa.gov.au) >

Australian Government 2023, Part 91 (General Operating and Flight Rules) Manual of Standards 2020, Civil Aviation Safety Authority, Canberra, ACT, viewed 25 January 2022, Part 91 (General Operating and Flight Rules) Manual of Standards 2020 (legislation.gov.au)> 

Australian Government 2023, Passenger safety information, Civil Aviation Safety Authority, Canberra, ACT, viewed 25 January 2022, < Multi-Part AC 91-19, AC 121-04, AC 133-10, AC 135-12 and 138-10 - Version 1.1 (casa.gov.au)>

Australian Government 2023, Passenger safety information, Federal Register of Legislation, Canberra, ACT, viewed 24 January 2022, <Civil Aviation Order 20.16.3 - Air service operations - Carriage of persons (02/12/2004) (legislation.gov.au)>

Burian BK, Barshi I & Dismukes K 2005, The challenge of aviation emergency and abnormal situations, National Aeronautics and Space Administration Technical Memorandum NASA/TM-2005-213462. 

Casner SM, Geven RW & Williams RT 2013, ‘The effectiveness of airline pilot training for abnormal events’, Human Factors: The Journal of the Human Factors and Ergonomics Society, vol. 55, pp.477-485.

Chaiken, S. R., Kyllonen, P. C., & Tirre, W. C. (2000). Organization and components of psychomotor ability. Cognitive Psychology, 40(3), 198-226.

Dismukes RK, Goldsmith TE & Kochan JA 2015, Effects of acute stress on aircrew performance: Literature review and analysis of operational aspects, National Aeronautics and Space Administration Technical Memorandum NASA/TM-2015-218930.

United States Government 2017, Safety Concerns with Using Commercial Off-the-Shelf (COTS) or Personally Developed Checklists, Federal Aviation Administration, Washington, DC, viewed 10 January 2024, < SAFO 17006: Safety Concerns with Using Commercial Off-the-Shelf (COTS) or Personally Developed Checklists (faa.gov)>

Kahneman D 2011, Thinking, fast and slow, Allen Lane London.

Klein G 1998, Sources of power: How people make decisions, Massachusetts Institute of Technology.

Landman A, Groen EL, van Passen VV, Bronkhorst AW & Mulder M 2017, ‘The influence of surprise on upset recovery performance in airline pilots’, The International Journal of Aviation Psychology, vol. 27, pp.2–14.

Lycoming Engines 2021. Service Instruction No 1009BE Time Between Overhaul (TBO) Schedules, viewed 7 December 2021, Lycoming Engines <Service Instruction No. 1009 BE | Lycoming>. 

Meng-Yuan, L. 2014, An evaluation of an airline safety education program for elementary school children. Evaluation and Program Planning, Science Direct, viewed 21 January 2023, < An evaluation of an airline cabin safety education program for elementary school children - ScienceDirect>

Precision Airmotive Corporation 20200, Training Manual RSA Fuel Injection System, viewed 6 June 2023, <15-812_b.pdf (precisionairmotive.com)>

Precision Airmotive Corporation 2020, RSA Fuel Injection system schematic wallchart, viewed 24 March 2022, < precisionairmotive.com/wp-content/uploads/2019/06/WALLCHART_rsa.pdf>

Staal MA 2004, Stress, cognition, and human performance: A literature review and conceptual framework, National Aeronautics and Space Administration Technical Memorandum NASA/TM-2004-212824.

Wickens CD & Hollands JG 2000, Engineering psychology and human performance, 3rd edition, Prentice-Hall International Upper Saddle River, NJ.

Wikipedia 2023, Rockwell Commander 112/114 family, viewed 14 January 2022, Wikipedia < Rockwell Commander 112 - Wikipedia>

Submissions

Under section 26 of the Transport Safety Investigation Act 2003, the ATSB may provide a draft report, on a confidential basis, to any person whom the ATSB considers appropriate. That section allows a person receiving a draft report to make submissions to the ATSB about the draft report. 

A draft of this report was provided to the following directly involved parties:

  • the Civil Aviation Safety Authority
  • the National Transportation Safety Board
  • the pilot’s last flight review flight instructor
  • the pilot’s ground crew member
  • medical subject matter experts.

Any submissions from those parties was reviewed and, where considered appropriate, the text of the draft report was amended accordingly.

Appendix

Sequence of events

The sequence of events below lists the key activities and audio from the passenger recorded video. This recording was started at 0902 and 25 seconds. The time listed in the table below is added to this time stamp. The video began during the taxi back toward the ground crew after the perceived engine problem.

Table 1: Sequence of events from accident flight video 

Time (m:ss) from recording startTime (m:ss) after take-off commencementActivityComment
1:50 Stop at holding pointDiscussing location of other traffic
2:18 WMM enters and backtracks runway 07 
3:00 – 3:21 Take-off  
3:300:09Undercarriage retractsMotor heard during gear retraction
3:560:35Left turnAircraft over water
4:050:44Engine RPM decreasePilot reduces power after take-off
4:090:48Flaps seen retractingCaptured on video
4:150:54Left turnWMM now about 90° to runway heading
4:321:11Engine RPM fluctuatingDistinct rise and fall of engine RPM
4:351:14Large drop in engine RPM 
4:381:17Passenger asks pilot about fuel coming out of right-wing fuel cap 
4:38 & 4:421:17 & 1:21Two left turnsWMM now on downwind leg to airfield
4:48 & 4:51 1:27 & 1:30Stall warning sounds 
4:521:31Engine stopsDistinct ‘whomp’ sound from engine, usually heard when a piston engine stops
4:561:35Undercarriage warning bell followed by stall warning‘Click’ sound, followed by a wind noise. Gear extension most likely set here.
5:021:41Pilot speakingRadio call for return to runway
5:18, 5:20 & 5:241:57, 1:59, & 2:03Stall warning sounds 
5:252:04WMM turns directly toward runway 
5:26 to 5:402:05 to 2:19Stall warning multiple sounds 
5:402:19Right wing drops 
5:422:21

Right wing drops

Electronic voice calls “stall”

Aircraft stall warning remains on

Electronic voice is an alert from the Voice Alert System – heard only once
5:452:24Aircraft impacts water 

Source: ATSB based on passenger mobile phone recording

Purpose of safety investigations

The objective of a safety investigation is to enhance transport safety. This is done through: 

  • identifying safety issues and facilitating safety action to address those issues
  • providing information about occurrences and their associated safety factors to facilitate learning within the transport industry.

It is not a function of the ATSB to apportion blame or provide a means for determining liability. At the same time, an investigation report must include factual material of sufficient weight to support the analysis and findings. At all times the ATSB endeavours to balance the use of material that could imply adverse comment with the need to properly explain what happened, and why, in a fair and unbiased manner. The ATSB does not investigate for the purpose of taking administrative, regulatory or criminal action.

Terminology

An explanation of terminology used in ATSB investigation reports is available here. This includes terms such as occurrence, contributing factor, other factor that increased risk, and safety issue.

Publishing information

Released in accordance with section 25 of the Transport Safety Investigation Act 2003

Published by: Australian Transport Safety Bureau

© Commonwealth of Australia 2024

image_5.png

Ownership of intellectual property rights in this publication

Unless otherwise noted, copyright (and any other intellectual property rights, if any) in this report publication is owned by the Commonwealth of Australia.

Creative Commons licence

With the exception of the Coat of Arms, ATSB logo, and photos and graphics in which a third party holds copyright, this publication is licensed under a Creative Commons Attribution 3.0 Australia licence.

Creative Commons Attribution 3.0 Australia Licence is a standard form licence agreement that allows you to copy, distribute, transmit and adapt this publication provided that you attribute the work.

The ATSB’s preference is that you attribute this publication (and any material sourced from it) using the following wording: Source: Australian Transport Safety Bureau

Copyright in material obtained from other agencies, private individuals or organisations, belongs to those agencies, individuals or organisations. Where you wish to use their material, you will need to contact them directly.

[1]     Visual flight rules (VFR): a set of regulations that permit a pilot to operate an aircraft only in weather conditions generally clear enough to allow the pilot to see where the aircraft is going.

[2]     Runway number: the number represents the magnetic heading of the runway. In this case, 07 equates to 70°.

[3]     Radio communications on the common traffic advisory frequency at Redcliffe Aerodrome were not recorded.

[4]     Psychomotor skills refer to the co-ordination of perception and action and require either complex perceptual discrimination or a complex motoric response (Chaiken and others, 2000).

[5]     Records showed that the pilot had been prescribed 4 antihypertensive medications and had regularly been dispensed these medications in the months before the accident. Only 1 of these medications was detected in the toxicology analysis, however the type of analysis conducted would not detect the other 3 medications. 

[6]     Wet wing – the wing structure forms an integral fuel tank instead of a bladder or metal fuel tank. 

[7]     Gascolator – a fuel filter fitted at the lowest point of the fuel system.

[8]     On-condition: Performed only when the condition of an item demands, instead of at scheduled intervals.

[9]     Hydraulic: in this context is the deformation of the aircraft skin around its structural members (such as ribs). This deformation occurs by the action of water on the aircraft skin during the accident sequence.

[10]    While Rockwell uses the term pilot’s operating handbook, other manufacturers, and generic terms may include aircraft flight manual, flight manual, owner’s handbook, operating manual, or owner’s manual.

[11]    Brace position – adopted for ditching or crash-landing; shoes removed, bent forward with arms protecting head.

[12]    A child as defined by CASA is a person who has turned 2 but has not turned 13.

[13]    Civil Aviation Advisory Publication (CAAP) 253-1(1) Ditching (2004) now AC Ditching (2021).

[14]    The previous CAO 20.16.3 Air service operations - carriage of persons required that passengers be briefed to determine if they were willing and able if seated in emergency exits and CAO 20.11 Emergency and life-saving equipment and passenger control in emergencies required briefing on the location of the emergency exits, but not how to use them and did not include the brace position.

[15]    A suitable person has been defined in the CASA dictionary as someone that is reasonably fit, strong, and able to assist with the rapid evacuation of the aircraft in an emergency; and would not, because of a condition or disability, including an inability to understand oral instructions, hinder other passengers during an evacuation of the aircraft in an emergency or the aircraft’s crew in carrying out their duties in an emergency.

[16]    CASA guidance publications Cabin safety bulletin 12 - General aviation passenger briefings (2018), Civil Aviation Advisory Publication (CAAP) 253-1(1) Ditching (2004) now AC Ditching (2021), and Multi-part AC Passenger Safety Information (2021).

Preliminary report

Report release date: 28/02/2022

This preliminary report details factual information established in the investigation’s early evidence collection phase and has been prepared to provide timely information to the industry and public. Preliminary reports contain no analysis or findings, which will be detailed in the investigation’s final report. The information contained in this preliminary report is released in accordance with section 25 of the Transport Safety Investigation Act 2003.

The occurrence

On 19 December 2021, at about 0908 Eastern Standard Time,[1] a Rockwell International 114, registered VH-WMM, departed Redcliffe Aerodrome, Queensland, for a private scenic flight under visual flight rules. On board were the pilot and 3 passengers. The weather conditions were fine, with light winds from the east.

A number of witnesses located at the aerodrome, on the water in pleasure craft, and in other aircraft, observed VH-WMM (Figure 1). Witnesses at the aerodrome stated that, after VH-WMM took off from runway 07,[2] the landing gear was retracted and, a short time later, the engine ran rough for a brief period before stopping completely.

Another pilot was on their final approach for runway 07 and observed VH-WMM airborne. As that pilot was making their landing, they heard the pilot of VH-WMM broadcast on the radio that they were returning to the aerodrome.[3]

According to witnesses, the pilot of VH-WMM made 2 left turns, which were consistent with manoeuvring the aircraft back toward the western end of runway 07. During the return to the aerodrome, the pilot extended the landing gear. Description of the flight from the witnesses was consistent with controlled flight during this period.

As the aircraft neared the mangrove tree line to the north of the aerodrome, it was observed to descend and ditch into the water, about 170 m from the shoreline. During the ditching, the aircraft flipped over, coming to rest inverted in about 2 m of water.

Witnesses at the aerodrome and on board nearby boats, contacted emergency services and the Australian Volunteer Coast Guard. After being notified by one of the witnesses, a nearby vessel made its way to the aircraft, arriving about 5 minutes after the accident. The vessel’s occupants stated there was low visibility in the water and the fuselage was resting inverted on the seabed. This led to difficulty for first responders identifying how to open the aircraft doors.

The pilot of another aircraft flying overhead observed VH-WMM ditch in the water and contacted air traffic control (ATC) to advise them of the accident. That pilot remained overhead the accident site while boats arrived at the scene, and relayed information to ATC. A Coast Guard vessel arrived onsite; however, the crew were also unable to gain access into the aircraft’s cabin.

Queensland Police Service divers arrived a number of hours later, confirming that the pilot and 3 passengers had been fatally injured. The aircraft was destroyed. 

Figure 1: Redcliffe Aerodrome and VH-WMM approximate flight path and accident site

picture1-ao-2021-053.png

Source: Google Earth, annotated by the ATSB

Context

Pilot information

The pilot held a valid Private Pilot Licence (Aeroplane) with the last flight review in July 2021, and a Class 2 Aviation Medical Certificate, valid until February 2023. The pilot held single and multi‑engine aeroplane ratings and endorsements for manual propeller pitch control, retractable undercarriage and formation flying. At the time of the accident, the pilot had about 504 hours total aeronautical experience.

Aircraft information

General information

The Rockwell International 114 is a 4-seat, single-engine aeroplane with fully retractable landing gear. It is powered by a 6-cylinder Lycoming IO-540 fuel-injected engine, and is fitted with a 3-blade constant-speed propeller.

VH-WMM was manufactured in the United States in 1977 and was first registered in Australia in May 2013. The last periodic inspection was conducted on 7 July 2021. At the time of the accident, VH-WMM had accrued a total time in service of 3,431.4 hours and had flown about 11 hours since the last inspection.

The aircraft type has 2 doors for pilot and passenger access, one on each side at the front of the aircraft cabin (Figure 2).

Figure 2: VH-WMM

picture2-ao-2021-053.png

Source: Nathen Sieben, modified by the ATSB

Site and wreckage information

The wreckage was located about 1 km north of the Redcliffe Aerodrome, on a tidal flat (Figure 3). The accident occurred about 40 minutes before high tide, and the water depth at the time of the accident was about 2 m.

The aircraft had impacted the water in a slight nose-down and upright attitude with the landing gear in the extended position. After contacting the water, the aircraft flipped over in the direction of travel, resulting in the aircraft being inverted.

The impact had torn the engine from its mounts and there was structural damage to the fuselage underside and right wing. Fuel was leaking from the right underwing fuel vent, and a strong fuel smell was evident at the site. The flaps were in a retracted position at the time of the accident.

Figure 3: VH-WMM accident site at low tide

picture3-ao-2021-053.jpg

Source: ATSB

Wreckage examination

A marine salvage company recovered the aircraft the following morning on high tide and, after floating the wreckage to the Scarborough boat ramp, it was transported to a secure storage facility for a detailed examination (Figure 4). Removal of the rear fuselage and engine was carried out to necessitate transportation by road.

The examination revealed:

  • all components of the aircraft were accounted for at the accident site
  • no pre-impact defects were identified
  • a quantity of fuel was removed from the aircraft
  • the engine and propeller were able to be rotated.

Figure 4: VH-WMM recovered for examination

picture4-ao-2021-053.png

Source: ATSB

Further investigation

To date, the ATSB has:

  • recovered and examined the aircraft wreckage
  • conducted witness interviews
  • conducted a disassembly and examination of the engine
  • examined the maintenance history of the aircraft
  • examined security camera footage from the aerodrome.

The investigation is continuing and will include:

  • a disassembly of the propeller
  • testing of retained engine components
  • analysis of data recorded from onboard systems
  • a review of mobile phone footage.

Should a critical safety issue be identified during the course of the investigation, the ATSB will immediately notify relevant parties so appropriate and timely safety action can be taken.

A final report will be released at the conclusion of the investigation.

Purpose of safety investigations

The objective of a safety investigation is to enhance transport safety. This is done through:

  • identifying safety issues and facilitating safety action to address those issues
  • providing information about occurrences and their associated safety factors to facilitate learning within the transport industry.

It is not a function of the ATSB to apportion blame or provide a means for determining liability. At the same time, an investigation report must include factual material of sufficient weight to support the analysis and findings. At all times the ATSB endeavours to balance the use of material that could imply adverse comment with the need to properly explain what happened, and why, in a fair and unbiased manner. The ATSB does not investigate for the purpose of taking administrative, regulatory or criminal action.

Terminology

An explanation of terminology used in ATSB investigation reports is available here. This includes terms such as occurrence, contributing factor, other factor that increased risk, and safety issue.

Publishing information 

Released in accordance with section 25 of the Transport Safety Investigation Act 2003

Published by: Australian Transport Safety Bureau

© Commonwealth of Australia 2022

image_5.png

Ownership of intellectual property rights in this publication

Unless otherwise noted, copyright (and any other intellectual property rights, if any) in this report publication is owned by the Commonwealth of Australia.

Creative Commons licence

With the exception of the Coat of Arms, ATSB logo, and photos and graphics in which a third party holds copyright, this publication is licensed under a Creative Commons Attribution 3.0 Australia licence.

Creative Commons Attribution 3.0 Australia Licence is a standard form licence agreement that allows you to copy, distribute, transmit and adapt this publication provided that you attribute the work.

The ATSB’s preference is that you attribute this publication (and any material sourced from it) using the following wording: Source: Australian Transport Safety Bureau

Copyright in material obtained from other agencies, private individuals or organisations, belongs to those agencies, individuals or organisations. Where you wish to use their material, you will need to contact them directly.

__________

  1. Eastern Standard Time (EST) is Universal Time Coordinated (UTC) +10 hours.
  2. Runway number: the number represents the magnetic heading of the runway. In this case, 07 equates to 70°.
  3. Radio communications on the common traffic advisory frequency at Redcliffe Aerodrome were not recorded.

Occurrence summary

Investigation number AO-2021-053
Occurrence date 19/12/2021
Location 1 km north of Redcliffe Aerodrome
State Queensland
Report release date 14/03/2024
Report status Final
Investigation level Short
Investigation type Occurrence Investigation
Investigation status Completed
Mode of transport Aviation
Aviation occurrence category Collision with terrain
Occurrence class Accident
Highest injury level Fatal

Aircraft details

Manufacturer Rockwell International
Model 114
Registration VH-WMM
Serial number 14229
Aircraft operator Private
Sector Piston
Operation type Part 91 General operating and flight rules
Departure point Redcliffe Airport, Queensland
Destination Redcliffe Airport, Queensland
Damage Destroyed

Collision with terrain involving Air Tractor AT-400, VH-ACQ, 75 km west-south-west of Moree, New South Wales, on 4 December 2021

Final report

Report release date: 10/03/2023

Executive summary

What happened

On 4 December 2021, the pilot of an Air Tractor AT-400 aircraft, registered VH-ACQ and operated by Aircair Aviation Operations Pty Ltd (Aircair), was conducting aerial spraying operations on a property 75 km west-south-west of Moree, New South Wales.

At 0632 Eastern Daylight-saving Time, the aircraft took off from the property’s airstrip with the first spray load. The pilot then completed 10 spray loads, each time returning to the airstrip where the loader mixed about 1,250 L of chemical into the aircraft’s hopper. During that period, the loader also refuelled the aircraft twice.

Prior to departing with the eleventh load, the loader again refuelled the aircraft to full and mixed chemical into the hopper. The aircraft then returned to the western side of the target block, where the pilot had been spraying in a racetrack pattern on the previous load. After descending to recommence spraying towards the south, the aircraft climbed and turned away to track north and overfly a flood-affected area. The pilot radioed the company operations manager expressing concern about the weather conditions and the potential for chemical to drift onto a neighbouring property. About 5 minutes later, the aircraft returned to the target block, this time on the eastern boundary.  

The pilot then conducted 2 ‘smoker’ runs to assess the drift, followed by 5 back-to-back (parallel) spray runs. At the end of the fifth spray run, the aircraft was observed to climb then enter a right procedure turn. During the turn, the aircraft descended rapidly, collided with terrain, and was subsequently destroyed by fire. The pilot sustained fatal injuries.  

What the ATSB found

The ATSB found that the aircraft was too close to the start of the spray run during the turn, which probably resulted in the pilot tightening the turn. This almost certainly resulted in an aerodynamic stall at a height too low to recover before colliding with the ground.

Mishandling the turn was probably a result of the combined effects of the pilot experiencing high workload and fatigue due to long flight and duty times, inexperience, the complexity of the task and the weather conditions. The combination of these factors would likely have identified an elevated flight risk, had an aerial application-specific flight risk assessment been conducted. However, it was not a requirement to conduct a flight risk assessment or to have a flight risk assessment tool.

The pilot was almost certainly wearing a helmet and 4-point restraint increasing their chances of survival in an accident. However, the aircraft’s fuel tanks ruptured during the accident sequence resulting in a fire and fatal thermal injuries to the pilot.

The aircraft was not fitted with a crash-resistant fuel system, nor was it required to be under the standards in place at the time of manufacture. The current standards also do not require it. The ATSB found that on average, post-impact fire in VH-registered certified aeroplanes results in one fatality every 2 years in Australia. As such, post-impact fire presents a significant risk of fire-related injuries and fatalities to occupants of general aviation aeroplanes.

What has been done as a result

As a result of this accident, Aircair has implemented additional fatigue management measures, which include an assessment of other factors that may contribute to fatigue and flight risk, within the regulatory fatigue requirements.

In August 2022, the operator’s pilot group completed training with an expert instructor in advanced stall and spin prevention, recognition and recovery. The operator is investigating ways to incorporate such training into its pilot induction program.

Safety message

An aerodynamic stall occurs when the aircraft’s wing exceeds the critical angle of attack. The angle of attack of the wing is caused by the angle of deflection of the elevator, independent of the airspeed, pitch attitude, angle of bank, weight and power. Therefore, pilots should remain aware that if they pull the control stick (or column) back too far and deflect the elevator too far, it will increase the angle of attack of the wing beyond the critical angle and stall it. The control stick position at which an aircraft will stall is therefore also independent of airspeed, pitch attitude, angle of bank, weight and power, but specific to the aircraft and may change with flap configuration. To un-stall the wing, the pilot has to move the control stick forward to a position corresponding to an angle of attack below the critical angle of attack.

Aircair pilots who completed the advanced stall/spin training (after the accident), found that discovering the stall stick position and its independence of other factors was very beneficial, particularly because they frequently operated at low level in a loaded aircraft, often towards the margins of the aircraft’s flight envelope. They also identified that the stall stick position in Air Tractor aircraft was forward of other aircraft types they had flown.

The US Federal Aviation Administration’s Airplane Flying Handbook (2021) stated that reducing the angle of attack is crucial for all stall recoveries. As aerial application pilots are usually operating at a height too low to recover from a stall, stall prevention by maintaining an awareness of elevator control input is key to preventing similar accidents.

The 2014 US National Transportation Safety Board Special investigation report on the safety of agricultural aircraft operations identified that risk management guidelines and best practices specific to aerial application operations were necessary to help operators and pilots mitigate their unique risks. These practices should include checklists for performing flight risk assessments to identify hazards specific to the task. Mitigation strategies should then be implemented to support pilot decision-making, particularly during high-risk activities.

Post-impact fire has been found to present a significant risk to aircraft occupants, including those conducting aerial application operations. Crash-resistant fuel systems have been proven effective in helicopters and in automotive applications. Implementing requirements for similar engineering countermeasures in existing, newly manufactured and newly certified FAR 23 aeroplanes, would reduce the incidence of fire-related serious injuries and fatalities in otherwise survivable accidents (TSB, 2006).


The occurrence

On 4 December 2021, the pilot of an Air Tractor AT-400 aircraft, registered VH-ACQ and operated by Aircair Aviation Operations (Aircair), was conducting aerial application (spraying) operations on a property 75 km west-south-west of Moree, New South Wales.

At 0604 Eastern Daylight-saving Time,[1] the aircraft departed Moree Airport and tracked to the property’s airstrip, 43 km south-west of Moree Airport. A loader was stationed at the property’s airstrip, whose role was to mix and load chemical into the aircraft’s hopper, and to refuel the aircraft.

A GPS tracker onboard the aircraft recorded data at 15-second intervals. The data showed that commencing at 0632, the aircraft took off from the property airstrip and sprayed 11 loads over the course of the morning.

For the first 8 loads, the aircraft remained within sight of the loader. Those loads were sprayed using a racetrack pattern (Figure 1). Each of the 8 loads took about 20 minutes, except the third load, which took 32 minutes as it included clean-up spray runs (across the direction of the pattern) and tracking to the next target area. Each time the aircraft landed at the airstrip, the loader mixed chemical and water totalling 1,250 L into the hopper. On 2 of those occasions, the loader refilled the aircraft fuel tanks.

Figure 1: Racetrack spray pattern

Figure 1: Racetrack spray pattern

Source: ATSB

At 0914, while the pilot conducted the seventh load, the operations manager sent the pilot a text message advising that 4 of the target fields marked on the map were no longer to be sprayed (marked in orange in Figure 2). On the next (eighth) load, the pilot overflew an area marked on their map to be sprayed that day, which was adjacent to a river and under water due to flooding. As a result, the pilot radioed the operations manager to ask whether to spray the flood-affected area. The operations manager reported that they contacted the property owner but were subsequently unable to communicate with the pilot via radio to provide a response. 

Figure 2: Operating area including target spray blocks, location of airstrip, property boundary and neighbouring house 

Figure 2: Operating area including target spray blocks, location of airstrip, property boundary and neighbouring house

Source: Aircraft operator information overlaid on Google Earth, annotated by the ATSB

At 1053, the aircraft took off with the tenth load and continued to fly north-south racetrack patterns from the western side of blocks 127 and 128, followed by an inspection of the northern end of the target area, before returning to land at the airstrip again at 1120. The loader then filled the aircraft with fuel and loaded 1,250 L of chemical into the hopper. While the loader did those tasks, the pilot had a snack and a drink, and conducted a walk-around of the aircraft, which they had done consistently during refuelling breaks throughout the day.

At 1126:15, the aircraft departed on the eleventh load and tracked again towards blocks 127 and 128 to recommence spraying the next run from where they had left off (as can be seen in Figure 3), in the racetrack pattern. The pilot commenced a run to the south, but before reaching the target crop, the aircraft climbed and turned left. The aircraft then overflew the northern boundary of block 127, which was also the property boundary. The operations manager heard the pilot on the radio expressing concern about the potential for chemical spray to drift towards a house on the neighbouring property due to the wind. The aircraft then tracked north and again overflew the flood-affected area (top of Figure 2 and Figure 3), before returning to the north‑eastern end of block 127 (Figure 3).

Figure 3: GPS data showing the aircraft’s track on the accident load

Figure 3: GPS data showing the aircraft’s track on the accident load

Source: Aircraft operator TracPlus data overlaid on Google Earth, annotated by the ATSB

A witness reported that on the first and second runs along the eastern boundary, which were towards the south and north respectively, the pilot used smoke to assess the drift from the wind, before commencing spraying on the next (third) run. Instead of a racetrack pattern, the pilot conducted back-to-back spray runs with a procedure turn at each end. In a procedure turn, the aircraft is initially turned away from the direction of the turn, usually about 45°, before reversing the direction and completing the turn to position the aircraft on the reciprocal heading for the next spray run (Figure 4).

Figure 4: Back-to-back patterns with procedure turns

Figure 4: Back-to-back patterns with procedure turns

Source: Aerial Application Pilots Manual (Aerial Application Association of Australia, 2011), annotated by the ATSB

After the two ‘smoker’ runs, the aircraft sprayed 4 runs. At 1145, the aircraft commenced a spray run towards the south, at the end of which the aircraft climbed. The aircraft’s last recorded position was at 1145:30 about 170 m beyond the southern end of the field and 180 ft above the ground.

A witness (‘Witness 1’, Figure 5) located in the neighbouring paddock to the east, observed the aircraft turn slightly left then enter a right turn, consistent with a procedure turn. During the turn, the witness observed the aircraft’s nose pitch down and it descended rapidly, right‑wing low, then disappeared behind trees. The witness reported seeing a black plume of smoke rise almost immediately afterwards.

Figure 5: Aerial photo of target spray area taken 10 December 2021, showing accident site and witness location  

Figure 5: Aerial photo of target spray area taken 10 December 2021, showing accident site and witness location

Note: The yellow lines represent the block boundaries.

Source: Aircraft operator, annotated by the ATSB

Another witness positioned about 1 km south of the accident site, observed the aircraft’s distinct yellow colouring as it descended among trees and impacted the ground. The witness estimated this was followed within about 2 seconds by flames and smoke. The pilot was fatally injured, and the aircraft was destroyed.

Context

Pilot information

Medical, licence and qualifications

The pilot held a valid Class 1 Aviation Medical Certificate issued on 15 October 2021 with no recorded medical issues and was reported to have been fit and healthy. The pilot’s Commercial Pilot Licence (Aeroplane) was issued on 30 March 2021.

The pilot also held ratings for:

  • single-engine aeroplane
  • low-level
  • aerial application[2]

and endorsements for:

  • tailwheel
  • manual propeller pitch control
  • gas turbine engine.

The pilot attained Spraysafe accreditation[3] through the Aerial Application Association of Australia (AAAA) on 2 July 2021 and had been issued a Pesticide Licence by the New South Wales Environment Protection Authority on 24 August 2021.

At the start of the accident day, the pilot had accumulated 372.5 flying hours, 203.3 of which were conducting aerial application operations (including training), 31.7 of which were in VH-ACQ. 

Recent history

The pilot’s recent sleep-wake and work history was determined from a combination of interviews, text messages, logged flight times and recorded flight data.

The pilot lived about 30 km from their assigned base and about 70 km from the operator’s Moree base. In late November, the pilot’s commute was increased by about 1 hour as a road was inaccessible due to flooding.

On 2 December 2021 (2 days prior to the accident), the pilot left home at about 0600, returned at 2000 for dinner and was in bed by 2100. That day, the pilot recorded 13 hours of duty time and 8 hours of flight time. The pilot had described this as a huge day – the most spraying so far in one day – and was very tired at the end of the day.

The day prior to the accident, the pilot was awake by 0412 and left for work at 0530. That day, the pilot recorded 13 hours of duty time and 7.9 hours of flight time. At 1816, the pilot sent a text message to a friend stating that they were about to fall asleep in the aeroplane (but did not advise the operator), before ferrying the aircraft to Moree Airport for maintenance, arriving at about 1900. Rather than drive home, the night before the accident, the pilot stayed with another company pilot in Moree. The company pilot reported that the accident pilot was happy and was proud of having sprayed 1,100 hectares that day and 1,000 hectares the previous day. They went out for dinner at about 2100 and went to bed between 2200 and 2215. Others described the pilot that evening as a bit tired but nothing out of the ordinary.

The accident day was the pilot’s ninth consecutive day of duty. That morning, the pilot was awake by 0510 and picked up another company pilot at 0530. They purchased breakfast, snacks and lunch from a petrol station before heading to Moree Airport. The company pilot recalled that the pilot reported having had a good sleep, appeared fresh and not tired, and was very happy that morning. Other company pilots who had seen the pilot in the 24 hours prior to the accident reported that the pilot did not seem overwhelmed or stressed.

For the 3 days prior to the accident, the recorded flight times were the longest consecutive logged by the pilot (7.7, 8.0 and 7.9 hours) and the longest duty times (12, 13 and 13 hours).

Flight training

The pilot completed their commercial pilot licence flight test on 24 March 2021 with 166 hours total flying time. The pilot had completed an integrated training course, combining ground theory training with practical flight training for their private and commercial pilot licences. During this training, the pilot was described as a good student who was well-prepared, focused and dedicated. The pilot’s non-technical skills were assessed as being very good, and their aircraft handling skills were described as exceptional – including maintaining the aircraft well within the required tolerances in steep turns, practice forced landings and circuits. 

Aerial application training

The pilot commenced training for aerial application and low-level ratings on 15 June 2021, and achieved those, along with a tailwheel endorsement, on 30 June 2021. At that time, the pilot had accrued 204.3 hours total flying time. This included the aerial application rating training, which consisted of 31.1 hours dual (including test) and 5.5 hours solo aerial application flight time, conducted in a Piper PA-25 two-seat dual-control aircraft.

The instructor who conducted the pilot’s aerial application rating and endorsement, noted in the second lesson (16 June) that the pilot had carried out stalls in all configurations at 1,000 ft above ground level. The pilot was reported to have handled these well for their total flying experience and achieved a good standard in recovery from stalls during climbing turns with left- and right-wing drops.

The lesson conducted on 20 June was conducted on a field similar to the accident field – with a diagonal boundary and trees – and included conducting back-to-back runs with procedure turns (Figure 6). On the training day, the wind was about 5 kt in the downwind direction at the diagonal boundary. The lesson notes indicated the pilot initially had difficulty lining the aircraft up on the spray run after the turn. The notes from the following day’s lesson (21 June) included ‘needs to back off on turns, pulling too tight…at times near stall’. A similar comment was made on 28 June. The instructor reported providing feedback to the operator of VH-ACQ (Aircair), to keep an eye on this aspect, but overall assessed that the pilot flew very well when taking into account the limited hours of experience at that time. 

Figure 6: Diagonal boundary paddock example  

Figure 6: Diagonal boundary paddock example  

Source: ATSB

Employment at Aircair

The pilot was inducted into Aircair Aviation Operations (Aircair) in July 2021, and initially commenced working as ground crew – mixing and loading chemical. On 9 September, the pilot satisfactorily conducted an operational proficiency check flight with the chief pilot in a Cessna 185 aircraft. The pilot’s first aerial application job at Aircair was on 15 September 2021 in a Cessna 188B (C188B) aircraft – a conventional single-seat, piston-engine, strut-braced low-wing agricultural aircraft – having completed 2.4 hours of familiarisation in the aircraft in the previous 2 days. The pilot’s emergency dump training[4] in the C188B aircraft was assessed satisfactory on 21 October 2021, although recorded in the pilot’s logbook as 13 October.

The pilot then conducted aerial application in the C188B aircraft and on 22 November 2021, the chief pilot signed off that the pilot had completed the required 110 hours of aerial application under supervision. At that time, the pilot had accrued 321 hours of flying time.

The pilot was described as having a natural ability to pick things up quickly, flew very nicely and did everything they were asked to. The chief pilot and general manager of Aircair assessed that the pilot was then ready to progress to turbine-engine aircraft.

Gas turbine design feature endorsement

On 26 November 2021, the pilot commenced gas turbine engine endorsement training. The Civil Aviation Safety Regulations Part 61 Manual of Standards Schedule 2 detailed the skills and knowledge required to operate a gas turbine powered aircraft on the ground and in the air during normal and abnormal operations. The elements specified in the Schedule were starting, stopping and managing a gas turbine engine, and managing abnormal and emergency actions applicable to a gas turbine engine.

The endorsement required the pilot to complete ground (theory) components including studying the applicable flight manual, and then submit a written exam on the engine and aircraft to the examiner, which the pilot completed on 26 November 2021.

The pilot also received ground familiarisation of the engine and aircraft, followed by 7.5 hours of flight time in a two-seat dual-control turbine Air Tractor AT-504 aircraft. This included normal and abnormal situations, stalls and steep turns, and aerial application operations. The pilot’s stall training in the AT-504 aircraft consisted of climbing to a safe height, at which the supervising pilot demonstrated a straight and level stall, with the accident pilot following on the controls. The supervising pilot pointed out the stall buffet and the stall stick position, then demonstrated recovery from the impending stall, by reducing back pressure on the control stick. The supervising pilot commented that the AT-504 always tended to drop the right wing about 5° in the stall. The accident pilot then conducted two stalls. On the second of those, during the recovery, the aircraft nose lowered, and, assuming the aircraft had recovered from the stall, the pilot reapplied back pressure. However, as the wing was still stalled at the time, this action resulted in a secondary stall, from which the pilot performed a successful recovery.

Having demonstrated the ability to identify and recover from stalls, the pilot then conducted their first aerial spraying activity under supervision in the AT-504. The supervising pilot reported that the pilot had initially applied too much back pressure on the control stick (‘pulled too hard’) during the turn. This was due to trying to keep the aircraft too close to the paddock and led to a stall buffet during the turn. The supervising pilot reported that they reiterated the importance of the stall stick position, and the need to reduce back pressure on the control stick. The amount of force required on the control stick depended on the trim setting. If the aircraft was trimmed such that forward pressure was required during a spray run, the back pressure required to stall the aircraft was small.

The supervising pilot also reported advising the pilot to increase the amount of initial turn (‘fade’) away from the direction of the turn in the procedure turn, so the resulting turn was not as tight. They commented that the pilot subsequently flew the spray pattern ‘beautifully’.

The pilot received their gas turbine endorsement on 27 November 2021. The pilot had completed the requirements of the endorsement; however, it was noted that the theory examiner had signed off the endorsement although the flying component was conducted by a different pilot. At the time the theory component was conducted, a dual-seat aircraft was not available to conduct the in-flight competencies, and as a result, the examiner would have had to observe the pilot solo in a single seat aircraft from the ground. The operator assessed it would be more effective and safer to wait until the dual-seat aircraft was available. The theory examiner was not available when the dual-seat aircraft became available and the flying component was supervised by a pilot whose instructor rating was not current as it had not been renewed, primarily due to COVID restraints. They had however, previously conducted 5 gas turbine endorsements before their rating lapsed, and subsequently renewed their instructor rating in 2022.

Transition to the AT-400

On the morning of 28 November, the pilot conducted circuits in the AT-504 in preparation for transitioning to the single-seat AT-400 aircraft.

The operator reported that they had put many less-experienced pilots in VH‑ACQ over the last 40 years, primarily because it never lacked take-off performance, even when fully loaded. They assessed that the biggest differences the pilot would have found in transitioning from the C188B to the AT-400, were that the operating speed of VH-ACQ was about 20 kt faster, it was heavier and had more inertia. Due to its inertia, it would take longer to recover from an impending stall than the C188B. The operator noted that the cockpit layout of VH-ACQ was very similar to the C188B but more ergonomic. The main difference was the Satloc GPS display, which had a touchscreen in the C188B, but a keypad in the AT-400. The pilot had reportedly noted during their endorsement that this was something they would have to get used to.

Before the accident pilot’s first flight in the AT-400 (VH-ACQ), the Aircair general manager reported briefing the pilot about the aircraft. This included cautioning the pilot to keep the airspeed up in the turns because of the shorter wings, without Hoerner wing tips (Appendix A – Hoerner wingtips), and higher wing loading[5] than the AT-504. As a result, VH-ACQ tended to give less pre-stall buffet indication before stalling. However, the general manager advised the pilot that the stall characteristics were similar to the AT-504, in that the AT‑400 would likely drop a wing in a stall and stall recovery required the pilot to reduce back pressure on the control stick. This was consistent with descriptions by other pilots who had flown VH-ACQ. They described it as providing a stall buffet later in an impending stall than an AT-502. Additionally, that it tended to drop a wing when close to the stall, and that all Air Tractors can produce a significant wing drop when close to the stall in an unbalanced turn.

On 29 November, the pilot conducted familiarisation and circuits in VH-ACQ, before commencing revenue operations with a reduced hopper load (1,000 L), mentored from the ground by the chief pilot. The next day, the chief pilot approved an increase to 1,200 L hopper loads for 3 days, before assigning a maximum hopper load of 1,300 L on 3 December. That was still the pilot’s assigned limit on 4 December.  

The chief pilot reported that the pilot appeared to be coping well with the transition to VH-ACQ. The pilot had described the transition to the AT-400 as ‘like learning to fly again’ and had remarked that they loved flying VH-ACQ. The pilot had reportedly commented that because of the air conditioner in VH-ACQ, they did not get as tired as when flying the C188B. The pilot and chief pilot had spoken each day that the pilot flew VH-ACQ, up to the accident day. The chief pilot reported that this included discussion of general management of the turbine engine, and that the pilot had not indicated any deficiency in operating the aircraft.

Ongoing supervision and mentoring

During the pilot's flights at Aircair, they were typically supervised either by the chief pilot or the general manager flying in the same area or observing from the ground. Regardless of having completed the mandatory supervised hours, the chief pilot advised that inexperienced pilots were typically ‘spoon fed’ up until 800–900 hours of agricultural flying.

The pilot had been conducting aerial spraying on the same property on the 2 days before the accident. The chief pilot had briefed the pilot at the end of the day prior to the accident, and discussed what blocks had been done, which to do next and the expected weather noting the wind direction and forecast high temperature. The chief pilot was absent on the accident morning and did not speak to the pilot.

The chief pilot reported that they would have been on the radio with the pilot if they had not been called away on leave that day. As a result of that leave, on the day of the accident, the pilot was unsupervised for the first time. However, the Aircair general manager radioed the pilot at 0645 to check how they were going, and the pilot responded that they were good and had a plan for the day’s operation.

Aircraft information

VH-ACQ

VH-ACQ was an Air Tractor Incorporated AT-400 single-seat low-wing tailwheel agricultural aircraft manufactured in the United States (US) in 1980. It was first registered in Australia – to Aircair – in November 1980 to operate in the Agricultural category, and was later operated in the Restricted category.[6] The Certification basis was US Federal Aviation Regulation (FAR) 21.25(a)(1) and the aircraft met the structural requirements of FAR 23, basis February 1, 1965, through Amendment 23-9. The flight criteria, propulsion, system and equipment items met the requirements of Appendix B, Civil Aeronautics Manual (CAM) 8, November 15, 1951, as amended through January 10, 1956.

The aircraft was powered by a Pratt & Whitney PT6A-15AG turboprop engine, which drove a Hartzell HC-B3TN-3D three-blade constant speed reversible pitch propeller.

The aircraft was fitted with two fuel tanks, located in the inboard section of each wing and an integral part of the wing structure. Both tanks gravity fed into a small header tank, located behind the hopper. Their combined total fuel capacity was 476 L, of which 454 L was usable. This equated to a maximum usable fuel weight of 363 kg (using a specific gravity of 0.8 for Jet A1 fuel). The aircraft was also fitted with dispersal equipment for spraying and spreading, and a system that allowed the hopper contents to be dumped if required. The hopper had a capacity of 1,514 L.

Maintenance history

The aircraft was maintained by a Civil Aviation Safety Authority (CASA)-authorised maintenance organisation in accordance with a CASA-authorised system-of-maintenance. A periodic inspection, including annual, 150 and 300-hourly, was completed on 28 September 2021, with the current maintenance release issued at that time. Scheduled and preventative maintenance conducted during this time included:

  •  engine overhaul and fitment of an overhauled propeller assembly
  •  replacement of lower spar caps (due life limit), with wing disassembly allowing for wing repairs and hopper refurbishment
  •  testing of the airspeed indicator, altimeter, compass and pitot/static system
  •  corrosion treatment and repainting.

At the time of the accident, the aircraft had accrued 18,869.2 hours total time in service. The aircraft had flown 4 hours 42 minutes since maintenance, having undergone a scheduled 75-hour inspection the evening prior, which included checking air and fuel filters, tyres, brakes and governor. The maintenance release had likely been destroyed in the post-impact fire and was not recovered from the accident site. However, there was no report of any aircraft defects prior to the accident. Furthermore, a general review of the maintenance records did not identify any anomalies.

Aircraft operating weight

The AT-400 type certificate data sheet[7] specified a maximum weight of 2,722 kg (6,000 lb). For VH-ACQ to operate above that weight, Air Tractor Service Letter 304 – Establishing and operating with a special purpose operating weight for Air Tractor aircraft, applied. The Service Letter referenced methods described in CAM 8 to enable operations up to a maximum recommended weight of 3,565 kg (31% overload). A placard affixed to the aircraft stated the maximum take-off weight as 3,565 kg. The Service Letter stated:

When operating at weights above the certificated maximum weight, please note that the stall speeds will increase from the published stall speed numbers in the Airplane Flight Manual. For example, when operating at a 31% overload weight, the stall speed will be approximately 15% higher than at the certificated maximum weight. During the required flight check, the new stall speeds should be determined.

On 23 October 2018 at 18,098.2 hours total time in service, the airframe logbook included an entry stating that the aircraft was flight checked on that day in accordance with CAM 8.10-3(e). It was found to be safely controllable and to operate satisfactorily with the hopper load of 1,356 kg and aircraft total weight of 3,565 kg.

Accident load weight and balance

The Airplane Flight Manual (AFM)[8] for VH-ACQ included a load data sheet to calculate the aircraft’s weight and balance. The sheet contained a table with entries for the weight, arm and moment of the aircraft with sprayer and spreader configurations, pilot, baggage, hopper and fuel. The table also provided forward and aft centre of gravity (CG) limits for weights up to 2,269 kg and for 2,722 kg, with a straight-line variation between those points.

For the accident load, VH-ACQ had been refuelled to full and the hopper loaded to about 1,250 L. Using a fuel consumption rate of 225 L/hr for spraying based on the company’s operations manual, the probable fuel remaining was approximately 387 L (310 kg). The pilot had completed 4 spray runs about 1,700 m long at an 18 m wide swath, using a chemical application rate of 18 L/ha, which left about 1,030 L in the hopper. The accident weight was therefore approximately 3,066 kg, below the demonstrated maximum gross weight of 3,565 kg, and the CG was about 534 mm aft of the datum. This was within extrapolated CG limits.

The hopper load calculation table for VH-ACQ stated that with full fuel, the maximum permissible hopper load was 1,348 kg.

Fuel tank certification and testing

For the aircraft’s certification, CAM 8.3052 Tank Tests required that all fuel tanks should be pressured tested to 3.5 PSI to provide an indication of the ability of the tank to resist distortion and leakage under vibratory, accelerating, and surging loads, which may be encountered in flight and landing conditions.

FAR 23.967 (e)(1) stated that the fuel tank must withstand 9 G ultimate fore and aft load from emergency landing conditions. Air Tractor simulated this in testing by converting the acceleration to an internal pressure. Air Tractor provided an extract of the engineering report covering the fuel tank testing. Their testing found that using 20 PSI, the fuel tanks were capable of withstanding 27 G before leaking.

These two requirements were for flight, landing and emergency landing conditions, but did not assess the tank for tolerance to direct impingement. There was no requirement in the design standards for normal category aeroplanes to be tested for fuel tank crashworthiness.

Installed GPS systems

Systems

The aircraft was fitted with a TracPlus surveillance system, which provided real-time tracking through a satellite or mobile phone network. It reported position, altitude, and speed at set time periods, in this case every 15 seconds. The ATSB obtained TracPlus data for the accident day and several previous flights.

A Satloc aerial guidance system provided the pilot with guidance commands to fly accurate spray patterns. It was set to record at 2-second intervals. The Satloc data from the accident flight was unrecoverable due to extensive fire damage to the Satloc unit. However, the ATSB obtained Satloc data for several of the pilot’s previous flights. 

Satloc increase/decrease

The Aircair Air Tractor fleet all had the same control stick switch configuration. The Satloc stick switch (button) provided a ‘remote’ function to increase or decrease the run number, which could also be done on the Satloc keypad (Figure 7).

Figure 7: Satloc stick switch and keypad


Figure 7: Satloc stick switch and keypad

Source: ATSB

The Satloc keypad could be set to either increase or decrease the run numbers. When set to increase, pressing the stick switch (button) once, increased the run number by one, and when set to decrease, pressing the stick switch once decreased the run number by one. When a pilot had set up the Satloc GPS to spray a racetrack pattern, then changed to fly a back-to-back pattern, they would then be spraying every second run number (with the alternate numbers on the other side of the programmed racetrack pattern). Therefore, the next parallel spray run required the switch to be double-clicked at the end of each run to spray the adjacent, parallel run.

The stick switch could only make the run numbers go one way: up if increase was set or down if decrease was set. Therefore, if a pilot inadvertently clicked the button too many times and needed to go back, that would have to be done using the keypad.

When the Satloc was set to decrease, this swapped the direction function of the keypad buttons: the up arrow on the keypad (labelled ABC) would then decrease the run number and the down arrow on the keypad (labelled DECR) would increase the run number. Reportedly, this frequently resulted in pilots pressing the incorrect (for example, up arrow) button first, then having to press the correct one (for example, down arrow) multiple times. This would require ‘head in cockpit’ time and the potential for distraction from controlling the aircraft. The US Federal Aviation Administration (FAA) Advisory Circular 137-1A stated that pilots should ‘use extreme caution when using GPS swath-marking equipment to prevent diverting attention away from the task of flying the aircraft safely’. 

Meteorological information

Bureau of Meteorology

Between 0600 and 1145 on the accident day, the pilot was operating within the NSW - West subdivision of the Bureau of Meteorology Graphical Area Forecast.[9]. The forecast for NSW - West issued at 0323 on 4 December and valid 0400–1000 was for visibility greater than 10 km and no cloud. The graphical area forecast issued at 0325 and valid 1000–1600 included scattered high cloud above 10,000 ft and, from 1100, isolated cumulonimbus clouds with visibility reducing to 2,000 m in isolated thunderstorms and rain. Moderate turbulence below 10,000 ft was forecast in thermals and dust devils[10] from 1200.

The nearest Bureau of Meteorology weather station was at Moree Airport, 80 km east-north-east of the property airstrip. The aerodrome forecast[11] for Moree Airport issued at 0424 and valid from 0600–1900 included wind from 360° at 8 kt, changing from 1100 to 240° at 14 kt and CAVOK.[12] Between 1100 and 1500, there was a 30% probability of variable winds at 20 kt gusting to 40 kt with visibility reducing to 2,000 m in thunderstorms with rain and associated scattered cloud at 800 ft above aerodrome elevation. The maximum temperature was forecast to reach 34 °C.

Oz Forecast

For more accurate local weather information (temperature and wind speed/direction), company pilots usually referenced the closest Oz Forecast weather station. The wind was measured 2 m above ground level and recorded in km/h and degrees true (°T). The nearest Oz Forecast weather station was located 11 km west of the property airstrip. Data from that weather station recorded at 15-minute intervals and converted to kt, is shown in Table 1.

Table 1: Weather recorded at 15-minute intervals from 0600–1200 EDT

TimeTemperatureWind direction (°T)  Wind speed (kt)  Wind gust (kt)
060021.62500.51.6
061521.52272.45.4
0630222304.05.9
064522.82274.15.9
070023.92254.25.9
071524.82194.67.0
073025.62174.37.0
074526.31964.55.9
080027.11944.47.0
081527.51955.17.6
083028.11915.810.3
084528.41926.611.3
090029.21987.112.4
091529.61907.611.3
0930302096.010.3
094530.31925.39.7
100030.92215.411.3
101531.32215.410.3
103031.82205.711.3
104532.22288.214.0
110032.52159.617.3
111532.323010.617.3
113032.52139.416.7
114532.622510.218.4
120032.522110.318.9

Source: Oz Forecast

At the time of the accident (1145), the wind was from the south-west at 10 kt gusting to 18 kt and the temperature was 32.6 °C. On the last spray run, as the aircraft had been tracking south, the wind was primarily a headwind. As the aircraft started to turn, it initially encountered more of a crosswind. The accident occurred as the wind became a quartering tailwind, but before completion of the turn to the north.

Other observations

A witness described the wind at about the time of the accident as ‘chopping and changing directions, was more stop and start again…gusts on and off’. The loader also described the weather as ‘windy’ and reported that the wind had become stronger throughout the morning.

At the time of the accident, the Aircair general manager was flying near Moree Airport, where the temperature was about 32 °C. They described the flying conditions as starting to get ‘bumpy and uncomfortable’ and about 30 minutes after the accident, as ‘quite windy and rough’. They reported that on the accident day, the wind had started from the north-east and went around to the north-west during the morning, in the usual summer pattern, but that it was stronger than normal, and increased around the time of the accident.

Another company pilot operating in the area that day recalled that it was the first hot, rough day of the season.

The chief pilot reported that on the evening before the accident flight, during their briefing with the pilot, they discussed the forecast 35 °C temperature. This included discussion of the associated increased thermal activity, which may lead the pilots to cease spraying operations.

At the time of the accident, the sun was not in a position to affect the pilot’s visibility.

Operational information

Work orders

The pilot had operated at the same property on 2–4 December. The blocks allocated to the pilot to be sprayed were depicted on multiple work orders for the property, one of which is depicted in Figure 8. Of the blocks depicted in Figure 8, on 4 December the pilot sprayed blocks M10, M11, M24, M25, M118, before commencing blocks 127 and 128. Block 117 was the wet area along the river and 123, 124 and 125 were not to be sprayed (although as they had powerlines in them, the pilot had been told not to spray them anyway).

Figure 8: Work order map depicting areas to be sprayed and location of the accident site

Figure 8: Work order map depicting areas to be sprayed and location of the accident site

Source: Aircraft operator, annotated by the ATSB

Field selection

The operator reported that they selected blocks for spraying appropriate to a pilot’s experience and ability – including the block shape and whether there were powerlines in or near the target area. The accident pilot had not yet sprayed a block with a powerline in it, but had sprayed blocks with a powerline along one edge in the previous two weeks. Although not documented, it was reported that when any new aspects of the spraying task were introduced, the chief pilot or general manager would be there to mentor the pilots – either on the ground or flying next to them. The gradual progression to more complex blocks continued with the pilot’s transition to a more powerful, faster, heavier aircraft.

The field the pilot was spraying at the time of the accident (127 and 128 – Figure 8) was selected by the chief pilot because it was considered suitable for the pilot’s level of experience, with no powerlines or difficult obstacles. The blocks sprayed by the pilot the previous day were irrigated blocks – squarer and more defined. The accident field was a dry-land block with a few small trees. The field was near rectangular, but it had a diagonal border at the southern end, and the eastern and western fence lines were not quite parallel. The diagonal border angled down toward the western side, which would have made the back-to-back spray runs with a procedure turn at each end slightly more difficult for the pilot when incrementing runs from east to west. This is because with a diagonal end, each subsequent time the pilot pulled the aircraft up to make the procedure turn, the aircraft had to be further beyond the boundary to allow enough distance to line up for the next run (Figure 6).

Back-to-back pattern

According to the AAAA Aerial Application Pilot’s Manual (2011), the back-to-back pattern was the most common pattern flown prior to the availability of on-board GPS systems. It was usually the first pattern pilots learnt in their initial aerial application rating training. Flying back-to-back patterns was the preferred pattern when working around a hazard, such as a powerline, tree, susceptible crop, or house. This was because in a back-to-back pattern, the aircraft would be gradually moving towards a hazard. In contrast, when flying a racetrack pattern, the aircraft moves away from the hazard, which could be more easily forgotten on the next run. In a back-to-back pattern, during the procedure turn at the end of each run, the aircraft is turned through 180°. During the turn, ‘most of the speed is squandered and you arrive back on the same [reverse] heading at which you started the turn, with time and speed both going in the wrong direction’ (AAAA, 2011).

The operator reported that during a procedure turn, pilots judge how far to turn away (fade) by using the GPS light bar for guidance, counting (for example, for 3 seconds) in their head, or by feel, before banking the opposite way around the turn. If they do not get it right, it can be difficult to line up on the next run. In that case a pilot would normally skip that run and write the missed run number on their hand. They would then either return to spray it later or leave it and advise the operations manager at the end of the day, so that it would get done another day. The chief pilot reported having previously seen the pilot with missed run numbers written on their hand.

In a procedure turn, after the fade, as a pilot banked to turn the aircraft in the opposite direction, they would extend some flap during the turn, usually up to about 15° in the Air Tractor aircraft. They would then retract the flap as the aircraft lined up for the next spray run. The chief pilot reported that the key instrument referenced by a pilot during the turn was the airspeed indicator, while also cross-referencing the GPS light bar, and using the turn and balance indicator (ball) to ensure a balanced turn. The target airspeed they were referencing on the airspeed indicator depended on the aircraft weight.

Flight and duty review

Aircair flight and duty time limitations were in accordance with Civil Aviation Safety Regulations Part 137.Q. The key limitations were:

  • maximum flight time of 170 hours in 28 days and 1,200 hours in 365 days
  • daily tour of duty limit of 14 hours including a rest period of at least 8 hours after a duty of 10 hours or less, or 10 hours after a duty of more than 10 hours
  • following a tour of duty of more than 10 hours, a pilot was permitted to recommence after 9 hours off duty, if they believed they were mentally and physically fit to do so and would not breach any other regulation in the subpart
  • at least 36 hours continuous off duty in any 14 days
  • 44 hours cumulative duty time limit in 3 days (72 hours) and 98 hours in 7 days (168 hours). 

The Aircair Administration and Policy Manual stated that for aerial application operations, duty time was calculated from 30 minutes prior to the flight to 15 minutes after the flight. The regulations defined flight time as commencing when ‘the aircraft first moves under its own power for the purpose of taking off’.

On the accident morning, the aircraft engine started at 0553, take-off roll commenced at 0559 and it took off at 0600. According to Aircair’s procedures, recorded duty time would commence no later than 0529, although the pilot arrived at the airport at about 0550. According to the operator’s flight and duty records, the pilot had been on duty for 13 hours the previous day, having commenced duty at 0700 and ended at 2000. Recorded data showed the aircraft was shut down at 1919 that evening and duty time should therefore finish no earlier than 1934.

As the previous day’s duty time exceeded 10 hours, the pilot was required to have a rest period of 10 hours, but could recommence duty after 9 provided the pilot assessed themselves ‘mentally and physically fit to do so’. The pilot’s start time was close to the 10-hour rest period, accounting for imprecision of the recorded duty times. It could not be determined whether the pilot made this assessment, however, regulations required pilots to ensure they were fit for duty prior every flight. Civil Aviation Safety Regulation 137.300 described that a pilot was not fit for duty if they had not had adequate rest, food or drink; or was adversely affected by a medical condition or a psychoactive substance.

The pilot commenced flying for Aircair on 9 September 2021 and flew 15.5 hours total for the month. In October, the pilot flew 54.8 hours in the C188B aircraft, over 18 days, with the longest flight time 7.3 hours on 6 October followed by 6.3 hours on 7 October. From 1 to 24 November, the pilot conducted 50.4 hours in the C188B. In that period, the longest flight time was 6.6 hours on 16 November which was also the longest duty day of 10.5 hours. The previous longest flight time recorded was on 6 October (7.3 hours). Both those days had been preceded by significantly shorter flight times.

The pilot’s most recent day off work prior to the accident was 25 November. After their day off, on 26 November the pilot commenced the transition to turbine-engine aircraft. Figure 9 and Table 2 show the pilot’s flight and duty records from 26 November to 3 December. The first time (ever) that the pilot flew VH-ACQ, was 5 days before the accident on 29 November. On that day, the pilot was awake at 0454 and home at 2126, having logged 5.6 hours of flight time in VH-ACQ.

Figure 9: Recorded flight and duty times from 26 November to 3 December 2021

Figure 9: Recorded flight and duty times from 26 November to 3 December 2021

Source: Aircraft operator data analysed by the ATSB

Table 2: Flight and duty records from 26 November to 3 December 2021

DateAircraftFlying hoursActivityDuty hours (and times)
26 NovAT-5040.9Dual training10 (0800–1800)
27 Nov

AT-504

CA188B

6.1 (dual)

1.7

2.6 training plus 3.5 spraying

Spraying

10 (0700–1700)
28 Nov

AT-504

CA188B

0.5

3.0

6 circuits ICUS

Spraying

6 (0800–1400)
29 NovVH-ACQ (AT-400)5.65 circuits (Tracplus shows 4 circuits at Moree) plus spraying 1,000 L load limit8.5 (0800–1630)
30 NovVH-ACQ2.5Spraying 1,200 L load limit6 (0930–1530)
1 DecVH-ACQ7.7Spraying 1,200 L load limit12 (0730–1930)
2 DecVH-ACQ8.0Spraying 1,200 L load limit13 (0700–2000)
3 DecVH-ACQ7.9Spraying 1,300 L load limit13 (0700–2000)

In the 8-day period since the pilot’s last rest day, there were some discrepancies between the logged flight and duty times and the recorded GPS data for the aircraft. On 3 December, the aircraft was rolling at 0647, 13 minutes prior to the recorded duty commencement. On 29 November, the aircraft landed at 1841 and on 26 November, the aircraft landed at 1932, both times after the recorded end of duty period. It was the pilot’s responsibility to enter the flight and duty times and it could not be determined how the inconsistencies occurred. The chief pilot reported that they checked the entered data occasionally.

Operational tempo

A review of text messages the pilot sent to a friend (but not to the operator) showed that since October and throughout November, the pilot had often mentioned that they felt tired, and had frequently been awake at or before 0500, and getting to bed after 2100. 

The accident pilot had flown more than 30 hours in VH-ACQ in the 4 days prior to the accident. The chief pilot commented that the company pilots had been doing a lot of flying and were approaching the flight and duty limits every day. Other company pilots reported that they had been working long, but not excessive, days. Further, that although they had early starts, they were not finishing very late.  

On the day before the accident, the chief pilot had reported being worried about the company pilots with the workload ahead. The chief pilot sent a text message to check they were all managing the workload and reminding them to work together with each other and the ground crew, stick to the routine and keep it simple. Later that day, a company aircraft struck a powerline, which resulted in minor damage and no injuries to the pilot.

In response, on the morning of the accident flight, the chief pilot sent a message to all company pilots, reminding them, among other things, to be aware of the effects of successive early starts and late finishes. The message advised pilots to manage their time and rest when they could, consider load sizes particularly following refuelling, maintain wire awareness, and to be safe, have fun and keep it simple.

Communications

The UHF radio in VH-ACQ had malfunctioned on the day prior to the accident and been fixed that evening. The UHF radio was used to communicate with the operations manager, other company pilots in the area and normally, with the loader. However, the loader did not have a radio that day as they were not driving a (company) vehicle fitted with one. Normal procedure involved the pilot communicating with the loader via radio so the loader could prepare the next chemical load prior to landing. The operator also had a procedure for loaders to operate with an unserviceable UHF, which required the loader to either mix load by load only, or to continue mixing until further notice, and to have a mobile phone. The loader had a mobile phone.

During refuelling prior to the accident load, the pilot sent a text message to the operations manager and received an immediate response. After departing with the accident load at about 1130, a company pilot operating in the area heard the accident pilot on the radio to the operations manager advising of their concern about drift onto neighbouring property and that the wind was picking up. That company pilot later reported that they thought the pilot sounded nervous. The operations manager reportedly responded suggesting they could spray a different area or cease operating.

Analysis of recorded data

The TracPlus data for 4 December 2021 indicated that the pilot had not flown a hazard check of any block before commencing spraying or conducting clean-up runs. This meant the pilot had not overflown the south-eastern area of the block (127 and 128) where the accident occurred.

For the accident load, several data points were recorded at the northern and southern ends during the turns. Analysis of these points indicated the maximum height reached during the turn at each end of the field was about 250 ft above the ground.

Analysis of Satloc data from the pilot’s flight the day prior to the accident, showed that in more than 75% of procedure turns, the peak angle of bank was 50–70° and peak acceleration was between 1.5 and 1.9 G. The angle of bank exceeded 80° three times and the peak G on average occurred at about the same time as the peak angle of bank. In the turn technique described in the AAAA’s Aerial Application Pilot’s Manual (AAAA, 2011), the peak G would be reached before the peak angle of bank:

A key pilot technique in aerial application is to unload the aircraft from excessive G before applying aileron to initiate a turn. This is most likely to be relevant during a pull out of a paddock at the end of a run. Pull back to get out of the paddock and establish the aircraft in a climb, unload the G, and then initiate the turn. 

The Satloc data from the day prior to the accident also showed that during back-to-back spray runs with procedure turns, the aircraft was usually lined up (within half a swath width) on the next spray run about 200 m prior to the crop boundary.

Aerodynamic stall

A wing generates lift when the airflow around the upper and lower surfaces results in a pressure difference between those surfaces. At a certain angle of attack (the relative angle between the chord line of the wing and the approaching airflow), which is a characteristic of the wing design, the flow over the upper surface of the wing separates from the surface. This condition is known as an aerodynamic stall (or simply a stall) and results in a rapid reduction in the lift generated and an increase in drag. Due to the sudden reduction in lift from the wing and rearward movement of the centre of lift, an uncommanded nose-down pitch ensues.

A wing drop occurs when one wing stalls before the other, which can be exacerbated by uncoordinated (or ‘unbalanced’) flight. A cross-control stall occurs when the critical angle of attack is exceeded while aileron is applied in one direction and rudder in the opposite direction.

As a loss of altitude also occurs during recovery from a stall, it is possible to stall with insufficient height above the ground to recover. The AFM for VH-ACQ stated the altitude loss from a wings-level stall was 220 ft at 2,722 kg gross weight. The main indications of an impending stall in the AT-400 are airframe buffeting (vibration) and an aural stall warning (horn).  

Aerofoils of the type used on aircraft such as the AT-400, typically stall at angles of attack of around 16°. This critical angle of attack can be exceeded at any airspeed, any (pitch) attitude and any power setting. As most small aircraft do not have an instrument that indicates the aircraft’s angle of attack, the angle of attack at which the stall occurs may be referenced to an airspeed. The AFM for VH-ACQ provided stall speeds at 2,722 kg gross weight, power off, wings level (0° angle of bank), in a balanced level turn at selected angles of bank, and with the flaps up (retracted) and flaps down (fully extended) (Table 3).

Table 3: Angle of bank and stall speed at 2,722 kg, power off (adapted from AFM)

Angle of bank0°15°30°45°60°
Stall speed (kt) – flaps up6667717893
Stall speed (kt) – flaps down5960637083

However, the airspeed at which a stall will occur is not fixed to a single value, and varies with weight, centre of gravity, load factor,[13] and power setting. Tight turns and rapid pull-ups increase the load factor and therefore increase the stall speed. A stall that occurs at a stall speed greater than the +1 G stall speed, such as when turning or pulling up, is termed an accelerated stall. Increasing an aircraft’s weight by 25% will result in the stall speed being about 12% faster.

At the probable aircraft weight at the time of the accident (3,066 kg), the stall reference speeds in the AFM (Table 3) would increase by a factor of 1.06. For the referenced angle of bank stall speeds, if the pilot did not move the control stick aft to maintain level flight, and the aircraft descended while turning, (at the same radius), the G would be less, therefore the stall speed would be lower than when maintaining a level turn.

The primary control for angle of attack is the aircraft’s elevator. Pulling back on the control stick will increase the angle of attack and pushing forward will decrease the angle of attack. If a pilot pulls the stick too far back and deflects the elevator too far, it will increase the angle of attack of the wing to the critical angle and stall it. The elevator control stick (or column) position at which the critical angle of attack is reached is independent of factors including airspeed, angle of bank, power, and pitch attitude. Recovery from a stall requires reducing the angle of attack by moving the control stick forward, which normally means lowering the aircraft nose (pitching down). A secondary stall can result following a stall if, during the recovery, the pilot again pulls the stick past the position at which the critical angle of attack is reached in an effort to regain horizontal or climbing flight too quickly.

As VH-ACQ was the ‘first of type’ AT-400 registered in Australia, flight tests were conducted at Ballarat airfield, Victoria, on 31 October and 2 November 1980. At the flight-tested weight of 3,042 kg, the report concluded that the handling characteristics were acceptable. It found the airframe (pre-stall) buffet was felt at 76 kt indicated airspeed (IAS) with the flaps up (fully retracted) and was ‘not violent’. There was a ‘clear and distinctive’ stall warning onset at 80 kt IAS with flaps up (fully retracted) and at 68 kt with flaps down (fully extended). The stall characteristics were described as ‘satisfactory’.

Human performance considerations

Workload

Workload is defined as the sum of task demands placed on an individual’s cognitive resources that are used for attention, perception, decision making and action (Skybrary, 2010). Humans are limited in the amount of new information the brain can process at once. Once the limit of cognitive resources has been reached, performance starts to decline with increased error rates and/or delayed responses. Factors that can increase workload include excessive task demands, time pressures, a lack of operator skills and knowledge, or environmental conditions (NASA, 2010).

Task complexity and an individual’s level of experience and knowledge can have a significant impact on their workload (Li and others, 2021). Less experienced pilots typically have a higher cognitive workload compared to those that are more experienced due to their continual learning and development of skills. A more experienced and knowledgeable individual can rapidly interpret a situation based on past experiences and knowledge, and subconsciously pattern-match. This frees up cognitive capacity for a pilot to maintain vigilance and monitor performance, and, if they choose, reflect on their actions, whereas a less experienced individual may not (Byrne and others, 2013).

Green and others (1996) described the effect of practice on motor skills such as flying an aeroplane. With experience, skill acquisition progresses from the cognitive phase, in which the learner has to think consciously about the action, through the associative phase and on to become automatic, and the skill can then be executed without conscious control. Until this occurs, central processing capacity is needed to perform the task. Thus, a pilot with fewer hours in an aeroplane type would be expected to experience a higher workload than a more experienced one for the same task.

The instructor who conducted the pilot’s aerial application rating described the increase in workload for a pilot progressing from the C188B to the AT-400 as: ‘The workload is just so high for [the AT-400 aircraft] – they’re fast, nippy in the turn. If you are going to fly it on the edge, things are going to happen. It has more than double the weight and inertia’ of the C188B. They further reported that aerial application work is ‘not mundane’, that the pilot would be concentrating all the time, and has to consider other factors such as drift and temperature, in addition to flying. To conduct effective aerial application, while manoeuvring the aircraft at low altitude, a pilot must visually scan external cues and monitor internal resources (NTSB, 2014).

High workload is associated with increased error rates and reduced safety margins (Harris, 2011). It also leads to a degradation in performance and at extremely high levels of workload, important information may be missed due to the narrowing or focussing of attention onto only one aspect of the task (Green and others, 1996).

Fatigue

Overview

The Civil Aviation Safety Regulations define fatigue for a flight crew member (FCM) as:

a physiological state of reduced alertness or capability to perform mental or physical tasks, which:

  • may impair the ability of the FCM to safely operate an aircraft
  • is caused by 1 or more of the following: 
    • the FCM’s lack of sleep;
    • the FCM’s extended wakefulness;
    • the FCM’s circadian phase at any relevant time;
    • the FCM’s workload of mental activities, or physical activities, or mental and physical activities at any relevant time.’

The International Civil Aviation Organization (ICAO) (2020) defines fatigue as:

… a physiological state of reduced mental or physical performance capability resulting from sleep loss or extended wakefulness, circadian phase, or workload (mental and/or physical activity) that can impair a person’s alertness and ability to perform safety-related operational duties.

Factors that can cause fatigue include (CASA, 2012):

  • emotional strain
  • mental workload
  • strenuous or sustained physical exertion
  • inadequate food and fluid intake
  • adverse environmental conditions, such as extremes of temperature, low light levels, vibration and confined spaces
  • disrupted and lost sleep.

Mental fatigue results from long periods of cognitive activity. Its effects can include reduced concentration and manual dexterity, increased reaction time, performance monitoring, error management and decision making (Boksem and others, 2005; Bafna & Hansen, 2021, CASA, 2012; Heywood 1999).  

Self-assessment of fatigue

Although there are some known limitations of self-rated fatigue, research on airline flight crew has shown correlation between self-rated fatigue and performance in vigilance tasks, for example using the Samn-Perelli 7-point fatigue scale[14] (Garwon, 2016, Petrilli, 2007 and Roach, 2012). There was no regulatory or operator requirement for pilots to determine (or provide) a standardised fatigue estimation prior to, or during, operations.

Sleep and time of day

Inadequate quantity and quality of sleep is a contributor to fatigue. Most people generally require 7–8 hours of sleep to achieve a maximum amount of alertness and performance. Sleep debt can be cumulative and can result in degraded performance and uncontrolled sleep episodes (Orlady & Orlady, 1999; Hawkins, 1993). The pilot’s 72-hour history indicated they had adequate sleep opportunities in the preceding nights and the pilot was reported to have no sleeping issues.

Circadian rhythms are the body’s internal clock that regulates the sleep-wake cycle and repeats roughly every 24 hours. According to the International Civil Aviation Organization (2016) there are two times of peak sleepiness within a 24-hour cycle. The main peak is in the early morning between 0300–0500 known as the window of circadian low, another smaller peak around 1500–1700 is known as the afternoon nap window. For each individual these times can vary. The period between when the pilot arrived at Moree Airport and the accident was outside these peak sleepiness times.

Effect of multiple long days

The instructor who conducted the pilot’s aerial application rating, when asked what the effect of the previous long days would be, reported that it was not just the last couple of days; the season had effectively continued since July without a break. Research has found self-ratings of fatigue (Rithemeister and others 2021) and risks of successive incidents both increase for each consecutive day worked (Folkard and Akerstedt 2004).

As documented by ICAO (2020) biomathematical modelling is ‘a computer programme designed to predict aspects of a schedule that might generate an increased fatigue risk for the average person, based on scientific understanding of the factors contributing to fatigue…All bio-mathematical models have limitations that need to be understood for their appropriate use.’ Biomathematical models can only forecast the effects of sleep and circadian rhythms[15] on performance and cannot account for other factors known to impact performance such as training, experience, stress and illness. Additionally, the models were not designed for aerial agricultural operations and did not consider the pilot’s cognitive workload.

The ATSB used two software programs, Sleep Activity Fatigue Task Effectiveness-Fatigue Avoidance Scheduling Tool (SAFTE-FAST) and Fatigue Assessment Tool by InterDynamics (FAID) Quantum, which are biomathematical models to assess fatigue based on the pilot’s duty hours and sleep opportunity in the days leading up to the accident. Each model has specific applications and limitations.

SAFTE-FAST predicts future performance based on the recent sleep history of the projected population or individuals. The output is a performance score indicating a percentage of cognitive effectiveness at a point in time. The lower the performance score, the higher the effect of fatigue. The model is based on biological determinants of fatigue such as: hours of sleep, hours of wakefulness, current sleep debt, the circadian process and sleep fragmentation (awakenings during a period of sleep) that reduce quality (Hursh and others 2004). SAFTE-FAST indicated that the pilot’s performance was not affected by sleep history and circadian processes.

FAID uses work hours as its input to predict the effect on fatigue and performance of different duty periods or work schedules. The FAID output is a score indicating different levels of fatigue exposure for different work hours. The higher the FAID score, the higher the fatigue exposure. The FAID score is based on the following biological determinants of fatigue: time of day of work and breaks, duration of work and breaks, work history in the preceding 7 days, and biological limits on recovery sleep (InterDynamics n.d). FAID indicated a high fatigue exposure risk for the pilot on the accident day, but lower (although still high) at the time of the accident than the start of the day.

The outputs of the two models were inconsistent. The differences in results can be explained by the underlying parameters in each model.

Time on task

Agricultural operations are known to place high demands on the pilot’s attention for sustained work periods, which can result in a degradation of performance, even if the pilot has obtained adequate sleep. This is due to the continuous, repetitive, low altitude flying associated with this type of operation, while also managing the spray application (NTSB, 2014).

Rosa and others (2020) found that during a simulated 11-hour flight mission, participants' self-ratings of fatigue increased over time and their response time was slower after 7 hours. This demonstrates that sustained attention and vigilance were adversely affected by time on task.

Having started the aircraft’s engine at 0553, the pilot had been operating for nearly 6 hours when the accident occurred at 1145. Consistent with previous days and normal operations, the pilot took short breaks while the loader was refuelling, to get out of the aircraft, eat and drink. These breaks occurred approximately every hour and would last about 10 minutes. One fatigue countermeasure is activity breaks. These can reduce the impact of accumulating workload and alertness and performance will improve briefly due to providing a mental break from a continuous task (Caldwell 2008; Mallis and others 2022). Therefore, breaks can be temporarily beneficial in reducing the effects of fatigue.

Combined effects of workload and fatigue

Fatigue and workload can have similar effects on vigilance, perception and reaction/response times. A study of workload and fatigue in rail workers (Fan & Smith, 2017) found that both high workload and fatigue were associated with performance impairments. High workload was also found to increase fatigue, which then leads to a reduction in performance. The United Kingdom Civil Aviation Authority Flight-crew human factors handbook – CAP 737 (2016) described symptoms of increasing workload, including attentional and task focusing, task shedding, increased fatigue, and chance of error. It stated that:

Sustained workload contributes to fatigue. Very high workload (particularly fast onset) and feelings of not coping with the workload can cause high arousal or stress. All these things make error more likely.

The handbook lists effects of fatigue, similar to those associated with mental fatigue described earlier, including reduced awareness, easy distraction and increased slips and mistakes.

Accident site and aircraft damage  

Accident site and impact

The wreckage was located at the southern end of a stand of trees and had been subject to a significant post-impact fuel-fed fire. There were no powerlines in the area and there was no evidence the aircraft struck a tree or bird prior to the collision with terrain.

On-site examination of the wreckage and surrounding ground marks indicated that the aircraft impacted terrain upright, in a nose-down attitude of about 40°, with the right wing down about 10°. The propeller, main wheels and wing leading edge impacted the ground first (Figure 10), during which the fuselage right bottom longeron[16] fractured and punctured the right wing main spar (Figure 11). Two propeller blades were located at the engine point of impact.

Figure 10: Initial impact points – right wing, main landing gear and propeller

Figure 10: Initial impact points – right wing, main landing gear and propeller

Source: ATSB

Figure 11: Fuselage frame longeron fracture and associated impact damage with main spar damage to right wing

Figure 11: Fuselage frame longeron fracture and associated impact damage with main spar damage to right wing

Source: ATSB

Forward momentum then collapsed the forward section of the fuselage and resulted in the main spar rotating about 120° and separating from the fuselage. The aircraft then continued a short distance rotating to the right, consistent with a right turn/spin, and came to rest facing approximately east.

The engine fractured in half around the flange ‘C’ area (ring of bolts joining the exhaust casing to the gas generator casing), with the gas generator module remaining near the fuselage. The propeller hub, with propeller blade, the engine power section module, including power turbine wheel, was recovered about 27 m from the impact point, in the direction of the target crop (north). The liberated compressor turbine disc was found a further 30 m beyond the hub in a similar direction (north-east), and at the edge of the fire zone (Figure 12).

The flame front and debris trail were in the direction of the wind (towards the north-east) and towards the target crop (north). The propeller hub displacement and fire zone were consistent with the aircraft’s trajectory prior to the loss of control, and with ignition at the final resting place. There was no evidence of fire at the initial impact point.

Figure 12: Overview of accident site and fire zone

Overview of accident site and fire zone

Source: ATSB

Wreckage examination

Although the throttle position could not be determined from the wreckage, examination of the damage to the engine and propeller blades was consistent with the engine producing power at impact. Seat frame distortion was consistent with a nose-down attitude at impact. Although impact and fire/heat damage precluded inspection of some control tubes and cables, flight control continuity was established via examination of connections, for example steel rod ends securely attached to bellcranks.

Aircraft configuration

Flap actuator measurement and corresponding flap setting indicated the flaps were extended about 18°. Due to impact damage, the position of the dump lever and of the hopper door could not be determined.

Fuel testing

A fuel sample was collected from the operator’s fuel tank at the property. The fuel was tested for the presence of water with none identified. A visual inspection did not identify any particulate matter in the fuel. There were also no reports of fuel quality concerns with the operator’s other aircraft using the same fuel source.

Survivability

Post-mortem and toxicology results

An autopsy report was prepared for the NSW Coroner. The report provided to the ATSB included the results of a post-mortem examination conducted by a forensic pathologist and toxicology testing.

The post-mortem examination found one minor fracture and multiple heat-related injuries, with no (life-threatening) traumatic injuries identified. No natural disease pathology was identified and no substances likely to have contributed to the accident were found in the toxicology results. The cause of death was found to be the effects of fire.

Restraint and helmet

The pilot’s seat was fitted with a 4-point harness, the webbing of which was destroyed by the fire. Despite this level of damage, the left and right lap belt attach points were found secured and the lap belt and shoulder harness steel buckle was secured. Additionally, the lap belt and shoulder harness webbing had been replaced in January 2020, and therefore would be very unlikely to have failed due to deterioration.

The pilot was always known to wear a helmet and was almost certainly wearing it at the time of the accident.

Impact force analysis

The ATSB analysed deformation of the pilot’s seat frame to determine peak impact deceleration. The pilot’s seat frame was bent at the two seat attachment locations, but the seat pan was undeformed. This indicated that the angle of deceleration was mostly forward rather than vertical. It was assessed that the seat rail was at the lowest height adjustment. The 4-point restraint was being worn at impact.

In conducting a dynamic loads analysis, a conservative evaluation of the peak deceleration for the pilot seat was 75 G. Based on a stall speed with flaps retracted of 60 kt, this equates to a square wave deceleration pulse[17] duration of 42 milliseconds.

The Aircraft crash survival design guide Volume 2 – Impact conditions and human tolerance (Coltman and others, 1989) placed this forward deceleration in the ‘area of severe injury’. Severe injury included life-threatening injuries such as major haemorrhages, spinal, abdominal and thoracic injuries, multiple fractures, concussion and long-time unconsciousness (Eiband, 1959). This was based on experiments of whole-body impact tolerance conducted on human volunteers to (mostly) subcritical levels, and test animals. Whole-body tolerance criteria were assessed with subjects seated in the upright posture and wearing full-torso restraints (and in some cases head restraint). The tolerable magnitude of accelerative force is a function of the duration; higher G were tolerated for a shorter pulse duration.

Post-impact fire safety

Post-impact fire and survivability

A potentially survivable accident is one in which the impact forces are within the limits of occupant tolerance, the aircraft structure preserves the required survival space, and the occupant restraint is adequate. As detailed below, for aircraft (including fixed and rotary wing) with a maximum certified take-off weight of 5,700 kg or less, post-impact fire (PIF) has been shown to contribute significantly to injuries and fatalities in accidents that are otherwise potentially survivable (TSB, 2006).

Aircraft certification requirements

Aircraft certification is found primarily in three regulatory structures: the US Federal Aviation Regulations (FARs), the Canadian Aviation Regulations, and the European Aviation Safety Agency requirements. These requirements are harmonised such that light aircraft manufactured in the US, Canada and Europe all meet basically the same standards.

Part 23 of the FARs prescribes the airworthiness standards for aeroplanes in the normal, utility, aerobatic, and commuter categories. There are only three FAR 23 fuel system certification requirements designed to reduce the risk of PIF. These specifically apply to aircraft with retractable landing gear in the event of a wheels-up landing.

The AT-400 aircraft was certificated under FAR 21 in the restricted category. It met the structural requirements of FAR 23, and the flight criteria, propulsion, systems and equipment items of CAM 8, Appendix B (FAA TCDS A9SW).

Fuel tanks in accident impacts

In an accident impact, metal fuel tanks are prone to rupturing, allowing fuel to spill. The rupture of the tank causes the fuel to escape at high pressure and velocity which in turn causes the fuel to form a fine mist, which can be ignited by a source such as a hot engine or electrical arcing, and produces a very intense fire.[18]  

The rupturing of the tanks results from high fluid pressures caused by inertial accelerations during the impact. The pressure distorts the tank walls and rupture will occur when the strain[19] of the distortion reaches the rupture strain (also known as the ‘ultimate’ or ‘fracture’ strain) of the tank wall material.

To improve crashworthiness, fuel bladders and cells have been constructed of materials that are less prone to rupturing, that is, they have a higher rupture strain. These are able to withstand more deformation and a puncture is less likely to expand or tear and form a larger opening from which fuel can escape.   

The rupture strain for airframe aluminium (2024-T3 alclad sheet) is about 18%. Elastomers[20] tolerate severe deformation without rupturing – for a typical elastomer, the rupture strain is about 300% – significantly higher than metals. Additionally, even if elastomeric walls are punctured, the probability of fuel misting is very low because the flow rate for the puncture is much less than through a split tank wall. As an example, Robinson R44 helicopter bladder tanks are elastomer.

The resistance of elastomers to rupture and puncture can be substantially increased by incorporating high-strength fibres, such as Kevlar, into the material. For ultimate post-crash fire resistance (as in motor racing), fuel tanks (or cells) use double elastomeric walls with material such as Kevlar in the outer layer. This substantially reduces the probability of tank wall rupture, puncture and of fuel misting.

Prevention of post-impact fires

The US National Transportation Safety Board (NTSB) special study report General Aviation Accidents: Postcrash Fires and How to Prevent or Control Them (NTSB, 1980), found that PIF occurred in about 8% of the 22,002 general aviation accidents in the US during 1974–1978. Fatalities resulted from about 59% of the accidents involving PIF and 13.3% of the accidents without fire. The study tested the hypothesis that PIF occur more often in severe accidents. Severe accidents included collisions with the ground or objects such as trees/poles, stall/spin accidents, and some following engine failure/malfunction. These made up almost 80% of fatal accidents. In severe accidents, fatalities occurred in 18% of the accidents without PIF, but in more than 60% with PIF. For non-severe accidents, less than 1% involved fatalities without PIF and 19% involved fatalities with PIF. The report summarised that fire, rather than impact, was the major contributor to fatalities in general aviation accidents involving PIF.

The study found that PIF was occurring in survivable accidents. It noted that in contrast to civil aviation, the US Army had used fuel containment technology to dramatically reduce fire injuries and deaths. A crash resistant fuel system is designed to absorb energy in controlled failures of sacrificial structures to minimise impact loads on the fuel tank and eliminate the escape of flammable fluid in a crash. The intent was that the aircraft occupants would then have sufficient time to escape or be rescued without the threat of fire.

The report identified that technology for crash-resistant fuel systems existed (in 1980) suitable for general aviation aircraft. The 1980 NTSB special study report stated that ‘the concept of fuel containment is both feasible and achievable now’. The report Tests of Crash-Resistant Fuel System for General Aviation Aircraft (Perrella, 1978) concluded that lightweight, flexible, crash-resistant fuel cells used in combination with self-sealing break-away fuel-line couplings can effectively reduce PIF in general aviation aircraft equipped with wing tanks. Safety fuel cells were developed in the 1960s to prevent post-crash fuel-fed fires in race cars to improve survivability.

However, aircraft design and certification regulations did not reflect the technologies available. In response, the US NTSB issued 6 recommendations to the US Federal Aviation Administration (FAA) to implement regulations aimed at addressing the issue of post-crash fires – A-80-90 to A-80-95.

On 17 September 1985, the FAA issued an advance notice of proposed rulemaking that informed the public of the FAA’s intent to formulate rules to improve the crash-resistance of small airplanes' fuel systems and requested economic and technical information to assist in economic analysis and technical decisions for future rulemaking.

After several years of studies and discussions, on 20 May 1988, the FAA advised the NTSB that they had drafted a notice of proposed rulemaking (NPRM). On 14 February 1990, the FAA issued an NPRM proposing changes to the airworthiness standards to improve the crash resistance of fuel system on normal, utility acrobatic, and commuter category airplanes. These proposed design changes were to limit fuel spillage near ignition sources and would provide additional time for survivors of an accident to evacuate the aeroplane.

After some changes and review of the NPRM, in 1995, the FAA concluded that the recommendations could not be justified on a benefit-to-cost basis and therefore planned to take no action on these recommendations.

In 1996, the NTSB assessed that no tangible action had occurred in the 16 years since the issuance of these recommendations, and classified recommendations A-80-90 to -92 as closed with unacceptable safety action.

Since that time, crash-resistant fuel bladders/tanks have been introduced in rotorcraft. Crash-resistant fuel system technologies have also advanced significantly, particularly in motor sports.

Regulation of helicopter fuel systems

In 1994, US helicopter standards FAR 27.952 and FAR 29.952 introduced fuel system crash resistance tests and features for new design certification. These were introduced because it was estimated at the time that 5% of occupants in survivable rotorcraft accidents were killed or injured by PIF. There were no equivalent test requirements for fixed wing aircraft.

Research for ATSB investigation AO-2013-055, found that in Australia from 1993 to 2013, PIF occurred in 7 of 47 impact-related accidents (with usable fuel remaining) involving Robinson R44 helicopters not fitted with bladder tanks. Six of those accidents resulted in fatalities. The investigation found that PIF occurred in a significantly higher proportion of accidents involving R44 helicopters without bladder-type tanks than in other similar helicopter types. In response to ATSB safety recommendation AO-2013-055-SI-01, in April 2013, CASA issued an airworthiness directive requiring Australian operators of R44 helicopters to comply with the manufacturer’s service bulletin to replace all-aluminium fuel tanks with bladder-type tanks on R44 helicopters. Since then, there have been 68 R44 and R44 II accidents in Australia, 4 of which had PIF. There were no recorded fatalities as a result of PIF in R44 helicopters in that period.

Transportation Safety Board of Canada safety issues investigation

The Transportation Safety Board of Canada (TSB) conducted a safety issues investigation – Post‑impact fires resulting from small-aircraft accidents. The investigation examined TSB data for the 13,806 accidents involving aircraft weighing 5,700 kg or less, that occurred between 1976 and 2002. The TSB determined that PIF had occurred in 521 (3.8%) of those accidents, resulting in 728 (22%) of the 3,311 total fatalities. Of the 728 fatalities, 205 were assessed as due to fire as were 80 of the 231 total serious injuries. The aircraft included 382 production aeroplanes, 94 production helicopters, 27 amateur-built aeroplanes, 2 amateur-built helicopters, 1 gyroplane and 17 ultralights. Two of the accidents were mid-air collisions between 2 aeroplanes.

The investigation found that PIF presented a significant risk of fire-related injuries and fatalities to the aircraft occupants following a collision because of:

  • the proximity of fuel to the occupants
  • limited escape time
  • limited energy-absorption characteristics of the airframes in crash conditions
  • high propensity for immobilising injuries
  • inability of firefighters to suppress PIFs in time to prevent fire-related injuries and fatalities.

The investigation concluded that there should be improvements to prevent PIF and reduce fire-related injuries in otherwise survivable accidents. It found that ‘the most effective defence against post-impact fire is to prevent the fire from occurring at impact, either by containing fuel or preventing ignition, or both’.

The investigation also reviewed the history of post-impact fire safety action and identified that previous attempts to amend certification requirements for small aircraft had been unsuccessful. The report stated that post-impact fire-resistant fuel system technology had been demonstrated to be effective in race car and automotive applications, and in certified civilian helicopters. However, there was no requirement to incorporate these engineering countermeasures into new or existing small aeroplanes (or helicopters certified before November 1994).

While acknowledging the difficulty of implementing design improvements in new and existing (FAR 23 and equivalent) aircraft, the investigation found that doing so would reduce the incidence of fire-related injuries and significantly increase the rate of occupant survival.

ATSB post-impact fire occurrences

Post-impact fire data

As not all accidents were likely to have a post-impact fire risk, ATSB identified a subset of accidents, which were impact-related and therefore expected to be more likely to result in fire. The ATSB occurrence database held records of 316 collision with terrain or controlled flight into terrain (CFIT) accidents involving VH-registered (fixed-wing) aeroplanes between 2012 and 2021.

PIFs occurred in 34 (11%) of these accidents. Of the 316 accidents, 81 resulted in fatal injuries, 24 of which had PIF, in 36 the highest injury level was serious, 5 of which had PIF, and 199 resulted in only minor or nil injuries, 5 of which had PIF. As a proportion of PIF accidents, 71% were fatal, 15% were serious injury accidents and 15% resulted in minor or nil injuries. By comparison, 20% on non-PIF accidents were fatal, 11% resulted in serious injuries and 69% in minor or nil injuries.

Figure 13: Proportion of accidents with and without PIF

Figure 13.jpg

The 316 accidents resulted in a total of 137 fatalities and 61 serious injuries. The 34 PIF accidents accounted for 35 of the fatalities (26%) (similar to the TSB issues investigation which found 22%), and 10 (16%) of the serious injuries (Table 4).

Table 4: Number of fatal and serious injuries in PIF vs all aeroplane accidents 2012-2021

All collision accidents (316 total)
Injury categoryNumberRates per accident
Fatalities1370.43
Serious injuries610.19
All accidents resulting in PIF (34 total)
Injury categoryNumberRates per accident
Total fatalities351.03
Total serious injuries100.29
Fatalities due to fire50.15
Serious injuries due to fire40.12
Survivability analysis

The ATSB analysed available information from the 34 PIF accidents to determine which fatalities and serious injuries were due to fire or impact. Information sources included post-mortem reports, coroners’ reports and published ATSB investigation reports. Post-mortem reports were not available for all the fatal accidents and were generally only of flight crew (not passengers). Further, for non-fatal injuries, recorded details of the injuries were limited. For this analysis, the severity was assessed as having been increased due to fire only where burns or smoke inhalation were specifically mentioned. Where information was unavailable, these were not counted as fire-related injuries/fatalities. As the NTSB found, fire rather than impact was the major contributor to fatalities in general aviation accidents involving PIF.

There were 2 accidents in which the cause of death was a combination of multiple injuries and fire, and where the injuries included head/skull injuries. These were assessed as probably not survivable because head injuries and skull fractures were significantly associated with mortality in studies of falls from heights and motor vehicle accidents (Liu and others, 2009, Papadimitriou-Olivgeris and others, 2020).

In 5 of the 34 PIF accidents (15%), a total of 5 fatalities were assessed as a result of fire following survivable injuries received in the impact. This was about 4% of all the VH-registered aeroplane impact-related accident fatalities. Two additional accidents resulted in a total of 4 serious injuries due to fire. Detail of the analysis is in Appendix B. In summary, analysis of the 34 PIF accidents found:

  • 5 were considered survivable without the post-impact fire, where occupants were fatally injured
  • 18 in which the accident impact was not considered survivable or were probably not survivable
  • 2 resulted in serious fire-related injuries
  • 9 in which occupants egressed and survived without further injury.

Five of those 34 accidents with a post-impact fire occurred during aerial application operations:

  • 2 were probably not survivable as the occupants sustained multiple injuries including skull fractures
  • 1 in which the occupant survived and exited the aircraft before it was destroyed by post-impact fire
  • 1 in which the pilot died from the effects of fire
  • 1 in which the pilot died from the effects of fire and sustained injuries that would probably have prevented the pilot extricating themselves from the wreckage.
Fuel tank type

Three types of fuel tanks were used in the accident aircraft – integral, rigid and bladder tanks:

  • Integral fuel tanks are part of the aircraft structure. They are manufactured by assembling parts of the aircraft structure with sealant to form a fuel-tight compartment, most commonly in the wings.
  • A rigid tank can be made of various materials including aluminium alloy, steel or composites. They are usually removable and mounted into the airframe structure.
  • A bladder type fuel tank is a rubber/elastomer cell dependent on the structure of the cavity it sits in to support the weight of the fuel within it. Bladder (or ‘bag’) tanks have historically been installed in the wing in lieu of sealing the structural components but not made of crash-resistant materials. Crash-resistant materials are capable of providing impact and puncture resistant fuel bladders and cells such as those used in helicopters and racing cars.

For the aircraft involved in the 34 PIF accidents:

  • Non-crash-resistant bladder tanks were fitted in 2 aircraft involving 6 fatalities. No serious injuries were recorded for those aircraft and neither accident was survivable.
  • Rigid tanks were fitted in 9 of the aircraft involving 7 fatalities, none of which were survivable. Two resulted in serious injuries that were not fire related.
  • Integral tanks were fitted in 23 of the aircraft involving 22 fatalities, 5 occupants of which would have survived without for the fire. In those aircraft, 8 serious injuries occurred, 4 of which were attributable to fire.

Organisational information

Aircair overview

Aircair was founded in 1980 and was one of the largest aerial application operators in Australia. The CASA-issued Air Operator’s Certificate current at the time of the accident was re-issued to Aircair on 11 June 2021, valid until 30 June 2024. Under the certificate, Aircair was authorised to conduct aerial application and aerial work operations. At the time of the accident, Aircair had a fleet of 13 aircraft conducting application operations and engaged 12 pilots. As well as VH-ACQ, the aircraft fleet included a radial-engine Air Tractor AT-301, turbine-engine AT-502, AT-504 and AT-802 type aircraft, and a piston-engine Cessna 188B, which the company had purchased specifically for the accident pilot to operate during their initial supervised hours of aerial application operations.

Safety management

At the time of the accident, although Aircair was not required to have a safety management system, they had implemented the AAAA’s Aerial Improvement Management System (AIMS). AIMS was designed to meet the safety management and quality assurance requirements of the multiple regulators that an aerial application employer is bound by, including CASA. AIMS incorporated safety management of all facets of the business, including aviation, and was designed to integrate with the company’s Operations Manual.

The AIMS section associated with planning and conducting an application detailed that the operations manager or general manager could select a particular pilot for a given application based on their experience. The section also included a detailed drift risk assessment, which was to be followed by a plan to manage the application risks, including identifying if a forecast temperature would result in a decision to cease spraying. There was no requirement for the risk assessment to be documented or retained. The chief pilot reported having discussed the application plan and forecast with the pilot the evening prior to the accident, and the pilot had confirmed the temperature spray limit with the operations manager while the aircraft was being refuelled shortly before the accident. 

The AIMS section also required the pilot to complete a hazard check on arrival to the treatment area.

Similar occurrences

Loss of control in flight

The CASA Advisory Circular 61-16 – Spin avoidance and stall recovery training (CASA, 2020), stated that stall-spin accidents accounted for about a quarter of all general aviation accidents worldwide. Further, that other than those which occurred during dual flight instruction, most of those losses of control occurred at a height too low for recovery.  

The ATSB occurrence database recorded 269 accidents that occurred due to a loss of control between 2010 and 2020 involving (fixed-wing) aeroplanes. Of those accidents, 32 occurred while manoeuvring or conducting airwork, 17 of which resulted in fatal injuries. Of the 32 accidents that occurred during manoeuvring/airwork, 14 were conducting aerial application or mustering operations.

The following is a sample of ATSB investigations into fatal accidents that resulted from an aerodynamic stall at a height too low to recover before the aircraft impacted terrain.

AO-2008-069

The pilot of a Piper Aircraft PA36-375 Pawnee Brave was conducting aerial baiting operations in the Pilton Valley, Queensland when the aircraft collided with terrain. The aircraft was seriously damaged by impact forces and a post–impact, fuel- and magnesium-fed fire. The pilot was fatally injured.

The investigation found that the topography of the area and the strong gusty wind conditions at the time, probably resulted in turbulence that increased the hazardous nature of the low-level application task. It is likely that the pilot lost control of the aircraft as a result of that turbulence, at a height from which recovery was not possible before the aircraft struck the ground.

AO-2009-070

The pilot of a Cessna A188B aircraft was fatally injured when the aircraft impacted terrain during spraying operations. The investigation determined that the aircraft stalled at an altitude from which the pilot was unable to recover before the aircraft impacted terrain.

AO-2011-082

A PZL-Mielec M18A Turbine Dromader aircraft impacted terrain on a cotton station near Dirranbandi, Queensland while conducting aerial spraying. The pilot was fatally injured, and the aircraft was destroyed by impact forces.

The ATSB found that, for reasons that could not be determined with certainty, the aircraft departed from controlled flight during a turn at low height and the pilot was unable to recover before impacting the ground.

AO-2012-059

The owner-pilot of a Cessna 150 aircraft was aerial stock mustering on a cattle station about 55 km north-east of Bourke, New South Wales. The aircraft was observed circling over an area (where cattle were not moving,) then entered a steep descent followed by the sound of an impact. The aircraft was seriously damaged, and the pilot sustained fatal injuries.

The ATSB found that, while manoeuvring at low level, the pilot inadvertently allowed the aircraft to aerodynamically stall, resulting in a high rate of descent and collision with terrain. There was insufficient information about pilot control inputs to establish the factors that precipitated the stall.

AO-2014-192

On 29 December 2014, a Cessna 172S aircraft departed Cambridge Airport, Tasmania to photograph yachts participating in the 2014 Sydney Hobart race. On board the aircraft were the pilot and a photographer.

At about 1815, the aircraft commenced low-level photographic runs on yachts. Shortly after completing a run on one yacht at a height of about 50 ft, the aircraft entered a steep climbing turn. The aircraft had almost completed a 180° turn when the upper (right) wing dropped sharply while the aircraft’s nose pitched down to almost vertical. The aircraft impacted the water’s surface in an almost vertical nose down attitude with wings about level. Both aircraft occupants were fatally injured, and the aircraft was substantially damaged.

As a result of the steep climbing turn, the aircraft’s upper wing aerodynamically stalled, resulting in a rapid rotation out of the turn. The steep pitch attitude indicated that, because of the stalled upper wing, the aircraft entered a spin. There was insufficient height for the pilot to recover the aircraft.

Addressing loss of control in flight occurrences

The US FAA Airplane Flying Handbook (2021) chapter 5 Maintaining aircraft control: upset prevention and recovery training, stated that a loss of control in flight (LOC-I) is the leading cause of fatal general aviation accidents in the US and commercial aviation worldwide. The text listed situations that increase the risk of loss of control, including uncoordinated flight, distraction, turbulence and poor risk management. It further stated that in situations where a LOC-I can occur, pilots must recognise when the aircraft is approaching a stall or has stalled and execute the correct procedure to recover the aircraft. This requires training that includes slow flight, stalls, spins, and unusual attitudes.

US FAA Advisory Circular 120-109 – Stall prevention and recovery training was aimed at reducing LOC-I accidents and incidents. The circular stated that a ‘recurring causal factor in LOC-I accidents and incidents is the pilot’s inappropriate reaction to impending stalls and full stalls’. Further, the circular advised that reducing the angle of attack was the most important pilot action to recover from an impending or full stall and therefore this should be emphasised in stall training. 

Safety analysis

Introduction

On the morning of 4 December 2021, after completing the fifth spray run of the eleventh chemical load on a property near Moree, New South Wales, VH-ACQ was observed to climb, enter a right procedure turn, then descend rapidly and impact terrain, followed almost immediately by an intense fuel-fed fire.

The investigation found no evidence of a bird or tree strike, or anything likely to have jammed the flight controls affecting controllability. Continuity of the flight controls was established, the main wing spar was intact, and the engine was making power and driving the propeller when the aircraft impacted the ground. At the time of the accident, the aircraft was below the maximum take-off weight approved for aerial application operations and the centre of gravity was within the extrapolated limits.

This analysis will discuss development of the accident sequence and the effect of the environmental conditions. The pilot’s experience and how this contributed to workload and fatigue will also be examined. Further, it will consider the management of flight risk and factors affecting survivability.

Loss of control

Witness observations of the aircraft turning and descending rapidly were consistent with an aerodynamic stall and loss of control in flight. These observations were consistent with the accident site, in which the aircraft wreckage was confined in a small area, with evidence of a high vertical impact and low forward speed.

The last recorded GPS position left of the last spray run and about 180 ft above the ground, was consistent with the pilot conducting a right procedure turn – a shallower turn about 45° to the left, followed by a steeper right turn – at the end of the spray run. That last recorded height was very likely not the maximum reached, as the data from previous turns showed the aircraft generally climbed to about 250 ft above the ground.  

The loss of control in flight was consistent with a rapid entry to the stall. That stall was a result of the angle of attack being too high from moving the elevator control stick position too far aft while increasing the bank angle during the turn. The stick force experienced by the pilot on the elevator control depended on the trim position, which could not be determined. Regardless of the stick force, the stick position that a pilot needs to set to recover from a stall will be the same. Stall prevention requires monitoring the position of the elevator control stick, awareness of its position at which the aircraft will stall, and to maintain the control stick forward of that position. Stall warning or buffet should alert the pilot to move the stick forward, but the pilot may have had very little warning. The pilot reportedly had the stall stick position demonstrated, and although they had on occasion pulled the stick back too far in a turn during training, this was a common training error, which the pilot had been observed to have rectified. Analysis of recorded GPS data from the pilot’s flights prior to the accident, showed the pilot generally employed sound technique in the turns.  

The Airplane Flight Manual stated that the aircraft would lose 220 ft in recovering from a straight and level stall at the published maximum weight, based on flight testing. Recovery height would be increased by an accelerated stall and uncoordinated turn. Accident site analysis showed the aircraft impacted the ground nose-down and wings almost level, which suggested the pilot had acted to recover from the stall but had insufficient height to complete the recovery.

Effect of field shape

As evidenced by the recorded GPS data, the pilot had not flown hazard checks on the accident day. The operator assessed that as the pilot had overflown the accident block several times in the previous days, they were probably familiar with it. However, it could not be determined whether the pilot had identified the uneven southern boundary and shape of crop to be sprayed before commencing the accident turn.

Due to the shape of the target block, the pilot needed to turn the aircraft further beyond the southern boundary or wider than the previous turns, to line up on the next spray run at a suitable height to commence spraying. Consideration of additional turn radius was also required due to the 10–18 kt gusty south-westerly wind becoming a tailwind during the turn, thereby pushing the aircraft closer to the crop.

The recorded GPS data from the pilot’s flights on the day prior to the accident showed that the aircraft was usually lined up on the next spray run about 200 m prior to the crop boundary. The location of the accident and the position where the loss of control occurred was about 110 m south of the target crop. At that point, the aircraft was too high and too close to the southern boundary to manoeuvre safely to commence spraying the crop at the start of the next spray run. From this position, the pilot likely attempted to tighten the turn rather than miss the additional crop (and skip that spray run).

Experience, workload, and fatigue

Experience

The pilot had commenced aerial application training immediately after attaining a commercial pilot licence in the minimum timeframe. On achieving their aerial application and low-level ratings, the pilot commenced aerial application operations as an employee of the aircraft operator, in September 2021. The pilot then conducted the required supervised aerial application flight time in a piston-engine aircraft. One week before the accident, the operator assessed that the pilot was ready to transition to turbine-engine Air Tractor aircraft.

Although the pilot had demonstrated competence in the aircraft and aerial application to a high level of skill for their experience, at the time of the accident, they were still relatively inexperienced in overall flight time, aerial application, and particularly in the AT-400 aircraft. This inexperience likely affected many facets of the operation, including aircraft handling, workload and fatigue.

Workload 

Agricultural pilots operating at low altitudes must visually scan external cues to control the aircraft and avoid obstacles, while also monitoring inside the cockpit including instruments, spray systems and property maps. Due to the close proximity to obstacles, terrain and the airspeeds at which the aircraft are flown, agricultural pilots have less time to respond to abnormal situations. As a result, any lapse in concentration or imprecision in control input could lead to catastrophic consequences (NTSB, 2014).

During the morning, the increased temperature, change in wind direction and increase in wind strength and gust speed, made the flying conditions increasingly turbulent. The conditions half an hour after the accident were described as quite windy and rough. Turbulence has been found to increase physical and mental workload, which can lead to degradation in the pilot’s ability to safely and effectively operate the aircraft. This is due to human perceptual systems breaking down, as a result performance can diminish, leading to fatigue, motion sickness and reduced mental performance. (Dodd and others, 2014). These conditions increased the pilot’s workload through additional physical aircraft handling and discomfort.

The pilot’s text message regarding the temperature, radio call regarding drift, and the aircraft’s track on the accident load, were indicative of the pilot making decisions in response to the changing conditions. While such decision-making is a usual part of spraying operations, it requires cognitive resources, thereby increasing workload. The pilot’s radio call about 20 minutes before the accident, suggested the pilot was experiencing stress and high workload. During the morning, the pilot had been in radio contact with the operations manager and other company pilots including the Aircair general manager. However, resources usually available to assist in managing the pilot’s workload and aid in decision‑making, were diminished on the accident day as the loader had no radio and it was the first day that the chief pilot was not supervising the pilot.

Without these resources to assist, the pilot was possibly assessing whether to cease flying due to the conditions, further adding to their cognitive load. Making such a decision may also have been more difficult while other company pilots were continuing to operate.

The pilot’s concern about drift precipitated a change of plan, whereby the pilot elected to move from the western to the eastern boundary, abandon the incomplete racetrack pattern and resume spraying in a back-to-back pattern. The change in spray pattern briefly required the pilot’s focus inside the cockpit to change GPS settings, introducing the potential for distraction and increasing workload. However, there was no evidence to demonstrate this distraction occurred at the time of the accident.

Due to a combination of inexperience, the environmental conditions, decision-making, and absence of supervision, the pilot’s workload was likely at a level known to increase error rates, reduce performance and lead to important information being missed (Green and others, 1996).

Fatigue

The pilot had several early starts and long days in the month prior to the accident, consistently reporting to a friend (but not to the operator) being very tired at the end of each day. As the accident day was the pilot’s ninth day of duty, there was an increased risk of cumulative fatigue. In the 3 days prior to the accident, the pilot had recorded their longest consecutive flight and duty times since commencing aerial application operations. Additionally, the pilot’s commute by car to and from the base was extended due to recent flooding, which reduced the opportunity for recovery between flight duties.  

All the pilot’s recent flight time was cognitively demanding low-level aerial application with short breaks during refuelling. Additionally, the cognitive demands would have been higher than for a more experienced pilot, particularly the pilot’s very limited flight time in the turbine-engine aircraft. At the time of the accident, the pilot had been operating for approaching 6 hours, with several short (10-minute) breaks during refuelling, including one about 15 minutes prior to the accident. Research on sustained attention during a task has shown that decreases in performance and self-rating experiences of fatigue increase over time (Rosa and others, 2020). However, work breaks can be temporarily beneficial in reducing the effects of fatigue (Caldwell 2008; Mallis and others 2022).  

The pilot’s sleep history and the accident time of day were unlikely to have affected the pilot’s performance. However, the consecutive long flight and duty times in the days leading up to the accident, in what would have been a high cognitive workload environment for the pilot, likely resulted in the pilot experiencing fatigue at a level known to affect performance.

Effects of workload and fatigue

Several factors increased the pilot’s workload at the time of the accident, including the conditions and inexperience. Those same factors and the high workload itself, combined with long flight and duty times in the preceding days, also likely contributed to the pilot experiencing fatigue.

The pilot had probably encountered similar environmental conditions while flying a piston-engine Cessna 188B aircraft in the previous weeks, but had more experience in that aircraft. That aircraft also had more docile stall characteristics and gave more warning of an impending stall. After commencing flying VH-ACQ 5 days before the accident, the pilot had demonstrated competence in that aircraft and operated it effectively, including spraying over 1,000 hectares in the previous 2 days. However, on the accident day, the pilot mishandled the aircraft during the turn. This handling error was likely a result of fixating on making the crop, and not monitoring the aircraft state or allowing adequate margin for the conditions. These errors and impaired awareness were consistent with the effects of both overload and fatigue.

Flight risk management

Management of fatigue is a shared responsibility between the aircraft operator and the pilot. Although the pilot had self-assessed as being tired on many occasions in the previous weeks, including the evening prior to the accident, there was no evidence this had been reported to the operator. Additionally, this tiredness had been noted in the evenings, following which there was a sleep opportunity for the pilot to recover (to some extent) before commencing the next morning.

Based on the regulatory duty time limitations, had the pilot been off duty for between 9 and 10 hours when they commenced on the morning of the accident, they were within a discretionary period that required a self-assessment of being mentally and physically fit to fly. The pilot commenced on the accident day close to the 10-hour rest period and it was unknown whether the pilot conducted this self-assessment. However, pilots were required to ensure they were fit to fly prior to every flight. There was also no evidence that the operator was aware the pilot had commenced duty on the accident day within or approaching the discretionary duty time window.

The aircraft operator’s operations manual stipulated that fatigue be managed in accordance with Civil Aviation Safety Regulations, which provided maximum flight and duty times (and minimum rest periods) for aerial application operations. However, there was no consideration of environmental conditions or experience – total aeronautical experience, aerial application flight hours, or hours in an aircraft model – nor how this may affect fatigue. Given inexperience and environmental conditions can increase fatigue, these factors in combination should be considered as part of fatigue risk.

Furthermore, fatigue risk is just one component of overall flight risk. A flight risk assessment provides a comprehensive assessment of factors that increase risk and the effect of combination of these factors. Although it was not required by regulations at the time, the aircraft operator had a safety management system. However, it did not include a flight risk assessment tool, which is a key component of a safety management system (FAA, 2016).

The 2014 US National Transportation Safety Board Special investigation report on the safety of agricultural aircraft operations outlined that risk management guidelines and best practices specific to agricultural aircraft operations were necessary to help operators and pilots mitigate their unique risks. These practices should include information and checklists for performing pre-flight risk assessments and identifying mitigation strategies.

A flight risk assessment tool specific for aerial application operations should include consideration of pilot (experience, recency, supervision, fitness to fly), aircraft (including role equipment), environment (weather, task, chemical, hazards) and operational pressures. Use of a flight risk assessment tool before commencing a flight also acts as a prompt for a pilot to reassess the risk when the considered factors change. Although the operator was attempting to manage the risk associated with inexperience, having a formal process may have integrated all the hazards present on the accident day. Had a flight risk assessment tool been available to the pilot on the accident morning, the combination of the weather conditions, inexperience, complexity of the task, absence of supervision, and probable fatigue, would have been expected to generate an elevated risk rating that would have required mitigation and/or approval for the pilot to conduct or continue the flight.

Survivability

The post-mortem examination identified that the pilot succumbed to the effects of fire. The fire was likely a hot, flash-over fire resulting from the rupture of the fuel tanks and misting of the fuel. Local workers who witnessed the accident were on site within minutes of the accident, however, the fire erupted within seconds of impact.

The tolerance of the human body to accident impact is a function of many variables, including individual characteristics, such as age, sex and general health. The restraint system significantly contributes to the overall probability of survival in an accident (Coltman and others, 1989). Contact injuries are reduced by 4-point (and 5-point) restraints and aviation-standard helmets. Restraints, energy-absorbing structure and seats reduce acceleration injuries. If these injuries do occur, they can contribute to fire-related fatalities and more serious injuries, by preventing self-extrication from an aircraft in the event of a post-impact fire.

An estimate of the impact forces, based on the bending of the pilot seat frame, indicated the accident would have likely resulted in severe injury. However, the pilot did not sustain impact-related injuries likely to have contributed to mortality. The pilot was almost certainly wearing a helmet and a 4-point restraint, and the cockpit maintained survivable space around the pilot’s torso. The crushing of the hopper and forward section of the aircraft likely absorbed a significant amount of the of the forward impact, aiding in reducing acceleration injuries.

Crash-resistant fuel systems

Air Tractor aircraft, like many others, use the aircraft wing structure as an integral fuel tank. The AT-400 fuel tank met or exceeded the certification requirements. In an impact with the ground, traditional aircraft wing structures are comparatively rigid and will rupture, allowing their fuel contents to escape. Due to the high fluid pressures generated inside the fuel tank in ground impacts, fuel forced through these ruptures tends to mist into a large cloud, which increases the risk of ignition and conflagrates quickly into a large encompassing fire.

An aircraft fuel tank lined with a crash-resistant bladder can be more resistant to spilling or leaking due to its ability to retain its contents if distorted. Being flexible, the bladder can withstand changes to its shape without rupturing or splitting. The bladder is also more tolerant of penetrating objects being able to deform around the intruding body to some extent. There have been no fatal or serious injuries to occupants as a result of post-impact fire in Robinson R44 helicopters in Australia since fitment of bladder tanks was mandated after a fatal accident in 2013. Prior to that time, accidents involving Robinson R44 helicopters without bladder tanks resulted in a significant proportion of post-impact fires. Of the (fixed-wing) aeroplanes involved in fatal accidents with post-impact fire in Australia between 2010 and 2022, 2 were fitted with fuel bladders. However, these were not made of crash-resistant materials.

Bladder tanks are one technology designed to improve crashworthiness of fuel systems. Crash‑resistant fuel systems reduce the risk of post-impact fire and provide occupants with more time to escape or be rescued. VH-ACQ was not fitted with crash-resistant fuel tanks or systems. The certification standards at the time the aircraft was manufactured did not require it, nor did the fixed-wing aircraft standards at the time of the accident. This differed from the requirements for rotary-wing aircraft.

The US National Transportation Safety Board and the Transportation Safety Board of Canada found a significant risk associated with post-impact fires in general aviation aircraft. As a result, they made recommendations to the US Federal Aviation Administration aimed at addressing the crashworthiness of fuel systems in these aircraft. A review of VH-registered aeroplane accidents in the ATSB occurrence database from 2010–2022 found a significant risk for post-impact fire fatalities, consistent with that previously identified in the US and Canada. Nearly 4% of the fatalities (5 fatalities in 10 years) in general aviation accidents in Australia were solely the result of the post impact fire. A fatality percentage of 5% was used by the Federal Aviation Administration to justify fuel system crash resistance tests and features for new helicopter designs.

The design principles and technologies for crash-resistant fuel systems exist and have been proven effective in helicopters and the automotive industry. Incorporating these in aeroplane design would reduce the risk of impact-induced fire in otherwise survivable accidents.

Findings

ATSB investigation report findings focus on safety factors (that is, events and conditions that increase risk). Safety factors include ‘contributing factors’ and ‘other factors that increased risk’ (that is, factors that did not meet the definition of a contributing factor for this occurrence but were still considered important to include in the report for the purpose of increasing awareness and enhancing safety). In addition, ‘other findings’ may be included to provide important information about topics other than safety factors. 

Safety issues are highlighted in bold to emphasise their importance. A safety issue is a safety factor that (a) can reasonably be regarded as having the potential to adversely affect the safety of future operations, and (b) is a characteristic of an organisation or a system, rather than a characteristic of a specific individual, or characteristic of an operating environment at a specific point in time.

These findings should not be read as apportioning blame or liability to any particular organisation or individual.

From the evidence available, the following findings are made with respect to the loss of control and collision with terrain involving Air Tractor AT-400, VH-ACQ, 75 km west-south-west of Moree, New South Wales, on 4 December 2021.  

Contributing factors

  • The aircraft was too close to the start of the spray run during the turn, which probably resulted in the pilot tightening the turn. This almost certainly resulted in an aerodynamic stall at a height too low to recover before colliding with the ground.
  • The pilot was likely experiencing high workload and fatigue due to long flight and duty times, inexperience, the complexity of the task and the weather conditions. The combined effects of these factors probably resulted in the pilot mishandling the turn.
  • The aircraft’s integral fuel tanks ruptured during the accident sequence. This resulted in a fire which led to the pilot’s fatal injuries.

Other factors that increased risk

  • The aircraft was not fitted nor required to be fitted with a crash-resistant fuel system under the current standards or those in place at the time of manufacture. As a result, post-impact fire presents a significant risk of fire-related injuries and fatalities to aircraft occupants. (Safety issue)

Other findings

  • A flight risk assessment tool is used in some aerial work operations, however for aerial application operations it is not a requirement and generally not used. A flight risk assessment tool tailored to aerial application would likely have identified an elevated risk on the day of the accident, due to the combination of the pilot’s inexperience, weather conditions, complexity of the task, absence of supervision and probable fatigue.
  • The pilot was almost certainly wearing a helmet and 4-point restraint increasing their chances of survival in an accident.

Safety issues and actions

Central to the ATSB’s investigation of transport safety matters is the early identification of safety issues. The ATSB expects relevant organisations will address all safety issues an investigation identifies.

Depending on the level of risk of a safety issue, the extent of corrective action taken by the relevant organisation(s), or the desirability of directing a broad safety message to the aviation industry, the ATSB may issue a formal safety recommendation or safety advisory notice as part of the final report.

The directly involved parties were provided with a draft report and invited to provide submissions. As part of that process, each organisation was asked to communicate what safety actions, if any, they had carried out or were planning to carry out in relation to each safety issue relevant to their organisation.

Descriptions of each safety issue, and any associated safety recommendations, are detailed below. Click the link to read the full safety issue description, including the issue status and any safety action/s taken. Safety issues and actions are updated on this website when safety issue owners provide further information concerning the implementation of safety action.

Crash-resistant fuel system

Safety issue number: AO-2021-052-SI-01

Safety issue description: The aircraft was not fitted nor required to be fitted with a crash-resistant fuel system under the current standards or those in place at the time of manufacture. As a result, post-impact fire presents a significant risk of fire-related injuries and fatalities to aircraft occupants.

Safety recommendation description: The ATSB recommends that the United States Federal Aviation Administration take action to address certification requirements for crash-resistant fuel systems for fixed wing aircraft to reduce the risk of post-impact fire.

Safety action not associated with an identified safety issue

Whether or not the ATSB identifies safety issues in the course of an investigation, relevant organisations may proactively initiate safety action in order to reduce their safety risk. All of the directly involved parties are invited to provide submissions to this draft report. As part of that process, each organisation is asked to communicate what safety actions, if any, they have carried out to reduce the risk associated with this type of occurrences in the future. The ATSB has so far been advised of the following proactive safety action in response to this occurrence.
Additional safety action by Aircair Aviation Operations Pty Ltd (Aircair)

Aircair has considered whether there could be a risk associated with fatigue that does not necessarily correlate to flight and duty hours worked. As such, they are investigating if other means of measuring fatigue risk can be developed, such as a point score system that includes any other contributory factors such as conditions, experience, overall wellbeing and difficulty of the task. Further, they intend to explore technology available in modern cars and machinery that measures operator fatigue.

In August 2022, Aircair’s pilot group underwent advanced stall and spin prevention, recognition and recovery training with an experienced aerobatic instructor. Due to its success, Aircair is investigating ways of incorporating such training into its new pilot induction program.

Aircair recommended that the risks associated with mobile phone use in the cockpit (as referenced in the Aircair Operations Manual) are reiterated to pilots on a regular basis by way of pilot meetings and safety notices.

Aircair intends to ensure that pilots are regularly reminded of the possibility of becoming distracted by guidance systems and the impact this may have on safe operations. As part of this process, pilots should be reminded to only attend to GPS related issues when at a safe height above the ground.

Pre-application field inspections form a critical component for a safe application operation (particularly for unfamiliar fields). The requirement to conduct such inspections is set out in the Aircair Operations Manual and is tested during Aircair Operator Proficiency Checks (OPC). The importance of pre‑application field inspections will be reinforced to pilots on a regular basis by way of pilot meetings and safety notices.

Glossary

AAAA               Aerial Application Association of Australia

AFM                 Airplane Flight Manual

AIMS                Aerial Improvement Management System

CAM                 Civil Aeronautics Manual

CAR                 Canadian Aviation Regulation

CAS                 Calibrated airspeed

CASA               Civil Aviation Safety Authority

CASR               Civil Aviation Safety Regulations

CG                   Centre of gravity

EDT                  Eastern Daylight-saving Time

FAA                  Federal Aviation Administration

FAR                  Federal Aviation Regulation

FCM                 Flight crew member

IAS                   Indicated airspeed

ICAO                International Civil Aviation Organization

LOC-I                Loss of control in-flight

NASA               National Aeronautics and Space Administration

NPRM               Notice of proposed rule making

NTSB                National Transportation Safety Board

PSI                   Pounds per square inch

SMS                 Safety management system. A systematic approach to organisational safety encompassing safety policy and objectives, risk management, safety assurance, safety promotion, third party interfaces, internal investigation and SMS implementation.

TSB                  Transportation Safety Board (of Canada)

UTC                  Coordinated Universal Time

Sources and submissions

Sources of information

The sources of information during the investigation included the:

  • aircraft operator and chief pilot
  • other company pilots
  • Civil Aviation Safety Authority
  • New South Wales Police Force
  • aircraft manufacturer
  • aircraft maintainer
  • accident witnesses
  • recorded data from the aircraft’s GPS units
  • Bureau of Meteorology and Oz Forecast.

References

Air Tractor (2012). Service letter 304: Establishing and operating with a special purpose operating weight for Air Tractor aircraft.

Australian Transport Safety Bureau (2017). ATSB Safety Investigation. Canberra, Australia: ATSB.

Bafna, T. & Hansen, J. P. (2021). Mental fatigue measurement using eye metrics: A systematic literature review. Psychophysiology, 58(6), 13828-n/a. doi: 10.1111/psyp.13828

Beilock, S. L., Carr, T. H., MacMahon, C., & Starkes, J. L. (2002). When paying attention becomes counterproductive: Impact of divided versus skill-focused attention on novice and experienced performance of sensorimotor skills. Journal of Experimental Psychology: Applied, 8, 6-16.

Boksem, M. A. S., Meijman, T. F., & Lorist, M. M. (2005). Effects of mental fatigue on attention: An ERP study. Brain research. Cognitive brain research, 25(1), 107-116. doi: 10.1016/j.cogbrainres.2005.04.011

Byrne, A. J., Murphy, A., McIntyre, O., & Tweed, N. (2013). The relationship between experience and mental workload in anaesthetic practice: an observational study. Anaesthesia, 68(12), 1266-1272. doi: 10.1111/anae.12455

Caldwell, J. A., Caldwell, J. L., & Schmidt, R. M. (2008). Alertness management strategies for operational contexts. Sleep medicine reviews, 12(4), 257-273. doi: doi:10.1016/j.smrv.2008.01.002

Civil Aviation Safety Authority (2012). Fatigue Management Strategies for Aviation Workers: A Training & Development Workbook.

Civil Aviation Safety Authority (2020). Advisory Circular AC 61-16 v1.0: Spin avoidance and stall recovery training.

Coltman, J. W., Van Ingen, C., Johnson, N. B. & Zimmerman, R. E. (1989). Aircraft crash survival design guide: Volume II – Aircraft design crash impact conditions and human tolerance. US: United States Army Aviation Applied Technology Directorate.

Dawson, D., & Reid, K. (1997). Fatigue, alcohol and performance impairment. Nature, July 1997, 388:235.

Dodd, S., Lancaster, J., Miranda, A., Grothe, S., DeMers, B., & Rogers, B. (2014). Touch Screens on the Flight Deck: The Impact of Touch Target Size, Spacing, Touch Technology and Turbulence on Pilot Performance. Proceedings of the Human Factors and Ergonomics Society 58th Annual Meeting, 58(1), 6-10. https://doi.org/10.1177/1541931214581002

Eiband, A. M., Human tolerance to rapidly applied accelerations: A summary of the literature, NASA Memorandum 5-19-59E, National Aeronautics and Space Administration, Washington, D.C., June 1959.

Faber, L. G., Maurits, N. M., Lorist, M. M., & de Lange, F. P. (2012). Mental Fatigue Affects Visual Selective Attention. PloS one, 7(10), e48073-e48073. doi: 10.1371/journal.pone.0048073

Fan, J., & Smith, A.P. (2017). The impact of workload and fatigue on performance. Conference Paper in Communications in Computer and Information Science, June 2017. doi: 10.1007/978-3-319-61061-0_6

Federal Aviation Administration (2021). Airplane Flying Handbook, FAA-H-8083-3C. US: FAA. Retrieved from: Airplane Flying Handbook | Federal Aviation Administration (faa.gov)

Fletcher, A., Lamond, N., van den Heuvel, C., & Dawson, D. (2003). Prediction of performance during sleep deprivation and alcohol intoxication by a quantitative model of work-related fatigue. Sleep Research Online, 5(2), 67-75.

Fletcher, A. (1999). Measurement and management of work-related fatigue: Development and preliminary validations of a predictive model. Ph.D. Thesis, 1999, The University of South Australia.

Folkard, S., & Åkerstedt, T. (2004). Trends in the risk of accidents and injuries and their implications for models of fatigue and performance. Aviation, space, and environmental medicine, 75(3), A161-A167.

Gawron, V. J. (2016). Overview of self-reported measures of fatigue. The International Journal of Aviation Psychology, 26:3-4, 120-131. doi: 10.1080/10508414.2017.1329627  

Goode, J. H. (2003). Are pilots at risk of accidents due to fatigue?. Journal of safety research, 34(3), 309-313. doi: 10.1016/s0022-4375(03)00033-1

Green, R. G., Muir, H., James, M., Gradwell, D., & Green, R. L. (1996). Human Factors For Pilots (2nd ed.), Ashgate, England.

Harris, D. (2011). Human Performance on the Flight Deck. Ashgate, England.

Hawkins, F.H. (1993). Fatigue, Body Rhythms and Sleep. In H.W. Orlady (Eds.), Human Factors in Flight (2nd ed., pp. 56-83). Ashgate.

Heywood, B. (1999). Pilot Fatigue and the Limits of Endurance, Flight Safety Australia (1999, April). Retrieved from: https://skybrary.aero/sites/default/files/bookshelf/1080.pdf.

Hursh, S. R., Balkin, T. J., Miller, J. C., & Eddy, D. R. (2004). The fatigue avoidance scheduling tool: Modeling to minimize the effects of fatigue on cognitive performance. SAE transactions, 111-119.

InterDynamics (n.d.). FAID® Quantum Version 1.1 User Guide.

International Civil Aviation Organization (2020). Manual for the Oversight of Fatigue Management Approaches (Doc 9966).

Li, P. C., Wang, Y. X., Chen, J. H., Luo, Z. H., Dai, L. C. (2021). An experimental study on the effects of task complexity and knowledge and experience level on SA, TSA and workload. Nuclear engineering and design, 376, 111112. doi: 10.1016/j.nucengdes.2021.111112

Liu, C-C., Wang, C-Y., Shih, H-C., Wu, J. J-K., Huang, C-I., Hsu, H-S., Huang, M-H., Huang, M-H., Huang, M-S. (2009).  Prognostic factors for mortality following falls from height. Injury, International Journal of the Care of the Injured, 40 (2009) 595–597.

Mallis, M., Banks, S., Dorrian, J., & Dinges, D. F. (2022). Aircrew fatigue, sleep need, and circadian rhythmicity. In Keebler, J.R., Wilson, K.A., Lazzara, K.H., & Blickensderfer, E.L. (eds) Human Factors in Aviation and Aerospace (pp. 309-339). Academic Press.

National Aeronautics and Space Administration (2010). Human Integration Design Handbook (HIDH). Retrieved from: https://www.nasa.gov/sites/default/files/atoms/files/human_integration_design_handbook_revision_1.pdf

National Transportation Safety Board (1980). General Aviation Accidents: Postcrash Fires and How to Prevent or Control Them (NTSB-AAS-80-02).

National Transportation Safety Board (2014). Special Investigation Report on the Safety of Agricultural Aircraft Operations (NTSB/SIR-14/01). Retrieved from: https://www.ntsb.gov/safety/safety-studies/Documents/SIR1401.pdf

Orlady, H.W., & Orlady, L.M. (1999). Human Factors in Multi-Crew Flight Operations. Ashgate, England.

Papadimitriou-Olivgeris, M., Panteli, E., Koutsileou, K., Boulovana, M., Zotou, A., Marangos, M., Fligou, F. (2021). Predictors of mortality of trauma patients admitted to the ICU: a retrospective observational study. Brazilian Journal of Anesthesiology, 71 (2021) 23-30.

Perrella, W.M. Jr. (1978), Tests of Crash-Resistant Fuel System for General Aviation Aircraft, (FAA-RD-78-28), interim report prepared for the US Department of Transportation, Federal Aviation Administration.

Petrilli, R.M.A., Roach, G.D., Dawson, D., & Lamond, N. (2007). The sleep, subjective fatigue, and sustained attention of commercial airline pilots during an international pattern. Chronobiology International, 23(6): 1347–1362. doi: 10.1080/07420520601085925

Riethmeister, V., Matthews, R. W., Dawson, D., de Boer, M. R., Brouwer, S., & Bültmann, U. (2019). Time-of-day and days-on-shift predict increased fatigue over two-week offshore day-shifts. Applied ergonomics, 78, 157-163. doi: 10.1016/j.apergo.2019.02.010

Roach, G.D., Petrilli, R.M.A., Dawson, D., & Lamond, N. (2012). Impact of layover length on sleep, subjective fatigue levels, and sustained attention of long-haul airline pilots. Chronobiology International, 29(5): 580–586. doi: 10.3109/07420528.2012.675022

Rosa, E., Eiken, O., Grönkvist, M., Kölegård, R., Dahlström, N., Knez, I., ... & Willander, J. (2020). Effects of fatigue on cognitive performance in long-duration simulated flight missions. Aviation Psychology and Applied Human Factors, 10(2), 82. doi: 10.1027/2192-0923/a000191

Skybrary (2010). Workload (OGHFA BN). Skybrary. Retrieved  from: https://www.skybrary.aero/index.php/Workload_(OGHFA_BN)

Tran, Y., Craig, A., Craig, R., Chai, R., & Nguyen, H. (2020). Psychophysiology 57(5), e13554-n/a. doi: 10.1111/psyp.13554

Transportation Safety Board of Canada (2006). Post-impact fires resulting from small-aircraft accidents, (SII A05-01).

Tucker, A. (2015). JHC Commanders’ Guide to Fatigue Management. Retrieved from: https://www.aviation.govt.nz/assets/licensing-and-certification/medical/jhc-commanders-guide-to-fatigue-management.pdf

Submissions

Under section 26 of the Transport Safety Investigation Act 2003, the ATSB may provide a draft report, on a confidential basis, to any person whom the ATSB considers appropriate. That section allows a person receiving a draft report to make submissions to the ATSB about the draft report.

A draft of this report was provided to the following directly involved parties:

  • the aircraft operator
  • the aircraft maintainer
  • Civil Aviation Safety Authority
  • US National Transportation Safety Board
  • Transportation Safety Board of Canada
  • Pratt & Whitney Canada
  • US Federal Aviation Administration
  • Air Tractor Incorporated
  • Satloc.

Submissions were received from;

  • the aircraft operator
  • the aircraft maintainer
  • Civil Aviation Safety Authority
  • US National Transportation Safety Board
  • US Federal Aviation Administration
  • Pratt & Whitney Canada
  • Transportation Safety Board of Canada
  • Air Tractor Incorporated
  • Satloc.

The submissions were reviewed and, where considered appropriate, the text of the report was amended accordingly.

Appendix A – Hoerner wingtips

Hoerner wing tips

Hoerner wing tips were designed to increase wing efficiency, by increasing the effective wing span beyond the actual length of the wing. Effects of this include reduced stalling speed and improved take-off performance.

Hoerner wing tips were not an option for AT-400 aircraft, however, in subsequent Air Tractor models, they were either factory-fitted or offered as a post-factory modification. From Air Tractor regarding the AT-402B: ‘We designed a long, high-aspect ratio wing with Hoerner wing tips to increase wing efficiency, reduce drag and to lower stick and rudder forces so the controls are light and responsive, greatly reducing pilot fatigue.’  

Appendix B – Post-impact fire mortality

Survivable w/out fireImpact or Fire fatalityReferenceInjury LevelAerial ApplicationInjury/death due to fireFatalitiesSerious InjuriesMinor InjuriesFuel Tank type
YesNil injury. Self–extricatedOA2012-00151Nil  000Rigid
NoImpact then fireOA2012-00374Fatal  200Rigid
NoImpactOA2012-02789Fatal  100Integral
NoImpact. Restraint compromisedOA2012-03602FatalY 100Rigid
NoImpactOA2012-04925Fatal  100Rigid
NoProbably impactOA2012-05096Fatal  100Integral
YesImpact and fire. 1 not wearing full restraintOA2012-10258Fatal  111Rigid
NoImpactOA2012-10597Fatal


 200Integral
YesUnknown cause of injuryOA2012-12080Serious  010Rigid
Probably notUnknown, probably not survivableOA2012-12087Fatal  100Bladder
YesFireOA2013-08649  1100Integral
NoImpact and fire. Skull fracturesOA2013-08772Fatal *100Integral
NoImpact then bushfireOA2013-09598Fatal  100Integral
NoImpact then fireOA2013-09679   200Integral
Yes – increased severityFireOA2013-11507  2 fire-related serious injuries020Integral 
NoImpact then fireOA2014-00990   100Integral
YesFire (pilot), 4 parachutists inadequately restrained – impactOA2014-01533Fatal 1500Integral
Yes – increased severityFire increased severityOA2014-01743Serious 2 increased severity020Integral
YesFireOA2014-04896Fatal 1111Integral
NoImpact

OA2014-07632


Fatal  100Integral
Probably notImpact (including skull fractures) and fireOA2015-01029FatalY*100Rigid
Probably notImpact then fireOA2015-03021Fatal  100Rigid
NoImpactOA2015-04887Fatal  100Integral
YesNil. Evacuated.OA2016-02270NilY 000Integral
YesFire. Injuries would have prevented extractionOA2016-04006FatalY1100Integral
NoUnknown. Impact unlikely to be survivableOA2016-04457FatalY 100Integral
NoImpactOA2017-00686Fatal  500Bladder
YesEvacuated before fireOA2017-04954Minor  001Rigid
YesUnknown. EvacuatedOA2018-01892Minor  001Integral
YesUnknown. Pilot extracted self and instructorOA2018-02254Serious  020Integral
NoImpact then fireOA2018-02773Fatal  100Integral
YesNilOA2020-03747Nil  000Integral
YesImpact – pilot ejectedOA2020-05449Serious  010Integral
YesFireOA2021-05331FatalY1100Integral
34  6*Head injuries increase mortality35104 

Purpose of safety investigations

The objective of a safety investigation is to enhance transport safety. This is done through:

  • identifying safety issues and facilitating safety action to address those issues
  • providing information about occurrences and their associated safety factors to facilitate learning within the transport industry.

It is not a function of the ATSB to apportion blame or provide a means for determining liability. At the same time, an investigation report must include factual material of sufficient weight to support the analysis and findings. At all times the ATSB endeavours to balance the use of material that could imply adverse comment with the need to properly explain what happened, and why, in a fair and unbiased manner. The ATSB does not investigate for the purpose of taking administrative, regulatory or criminal action.

Terminology

An explanation of terminology used in ATSB investigation reports is available here. This includes terms such as occurrence, contributing factor, other factor that increased risk, and safety issue.

Publishing information 

Released in accordance with section 25 of the Transport Safety Investigation Act 2003

Published by: Australian Transport Safety Bureau

© Commonwealth of Australia 2023

image_5.png

Ownership of intellectual property rights in this publication

Unless otherwise noted, copyright (and any other intellectual property rights, if any) in this report publication is owned by the Commonwealth of Australia.

Creative Commons licence

With the exception of the Coat of Arms, ATSB logo, and photos and graphics in which a third party holds copyright, this publication is licensed under a Creative Commons Attribution 3.0 Australia licence.

Creative Commons Attribution 3.0 Australia Licence is a standard form licence agreement that allows you to copy, distribute, transmit and adapt this publication provided that you attribute the work.

The ATSB’s preference is that you attribute this publication (and any material sourced from it) using the following wording: Source: Australian Transport Safety Bureau

Copyright in material obtained from other agencies, private individuals or organisations, belongs to those agencies, individuals or organisations. Where you wish to use their material, you will need to contact them directly.

[1]     Eastern Daylight-saving Time (EDT): Coordinated Universal Time (UTC) + 11 hours.

[2]     Aerial spraying is one type of aerial application operation.

[3]     Accepted by NSW Environment Protection Authority, this accreditation for pilots requires demonstrated knowledge of the ‘Spraysafe Manual’, prepared by the University of Queensland’s Centre for Pesticide Application and Safety.

[4]     Emergency dump or jettison is an essential part of emergency procedures for aircraft operating with a hopper load. The procedure releases the entire hopper contents from the aircraft within a few seconds.

[5]     Wing loading is the aircraft weight divided by the wing area. The take-off weight of the AT-400 divided by the wing area is greater than that of the AT-502.

[6]     The Civil Aviation Orders that permitted foreign aeroplanes certified in the Agricultural Category were repealed in 1998 and those aircraft were then operated in the Restricted Category. Restricted category aircraft are limited to operate and carry personnel only for specified purpose/s.

[7]     The Type Certificate Data Sheet includes general information about the design (dimensions, wing loading, limiting airspeeds), required placards and markings, control surface travel, engine installations and, where applicable, approved engine/propeller combinations. (Source: Skybrary)

[8]     A Flight Manual is a manual, associated with the Certificate of Airworthiness, containing limitations within which the aircraft is to be considered airworthy, and instructions and information necessary to the flight crew members for the safe operation of the aircraft. (Source: Skybrary)

[9]     Information about Graphical Area Forecasts is available on the Bureau of Meteorology website.

[10]    The Bureau of Meteorology described a dust devil as: a localised dust filled vortex similar in shape to a tornado but of much less strength…They form due to intense heating at the surface causing a rapid upward movement of parcel of air. This displacement of the surface air causes an inward movement of surrounding air, creating the common spiral shape of the dust devil. Dust devils are generally small in size compared with tornadoes, being about 3-100 m in diameter and up to 300 m high. Wind speeds inside the vortex reach a maximum of 100km/hr.

[11]    Information about aerodrome forecasts is available on the Bureau of Meteorology website.

[12]    CAVOK: visibility of 10 km or more, no cloud below 5,000 ft, no cumulonimbus or towering cumulus and no significant weather.

[13]    Load factor or G (force) is conventionally defined as the lift divided by the weight. Pilot control inputs and external factors particularly wind gusts (turbulence) affect the load factor.

[14]    The Samn-Perelli 7-point scale asks people to rate their fatigue right now: 1 = fully alert, wide awake; 2 = very lively, responsive, but not at peak; 3 = okay, somewhat fresh; 4 = a little tired, less than fresh; 5 = moderately tired, let down; 6 = extremely tired, very difficult to concentrate; 7 = completely exhausted, unable to function effectively.

[15]    24-hour internal clock in our brain that regulates cycles of alertness and sleepiness by responding to light changes in our environment.

[16]    Longeron: a longitudinal structural component of an aircraft's fuselage.

[17]    The dynamic loading applied to a person or object in an accident is complex, unknown and varies for different locations throughout the aircraft. For analysis purposes, simplified assumptions are made about the shape of the deceleration pulse over the entire impact (acceleration versus time). Typical assumptions are triangular, trapezoidal, sinusoidal or square.

[18]    A mist is very small liquid droplets in a gas. When the droplets are very small, the droplet surface area to volume ratio is very large. The intensity of the fire is dependent on the surface area of fuel. Therefore, for fine mists, the rate of combustion is very high, and produces a very intense fire.

[19]    Strain: change in length per unit length

[20]    Elastomer: a natural or synthetic polymer with elastic properties.

Occurrence summary

Investigation number AO-2021-052
Occurrence date 04/12/2021
Occurrence time and timezone 1145 Eastern Daylight-saving Time
Location 75 km west-south-west of Moree Airport
State New South Wales
Report release date 10/03/2023
Report status Final
Investigation level Defined
Investigation type Occurrence Investigation
Investigation status Completed
Mode of transport Aviation
Aviation occurrence category Collision with terrain, Loss of control
Occurrence class Accident
Highest injury level Fatal

Aircraft details

Manufacturer Air Tractor Inc
Model AT-400
Registration VH-ACQ
Serial number 400-0285
Aircraft operator Aircair Aviation Operations
Sector Turboprop
Operation type Part 137 Aerial application operations
Activity General aviation / Recreational-Aerial work-Agricultural spreading / spraying
Departure point Moomin property, New South Wales
Destination Moomin property, New South Wales
Injuries Crew – 1 (Fatal)
Damage Destroyed

Runway excursion involving Boeing 777-300ER, A7-BED, Brisbane Airport, Queensland, on 30 November 2021

Discontinuation notice

Report release date: 15/03/2023

Section 21 (2) of the Transport Safety Investigation Act 2003 (TSI Act) empowers the ATSB to discontinue an investigation into a transport safety matter at any time. Section 21 (3) of the TSI Act requires the ATSB to publish a statement setting out the reasons for discontinuing an investigation. The statement is published as a report in accordance with section 25 of the TSI Act, capturing information from the investigation up to the time of discontinuance.

Overview of the investigation

On 30 November 2021, a Boeing 777-300ER aircraft, registration A7-BED, was being operated by Qatar Airways on a scheduled passenger flight from Auckland, New Zealand, to Brisbane, Queensland. During the landing at Brisbane Airport, the aircraft veered off the runway.

The flight crew were conducting an instrument approach to runway 01R at night and the captain was the pilot flying. During the approach, the aircraft encountered heavy rain and turbulence. The crew reported that, at about 300 ft above the runway level and still in rain, they established and maintained clear visual reference to the runway lighting and surrounds, including the runway centreline and edge lights.

The crew stated that, passing about 200 ft, the first officer announced the aircraft was drifting right of the runway centreline. The captain corrected the deviation. As the aircraft was about to touchdown, under the influence of a variable and gusting crosswind, the aircraft drifted right again and the captain was unable to correct the drift before touchdown.

The aircraft landed to the right of the runway centreline and drifting to the right. Shortly after touchdown, the right main landing gear contacted and destroyed 4 runway edge lights positioned on the sealed runway strip, before the aircraft returned towards the runway centreline.

After the landing was completed and the aircraft had exited the runway, aircraft systems alerted the flight crew of low pressure in one on the right main landing gear tyres. The flight crew stopped the aircraft on the taxiway and requested an external inspection of the aircraft. Damage to 4 right main landing gear tyres was observed, and the aircraft was towed to the international terminal. There were no injuries to passengers or crew.

The ATSB received an initial occurrence report on 1 December 2021 and commenced an investigation on the same date.

As part of the investigation, the ATSB interviewed the flight crew and reviewed:

  • data from the aircraft's flight data recorder and quick access recorder
  • weather information
  • recorded air traffic control audio and surveillance data
  • information provided by the aircraft operator, including flight crew rosters and the fatigue risk management system.

The investigation identified the following:

  • runway 01R is 45-m wide with a grooved surface and runway centreline lighting and runway edge lighting, and there were no problems noted with the runway lighting
  • there were no notable faults with aircraft systems
  • there were no notable concerns regarding the flight crew’s decision-making
  • the flight crew likely maintained sight of the runway centreline and edge lights throughout the landing, and were able to detect the aircraft’s drift before touchdown
  • there was a substantial lateral wind gust that changed direction and intensity when the aircraft was below 100 ft above ground level
  • the captain reported feeling between ‘a little tired’ and ‘moderately tired’ after having less than normal sleep quantity and quality in the 2 nights before the flight
  • the captain was probably experiencing a level of fatigue known to adversely influence performance due to limited sleep obtained in the previous 48 hours
  • the flight crew’s flight and duty times and rest periods met the operator’s fatigue risk management requirements for at least the preceding 28 days and they had significant rest opportunity prior to a flight from Brisbane to Auckland on 29 November and the occurrence flight from Auckland to Brisbane on 30 November.

Reasons for the discontinuation

The ATSB strives to use its limited resources for maximum safety benefit, and considers that in this case it was unlikely that further investigation would identify any systemic safety issues or important safety lessons from this specific occurrence.

Consequently, the ATSB has discontinued this investigation. The evidence collected during this investigation remains available to be used in future investigations or safety studies. The ATSB will also monitor for any similar occurrences that may indicate a need to undertake a further safety investigation.

Occurrence summary

Investigation number AO-2021-051
Occurrence date 30/11/2021
Location Brisbane Airport
State Queensland
Report release date 15/03/2023
Report status Discontinued
Investigation level Short
Investigation type Occurrence Investigation
Investigation status Discontinued
Mode of transport Aviation
Aviation occurrence category Runway excursion
Occurrence class Serious Incident
Highest injury level None

Aircraft details

Manufacturer The Boeing Company
Model 777-300ER
Registration A7-BED
Serial number 60330
Aircraft operator Qatar Airways
Sector Jet
Operation type Air Transport High Capacity
Departure point Auckland International Airport, New Zealand
Destination Brisbane Airport, Queensland
Damage Minor