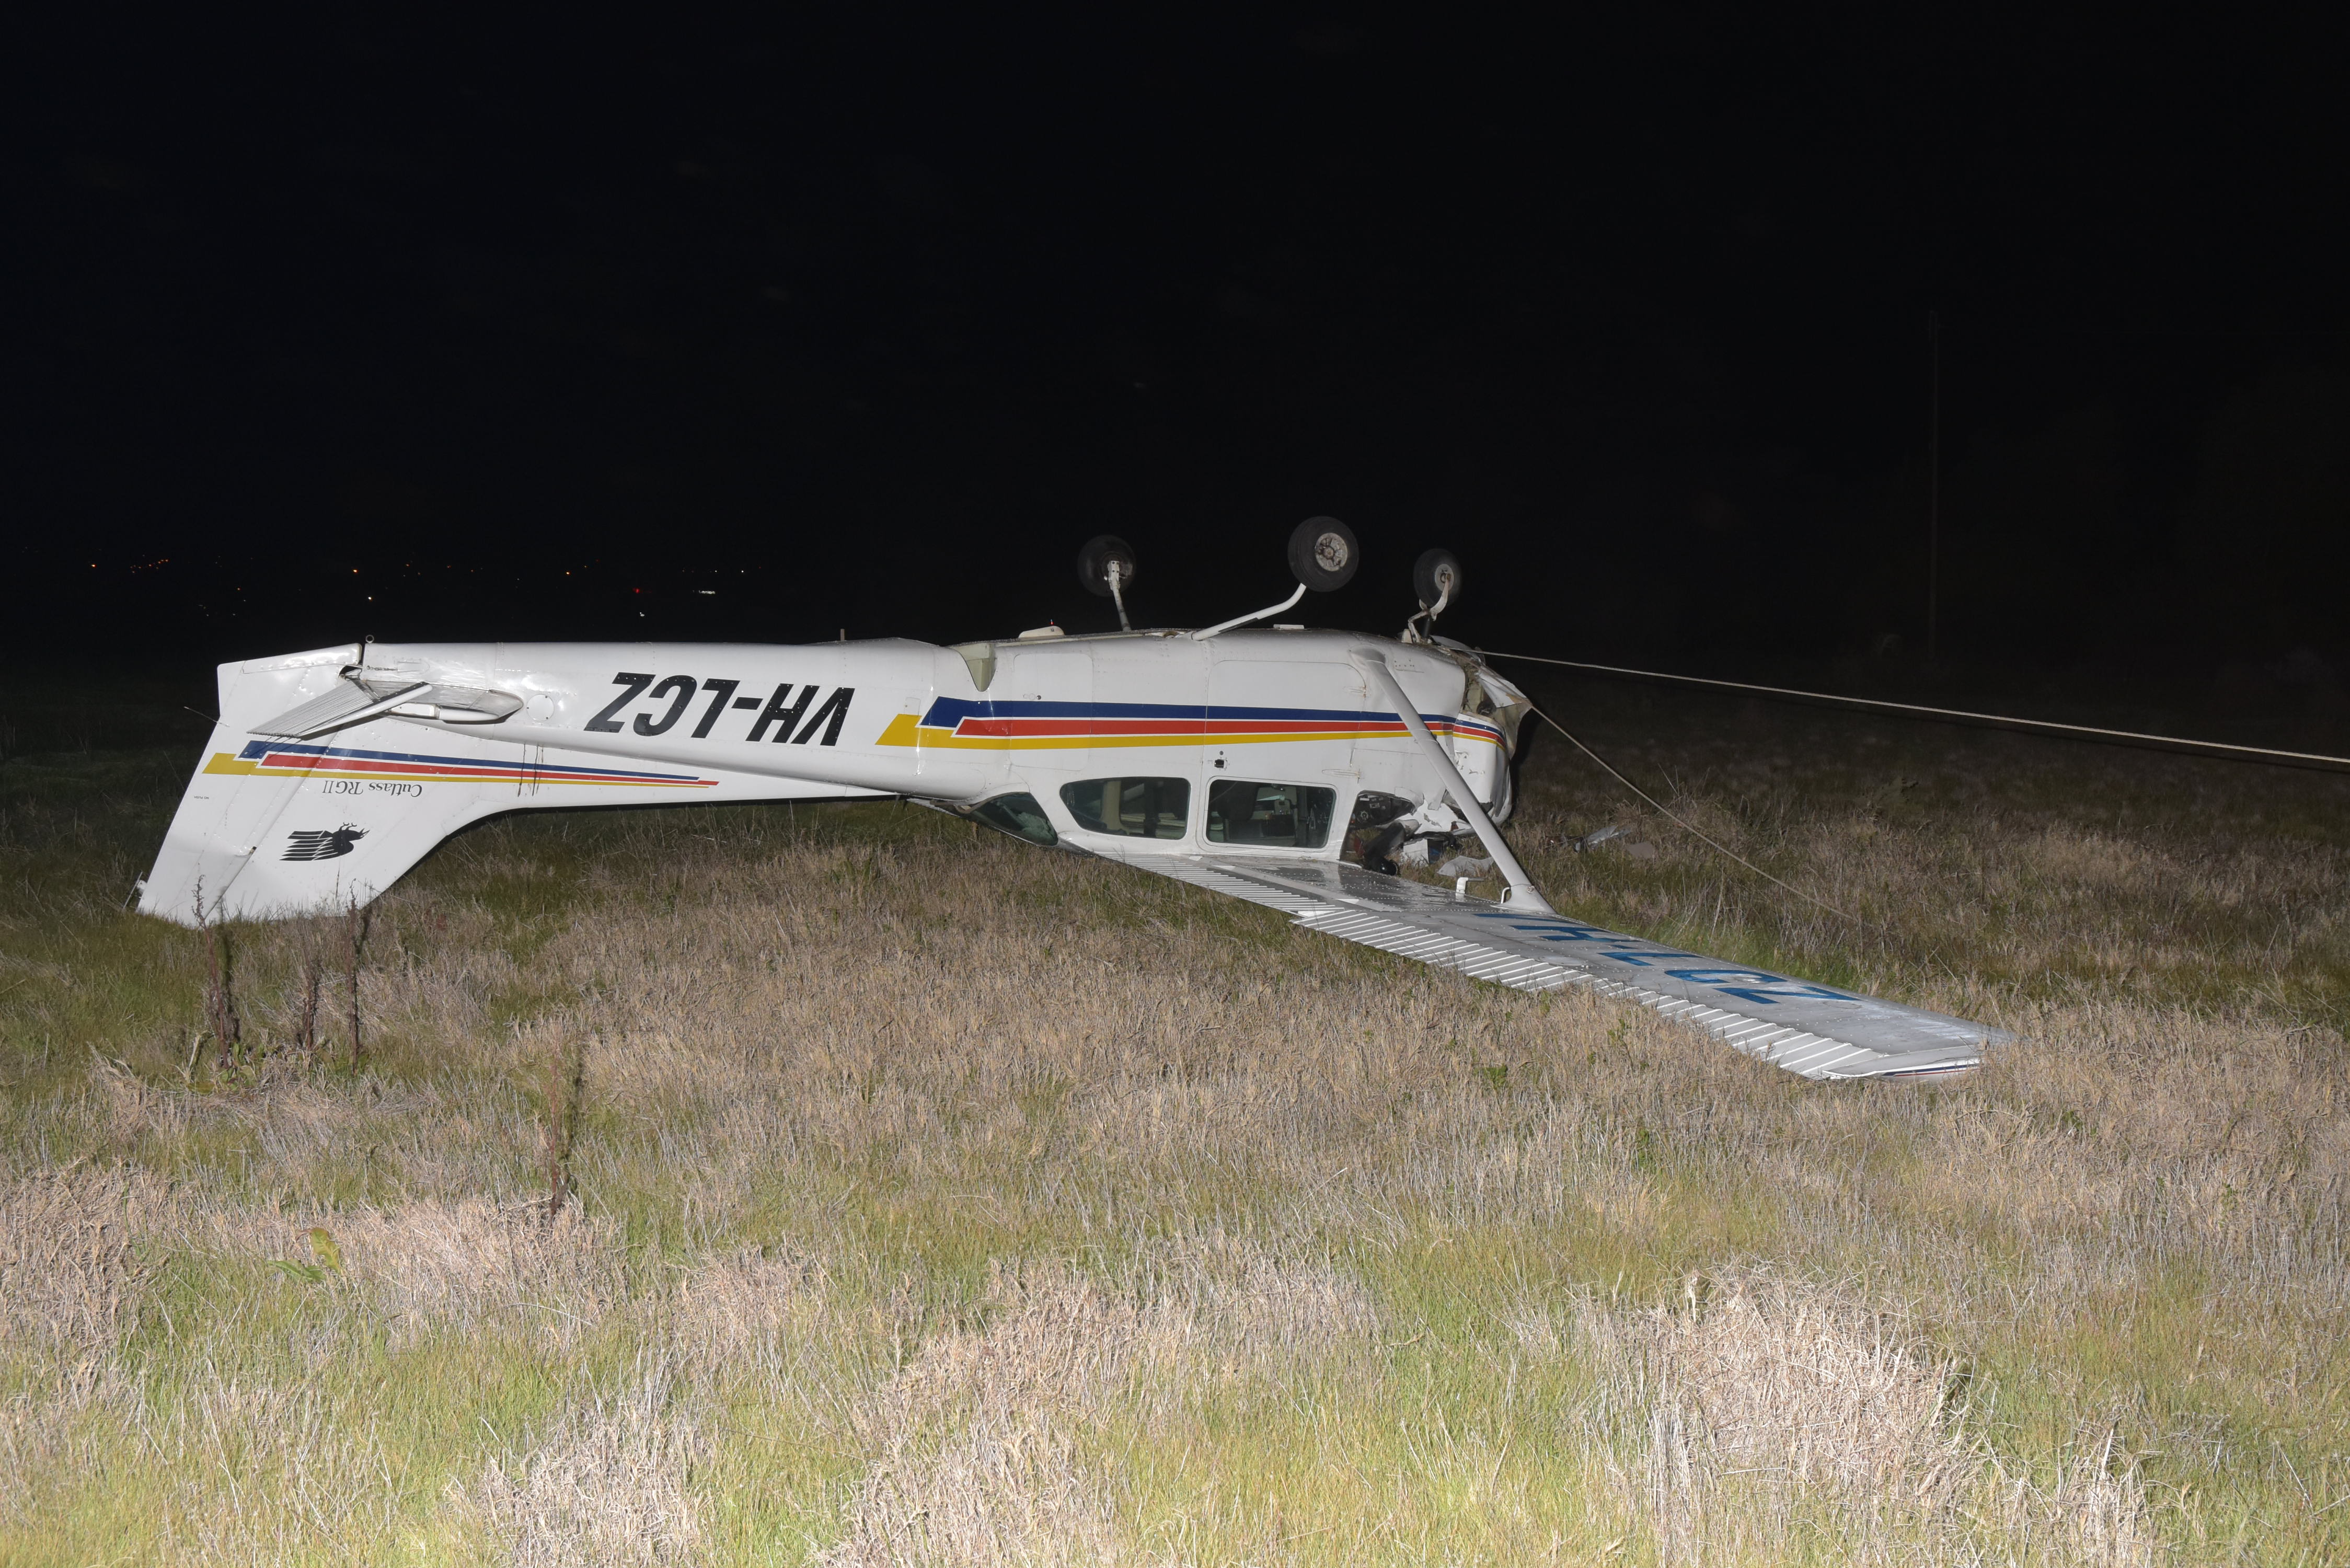
On 18 August 2018, intermodal freight train YC77, operated by Aurizon, was en route from the Acacia Ridge Intermodal Terminal in Brisbane, Queensland. The train was powered by a diesel electric locomotive and one of its wagons contained a stack of three empty flat racks. During transit, the collapsible, rear end wall of the top flat rack extended upwards. This end wall contacted the Elm Street overpass on approach to Cooroy, and pulled down the high voltage overhead line equipment (OHLE). As a consequence, 1.3 km of OHLE was pulled down.
What the ATSB found
The ATSB found that personnel at the Acacia Ridge terminal did not check the collapsible end walls of the flat racks were secured on arrival at the terminal and after the flat racks were loaded onto YC77. In addition, Aurizon, did not have an effective system in place for ensuring personnel required to check the securing of unusual loads (such as empty flat racks) prior to departure had sufficient knowledge of their responsibilities, and had ready access to relevant procedures, guidance and checklists.
On multiple occasions following the dewirement, train crew accessed the exclusion zone associated with the close proximity of the extended end wall of the flat rack to the OHLE, prior to the wires being isolated and earthed on site. Network control centre personnel did not advise train crew of the status of the OHLE during the emergency response period, and Queensland Rail (QR) did not have an effective process in place to ensure that safety-critical actions were co-ordinated and completed when multiple network control officers were involved in responding to an OHLE emergency.
The ATSB also found that following the dewirement the driver and network control officer (NCO) did not follow required protocols for driver only operations (DOO) prior to the driver leaving the locomotive cabin, and Aurizon did not provide drivers with ready access to QR’s procedures for DOO and OHLE emergencies when they were operating on the QR network.
What's been done as a result
Aurizon has updated processes and checklists in relation to flat racks, with further theoretical training undertaken for loading personnel at Acacia Ridge in relation to securing requirements. In addition, Aurizon is currently undertaking a program to increase mobility of access to its safety management system (including relevant procedures and checklists). For driver only operations, Aurizon has commenced drafting a procedure for use on its own network, with a checklist for emergencies affixed to 2800 class locomotives that operate on the North Coast Line, at sign-on locations and attached to train lists.
QR has mandated the use of the network control officer (NCO) checklist for OHLE emergencies, and is currently reviewing related aspects of its emergency response procedures. In addition, QR have provided further training to both NCOs and train crew in relation to identifying objects in close proximity to OHLE and applicable exclusion zones. NCOs have also undertaken DOO emergency procedure refresher training.
Safety message
This occurrence has highlighted the importance of having checklists for rarely conducted tasks and emergency response tasks in the rail environment, and ensuring these checklists are readily available and used by operational personnel. This includes checklists for loading and securing personnel, rail traffic crew and network controllers.
The occurrence
Overview
On 18 August 2018, intermodal freight train YC77, operated by Aurizon, was scheduled to depart from the Acacia Ridge Intermodal Terminal in Brisbane, Queensland to the Portsmith freight terminal near Cairns, Queensland. The train was powered by a diesel electric locomotive and one of its wagons contained a stack of three empty flat racks.[1]
During transit, the collapsible, rear end wall of the top flat rack extended upwards. At about 2102,[2] this end wall contacted the Elm Street overpass on approach to Cooroy, and pulled down the high voltage overhead line equipment (OHLE).
Arrival of flat racks at freight terminal
On 14 August 2018, a freight forwarding company booked four 40 ft empty flat racks to travel by Aurizon train from Acacia Ridge to Portsmith. When booking, the freight forwarding company advised Aurizon by email that the flat racks would travel as a nest of three (stacked on top of each other) and a single. It also advised that the end walls of the nest of three had been chained down.
Sub-contractor truck drivers collected the flat racks from the freight forwarding company and delivered them to Aurizon’s Acacia Ridge terminal in two consignments on 17 August.
When the two trucks arrived at the freight terminal, the Acacia Ridge terminal coordinator instructed the drivers to proceed to the container pad. The terminal coordinator did not visually inspect the loading of the consignments. The truck drivers parked at the container pad, where a heavy forklift driver unloaded the consignments.
A subsequent review of closed-circuit television (CCTV) footage of the delivery of the empty flat racks showed that the nest of three flat racks were not secured by straps or chains.
Loading of flat racks onto train YC77
On 18 August 2018, YC77 was assembled at the Acacia Ridge terminal. In relation to the empty flat racks, loading and inspection activities included:
At about 1100, the Aurizon heavy forklift driver loaded the nest of three flat racks onto a flat wagon and the single flat rack onto a separate flat wagon. Securing was limited to spigots securing each nested flat rack to each other, and securing the bottom flat racks to their respective wagons. The flat rack end walls were not secured.
At about 1530, once train loading was complete, two Aurizon train pinners[3] inspected the loading and securing of freight on all the wagons. A Form 04 (Loading and securing advice) was issued at completion, verifying the loading on the train was safe for travel.
At about 1715, two Aurizon freight operators[4] conducted a train safety test, checking wagon integrity and correct train brake operation. A Form SW57 (Train inspection / repair certificate) was issued at completion, certifying the train as fit for travel.
At 1749, YC77 departed Acacia Ridge yard, during which an Aurizon freight operator conducted a slow speed roll-by examination for train defects.
These activities did not identify any problems with the empty flat racks.
Departure of train YC77
YC77 was planned to travel from Acacia Ridge (12.181 km)[5] to Portsmith (1,677.088 km) on Queensland Rail’s (QR’s) North Coast Line.[6] This involved operating on track that had OHLE from Acacia Ridge to Rockhampton (638.790 km).
There was no indication of any problems or concerns with the operation of the train on its journey between Acacia Ridge and when it passed through Yandina (112.790 km) at 2043. CCTV footage from a sample of stations showed that the rear end wall of the top nested flat rack remained in the down position up until the train passed Yandina, and it moved to being extended upwards at some point prior to reaching Eumundi (122.100 km) at 2049. Figure 1 shows a map of the Brisbane rail network with the departure point and the area of the occurrence highlighted.
Figure 1: Brisbane rail network showing departure point and occurrence location
The image shows stations and their distance from Roma Street Station in Brisbane. Source: Queensland Rail, annotated by the ATSB
Overhead line equipment circuit breaker trips
At 2048, after passing North Arm (117.710 km), a trip of the OHLE circuit breaker occurred, automatically de-energising[7] the electrical section from Woombye (100.690 km) to Traveston (150.310 km). The fault locator indicated to the electric control operator (ECO)[8] at QR’s Brisbane rail management centre (RMC) that the trip had occurred at 119.500 km.[9]
Given that train YC77 was in the estimated area of the circuit breaker trip at that time, the ECO requested the universal traffic control (UTC 7)[10] network control officer (NCO) to confirm the status of the OHLE with the driver. At that time, the northside relief NCO was monitoring and controlling UTC 7 (see Network control). At 2052, the northside relief NCO contacted the driver of YC77, and the driver advised observing nothing unusual. After receiving this information, the ECO reset the OHLE circuit breaker, which held closed. The reset of the circuit breaker re-energised the high voltage OHLE. The ATSB subsequently identified that this first OHLE circuit breaker trip occurred at about 119.613 km, the location of YC77 at the time Figure 2 (see Sequence of circuit breaker trips).
Figure 2: Approximate location of first OHLE circuit breaker trip
Source: Queensland Rail, annotated by the ATSB
At 2052, a track circuit showed ‘occupied’[11] three track sections[12] behind YC77, followed at 2053 by a second trip of the OHLE circuit breaker (Figure 3). The ECO identified that the fault locator did not work on this occasion, which meant the fault could have occurred anywhere on the Woombye to Traveston electrical section. At that time, in addition to YC77, there were two other trains within this electrical section.
Figure 3: Approximate locations of second and third OHLE circuit breaker trips
Source: Queensland Rail, annotated by the ATSB
The ECO contacted the UTC 7 NCO workstation, and the northside relief NCO advised that, although there were intermittent track circuits showing as occupied, there were no trains in those areas. As there were no in-field reports of OHLE abnormalities, the ECO reset the OHLE circuit breaker at 2056, which held closed. The ATSB subsequently identified that this second OHLE trip occurred at about 125.248 km, the location of YC77 at the time.
Over the following 5-minute period, a further two occupied track circuit indications occurred in different track sections behind YC77.
At 2101, a third trip of the OHLE circuit breaker occurred, and a telemetry[13] failure occurred at Sunrise (124.230 km). The fault locator indicated to the ECO that the trip had occurred at 130.170 km, to the south of the Elm Street overbridge (130.750 km). The ATSB subsequently identified that this third OHLE trip occurred at about 129.1209 km,[14] the location of YC77 at the time.
Dewirement near Cooroy
At 2102, train YC77 was entering Cooroy. It passed under the Elm Street overbridge at a speed of about 42 km/h, which was under the maximum permitted speed of 50 km/h. Subsequent inspection found that the extended rear end wall of the top nested flat rack hit the underside of the bridge, and pulled down the high voltage OHLE wires (see Site inspection), resulting in a dewirement.[15]
Examination of CCTV footage showed that, as the train passed through Cooroy, the rear end wall of the top nested flat rack was still in the extended position. In addition, the OHLE, including copper wires, was entangled on the wagon and dragging along the station platform (Figure 4).
Figure 4: CCTV footage at Cooroy station showing the flat racks with the extended end wall and OHLE wires that had been brought down
Source: Queensland Rail
At 2103, the ECO contacted the UTC 7 NCO workstation and advised the UTC 7 NCO, who had returned from a meal break, of the third circuit breaker trip. The ECO noted that YC77 may have had ‘a rope or something’ that was touching the OHLE. The NCO advised the ECO that a track fault had occurred, this time coinciding with the location of YC77. The ECO did not attempt a further reset of the OHLE circuit breaker.
At 2104, the UTC 7 NCO contacted the driver of YC77. The driver advised that, as the train passed through Cooroy station, the OHLE appeared to be ‘really loose’. The UTC 7 NCO acknowledged this report. The NCO also provided the driver clearance to proceed to outside Pomona (139.980 km), and advised the driver that the train may need to be examined, because the issue seemed to be following it.
At 2106, the UTC 7 NCO instructed the driver of YC77 to stop the train ‘straightaway’. The driver stopped the train at 134.493 km, between Cooroy and Pomona. At 2107, the driver contacted the UTC 7 NCO workstation and advised the northside relief NCO, who was now assisting the UTC 7 NCO, of the train’s location.
At 2107, the UTC 7 NCO instructed the driver of a southbound electric passenger train X906 to stop the train immediately. That train was near Woondum and scheduled to pass through the Traveston neutral section into the de-energised section 4 minutes later.
Post-dewirement activities
Where the train stopped, the OHLE was still in place. However, the extended end wall of the top nested flat rack on YC77 was still extended upwards and in close proximity to the OHLE contact wire. Although the OHLE was de-energised, a potential hazard still existed.
After the train stopped, there were a number of communications and activities involving the driver, network control personnel and emergency services personnel to assess and manage the situation. These activities included:
At 2107: The northside relief NCO instructed the driver to walk and check the train, as there were concerns ‘…something might be sticking up from the train [towards the OHLE]…’. The driver confirmed this instruction. The northside relief NCO did not advise the driver of the electrical status of the OHLE.
At 2111: The Queensland Police Service (QPS) contacted the RMC on the emergency phone line, and advised the southside train control leader (TCL) that the OHLE was down at Cooroy station. The QPS also advised that a witness observed ‘… wires on top of the train [YC77] that went through’.
At 2115: The northside relief NCO attempted to contact the driver of YC77 by radio. There was no response as the driver was outside, inspecting the train.
At 2119: The QPS again contacted the RMC by emergency phone, requesting that the OHLE be turned off in the area around Cooroy to help the police manage the scene. The caller noted that police on the scene reported that wires were down across fences and the pedestrian footbridge (north of the Elm Street overbridge). The southside TCL warned that, although the OHLE was de-energised, it was still not yet electrically safe until it was earthed and isolated at the site.
At 2120: The UTC 3 NCO[16] called the driver of YC77’s mobile phone and advised that the police had confirmed the OHLE was down. The driver advised the UTC 3 NCO of the general nature of the problem, after having walked the length of the train. The driver indicated there was a problem with one of the wagons on the train that was extending upwards towards the OHLE (Figure 5).[17] During the conversation, the UTC 3 NCO handed the phone to another network control person to clarify the situation with the driver, who advised it would be easiest to explain the situation by sending some photos. The driver returned to the locomotive cabin soon after.
At 2133: The UTC 3 NCO called the driver’s mobile phone to confirm whether the driver was in a safe place. The driver confirmed being in the locomotive cabin, but advised needing to leave the cabin to email photos of the flat rack to the RMC (due to problems with mobile phone data reception). The driver sent the photos soon after this conversation.
At 2145: The day of operations coordinator (DOOC) instructed staff at the RMC to commence the ‘DOOC & TCL Incident and Emergency Tool’ checklist.
At about 2200: A protection officer associated with a prior planned track closure to the north of the accident site arrived at the locomotive. The driver of YC77 left the locomotive cabin to talk to the protection officer, who then left the driver and inspected the train.
At 2252: The rail operations response unit (RORU) QR commander arrived at Cooroy to take over coordination of the accident. After meeting with the onsite police, the QR commander allowed the police to proceed to the locomotive to perform drug and alcohol testing of the driver. The driver of YC77 left the locomotive cabin in order to be tested.
At about 2307: The QR commander and a RORU officer attended the locomotive. The driver of YC77 left the locomotive cabin to accompany them as they inspected the train.
At 2308: A QR OHLE linesman advised the ECO that the OHLE was intact above YC77.
Early the following morning: A new driver relieved the driver of YC77, who left the locomotive cabin for changeover purposes. The new driver then entered the locomotive cabin of YC77.
At 0300 (6 hours after the dewirement): The nominated person[18] issued a Form C (Permit to Work), confirming the OHLE at Cooroy station and above YC77 had been isolated, tested and earthed.
Figure 5: Flat rack end wall in the extended position in close proximity to the OHLE
Source: Queensland Rail
Consequences of the dewirement
As a result of the dewirement, OHLE was brought down from 130.181 km to 131.447 km (about 1.3 km). High voltage wires, insulators and cantilever arms contacted the ground. Given the level of damage, the occurrence met the definition of an accident, as defined by the Transport Safety Investigation Act 2003.
There were no injuries. Although there were no people on the Cooroy station platform at the time of the dewirement, a southbound passenger train was scheduled to arrive about 30 minutes later.
Repair works were completed at 2215 on 20 August 2018, with the track reopened through Cooroy at 2301, 50 hours after the accident. During this period, all trains through the area were suspended.
The North Coast Line consisted of 1,680 km of railway between Brisbane and Cairns, Queensland. Queensland Rail (QR) owned and managed 1,567 km of the North Coast Line, including the section from Brisbane through North Arm to Pomona (Figure 1).
Constructed in 1891, the section from North Arm to Cooroy (crossing the Blackall Range), was extensively realigned and regraded in 1988, in preparation for electrification. The new alignment increased the distance between North Arm and Cooroy. In addition, the track was lowered underneath several existing overbridges to provide clearance for the high voltage overhead line equipment (OHLE), including under the Elm Street overbridge at Cooroy.
Overhead line equipment (OHLE)
In OHLE-based electrified railways, traction power is supplied to electric locomotives and train units through a train-borne pantograph contacting the OHLE contact wire. The traction power circuit is completed by the current passing from the locomotive through the wheels of the train, into the rail and back to the feeder station and earth. Figure 6 indicates the major OHLE components.
Figure 6: QR mainline electrification OHLE components
Image is of mainline electrification (autotransformer) OHLE components. Of particular note are the high voltage components, considered live at 25 kV, specifically, the catenary wire, contact wire, feeder wire, droppers, cantilevers and register arms.
Source: ATSB
QR’s mainline electrification adopted an autotransformer type system for OHLE supply at 25 kV alternating current (AC).
The OHLE’s lowest point above a train was the contact wire, which was at a nominal height of 4,900 mm above rail level. To allow for temperature-related expansion and contraction, and the effects of wind, the wires were kept tensioned by pulleys and weights placed at about 1.6 km intervals.
For general operations, the loads on trains were required to be a maximum of 3,820 mm above rail level. An authority to travel could be granted for heights up to 3,950 mm in electrified territory. However, QR advised that on the North Coast Line a special exemption for container traffic (including flat racks) allowed loads to reach up to 4,080 mm above rail level.
OHLE contact wire heights
Although the OHLE contact wire was set at a nominal height of 4,900 mm above rail level, this height was increased or decreased for clearance purposes; for example, over level crossings and under overhead bridges. As discussed in Flat rack containers, the height of an undamaged extended end wall on the top flat rack of a nest of three flat racks was about 4,845 mm above rail level, although that height would vary to some extent with the movement of a train.
OHLE contact wire heights were routinely measured by QR using a track recording vehicle, with the last survey conducted in the region of the dewirement on 14 June 2018, 2 months before the dewirement. Between Yandina (112.790 km), where the rear end wall of the top nested flat rack was last observed on closed-circuit television (CCTV) to be collapsed down, and Eumundi (122.100 km), where the rear end wall was first observed to be extended up, the OHLE contact wire height dropped to or below 4,845 mm at a number of locations. These are shown in Table 1 (in white rows).
Table 1: OHLE contact wire low points (in white rows) and location of key events (in blue rows) between Yandina and Cooroy
Kilometer-age
OHLE height (mm)
Location
Comment regarding YC77
112.790
Yandina Station
Station CCTV shows flat rack end wall down
112.952
4,837
Yandina Yard
113.601
4,495
Yandina footbridge
115.355
4,490
Bruce Highway tunnel
115.720
4,839
116.965
4,844
117.104
4,733
North Arm–Yandina Creek Road overbridge
117.682
4,816
North Arm Yard
117.710
North Arm Station
118.060
4,844
North Arm Yard
118.545
4,832
118.782
4,845
119.613
4,844
First circuit breaker trip (2048 hours)
119.637
4,811
121.075
4,841
122.100
Eumundi Station
Station CCTV shows flat rack end wall up
122.581
4,838
124.100
YC77 at about this location when first circuit breaker reset (2052 hours)
124.230
Sunrise Station
125.248
4,853
Second circuit breaker trip (2053 hours)
126.354
4,838
127.400
YC77 at about this location when second circuit breaker reset (2056 hours)
129.1209
4,842
Third circuit breaker trip (2101 hours)
129.1267
4,838
130.136
4,830
130.749
4,349
Elm Street overbridge
Flat rack end wall hits overbridge (2102 hours); dewirement
130.990
Cooroy Station
Station CCTV shows flat rack end wall up:
OHLE wires down
Due to realignment of the line in 1988, the distance between the 129 km and 130 km pegs was 1,656 m. Therefore 129.1209 refers to 1,209 m beyond the 129 km peg and 447 m prior to the 130 km peg. Similarly, 129.1267 refers to 1,267 m beyond the 129 km peg and 389 m prior to the 130 km peg.
As indicated in Table 1, the contact wire at the Elm Street overbridge was 4,349 mm above rail level. This was the lowest contact wire height between Yandina and Cooroy. The Elm Street overbridge itself was 4,816 mm above rail level.
Sequence of circuit breaker trips
The ATSB examined the available evidence to determine the most likely locations of the train when the three circuit breaker trips occurred. Relevant details, summarised in Table 1, included the following:
The first OHLE circuit breaker trip occurred at 2048, and it registered on the ECO’s fault locator at 119.500 km. The closest contact wire low point was at 119.637 km. After considering the data logger data, the most likely location of the wagon of nested flat racks on YC77 when the circuit breaker tripped was determined to be 119.613 km, just prior to the 119.637 km low point. As the OHLE height dropped to 4,844 mm above rail level at that location, it would have allowed direct contact with the extended end wall of the top nested flat rack, resulting in the tripped OHLE circuit breaker de-energising the electrical section.
The last contact wire low point prior to 119.637 km low point was at about 118.782 km (4,845 mm). Therefore, it is very likely that the unsecured end wall of the top nested flat rack raised somewhere between 118.782 km and 119.613 km.
Although further OHLE contact with the extended rear end wall of the top nested flat rack would have occurred at about the 121.075 km low point and 122.581 km low point, these contacts did not result in circuit breaker trips as the electrical section was still de-energised. ATSB analysis determined that when the ECO reset the tripped circuit breaker at 2052, re-energising the OHLE, YC77 was at about 124.100 km.
The second OHLE circuit breaker trip occurred at 2053; however, the ECO’s fault locator could not determine the location of the trip on this occasion. ATSB analysis determined that the wagon of nested flat racks was near 125.200 km at this time. There were no areas of OHLE contact wire at or below 4,845 mm at this location. However, the OHLE contact wire did lower to 4,853 mm at 125.248 km, reducing the air gap between the extended end wall of the top nested flat rack and the OHLE contact wire to 8 mm. It is almost certain that either the OHLE arced across this air gap,[19] or the end wall contacted the OHLE, resulting in the tripped OHLE circuit breaker de-energising the electrical section.
Although a further OHLE contact with the extended end wall of the top nested flat rack would have occurred at about 126.354 km (4,838 mm low point), this contact did not result in a circuit breaker trip as the electrical section was still de-energised. Analysis determined that when the ECO reset the tripped circuit breaker at 2056, re-energising the OHLE, YC77 was at about 127.400 km.
The third and final circuit breaker trip occurred at 2101, and it registered on the ECO’s fault locator at 130.170 km. The closest contact wire low points were at 130.136 km and 129.1267 km (389 m prior to the 130 km peg). After considering the data logger data, the most likely location of the wagon of nested flat racks on YC77 when the circuit breaker tripped was determined to be 129.1209 km, [20] just prior to the 129.1267 km low point. As the OHLE height dropped to 4,842 mm above rail level at that location, it would have allowed direct contact with the extended end wall of the top nested flat rack, resulting in the tripped OHLE circuit breaker de-energising the electrical section.
Train and train crew information
Train information
Aurizon train YC77 consisted of one 2800 class diesel electric locomotive hauling 32 container wagons. It was 659 m long, and had a total mass of 1,465 t. Although travelling on an electrified network, the locomotive did not use the OHLE to gain tractive power.[21]
The train was fitted with a data logger, and information from the data logger has been included in the report where relevant.
Flat rack containers
Flat racks were a type of shipping container, designed for oversized loads that could not fit within the normal profile of an enclosed side / top container. The end walls (if fitted) could be extended up or collapsed down. The advantage of collapsible end walls was their ability to be stacked flat on top of each other (or nested) when empty, allowing for efficient transportation. Flat racks were available in 20 ft or 40 ft lengths.
Flat racks with collapsible end walls were fitted with leaf spring or coil assistance for ease of raising. Once extended, two locking pins could be manually engaged to secure each end wall in the raised position. When collapsed, two twist locks (one on each side) could be manually engaged to secure each end wall in the down position (Figure 7). In addition, four spigots secured each flat rack to a flat rack below when nested, or to a flatbed rail wagon for transportation.
Figure 7: Twist lock mechanism for flat rack end wall
Source: ATSB
When travelling empty, Aurizon’s document SAF/STD/022/SWK/BUS (Loading and securing of freight manual) required flat racks to have all four twist locks engaged. It also required an additional chain or two web straps over each end wall of the top nested flat rack. This ensured that the leaf spring / coil raise assist end walls could not extend upwards during transit.
The flat racks on YC77 were Domino Seadeck 40 ft long type, similar to those shown in Figure 8. The collapsible end walls had leaf spring assist. A warning decal on the flat racks instructed the use of twist locks when a flat rack was travelling empty.
Figure 8: Flat rack containers
Image shows a flat rack with extended end walls (foreground) and flat racks with end walls collapsed (background) to enable stacking (nesting). Location of supplied securing methods when end walls were extended (locking pins) and collapsed (twist locks) are also shown.
Source: Mission & Relief Logistics, annotated by the ATSB
The height of a nest of three flat racks with the end walls collapsed, loaded on a flat wagon, was about 2,895 mm above rail level. The height of an undamaged extended end wall on the top flat rack of a nest of three flat racks was about 4,845 mm above rail level.
Train crew information
Train YC77 was crewed by a single train driver (see Driver only operations information). The driver had 7 years driving experience. This included commencing as a trainee driver with Australian Railroad Group[22] at Cloncurry (Queensland), then conducting train driving duties at Geraldton (Western Australia) and Rockhampton (Queensland), prior to being based at Acacia Ridge from January 2017.
Train performance and environmental conditions
A review of the train’s data logger determined that the driver of YC77 followed sound train handling principles, including complying with maximum speed limits, between Yandina and the location of the dewirement. Between Yandina and shortly before 119.613 km, the location where the first circuit breaker trip occurred (see Sequence of circuit breaker trips), the speed of YC77 was held consistently between 75 and 80 km/h.
A review of Bureau of Meteorology data determined that maximum wind speeds at the time of the occurrence were under 10 km/h.
Site inspection
Onsite inspection by the ATSB on 19 August 2018 found scrape marks on the underside of the Elm Street overbridge. A broken OHLE contact wire found near the bridge had blue paint marks, identical to the colour of the top nested flat rack. Colourbond fencing on the southern side of the Elm Street overbridge was also damaged.
An inspection of the train where it had stopped (134.493 km) found damage limited to that of the extended rear end wall of the top nested flat rack. The end wall had minor damage and had been bent backwards, consistent with contact damage with the Elm Street overbridge. The height of the damaged extended end wall was 4,740 mm above rail level, slightly less than its expected undamaged height of 4,845 mm.
Analysis determined that the distance between the damaged extended end wall of the top flat rack and the OHLE contact wire at the location where the train stopped was about 210 mm (Figure 9).
No web straps or chains secured the end walls of the top flat rack on the nest of three flat racks or the end walls of the single flat rack. In addition, neither of the top two flat racks on the nest of three had their twist locks engaged. A significant amount of rust was present on the twist lock mechanisms, indicating they had not been engaged for a significant period of time. The spigots securing the bottom flat rack to the wagon, and each flat rack to the one below, were in place.
Figure 9: Nest of three flat racks on train YC77, showing the damaged extended rear end wall
Image shows the extended end wall of the top nested flat rack, loaded on wagon BAZY 47520. The distance between the end wall and the OHLE contact wire is about 210 mm.
Source: ATSB
Although the OHLE above the train was intact, some wires from the OHLE that had been pulled down were entangled in parts of the train, as shown in Figure 10.
Figure 10: Part of train YC77 showing OHLE wires in contact with the train
Source: ATSB
Train loading and securing information
Loading and securing process
The Acacia Ridge Intermodal Terminal was located in the southern suburbs of Brisbane, and was owned and operated by Aurizon (Figure 11). The terminal handled the transhipment of road freight to rail transport and vice versa.
Figure 11: Acacia Ridge Intermodal Terminal
Image shows the location of the checkpoint (freight processing office), container pad, rail pad and marshalling yard at Acacia Ridge Intermodal Terminal. Source: Google Earth, annotated by the ATSB
After arriving at the security gatehouse, incoming road freight proceeded to the freight processing office and the delivering truck driver presented relevant paperwork to the terminal coordinator. If it was deemed an unusual load,[23] the terminal coordinator was required to check the load to ensure it was correctly secured for rail travel. If secured correctly, the terminal coordinator directed the trucks to the rail pad for train loading, or to the container pad for short-term storage. If loading was found to be incorrectly secured, the terminal coordinator would not be accept the load until the issue had been fixed by the delivering truck driver.
A heavy forklift driver unloaded loads from trucks and either stored them as required on the container pad, or placed them directly onto wagons at the rail pad. After loads had been placed on the wagons, pinners ensured the loads were correctly secured. Freight operators shunted the wagons from the rail pad to the marshalling yard, where the train was finalised for departure.
Loading and securing procedures
Aurizon had several documents that contained procedures associated with the loading and securing of loads. A comprehensive and detailed 242-page document 07-STD-022-SWK (Loading and securing of freight manual), and supporting checklists, were provided to assist staff. The manual provided guidance on how to secure a wide range of loads.
The procedure for securing empty flat racks was included in the loading and securing manual, within a number of other instructional dot points. As noted in the manual, the procedure required that each collapsed end wall on the top flat rack of a nest of flat racks was to be secured by either one chain or two web straps, and the two fitted twist locks. The maximum height above rail level for nested flat racks loaded on a flat wagon was not to exceed 3,165 mm.
In addition to the loading and securing manual, checklist 14-FRM-017-INT (Loading & securing checklist – Flat-racks) provided guidance on the securing of nested empty flat racks. This guidance was consistent with the content of the manual.
Other documents outlined the roles and responsibilities for personnel involved in ensuring loads were appropriately secured. More specifically:
Work instruction 14-WI-011-INT (Loading & securing – Inspection of incoming loads at terminals) provided instructions on inspecting unusual incoming loads. It stated that the terminal coordinator was to inspect any load that was not a 20 ft or 40 ft container to ensure the loading met the requirements of the loading and securing manual, using the relevant checklist.
Work instruction 07-WI-013-ACR (Train pinning: Work method statement) provided instructions for the pinners. The stated purpose was ‘when rail wagons have been loaded, the containers have to be secured and pinned up’. The stated process included walking around both sides of the train and pinning all manual spigots and checking for any non-conformances. The list of potential non-conformances included ‘unsecured loads’. However, the instruction did not provide guidance on how this was to be identified. There was no reference to the loading and securing manual or related checklists for unusual loads.
The loading and securing manual and associated checklists were stored on Aurizon’s intranet system ‘iN-Gauge’. Hard copies were not readily available.
If an incoming load was deemed unusual, the terminal coordinator would inspect the loading and securing arrangements as per the loading and securing manual and the relevant checklist, after accessing iN-Gauge. Computer access to iN-Gauge was available in the freight processing office.
On encountering an unusual load while pinning a train, pinners were required to return to the office, access iN-Gauge, find and print the relevant checklist, and recommence the loading and securing inspection.
All interviewed personnel advised that flat racks were rarely encountered at the Acacia Ridge terminal.
Loading and securing training
Aurizon provided training and assessment for loading and securing of flat racks to personnel with these responsibilities. This training included an on-line course, which contained extensive and complex loading and securing instructions for a variety of different types of loads.
Personnel were also required to sign an acknowledgement sheet that they had received a particular instruction (such as 14-WI-011-INT for inspection of incoming loads or 07‑WI-013-ACR for train pinning) and received a training session on the instruction, which included a small number of competency assessment questions.
Neither the on-line, nor the work instruction training, contained practical instruction or assessment.
Loading and securing personnel
The personnel involved in the loading and preparation of train YC77 included the following:
The terminal coordinator on duty when the flat racks were delivered had 7 months’ experience in the role and was previously employed as a heavy forklift driver. Although reporting that it was a busy evening when the flat racks were delivered, the terminal coordinator felt alert at the time of the flat rack delivery.
The heavy forklift driver who unloaded the truck on the night of delivery, and loaded YC77 the following morning, had two 2 years’ experience in the role, as well as previously working as a heavy forklift driver with another rolling stock operator. The forklift driver also performed pinner duties on a rotational basis.
Two pinners inspected YC77 prior to handover to the freight operators. Pinner no. 1 was a temporary contractor with the heavy lift section. The 6-month contract period ended shortly after the accident. Pinner no. 2 had 5 years’ experience as a heavy forklift driver and had also acted in the terminal coordinator position.
Table 2 summaries Aurizon’s records of the training received by each of these personnel for the loading and securing of freight. Although most of the personnel had conducted the detailed, online course, there was no record to indicate that pinner no. 1 had completed this training.
Table 2: Loading and securing of freight training records (date completed)
On-line course
14-WI-011-INT
07-WI-013-ACR
Terminal coordinator
12 July 2017
No evidence
9 November 2017
Heavy forklift driver
1 June 2017
16 April 2018
16 June 2017
Pinner no. 1
No evidence
No evidence
No evidence
Pinner no. 2
15 March 2018
No evidence
9 November 2017
Aurizon was unable to provide evidence that the terminal coordinator, pinner no. 1, or pinner no. 2 (who had previously acted as a terminal coordinator) had received work instruction training for 14‑WI-011-INT. In addition, Aurizon was unable to provide evidence that pinner no. 1 had received work instruction training for 07-WI-013-ACR.
During interview, the terminal coordinator, pinner no. 2 and heavy forklift driver agreed that the terminal coordinator was responsible for checking flat rack securing on arrival at the Acacia Ridge terminal. However, the terminal coordinator and pinner no. 2 said they understood this was limited to Aurizon loading only, not that received from external customers.
In terms of checking loads after they were lifted onto the wagons, pinner no. 2 and the heavy forklift driver said they understood that checks during pinning were limited to ensuring the provided securing was tight. Pinner no. 2 added that they assumed securing was not required if it was absent. Both pinner no. 2 and the heavy forklift driver advised that they were not aware of guidance material for checking unusual loads.
Form 04 (Loading and securing advice), which was issued on completion of train pinning, advised that further loading and securing checks were to be performed. Aurizon’s manual SAF-SPC-SWK-0048 (Testing of trains) advised these checks were to be conducted during a train safety test. In addition, form FDB819A (Loading and securing non-compliance report) was to be completed in instances of unsecured loads identified during a train safety test, shunting or roll-by examination. Freight operators performed all of these duties. However, Aurizon advised that freight operators were not qualified to perform loading and securing checks, nor were they required to do so.
Previous occurrences
Aurizon and its predecessor companies had previously reported two notifiable occurrences that involved load irregularities involving flat racks.
In January 2012, the collapsible end wall of a flat rack on Interail (QRNational) train 5MB7 collided at speed with a timber overpass north of Wauchope, New South Wales. The collapsible end walls were not secured with twist locks and chains or web straps. QRNational recommended that further training tools and information guides be developed for the transport of flat rack containers.
In April 2018, a 10,000 L polyethylene water tank fell from Aurizon train YU55 at Kinkuna (south of Bundaberg, Queensland). The loss was not identified until the train had travelled a further 211 km to Mount Miller (north of Gladstone, Queensland). Three remaining water tanks on the flat rack were also insufficiently secured. This incident related to flat rack loading and not the securing of end walls. However, the investigation report by Aurizon included the following findings:
• non defined process to ensure every flat rack checked by [the terminal coordinator] prior to unloading off [incoming road] vehicle
• lack of awareness / ownership of chain of responsibility by driver / loader / [terminal coordinator]
• insufficient practical load restraint training and awareness for Aurizon staff.
Aurizon recommended delivery of further training, both theory and practical, in relation to ‘sufficient load restraint for out of scope loads’. Delivery was to occur by 31 May 2018. There was no evidence that this training occurred prior to the dewirement at Cooroy on 18 August 2018.
Rail management centre information
General
Queensland Rail’s (QR’s) rail management centre (RMC) was located on the northside of Brisbane. The RMC housed the QR Citytrain network control centre for controlling and monitoring trains, and the electric control room for controlling and monitoring OHLE supply. Both were required to interface with each other to ensure safe operation of the QR Citytrain network.
Network control
QR’s Citytrain network control operated from Tamaree[24] to the north, Varsity Lakes and Acacia Ridge to the south, and Rosewood to the west. It was divided into nine universal traffic control (UTC)[25] areas for train control and monitoring purposes, with a tenth used during busy periods. The UTC 7 workstation managed the North Coast Line[26] between Glasshouse Mountains and Tamaree, which included Cooroy. The neighbouring UTC workstation, UTC 3, managed the North Coast Line from Sunshine to Beerburrum, and the Redcliffe Peninsula Line (Figure 12).
Figure 12: North Coast Line QR Citytrain universal traffic control boundaries
Image shows the location of the UTC 3 and UTC 7 boundary, between Beerburrum and Glasshouse Mountains. Source: TRANSLink, annotated by the ATSB
Network control officers (NCOs) operated the UTC workstations. The NCOs were supervised and assisted by two train control leaders (TCLs). The TCLs were senior, experienced NCOs, each of which was allocated supervision of either the northside or southside NCOs. Two experienced, relief NCOs provided additional support to the NCOs, for example, during breaks. Relief NCOs were, like the TCLs, allocated to either the northside or southside. The day of operations coordinator (DOOC) was a senior, experienced NCO, who provided overall supervision of the network control centre, including of the NCOs and TCLs (Figure 13).
Communication between train control and train crews was normally by radio. TCLs monitored and answered the QR staff, emergency services and members of the public emergency telephone.
Figure 13: Network control centre showing the train control leader and relevant network controller positions
The image is taken from the approximate boundary between northside and southside halves of the network control centre. The southside NCOs and TCL are located to the left of the image (out of frame).
Source: ATSB
Overhead line equipment control
An electric control room situated at the RMC was used for monitoring and controlling the QR high voltage OHLE systems. An electric control operator (ECO) monitored and controlled the OHLE via a supervisory control and data acquisition system (SCADA).[27] An electronic event log provided information to the ECO of electric traction system alarms, issues and associated actions. The ECO workstation was also fitted with a UTC mimic panel. This panel enabled the ECO to monitor the real-time location of train movements within the electrified areas of the QR network (Figure 14).
Figure 14: Electric control operator workstation
Source: ATSB
The electric control room was segregated from the network control centre and NCOs, with communications between these areas undertaken by telephone. The ECO was able to monitor NCO radio conversations with train crew, but was not able to communicate directly to train crews. Therefore, if an ECO needed to communicate with a train crew, they were required to telephone the NCO, who would then pass on the message.
RMC personnel
In terms of the personnel on duty at the time of the accident:
The NCO allocated to UTC 7 workstation qualified as an NCO on the northside UTC workstations just over 18 months prior to the dewirement.
The northside relief NCO qualified as an NCO assistant 13 years previously, and qualified as an NCO in 2009
The southside TCL had 36 years’ experience in the RMC, and was qualified as a TCL for both northside and southside UTC workstations.
The northside TCL commenced as an assistant NCO in the Brisbane freight network control centre 21 years previously, later transferring to the RMC and becoming a TCL about 3 years prior to the dewirement.
The DOOC, who commenced his shift at the time of the dewirement, had previously been an NCO and a TCL, and had been acting in the DOOC role for about 2 years.
The ECO initially qualified as a high voltage OHLE substation electrician, and then qualified as an ECO about 3 years prior to the dewirement.
The UTC 7 NCO, northside relief NCO, ECO and DOOC all stated that they felt alert at the time of the dewirement and emergency response. Although they stated that their workload was high during the emergency response, they felt it was manageable.
Emergency procedures
As a prescribed electricity entity, QR was required to have a discrete safety management system (SMS) for managing electrical safety risks.[28] QR standard MD-13-73 (Electrical safety management plan (ESMP) for declared electrical entity works) complied with this legislative requirement. A further ten supporting documents comprising of standards, instructions, procedures, plans and checklists were provided to guide personnel during OHLE emergencies.[29] These guidance materials included responsibilities and actions for the ECO, NCO, DOOC, train driver (including when appointed as onsite coordinator), nominated person and QR commander.
Electric control room procedures during OHLE emergencies
The QR procedure MD-11-4403 (Electric control room) provided guidance to ECOs about how to respond to OHLE circuit breaker trips. Outside a ‘high risk area’,[30] (including between Eumundi and Cooroy), the ECO could reset a tripped OHLE circuit breaker after 1 minute, after reviewing all available information. Provided the reset OHLE circuit breaker remained closed, no further action was required. However, train crews were to be requested to remain vigilant for OHLE abnormalities.
A ‘persistent’ fault was defined as one which resulted in an immediate circuit breaker trip after the circuit breaker was reclosed. The procedure stated that persistent faults:
… may involve dewirement or objects hanging from the OHLE. Re-energisation of traction OHLE under these conditions may expose people in the vicinity of the fault to the risk of contact with live OHLE and serious injury or electrocution…
Accordingly, the procedure stated that in this circumstance the circuit breaker was not to be reclosed. The procedure also stated:
Should the ECO receive indications of persistent traction faults with non-electric trains on section, the ECO shall immediately arrange for blockage to all traffic to be applied to the affected area.
In addition to a dewirement or objects hanging from the OHLE, the procedure stated that another potential source of persistent faults was over-dimensional loads.
Although the circumstances which occurred on 18 August 2018 did not strictly meet the definition of a persistent fault, they did involve recurring faults close together. The ECO effectively followed the same procedure.
In instances of non-life threatening emergencies, the ECO was to:
de-energise the OHLE between the two adjacent neutral sections[31]
arrange a block to all trains [by the NCO] to the affected section
warn onsite personnel [through the NCO] to maintain a 3 m exclusion zone of the OHLE and anything in contact with it
arrange OHLE staff to attend.
During the events on 18 August 2018, the neutral sections were located at Woombye and Traveston, requiring de-energisation of 50 km of OHLE. The ECO de-energised the section and arranged for a block to all trains. However, based on the available evidence, the ECO did not ensure the NCO had communicated the dangers of the OHLE to the driver of YC77.
In terms of identifying the location and reasons for circuit breaker trips, MD-11-4403 noted that the fault locator function was not always accurate. In addition, the ECO advised that unidentified causes for OHLE circuit breaker trips on the North Coast Line were common. The area north of Caboolture (50.390 km) was predominantly bushland, with OHLE circuit breaker trips commonly attributed to wildlife and tree branches.
Network control centre procedures during OHLE emergencies
During a confirmed high voltage OHLE emergency, QR procedure MD-11-33 (High voltage (HV) electric traction infrastructure emergency module EP1-04) was to be followed. The procedure outlined some general safety rules, including:
Electric traction exposed lines and equipment (and any objects in contact with exposed equipment) shall be treated as live and dangerous…
Maintain minimum 3 metre exclusion zone from all electric traction exposed lines and equipment (and any objects in contact with exposed equipment) and keep others away. Situational hazards may require a much greater exclusion zone...
Do not approach unless advised safe to do so by the relevant Network Control Centre.
The procedure outlined required actions for a wide range of personnel, including NCOs and ECOs. It stated:
Even when the Electric Control Operator (ECO) has informed the Network Control Officer (NCO) that the overhead line equipment (OHLE) has been de-energised, it is still NOT electrically safe until the Queensland Rail Nominated Person (NP) has isolated, tested de-energised and earthed the HV [high voltage] Electric Traction Infrastructure and issued a Form C or a Form D Permit to Work.
In addition to communicating dangers and safety requirements of the OHLE to onsite personnel, the NCO was to place track blocks[32] on the affected sections of track.
Hard copies of the emergency procedures were readily available at NCO workstations. In addition, QR provided NCOs with a supporting checklist, MD-17-482 (NCO incident and emergency response tool), for quick reference during an emergency. This checklist was introduced in 2017 and included three sections: immediate actions, communication and emergency response. Items specific to OHLE electrical safety were highlighted in red in each section. These highlighted sections included:
immediate actions: confirm OHLE status
communication: reinforce current OHLE status to train crew and emergency services, with status updates as required
emergency response: advise on OHLE status (de-energised, isolated, earthed, tested) (see Electrical safety).
Under the last item, the checklist stated:
Ensure Emergency Services are aware that the OHLE can only be considered safe when this [de-energised, isolated, earthed and tested] has been completed.
QR advised the ATSB that this checklist was a guide only, and was ‘not required to be completed by the network controllers during the course of an incident’. One TCL indicated it was better to use experience than a checklist, and the other thought that checklists assisted in ensuring tasks were completed. Several NCOs stated that no checklist for the NCOs existed, with one stating they would be helpful for those new to the role. The UTC 7 NCO did not complete a checklist during the 18 August 2018 emergency response.
In terms of the procedures and guidance for other personnel:
There was no specific procedures or guidance for NCOs allocated to neighbouring UTC workstations to that dealing with an OHLE emergency, and no specific procedures or guidance for the relief NCOs.
TCLs were not provided with specific procedures or guidance to assist in process coordination during times of an emergency. A mandatory checklist, MD-17-486 (OHLE incident – DOOC and TCL incident and emergency tool), for both the TCL and DOOC existed; however, the main focus of this checklist was effective stakeholder engagement and the organisation of alternate passenger transport. One entry related to ensuring emergency services were aware of OHLE dangers, and another related to arranging assistance for the NCO dealing with the emergency. Neither of these two action items were marked as completed during the 18 August 2018 emergency response, although the southside TCL did warn the QPS communications centre of the OHLE dangers onsite at Cooroy (see Post-dewirement activities).
Procedural guidance for the DOOC during an OHLE emergency was limited to stakeholder communications, declaring an emergency, activating a QR commander to manage the accident site, and providing general assistance.
In terms of responsibilities during an emergency response, the DOOC advised that the TCLs provided supervision and handled operational incidents, with the DOOC’s role limited to communication with stakeholders. One of the TCLs noted ‘… everyone knows what goes on [during an incident]’, with the DOOC providing oversight. The other TCL believed the DOOC was responsible for coordination and decisions. Several personnel noted that NCOs commonly divided tasks among themselves when handling an incident.
During interview, most of the network control personnel felt that the emergency response on 18 August 2018 was well managed, with good teamwork and utilisation of previous experiences.
The UTC 7 NCO recalled being in charge of handling activities associated with train YC77, with the only assistance being from the southside TCL (although UTC 7 was under the northside TCL’s supervision). Audio recordings of communications indicated that the UTC 7 NCO had limited communications with the driver of YC77 after the dewirement, and was occupied with other train control duties during the emergency response period, including managing other trains and answering phones. The UTC 7 NCO was unaware the driver was instructed to inspect the train by another NCO.
The southside TCL recalled having minimal involvement during the emergency response, limited to answering the emergency phone, and thought the northside TCL likely assisted the UTC 7 NCO.
The northside TCL, in charge of supervising the UTC 7 NCO, felt that the NCO ‘probably’ managed the accident train. After a review of all available evidence, the ATSB could not determine what involvement the northside TCL had during the emergency response.
Procedures for onsite personnel
MD-11-33 also outlined procedures for other personnel, such as the train crew. The procedures relating to rail traffic crew (RTC) included:
Stay on the radio to NCO and await instructions…
Advise passenger/RTCs to remain on the train until further notice if it is safe to do so
Do not leave the train until the NCO confirms it is safe to do so…
MD-11-30 (Rail emergency response module EP1-01) outlined additional procedures. It stated that, in the initial stages, the NCO would appoint an onsite coordinator to take control of the scene. After declaration of an emergency by either the DOOC or business operations shift supervisor, a QR commander could be activated to attend onsite and take over coordination of the scene from the onsite coordinator.
The QR commander’s duties included:
onsite point of contact
conducting site assessment for hazards
(as an authorised person) receiving Form C from the nominated person
communicating the limits of electrical safety to onsite teams.
During the emergency response on 18 August 2018, the driver of YC77 was initially appointed the onsite coordinator, with the QR commander taking over after arriving at the site at 2252. The QR commander then contacted the ECO, who confirmed that the OHLE was de-energised from Traveston to Woombye but was not yet isolated. The ECO further advised that OHLE personnel were yet to determine what earthing requirements were required in the vicinity of the train itself.
Shortly afterwards, the QR commander met with the QPS who were required to conduct alcohol and drug testing of the driver of YC77.[33] Although the QPS were empowered to enter exclusion zones in the event of an emergency (to direct evacuations and exclude persons from premises),[34] this did not apply to conducting post-accident drug and alcohol testing. The QR commander allowed the QPS to attend the locomotive of YC77, requiring the driver to leave the locomotive cabin.
Previous occurrence involving an emergency response
On 31 January 2013, a Queensland Rail (QR) passenger train (T842) failed to stop at the Cleveland station platform (due to problems with braking system effectiveness) and collided with the end-of-line buffer stop, the platform and the station building at a speed of about 31 km/h. There were 19 people on board the train (including the driver and a guard); three people were on the platform and five were in the station building. During the collision sequence, the train contacted an OHLE mast resulting in a dewirement, with wires brought down onto the train and platform.
It was identified that during the emergency response the guard (after communicating with network control) had assisted two passengers to evacuate the train before the OHLE was made electrically safe. In its investigation report,[35] the ATSB made the following finding:
During the period immediately following the collision there were a series of communication issues which resulted in incomplete information being provided to key personnel. This resulted in the train control operator and train guard miscommunicating the status of the downed overhead power lines, leading to the guard permitting some passengers to exit the train before emergency services had ensured it was safe to do so.
At the time of the 2013 accident, QR had not provided NCOs with a checklist for responding to an emergency such as an OHLE dewirement. The ATSB report provided discussion about the relevance of checklists and the handling of the emergency response by the network control centre, including:
With no quick reference decision aids or checklists to refer to, train control personnel were required to interpret ambiguous and incomplete information about a complex situation, based solely on voice communications from a remote location...
The use of standardised procedures for emergencies enables personnel to use rule-based decisions to react quickly and effectively to contain a situation. It permits the considered design of procedures by experts to be efficiently implemented by operators, and has the potential to mitigate the effects of inexperience and misunderstanding of an event. However, the effectiveness of these procedures is influenced by familiarity with, and accessibility of the procedures. In this case, the train control personnel had no quick reference guides or checklists to assist in diagnosing the situation (to then determine which module would apply), nor was the document organised in a way that facilitated ease of identification of required actions and their sequencing…
The investigation established that some train control personnel referred to the Derailment procedure, whilst another followed the Overhead Line Equipment Emergency procedure. Other staff did not make use of the specification [relating to OHLE emergencies], but instead relied on memory and experience to guide their actions. In some instances, this resulted in a lack of clarity as to allocation and priority of responsibilities and tasks, as well as some ineffective communications…
The train control operator continued to provide control services to the other lines under his control … there was no initiation of processes to reallocate [his] extraneous tasks in order to enable him to focus on the emergency response to this event, nor was there any consideration for this to occur documented within the emergency procedures.
The effective management of an emergency situation from a location remote to the event presents a number of challenges for the train control staff, primarily related to ensuring that timely and accurate information is available, communicated, and understood, and that the response is handled in an efficient and coordinated manner. To that end, it is critical that standard procedures are in place, but it is equally critical that those procedures are designed to accommodate human performance limitations in conditions of high stress and/or workload, and that they are well understood through staff training and well-practised through field based and desk-top exercises.
On 31 January 2003, a passenger train derailed at Waterfall, New South Wales. The special commission of inquiry[36] provided a detailed discussion about emergency response activities. The commission report stated:
The rail industry needs to develop checklists for its staff to follow in the event of a particular kind of incident, such as a derailment. For example, the train driver should have a simple checklist identifying the information which he should immediately communicate to the RMC [rail management centre]…
Other railway personnel need to have checklists identifying clearly and precisely what they are required to do in the case of an emergency and the order in which things are to be done…
Such checklists should be provided as part of the ICS [incident command system]… They should be on a sheet in the driver’s cabin, guard’s compartment or signaller’s or train controller’s work station.
Accordingly, the commission recommended that the RailCorp [the rolling stock operator and rail infrastructure manager] emergency response plan should include action checklists for each relevant employee.
Overhead line equipment safety information
Description
The autotransformer system used by QR consisted of a feeder wire that was energised at 25 kV AC (-25 kV), but at opposite phase;[37] that is, 180⁰ to the contact wire (+25 kV). Although supply to trains remained at 25 kV AC, this system introduced an additional nominal phase-to-phase[38] voltage of approximately 50 kV AC. This was in addition to the 25 kV AC phase to neutral[39] in comparison to ground; that is, the return rails (0 kV). An additional earth wire electrically connected adjacent OHLE structures, to ensure safe return to ground in the event of a failed earth bond on a single structure.
The advantage of the autotransformer system was the ability to energise further distances due to the higher 50 kV AC feed, halving the number of high cost feeder stations.
Electrical safety
The Queensland Electrical Safety Regulation 2013 stipulated exclusion zones that applied to untrained persons in relation to high voltage overhead uninsulated electric lines. In instances where the phase-to-phase voltage was approximately 50 kV, as for the OHLE in the Cooroy precinct:
the exclusion zone between an untrained person and the overhead line was 3,000 mm
the exclusion zone between a vehicle operated by an untrained person and the overhead line was 2,100 mm.
The regulation stated that a person ‘comes within an unsafe distance of an overhead electric line if the person is within the exclusion zone’. An untrained person was a person who was not technically proficient or experienced with the OHLE. Train drivers and emergency services personnel would generally be classified as untrained persons.
In instances where exclusion zones were not reasonably practical to achieve, the regulation allowed an organisation to reduce the distance after a risk assessment and control measures had been implemented. For the purposes of a vehicle operated by untrained persons, QR advised the ATSB that its nominated exclusion zone was 300 mm, accounting for arc distance and a safety margin.
In other words, if the rolling stock or anything being carried by the rolling stock was within 300 mm of the OHLE, then it was within an unsafe distance. Accordingly, an exclusion zone then applied to the rolling stock, such that an untrained person could not approach within 3,000 mm of the rolling stock. A person who was still on the rolling stock from before it entered the exclusion zone was still in effect in a safe place. However, if they attempted to leave the rolling stock, they would be entering an exclusion zone. Appendix A – Dangers associated with high voltage overhead line equipment (OHLE) in dewirements provides further details of the hazard associated with OHLE following dewirements, including touch potentials (a person touching the ground and the rolling stock) and a step potential (a person being in close proximity to the rolling stock with both feet on the ground).
In the case of the 18 August 2018 dewirement, as the rear end wall of the top nested flat rack extended into the 300 mm exclusion zone associated with the rolling stock, the end wall and train YC77 were subject to an exclusion zone for untrained persons of 3,000 mm.
As noted in Network control centre procedures during OHLE emergencies, QR procedure MD‑11‑33 prohibited entry to exclusion zones until the high voltage OHLE was electrically safe, by being de-energised, isolated, tested and earthed. More specifically:
De-energised: the opening of high voltage circuit breakers, either automatically by excess current or manually by the ECO, to disconnect electrical energy. This did not guarantee the electrical energy had been discharged from the OHLE.
Isolated: the opening and, lock and tag out of isolation switches, to disconnect all possible sources of electrical energy to the section of OHLE, including by unintentional energisation. This was performed by the nominated person in the field.
Tested: confirmed the isolated section of OHLE had been de-energised. This was performed by the nominated person in the field.
Earthed: the isolated section of OHLE was connected to the general mass of the earth, to ensure discharge of any residual energy. This ensured the OHLE could not be made live from external sources, for example, other live wiring. This was performed by the nominated person in the field.
Once earthing was confirmed, the nominated person could issue a Form C (Permit to work) to an authorised person. It was at this point that the section of high voltage OHLE nominated on the Form C was considered electrically safe, allowing entry to the exclusion zone.
In the case of the 18 August 2018 dewirement, the OHLE was de-energised at 2101, just prior to the dewirement. The nominated person issued the first Form C at 0300 the morning after the dewirement. The QR commander delegated the receipt of Form C from the nominated person to the accompanying rail operations response unit (RORU) officer, who was also qualified as an authorised person.
Instruction and training of OHLE dangers for QR personnel
QR provided general guidance regarding the hazards associated with OHLE in various procedures and other documents. In addition to MD-11-33, this included the MD-14-36 (General appendix) and MD-10-191 (Electric traction systems) manuals. The general instructions section of the general appendix stated:
All employees and contractors shall constantly bear in mind the ever present danger of electrocution from the high voltage overhead line equipment in electrified areas. It is dangerous for anyone to touch, or to come into close proximity of, live overhead line equipment.
Similarly it is dangerous to allow any object to touch or to come close to live equipment.
Note: Always treat overhead line equipment as live until it has been ascertained that the equipment has been made safe for persons to approach or to come into contact with it.
Although the documents used by network control personnel and other operational personnel provided guidance regarding the 3,000 mm (or 3 m) exclusion zone between a person and OHLE, none of the documents provided clear guidance on the additional aspect of the 300 mm exclusion zone between a vehicle and OHLE.
NCOs completed OHLE safety training, including TLIF2080 (Safely access the rail corridor), when initially appointed to their position. This unit of competency was reassessed as part of periodic NCO competency reassessments. TLIF2080 training included dangers associated with objects in close proximity to OHLE, but did not provide an indication of a safe gap distance between rolling stock or objects on rolling stock and the OHLE. NCO duties did not include in-field operations.
QR commanders completed authorised person training, which allowed them to receive a Form C when OHLE was made electrically safe. Authorised person training included dangers associated with objects in close proximity to OHLE, but did not provide an indication of a safe gap distance between rolling stock or objects on rolling stock and the OHLE.
Instruction and training of OHLE dangers for train crew
Aurizon advised that the driver of YC77 completed OHLE safety training in January 2014, as part of the nationally-recognised unit of competency TLIF2080C (Safely access the rail corridor), while based in Geraldton, Western Australia. There was no OHLE fitted in Geraldton. Although the training included dangers associated with objects in close proximity to OHLE, it did not provide an indication of a safe gap distance between rolling stock or objects on rolling stock and the OHLE.
A review of the driver’s last reassessment of competence found a single question in relation to OHLE safety during a dewirement emergency. In addition, the driver operated diesel locomotives only, which did not rely on OHLE for traction purposes. The driver reported never having been in a dewirement occurrence before.
Although Aurizon drivers did not work for QR, they were required to follow QR procedures while operating a train on the QR network. The driver of YC77 was aware QR documents were available on Aurizon’s iN-Gauge intranet service, but was not sure which document contained the OHLE emergency procedures. There was no computer access available on board YC77. Therefore, the driver did not have access to enable referral to the procedure at the time of the emergency response.
Recognition of OHLE danger presented by extended flat rack end wall
During interviews after the dewirement, it was apparent that almost all network control centre personnel handling the emergency response, the QR commander and the driver of YC77 did not recognise the hazard associated with the extended end wall of the flat rack being close to the OHLE. The general belief was that OHLE dangers were limited to the site of the actual dewirement at Cooroy, about 3 km behind where YC77 stopped. As the OHLE was still erect above YC77, most personnel on the evening of the accident felt it was in a safe state.
Driver only operations information
General
Driver only operations (DOO) was a train crewing configuration where a single driver operated the train without the presence or assistance of any other on-board personnel.
On the QR network, Aurizon operated DOO services between Acacia Ridge and Townsville on the North Coast Line (1,353 km), Fisherman Islands and Ebenezer on the West Moreton system (79 km), and Stuart and Mount Isa / Phosphate Hill on the Great Northern Railway (1,032 km). Further, on its own network, Aurizon advised it operated DOO services between the nearest depot and ports on the Moura, Blackwater, Goonyella and Newlands coal systems.
The Queensland Work Health and Safety Regulation 2011, and an accompanying Code of Practice,[40] required that the movements of remote or isolated workers[41] be monitored, including ensuring adequate communication methods were maintained.[42] Train drivers in a DOO configuration would generally be classified as remote or isolated workers. The purpose of these requirements was to ensure timely assistance in the event of an emergency or incapacitation.
QR emergency procedures for driver only operations
The North Coast Line was subject to open access by third party operators. A formal access agreement and interface risk management plan (IRMP) arranged access by Aurizon on QR’s network. The IRMP detailed interface risks and resultant controls between QR as the rail infrastructure manager[43] and Aurizon as the rolling stock operator.[44] QR provided Aurizon access via a customer portal to all relevant sections of QR’s SMS, in connection with the risk controls nominated in the IRMP. Aurizon arranged access to QR documents for its personnel via its own intranet system ‘iN-Gauge’.
According to the QR IRMP, risks to drivers trackside when in a DOO configuration were to be managed in accordance with the DOO emergency procedure within QR’s MD-14-36 (General appendix). The procedure stated that when a train had been stopped due to an accident, obstruction or exceptional circumstances, drivers would secure their train from uncontrolled movement, and complete form MD-15-457 (Authority for driver only rail traffic driver to leave locomotive) with the NCO prior to leaving the locomotive cabin to investigate the nature of the problem. The procedure also stated:
Instructions must not be given to the rail traffic driver to take any action that could affect his/her personal safety or the safety of the train.
QR introduced form MD-15-457 in November 2015 (replacing an earlier form, no. 22513). The form required the driver and NCO to describe the details of the train, the location and the situation and agreed reporting times (to ensure effective communication was maintained with the driver at all times they were outside the locomotive cabin). A maximum reporting interval of 15 minutes was nominated by the DOO procedure. In the event of a loss of communication, the NCO was to assume an emergency existed and immediately arrange assistance (for example, from emergency services).
Aurizon emergency procedures for driver only operations
Aurizon’s procedures stated that, in the event of an emergency, drivers were to refer to emergency checklist 16-FRM-012-COM (Duty card train crew) for immediate actions, including when vacating a locomotive cabin. There was no reference to the DOO procedure or requirements on the duty card.
Aurizon drivers carried an on-the-spot risk assessment tool called Stop! Take time and switch on. This tool was used to identify hazards and control risks, prior to performing an unusual or non-routine task, for example, vacating a locomotive cabin at an unusual location. Aurizon advised that, although this tool had a supporting instruction, this instruction was withdrawn following the 18 August 2018 dewirement.
Although form MD-15-457 contained a ‘situation report’ section, neither it, nor QR’s DOO emergency procedure, required an on-the-spot assessment of hazards and control of risks prior to the locomotive cabin being vacated.
Access to relevant procedures and forms
In order to be able to complete form MD-15-457, hard copies needed to be provided in the locomotive cabin. No forms were stored on train YC77.
Access to Aurizon’s duty card, QR’s DOO procedure and form MD-15-457 were limited to Aurizon’s iN-Gauge intranet service. There was no computer access available on board YC77. Therefore, the driver did not have access to these documents at the time of the emergency response, or any time while undertaking driving duties.
The driver reported not having seen form MD-15-457 before, instead referencing the older form (no. 22513), which was withdrawn almost 3 years previously. The driver was aware QR documents were available on Aurizon’s iN-Gauge intranet service, but was not sure which document contained the DOO procedure.
Application and knowledge of DOO emergency procedures
Based on a review of recorded voice communications, neither the driver of YC77 nor multiple NCOs followed QR’s DOO procedure during the emergency response. The driver of YC77 left the locomotive cabin on five occasions during the emergency response (two in the absence of any other personnel), without completing form MD-15-457. The NCO was not advised on all occasions, no agreed report back times were agreed and, a mobile phone was used as the method of communication.
During interview, it was found that knowledge of the DOO procedure was well known among network control centre personnel. Some personnel noted that it was difficult to identify if a train was operating in a DOO configuration. However, based on a review of recorded voice communications, there was no evidence that the driver of YC77 or the NCOs discussed the type of crewing arrangement during the emergency response.
Although the DOO procedure was included in initial NCO training, it was not contained within the NCO periodic reassessment of competency. Of the network control centre staff interviewed, one had seen a DOO form, and another two advised not having issued such a form for more than 10 years.
The driver reported being aware of the QR DOO procedure, but could not recall being trained in its use. Periodic driver reassessments of competence did not contain the DOO procedure. The driver further advised of not having been in a situation requiring its use in almost 5 years.
Driver only operations on the Aurizon network
During investigation, the ATSB found that both Aurizon and third party operators operated DOO services extensively on the Aurizon owned network in Queensland. As a rail infrastructure manager, Aurizon was required to provide third party operators with access to relevant sections of its SMS documents, which controlled risks while operating on its network. Although referenced within the Aurizon risk assessments, the ATSB found that no DOO procedure existed for the Aurizon owned portion of the North Coast Line.
In November 2015, when QR made changes to the DOO form in use on its network, Aurizon issued an advice notice to staff advising of QR form no. 22513 being replaced by QR form MD-15-457. In addition, Aurizon (with the withdrawal of form no. 22513), elected to adopt an existing form (SW12, which was used for a variety of purposes), to be used when operating DOO on its own network. This advisory notice was withdrawn from circulation on 19 February 2016.
Despite changing to a different DOO form on the Aurizon network, Aurizon advised that no documents within its SMS were altered to reflect this change.
To ensure correct implementation of the altered DOO procedural form requirements on both the QR and Aurizon networks, Aurizon recommended follow-up inspections and auditing of the process. Aurizon could not provide evidence this had occurred.
Aurizon freight train YC77 departed Acacia Ridge Intermodal Terminal with one of its wagons containing a stacked nest of three empty flat racks. During its journey, the rear collapsible end wall of the top flat rack extended upwards (reaching a height of about 4,845 mm). The top of this end wall impacted the underside of the Elm Street overbridge (a height of 4,816 mm), just prior to Cooroy Station, and pulled down overhead line equipment (OHLE). The dewirement resulted in a significant amount of damage to 1.3 km of OHLE, and the consequences could have been much worse had passengers been on the Cooroy Station platform at the time of the accident.
Analysis of closed-circuit television (CCTV) footage, OHLE circuit breaker trips and related information determined that the rear end wall very likely raised upwards at some point between 118.782 km and 119.613 km, and then remained in the extended position until hitting the Elm Street overbridge (130.750 km).
YC77’s data logger indicated that the train’s speed was consistently between 75 and 80 km/h for an extended period immediately prior to the rear end wall of the flat rack extending upwards. It is therefore likely that running at this speed for an extended period eventually resulted in the unsecured rear end wall raising from passing wind resistance, assisted by the flat rack’s leaf spring raise-assist design. There was no evidence that the driver’s actions on approach to Cooroy Station, problems with the serviceability of the train or excessive wind conditions contributed to the accident.
This analysis focuses on the loading and securing of the flat racks on YC77 and reasons why the load was not effectively secured. In addition, it considers the control of hazards at the accident site following the dewirement and aspects associated with driver only operations (DOO) procedures.
Loading and securing of freight
Delivery of flat racks to Aurizon
The freight forwarding company advised the rolling stock operator 4 days prior to the accident that a set of four flat racks were to be delivered for rail transport and that the end walls of the nest of three flat racks were secured by use of chains.
Based on CCTV evidence, the ATSB identified that neither of the end walls on the top flat rack on the nest of three were strapped or chained when delivered, as required for rail travel. The ATSB’s inspection after the dewirement found no evidence that chain or straps had been in place at either end of the flat rack to provide an additional means of restraint. In addition, the ATSB identified that the twist locks to lock the end walls of the top two flat racks in the down position were not engaged, and given the condition of the twist locks it is unlikely they had been locked for some time. It also seems very unlikely that the twist locks could have moved during transit, or that anyone would have unlocked them prior to transit.
In summary, the nested set of three flat racks were delivered to the Acacia Ridge terminal without the collapsible end walls of the top nested flat rack being secured for rail travel. The ATSB did not examine the reasons why the flat racks were delivered in an unsecured state, instead focussing on the controls the rolling stock operator had in place to ensure the security of loads on its train.
Inspection of flat racks during delivery and loading
According to Aurizon’s procedures, securing of the end walls of any flat racks travelling as freight were to be checked twice prior to the departure of a train. The terminal coordinator was required to check the flat racks when they were first delivered, and the pinners were required to check the security of any loads (including flat racks) after they had been loaded onto a wagon.
In this case however, the terminal coordinator did not check the securing of the flat racks on arrival at the terminal and, consequently, the flat racks were loaded onto YC77 in an unsecured state. The terminal coordinator (and another person who sometimes acted in the role) advised they were not aware of the requirement to inspect loading from external freight forwarding companies.
Similarly, the pinners did not check for the absence of chains or web strapping during the securing inspection, and consequently the flat racks departed Acacia Ridge in an unsecured state. Personnel who performed this task stated they believed checks during pinning were limited to ensuring any provided securing was tight, rather than checking what securing was absent (such as straps or chains). However, the investigation could not determine the exact reasons why the twist locks on the top two nested flat racks were not identified as disengaged during the securing inspection. The twist locks on the top flat rack would have been almost 3 m above the ground, but the position of the handles (which indicated whether the twist locks were engaged) should still have been visible from the ground.
Unusual load responsibilities and access to guidance material
The terminal coordinator and pinners’ limited understanding with regard to their responsibilities for checking unusual loads highlighted issues relating to training and continued competency assessments in the roles.
Aurizon was unable to provide evidence that the terminal coordinator or another person who had performed that role had received training in the instructions for the terminal coordinator role. Although one of the pinners and the heavy forklift driver had received training in the work instruction for pinning, that work instruction provided limited detail regarding what type of checks of unsecured loads were required and it did not refer to the relevant checklists.
These personnel had received the on-line loading and securing of freight training course, which provided extensive complex instruction on securing of unusual loads. However, it was conducted up to 14 months previously for some personnel. All interviewed personnel advised that flat racks were rarely encountered at the Acacia Ridge terminal. As any such instructions were rarely used, it was likely their accurate recall was diminished by the time they were required to be used.
Issues with knowledge of flat rack securing requirements had been identified after two previous accidents involving inadequate securing of unusual loads. Although Aurizon had recommended that staff undertake further theory and practical training, this training had not occurred prior to the 14 August 2018 dewirement.
In addition to the effectiveness of the training, the ATSB also identified problems related to access to relevant guidance material. Given the low frequency that each type of unusual load was encountered, ready access to checklists or other guidance material would help ensure familiarisation with the relevant procedures at the relevant time. Although Aurizon provided access to manuals, instructions and checklists through its intranet site ‘iN-Gauge’, this was problematic for several reasons:
The Loading and securing of freight manual (07-STD-022-SWK) contained 242 pages, with instructions to secure empty flat racks appearing on one page within a number of other instructional dot points. This limited the ability to source relevant information quickly and easily.
Although checklists for unusual loads were available on-line, and referenced in the work instruction for inspecting incoming loads, Aurizon stated they were not readily available in hard copy. As such, each time a pinner encountered an unusual load, and wanted to refer to guidance material, they would have been required to return to the office, find and print a checklist and recommence a train inspection. This was unlikely to occur.
As already noted, the work instruction for train pinning did not refer to the available checklists for checking unusual loads. In addition, personnel who performed that role reported they were not aware any guidance documentation existed.
Therefore, based on the available evidence, the ATSB found that Aurizon did not have an effective system in place for ensuring personnel required to check the securing of unusual loads (such as empty flat racks) prior to departure had sufficient knowledge of their responsibilities, and had ready access to relevant procedures, guidance and checklists. Had these problems been addressed, it is likely that the checking of unusual loads would have been more effective.
Electric control information anomalies
YC77 departed Acacia Ridge at 1749, and the first indication of a problem to the rail management centre occurred at 2048 when the first OHLE circuit breaker trip occurred. The dewirement did not occur for another 14 minutes. Accordingly, the ATSB considered the potential opportunity for the problem with YC77’s load to have been detected during this period prior to the dewirement.
In non-high risk areas such as Yandina to Cooroy, the electric control operator (ECO) could reset OHLE circuit breaker trips after 1 minute, after reviewing all available information. Provided the reset OHLE circuit breaker remained closed, no further action was required. During the event sequence, the ECO reset two separate occurrences of OHLE circuit breaker trips. The third occurrence, 13 minutes after the first, was not reset. Although these three OHLE circuit breaker trips occurred on the same electrical section, the information presented to the ECO to assist decision making was conflicting and ambiguous. More specifically:
The driver of YC77 reported observing nothing unusual after the first OHLE circuit breaker trip.
The fault locator (which may be inaccurate) did not operate for the second OHLE circuit breaker trip. Therefore, the location of this trip was unknown, encompassing a 50 km section of track on which three trains were operating.
During each of the first two OHLE circuit breaker trips the circuit breaker reset held closed, suggesting there was not a persistent fault (which would have provided a more obvious indication of an over-dimensional load).
Until the dewirement, multiple track circuit occupied indications (which are occasionally associated with OHLE traction faults) were either not near the location of YC77, or they did not coincide with OHLE circuit breaker trips.
OHLE circuit breaker trips on the North Coast Line were not uncommon and were often attributed to wildlife and tree branches touching the OHLE.
With consideration of the available information during the sequence of events leading up to the dewirement, the ECO followed the correct procedure, with no firm indication until after the third OHLE circuit breaker trip that YC77 was the probable reason for the observed indications.
Post-dewirement response
Entries into an exclusion zone
High voltage electricity is a significant hazard, and a primary risk control to ensure safety prior to the equipment being made electrically safe is the implementation of exclusion zones. In relation to QR’s OHLE, the following exclusion zones applied for untrained persons (such as train crew):
3 m between an untrained person and the overhead line
3 m between an untrained person and the train and objects on the train if an object was within 300 mm of the overhead line.
Exclusion zones applied at two locations following the dewirement at Cooroy. The first was in the Cooroy Yard precinct, in the area of the actual dewirement. The second was near where YC77 stopped. As the end wall of the top nested flat rack extended within 300 mm of the OHLE, the train was subject to an exclusion zone of 3 m.
In this case, the actual risk around the train was relatively low as the OHLE had been de-energised. However, the OHLE had not been made electrically safe, and there was the potential for the OHLE to be inadvertently re-energised by the ECO, dewired OHLE contacting external supply authority lines, or an electric train entering into the de-energised electrical section from an adjacent live section. In the case of the latter, an electric passenger train was scheduled to enter the de-energised electrical section 9 minutes after the dewirement.
If the OHLE had been re-energised, the likelihood of arcing over a 210 mm air gap was also relatively low. However, initially no-one knew the exact nature of the problem. It is acknowledged that in circumstances of an OHLE circuit breaker trip of an unknown cause, with no immediate indication of a problem, it is impractical to not allow an external inspection of the OHLE by train crew prior to the OHLE being made electrically safe (assuming the train crew first conduct an inspection from their cab prior to leaving the train). However, in this instance there had been sufficient evidence to indicate either a dewirement or, at the very least, some part of YC77 had been intermittently contacting the OHLE. The distance from that object to the contact wire after the train stopped, or the extent to which the train had pulled down wire close to where it had stopped, was unknown.
Therefore, even though the actual level of risk (determined after the emergency response) was relatively low, during the emergency response the risk level was unclear and the situation should have been treated as if there was a genuine level of risk. Accordingly, no-one should have approached the train (or exited the train) until the applicable exclusion zone could be determined or until the OHLE at that location had been made electrically safe (that is, de-energised, isolated, tested and earthed). The extent of the damage was not determined until an OHLE linesman inspected the area about 2 hours after the dewirement. The process to make the OHLE electrically safe around the train was not completed until 6 hours after the dewirement occurred.
Initially the driver entered the exclusion zone by exiting the locomotive to conduct an inspection of the train, under instruction from a network controller officer (NCO) and before the police had advised that wires had been pulled down. After the driver sighted the extended end wall, the exact distance of the gap between the end wall and the contact wire was still unknown. When inspected from the ground at night, it would have been difficult to estimate the gap accurately. The prudent course of action at that stage would have been to assume the end wall was within 300 mm of the OHLE, and therefore an exclusion zone of 3 m applied around the train.
The ATSB determined that the driver of YC77 and other train crew then entered this exclusion zone on multiple other occasions before the OHLE was made electrically safe. More specifically:
the driver proceeded to a location to improve mobile phone data reception and send photos to the rail management centre
the driver met with a protection officer, associated with an unrelated track closure
the driver undertook post-accident drug and alcohol testing with the Queensland Police Service
the driver accompanied the QR commander and other personnel while they inspected the train
the driver changed with a relief driver.
The ATSB could not determine if the police, QR commander or other personnel also entered the exclusion zone associated with YC77 while interacting with the driver.
Recognition of the risk associated with dewired OHLE
During an OHLE emergency, the NCO was required to advise the OHLE status to train crew and onsite personnel. A report to the network control centre confirming there had been a dewirement at Cooroy and possible OHLE contact with YC77 was received 9 minutes after the dewirement occurred. That information was not passed to the train driver for a further 9 minutes, after an NCO had already instructed the driver to leave the locomotive and inspect the train and OHLE for damage. At no stage during the emergency response was the driver advised that, although the OHLE was de-energised, it was still not electrically safe.
These omissions of key actions appeared to be associated with limited recognition that a potential problem existed at the train, and problems with the coordination of actions between multiple network control personnel.
In terms of the limited recognition of the potential risk, the general belief of interviewed personnel was that OHLE dangers were limited to the site of the actual dewirement at Cooroy, about 3 km behind YC77. The fact that there was known to be significant damage to the OHLE at Cooroy may have focussed their attention on that area. There was limited expectation that a problem could also exist where the train was located, even though it was recognised that the train may have had an object that had been contacting the OHLE.
Although training for the driver of YC77, NCOs and QR commander included dangers associated with objects in close proximity to OHLE, due to the danger of arcing, it did not provide an indication of the appropriate safe gap distance in this situation (that is, 300 mm). This limitation in the training materials may have reduced their ability to recognise the danger posed. Nevertheless, a conservative approach should have determined the gap was problematic, even if the safe gap distance was unknown.
Co-ordination of network control activities post dewirement
In terms of the coordination of actions during the post-dewirement response, there was no single assigned person who was in charge of coordinating activities and managing the ongoing issues as they related to the dewired high voltage OHLE. Although it is not unusual for tasks to be conducted by multiple personnel in an emergency, in this instance the allocation of tasks appeared to rely on an informal division of tasks, teamwork and previous experience.
This resulted in a situation where the UTC 7 NCO, who was responsible for managing YC77, was conducting a number of tasks involving other trains. Meanwhile, at least two other NCOs communicated with and provided instructions to the driver of YC77, including an instruction to inspect the train, without the knowledge of the UTC 7 NCO.
One means of ensuring an effective response is having very clearly defined roles, responsibilities and required actions for different personnel. A review of procedural documentation found that allocation of safety critical tasks during OHLE emergencies was not clear, particularly in relation to the roles of NCOs on neighbouring workstations, relief NCOs and the train control leaders (TCLs). It is recognised that emergencies can take many forms and procedures need to have some flexibility regarding the specific roles of each position in any specific emergency. Nevertheless, ensuring that one person is coordinating all the required actions and ensuring they are completed is essential.
Another means of ensuring an effective response is the use of checklists. Although a mandatory checklist for OHLE emergencies applied for the day of operations coordinator (DOOC) and TCL, this was of limited safety value, as it dealt more with stakeholder management aspects. QR had recently developed a second checklist that summarised NCO responsibilities during an OHLE emergency, which was underpinned by a number of standards, procedures and instructions. It included three entries related to advising electrical safety status to onsite personnel. This checklist was not used or referred to by the UTC 7 NCO or other personnel, and QR advised that its use was optional.
Emergency responses can involve high workload, distractions and interruptions, time pressure, ambiguous sets of information and stress. There can be many different tasks and objectives to achieve, and many people involved in gathering information and conducting the required actions. Such environments provide an ideal opportunity for omission errors to occur. As Hales and Pronovost (2006) explain, cognitive function can be compromised under stressful conditions, particularly in complex, high-intensity environments (such as a network control centre). These authors noted that checklists have the capacity to summarise masses of information that need to be recalled rapidly under challenging circumstances.
Reason (1990) also noted the potential for omission errors associated with the limitations with prospective memory, where an intended task can be forgotten during the interval between intention to perform the task and its execution (due to interruptions or competing priorities). He further noted checklists can assist in reducing these error types when under stressful conditions, such as an emergency response, by acting as a memory aid, thereby ensuring all required steps are completed.
Similarly, it is worth noting that the RISSB guideline document Rail emergency managementplanning stated:
Maintaining ‘quick references’ is recommended to support response and recovery. In the initial onset/identification of the emergency, Procedures or Action Cards and Checklists should detail immediate and important actions to help workers at all levels perform effectively.
There are two types of checklists that are useful in this regard. The first is ‘read-do’, where the checklist item is read and the action performed, which is particularly useful when performing an infrequent task (Dismukes and Berman 2010). The second is ‘flow-then-check’, where a number of actions are performed from memory, then verified as completed through a checklist. As such, there are two opportunities for ensuring the required procedure has been followed (Dismukes, Berman and Loukopoulos 2007).
Due to the benefits of checklists during an emergency response, the Australian Manual of Air Traffic Services,[45] used by both civil and military air traffic control, includes a series of checklists for controllers to use when responding to in-flight emergencies. The manual stated that on notification of the emergency, the checklist actions were to be initiated and the checklist items were to be continually reviewed to ensure all actions had been completed.
QR are to be commended for developing a checklist for NCOs to use for responding to an emergency. However, not making its use mandatory, or ensuring that NCOs continually refer to the checklist during an emergency response, provided a missed opportunity to capture important errors of omission.
Driver only operations procedures in an emergency
Another set of emergency response procedures that should have been applied on this occasion related to driver only operations (DOO). These procedures required that, before a driver left the locomotive following an accident or similar event, they would discuss the situation with network control and establish a report interval.
The DOO procedures were generic in nature and did not require discussion of OHLE safety specifically. However, if the procedures were formally applied, they provided an opportunity for a driver and network control personnel to consider the situation and relevant hazards.
In the case of the 18 August 2018 dewirement, multiple NCOs and the driver did not follow QR’s DOO procedure for leaving the locomotive cabin. On the five occasions that the driver left the locomotive during the emergency response, not all were advised to the NCO. Of those that were, no report back time was agreed or appropriate method of communication formalised.
In terms of potential reasons why the procedure was not followed:
Queensland Rail (QR) provided access to their DOO and OHLE emergency procedures to Aurizon, via a customer portal. Aurizon arranged personnel access to these via its intranet system ‘iN-Gauge’. However, no computer access to the iN-Gauge intranet was available on board YC77. Therefore, the driver was unable to access these procedures and associated forms in an emergency, when required for use.
The driver of YC77’s recollection of the DOO procedure was incomplete, having not referred to it for almost 5 years. Where memory of procedures is degraded, ready access to procedural documentation is important to ensure they are followed.
Aurizon provided a duty card in the form of an emergency checklist for drivers in the event of an emergency. However, a hard copy was not provided and there was no reference within the on-line checklist to the DOO procedure or requirements.
Aurizon provided a hard copy on-the-spot risk assessment tool for drivers to use prior to performing a non-routine task, for example, an unplanned exit of the locomotive cabin. There was no reference to the DOO procedure or requirements within this tool.
Although network control centre personnel knew of the DOO procedure, it was rarely used. The NCOs also were not aware of the crewing arrangements on board YC77, although this could have been clarified in the initial communications with the driver after the train had stopped.
In summary, Aurizon did not provide drivers with ready access to QR’s DOO procedures for when they were operating on the QR network. The same problem applied with access to QR’s OHLE emergency procedures. Limited access, knowledge of existence and supporting document prompts to follow for the DOO and OHLE procedures increased the likelihood of these procedures not being followed during the emergency response. In the case of the DOO procedure, this increased the risk that, had the driver of YC77 required emergency assistance, there may have been a significant delay in recognition and response.
In addition, there was no procedural document for DOO on the Aurizon-controlled section of the North Coast Line. A number of rolling stock operators, including those that also operated DOO services, accessed this track. As such, although Aurizon had adopted a generic form for DOO on its network in November 2015, there was no underlying procedure to instruct its use, or emergency procedures to be followed, in the event of a DOO train emergency.
From the evidence available, the following findings are made with respect to the dewirement involving freight train YC77 that occurred at Cooroy, Queensland on 18 August 2018. These findings should not be read as apportioning blame or liability to any particular organisation or individual.
Safety issues, or system problems, are highlighted in bold to emphasise their importance. A safety issue is an event or condition that increases safety risk and (a) can reasonably be regarded as having the potential to adversely affect the safety of future operations, and (b) is a characteristic of an organisation or a system, rather than a characteristic of a specific individual, or characteristic of an operating environment at a specific point in time.
Contributing factors
As freight train YC77 approached Eumundi, the rear collapsible end wall of the top nested flat rack raised up, resulting in multiple arcs and contacts with the overhead line equipment, which ultimately resulted in the dewirement at Cooroy.
The nested set of three flat racks and a single flat rack were delivered to the Acacia Ridge Intermodal Terminal without the collapsible end walls of the flat racks being secured for rail travel.
Personnel at the Acacia Ridge Intermodal Terminal did not check the collapsible end walls of the flat racks were secured on arrival at the terminal and after the flat racks were loaded onto freight train YC77, and the train departed without these end walls being secured.
Aurizon did not have an effective system in place for ensuring personnel required to check the securing of unusual loads (such as empty flat racks) prior to departure had sufficient knowledge of their responsibilities, and had ready access to relevant procedures, guidance and checklists. [Safety issue]
Although the electric control operator was provided with indications of overhead line equipment faults in the minutes prior to the dewirement, the pattern of information presented was ambiguous and did not enable the reason for the trips to be easily identified.
Other factors that increased risk
On multiple occasions following the dewirement, train crew accessed the exclusion zone associated with the close proximity of the extended end wall of the flat rack to the overhead line equipment, prior to the wires being isolated and earthed on site.
Multiple personnel did not recognise the potential risk associated with part of YC77 being very close to the OHLE after it stopped. In addition, network control centre personnel did not advise train crew of the status of the OHLE during the emergency response period.
Queensland Rail did not have an effective process in place to ensure that safety-critical actions were co-ordinated and completed when multiple network control officers were involved in responding to an overhead line equipment emergency. [Safety issue]
Following the dewirement, the driver and network control officer did not follow required protocols for driver only operations prior to the driver leaving the locomotive cabin.
Aurizon did not provide drivers with ready access to Queensland Rail’s procedures for driver only operations and overhead line equipment emergencies when they were operating on the Queensland Rail network. In addition, Aurizon did not have procedures for driver only operations that applied to its own network. [Safety issue]
Safety issues and actions
Central to the ATSB’s investigation of transport safety matters is the early identification of safety issues. The ATSB expects relevant organisations will address all safety issues an investigation identifies.
Depending on the level of risk of a safety issue, the extent of corrective action taken by the relevant organisation(s), or the desirability of directing a broad safety message to the rail industry, the ATSB may issue a formal safety recommendation or safety advisory notice as part of the final report.
All of the directly involved parties were provided with a draft report and invited to provide submissions. As part of that process, each organisation was asked to communicate what safety actions, if any, they had carried out or were planning to carry out in relation to each safety issue relevant to their organisation.
Descriptions of each safety issue, and any associated safety recommendations, are detailed below. Click the link to read the full safety issue description, including the issue status and any safety action/s taken. Safety issues and actions are updated on this website when safety issue owners provide further information concerning the implementation of safety action.
Unusual loads responsibilities and guidance material
Safety issue description: Aurizon did not have an effective system in place for ensuring personnel required to check the securing of unusual loads (such as empty flat racks) prior to departure had sufficient knowledge of their responsibilities, and had ready access to relevant procedures, guidance and checklists.
Access to QR procedures and existence of Aurizon documents
Safety issue description: Aurizon did not provide drivers with ready access to Queensland Rail’s procedures for driver only operations and overhead line equipment emergencies when they were operating on the Queensland Rail network. In addition, Aurizon did not have procedures for driver only operations that applied to its own network.
Process for co-ordinating network control activities during an emergency response
Safety issue description: Queensland Rail did not have an effective process in place to ensure that safety-critical actions were co-ordinated and completed when multiple network control officers were involved in responding to an overhead line equipment emergency
Safety action not associated with an identified safety issue
Whether or not the ATSB identifies safety issues in the course of an investigation, relevant organisations may proactively initiate safety action in order to reduce their safety risk. The ATSB has been advised of the following proactive safety action in response to this occurrence.
Additional safety action by Queensland Rail
In July 2020, Queensland Rail (QR) advised that it had taken the following proactive safety action in relation to driver only operations (DOO) on its network:
Post this incident occurring, Queensland Rail has re-enforced the understanding of requirements relating to driver only operations and delivered training in this area to key Network Control employees. An assurance activity for Quarter 2 of the 20/21 financial year has been scheduled to verify improvements in this area.
This training was in the form of a tool box talk, delivered in March 2019, and included the DOO emergency procedures and issuance of form MD-15-457 (Authority for driver only rail traffic driver to leave locomotive).
In August 2020, QR also advised that it had:
…issued an Important Safety Notice [ISN] to Rail Traffic Crew [train drivers and guards] addressing identifying emergency situations involving OHLE.
This ISN, issued in August 2020, advised train crew that in the event of an overhead line equipment (OHLE) issue, they were to:
confirm the status of the OHLE with the network control officer (NCO)
remain within the train and advise the NCO in the case of a suspected dewirement or high voltage earth alarm on the train
if while inspecting a train an object or rolling stock was found to be within 300 mm of the OHLE, apply an exclusion zone of 3 m around the rolling stock, until the OHLE has been de-energised, isolated and earthed.
QR document MD-11-30 (Rail Emergency Response Module EP1-01), required that a comprehensive review / debrief be undertaken after an emergency on QR’s network. This was to include all affected QR operational staff, with an invitation to attend extended to emergency services and a representative from the third party operator, in this case Aurizon. The purpose was to review the effectiveness and identify improvements in the emergency response and recovery process.
QR advised that it did not undertake a debrief after the Cooroy dewirement response. However, it noted that there were some informal discussions between network control personnel after the occurrence. In addition, QR advised that it typically did conduct debriefs for multi-agency emergencies, and provided examples of three other incidents in 2018-2019 where these occurred. It also advised that:
Post this incident occurring, Queensland Rail has re-enforced the importance of a conducting a formal debrief for incidents involving multi-agency emergencies.
General details
Train details
Track manager:
Queensland Rail
Train operator:
Aurizon
Train number:
YC77
Type of operation:
Intermodal freight
Consist:
1 x 2800 class locomotive, 32 x flat wagons
Departure:
Acacia Ridge (Brisbane), Queensland
Destination:
Portsmith (Cairns), Queensland
Persons on board:
Crew – 1
Passengers – n/a
Injuries:
Crew – nil
Passengers – n/a
Damage:
Substantial damage to overhead line equipment, minor damage to rear end wall of top nested flat rack
Sources and submissions
Sources of information
The sources of information during the investigation included:
Aurizon (train operator)
Acacia Ridge Intermodal Terminal personnel
the driver of train YC77
Queensland Rail (QR) (infrastructure manager)
rail management centre personnel
the QR commander.
References
Dismukes RK & Berman BA 2010, Checklists and monitoring in the cockpit: why crucial defences sometimes fail, National Aeronautics and Space Administration Technical Memorandum NASA/TM-2010-216396.
Dismukes RK, Berman BA & Loukopoulos LD 2007, The limits of expertise: Rethinking pilot error and the causes of airline accidents, Ashgate Aldershot UK.
Hales BM & Pronovost PJ 2006, ‘The checklist – a tool for error management and performance improvement’, Journal of Critical Care, vol. 21, pp. 231–235.
Reason JT 1990, Human error, Cambridge University Press Cambridge, UK.
Submissions
Under Part 4, Division 2 (Investigation Reports), Section 26 of the Transport Safety Investigation Act 2003 (the Act), the Australian Transport Safety Bureau (ATSB) may provide a draft report, on a confidential basis, to any person whom the ATSB considers appropriate. Section 26 (1) (a) of the Act allows a person receiving a draft report to make submissions to the ATSB about the draft report.
A draft of this report was provided to Queensland Rail, Aurizon, the driver of train YC77, Acacia Ridge Intermodal Terminal personnel, network control personnel, the QR commander and the Office of the National Rail Safety Regulator (ONRSR).
Submissions were received from Queensland Rail (primarily safety action), Aurizon (safety action only) and the terminal coordinator. The submissions were reviewed and, where considered appropriate, the text of the report was amended accordingly.
Appendices
Appendix A – Dangers associated with high voltage overhead line equipment (OHLE) in dewirements
Although voltage is required to force an electric current to flow in a circuit, electrical dangers to the human body are the result of an electric current passing through it, not the voltage. Voltages as little as 50 V AC are capable of overcoming the human body’s limited resistance to electric current, with severity of injuries increasing as voltage and thereby corresponding electric current increases.[46] Electrical safety guidance material states that a current of 2 Amperes is capable of stopping the heart and causing severe burns to internal organs.[47]
Under fault conditions (that is, a short circuit), current flow directly to rail or earth could reach thousands of Amperes due to a shortened pathway with less resistance than the normal electric circuit. A dewirement situation could result in such a short circuit where OHLE touched or came in close proximity to a train. This could allow current to flow directly through the metallic wagons or locomotive, into the rails. The greatly increased amperage would result in the circuit breaker for the electrical section tripping to protect OHLE from overheating or causing an electric shock. In this situation, the potential danger posed to personnel during fault conditions includes both touch and step potentials.
A touch potential occurs when a person is touching an object electrified under fault conditions and the earth. An example is holding the handrails on the egress ladder of a locomotive, with one or both feet on the ballast. As electric current will flow from a point of high voltage to low voltage, the voltage difference between the person’s hand (high voltage) and feet (low voltage) causes a large electric current to flow through their body to earth as part of the short circuit (Figure A1).
Figure A1: Touch and step potentials
Image shows both a step potential body current (left) and a touch potential body current (right), resulting from a fault condition.
Source: Voltage Lab
A step potential occurs when high voltage OHLE, or an item touching OHLE, is touching the ground, causing a current to flow through the ground to the rail or another return / earth path back to the substation. The ground voltage reduces as the distance increases from the point of contact the short circuit makes with the ground. This can cause a difference in voltage between a person’s feet standing nearby, where one foot is closer to the short circuit and thereby at higher ground voltage than the other foot. This may cause an electric current to flow from one foot through the body to the other foot (Figure A1).
Due to the high voltages of OHLE and resultant high electric currents, rubber-soled shoes may not provide protection for either touch or step potentials. All materials have a ‘breakdown voltage’, at which point a highly resistant material will lose its insulating abilities and become conductive. Similarly, high voltage OHLE can create an arc, where high voltage causes a breakdown of the air gap between an electric conductor and a conductive earthed component, allowing electricity to ‘jump’ across the air gap. The distance that electricity can arc across an air gap is dependent on a number of factors including voltage level, humidity and air pressure.
These dangers are well recognised, with rail infrastructure managers often investing in marketing campaigns to warn members of the public of the danger presented by high voltage OHLE. Figure A2 is one such example.
Figure A2: Queensland Rail’s ‘High Voltage Can Jump’ public awareness campaign
Image of Queensland Rail’s stand at the 2019 Brisbane Exhibition, highlighting the dangers of electrical arc from high voltage OHLE. The campaign was widespread throughout Brisbane, including significant display materials at Brisbane’s Central station.
The objective of a safety investigation is to enhance transport safety. This is done through:
identifying safety issues and facilitating safety action to address those issues
providing information about occurrences and their associated safety factors to facilitate learning within the transport industry.
It is not a function of the ATSB to apportion blame or provide a means for determining liability. At the same time, an investigation report must include factual material of sufficient weight to support the analysis and findings. At all times the ATSB endeavours to balance the use of material that could imply adverse comment with the need to properly explain what happened, and why, in a fair and unbiased manner. The ATSB does not investigate for the purpose of taking administrative, regulatory or criminal action.
Terminology
An explanation of terminology used in ATSB investigation reports is available here. This includes terms such as occurrence, contributing factor, other factor that increased risk, and safety issue.
Publishing information
Released in accordance with section 25 of the Transport Safety Investigation Act 2003
Ownership of intellectual property rights in this publication
Unless otherwise noted, copyright (and any other intellectual property rights, if any) in this report publication is owned by the Commonwealth of Australia.
Creative Commons licence
With the exception of the Coat of Arms, ATSB logo, and photos and graphics in which a third party holds copyright, this publication is licensed under a Creative Commons Attribution 3.0 Australia licence.
Creative Commons Attribution 3.0 Australia Licence is a standard form licence agreement that allows you to copy, distribute, transmit and adapt this publication provided that you attribute the work.
The ATSB’s preference is that you attribute this publication (and any material sourced from it) using the following wording: Source: Australian Transport Safety Bureau
Copyright in material obtained from other agencies, private individuals or organisations, belongs to those agencies, individuals or organisations. Where you wish to use their material, you will need to contact them directly.
Occurrence summary
Investigation number
RO-2018-011
Occurrence date
18/08/2018
Location
Elm Street overbridge on southern approach to Cooroy yard, North Coast Line
On the afternoon of 17 August 2018, the pilot of a Kawasaki Heavy Industries BK117 helicopter, registered VH-JWB, was conducting fire-bombing operations approximately 9 km west of Ulladulla, New South Wales (NSW).
The pilot was on the third flight for the day and was conducting repeated water bombing of a fire on Plot Road, Woodburn, NSW. On the fifth fire-bombing circuit, at this location, the pilot filled the slung Bambi Bucket (bucket) without incident from a nearby dam and departed towards the fire area. Shortly after, the aircraft diverted off course, the bucket and longline became caught in trees and the helicopter collided with terrain. The pilot was fatally injured and the helicopter was destroyed.
What the ATSB found
The ATSB found that it was likely the pilot suffered an incapacitating medical event. As a result, the pilot unintentionally diverted off track, leading to the bucket becoming tangled in the trees and causing the helicopter to collide with terrain.
The pilot’s post-mortem identified a focus of acute inflammatory change in the heart muscle, a condition known as lymphocytic myocarditis. This condition is capable of causing sudden impairment or complete incapacitation. The pilot is unlikely to have known they suffered from this condition. There are no risk factors for the development of this condition and it cannot be detected by medical screening.
The pilot’s post-mortem also identified coronary heart disease which is also capable of causing sudden impairment and incapacitation. This condition was being effectively managed by medication.
Despite the pilot suffering from these two heart-related conditions, there was insufficient evidence to determine if they contributed to the accident.
The ATSB also determined that the pilot was known to use an over the counter medication for the treatment of hay fever that, although labelled as non‑sedating, was not approved for use while conducting flying operations.
Finally, the pilot did not wear the upper torso restraint correctly. Although on this occasion the accident was unsurvivable, the use of such a shoulder harness restraint generally reduces the likelihood of fatal head injuries.
Safety message
Pilots are reminded that some medical conditions may be undetectable by the normal aviation medical screening process. Pilots should remain vigilant for any medical symptoms which may be the precursor to a more serious medical event.
Pilots should also exercise caution when using over-the-counter medications as their availability does not mean they are automatically safe for use while conducting aviation activities.
The occurrence
On 17 August 2018, a Kawasaki Heavy Industries BK 117 (BK 117),[1] registered VH-JWB (JWB), was performing aerial work in the Ulladulla area, New South Wales (NSW). The operator had been tasked by the NSW Rural Fire Service (RFS) to support fire-fighting activities in the Bombaderry area, near Nowra, on 15 August 2018, then in the Ulladulla area from the afternoon of 16 August 2018 (Figure 1). The fire-bombing operations were being flown out of the Milton Showground during the day, with the fire-bombing aircraft flown back to Nowra, for overnight parking.
Figure 1 - Accident location
Source: Google Earth, annotated by the ATSB
On the morning of 17 August 2018, JWB departed Nowra for the Milton Showgrounds. The pilot was the sole occupant and conducted a number of flights that day, refuelling from the showground at 1030 Eastern Standard Time[2]
In the afternoon, JWB and another BK 117, VH-FHB (FHB), were tasked to assist ground‑based fire crews extinguish fires near Plot Road, Milton (Figure 2). Both helicopters were operated with a Bambi Bucket[3] (bucket) on a longline.[4] The operation involved flying circuits between the fire area and a nearby dam, where the buckets were re‑filled with water.
Figure 2 - Area of operations
Figure 2 shows the area of operations with circuit direction arrows that are indicative of the average track of JWB during the previous 4 circuits.
Source: Google Earth, annotated by the ATSB
At 1400 the RFS Air Attack co-ordinator conducted an ‘operations normal’ radio call with all aircraft operating in the Ulladulla fire area. The pilot of JWB responded normally and did not report any difficulties.
At about 1407, the pilot of FHB observed JWB’s pilot fill the bucket at the dam before releasing a small quantity of water, consistent with normal operations. JWB then departed the dam in a south‑easterly direction towards the fire.
The pilot then moved FHB over the same dam to fill its bucket. On completion of filling the bucket, the pilot looked for JWB but could not sight the helicopter.
A witness on Plot Road, approximately 100 m east of the accident site, observed JWB tracking in a north-easterly direction, contrary to the established flight pattern. A number of witnesses in the same area then observed the bucket and longline become tangled in trees at the edge of a clearing, and the helicopter collide with terrain (Figure 3). The pilot was fatally injured and the helicopter was destroyed.
The pilot was a New Zealand citizen who had flown in several countries and had experience on numerous helicopter types. They held a valid Commercial Pilots Licence (Helicopter) that was initially issued by the Civil Aviation Authority of New Zealand, in June 1987 and then converted to an Australian licence by the Civil Aviation Safety Authority in October 1998.
The pilot held a Class 1 aviation medical certificate, valid until 5 June 2019, with a restriction requiring reading correction to be available whilst exercising the privileges of the licence.
The pilot’s logbook, combined with the operator’s flying record, showed a total flying experience of approximately 7,750 hours. The pilot had approximately 1,300 hours experience operating the BK117 and in excess of 3,000 hours of longline experience.
The pilot last completed an aerial application rating proficiency check on 9 August 2018, which was valid until 31 August 2020, and included Bambi Bucket operations. The pilot was qualified to conduct helicopter fire operations and had a low-level rating and a sling operations endorsement. The pilot’s logbook contained evidence of fire operations first being conducted in 1997. The pilot obtained an Agricultural Pilot (Helicopter) Rating Grade 2 from the Civil Aviation Safety Authority Australia in March 2003.
Fatigue assessment
The ATSB assessed whether the pilot may have been fatigued at the time of the accident. The pilot’s start times, rest time available, accommodation facilities, environmental factors and workload associated with the task were all reviewed. From the evidence available it was considered unlikely that the pilot was experiencing a level of fatigue known to affect performance.
Meteorological information
Bureau of Meteorology data was available from an automatic weather station located on the coast at Ulladulla, approximately 9 km east of the accident site. One-minute observations at the time of the accident indicated that the wind was from the south-east, between 8‑10 kt.
The other pilot operating in company with JWB at the time of the accident similarly reported the wind to be about 10 kt from the south‑east, which was roughly in the direction of the up-wind leg of the fire-bombing circuit.
Visibility was estimated to be in excess of 5 km by another pilot operating in the same area. Photographs taken shortly after the accident were consistent with that visibility assessment. Other pilots reported that the conditions were good for fire-bombing operations, with no turbulence or visibility issues.
Aircraft information
General
The Kawasaki Heavy Industries BK117 helicopter is a multi-purpose, twin-engine, skidded, medium helicopter with ten seats in the basic configuration.
Airworthiness and maintenance
The helicopter was built in 1994 and operated in Japan before being imported to Australia in 2015. A Certificate of Airworthiness inspection was completed on 24 September 2015. JWB had a current maintenance release, issued on 5 September 2017 and was valid for a period of 300 hours or 12 months, whichever occurred sooner.
The helicopter was maintained in accordance with an approved System of Maintenance. A general maintenance review was conducted on the helicopter’s history since being imported into Australia. This review did not identify any anomalies with the aircraft’s maintenance. At the time of the accident, there were no outstanding defects or maintenance requirements.
Weight and Balance
It was calculated that at the time of the accident the aircraft’s weight and balance were within the operational limits for the helicopter.
Engines
The helicopter was powered by two Lycoming (now Honeywell) LTS101-750B-1 engines. The engines were initially examined on site by the ATSB and also subject to detailed disassembly and technical examination by the manufacturer (see the section titled Wreckage examination).
Hydraulic System
The hydraulic system consists of two independent subsystems of which construction, function and performance are identical.
Bambi Bucket
JWB utilised a Bambi Max bucket that is a lightweight, low‑power draw, quick‑operating multiple drop valve Bambi Bucket. The bucket was attached to the helicopter cargo hook via a 130 ft longline. The pilot controlled the bucket using a push button switch mounted on the cyclic.[5]
Cargo Hook
JWB was fitted with an Indraero Siren Equipment cargo hook. The hook allows external cargo to be released via a collective[6] ‑mounted electrical switch. In addition, a foot‑activated manual release lever was located to the right of the pilot’s tail rotor pedal. This lever was used to release cargo in the event of an emergency or failure of the electrical release system.
During the course of the investigation, the ATSB was informed that the pilot sometimes operated with the circuit breaker for the electrical hook release pulled. The operator advised that the company procedure was to fly with the circuit breaker in and the electrical hook switch armed during flight. Additionally, even if the pilot had flown with this circuit breaker pulled, they would still have had the foot‑activated manual release lever available in the event of an emergency.
Operational information
The pilot of FHB commented during interview that each time JWB was overhead the fire‑bombing area there was a substantial level of clearance between the bucket and the trees. This pilot estimated that water was consistently dropped from JWB at about 6‑9 m above the trees.
None of the ground or airborne crews heard any radio transmissions from JWB immediately before the accident. During water bombing operations it is standard practice to make a radio call when leaving the circuit for any reason, to inform other airborne assets of the helicopter’s tracking.
Ground fire-fighting crews were also operating in the immediate area. Those personnel advised that there were no other spot fires in the immediate area. Additionally, the crew of the air attack helicopter reported to the ATSB that when they came into land at the accident location minutes after the accident, they did not see any fire in the area that may have caused JWB to turn away from the circuit.
Fuel
JWB and the other helicopters on task, had all refuelled using Jet A1 fuel from the same onsite tanker based at the Milton Showgrounds. In addition, other helicopters operating in the area were using fuel from the same source and there were no reported issues with fuel quality. Fuel records confirmed the fuel on-board the tanker conformed to the relevant specification.
JWB had refuelled twice from the tanker on the day of the accident with the last refuel of 435 litres conducted approximately 2 hours and 20 minutes prior to the accident. Considering the helicopter’s fuel consumption rate, there was adequate fuel onboard at the time of the accident.
Wreckage and accident site information
Accident site
The accident site was located 9 km west of Ulladulla, New South Wales. The wreckage of JWB was approximately 200 m from the average circuit path and the aircraft final track was estimated to be 90° off the circuit direction (Figure 2).
The main cabin of the helicopter was found inverted in a clearing with the bucket and longline still attached (Figure 3). The bucket and longline were caught in a 22 m tall tree at the edge of the clearing.
Rub marks from the longline were found on the trunk of the tree that the bucket was hanging from. These marks indicated the bucket snagged the tree at least 13 m down from the top of the tree.
In the later part of the circuit the helicopter bucket would normally have a minimum of 6–9 m clearance above the treetops. Taking this into account, and the tree contact 13 m below the canopy, the bucket was at least 19–22 m lower than expected when it snagged the tree and brought the helicopter down.
Figure 3 - Accident site and wreckage
Source: ATSB
The bucket, while suspended from the tree, still contained a large quantity of water. After removal, examination of the bucket showed that the cable required to operate the drop valve had broken at the attaching point to the motor, either during the accident sequence or as the bucket was removed from the tree. However, during post‑accident repairs the main valve was tested and found to be serviceable.
Wreckage examination
The ATSB examined the wreckage and did not identify any pre-existing aircraft defects that may have contributed to the accident sequence. The aircraft and all its components were accounted for at the accident site. There was no evidence of fire.
There was extensive damage to the fuselage with heavy vertical compression evident. One main rotor blade detached, while the other three remained attached to the head, with varying degrees of damage due to contact with the airframe and terrain. The vertical fin, including the tail rotor assembly, intermediate and tail rotor transmissions, fractured from the tail boom at the lower section of the vertical fin. The horizontal and vertical stabilisers had been struck by the main rotor blades multiple times.
Consistent with normal firefighting operations, the pilot door was not fitted at the time of the accident. The cabin doors were forced from their closed position due to impact forces.
All flight controls were observed to be connected at the time of the accident and did not indicate any pre-existing defects. There was no visible damage to the cockpit controls.
Several circuit breakers in the overhead panel were found in the ‘tripped’ position, including the cargo hook, annunciator warn and main rotor RPM warning. However, due to the nature of the accident sequence, these circuit breakers may have tripped due to impact forces.
The serviceability of the cargo hook mechanical release mechanism was verified after disconnecting the cargo hook from the helicopter. This was necessary due to the damage at the hook end of the actuating cable.
The ATSB tested the hook assembly electrically with the use of another BK117 and it was found to be serviceable. The hook was cycled a number of times and released and relatched without any anomalies observed.
Each engine assembly was examined on-site and found to be complete, with no evidence of pre‑accident defects that influenced the accident.
Both engines were removed from the wreckage and shipped to the manufacturer in the United States for detailed examination under the supervision of the United States National Transportation Safety Board.
The disassembly and examination of the engines identified that the type and degree of damage was indicative of both engines rotating and operating normally at the time of impact. No pre‑existing conditions were noted that would have affected their operation.
Examination of the tandem hydraulic unit assembly showed three of the four filter bypass indicators in the ‘popped’ condition. An examination of the filters in each location showed them to be clear of blockages and debris. Consequently, the ‘popped’ indicators were probably impact related. The fluid level indicators for each reservoir showed that both systems had adequate fluid to operate.
While moving the wreckage upright, approximately 100 litres of fuel leaked from JWB. This fuel was clear in appearance and indicated sufficient fuel on-board for use.
Recorded information
The aircraft was not fitted with a flight data recorder or a cockpit voice recorder and neither were required.
A Spidertracks system was installed in the helicopter. Spidertracks provides a real-time flight tracking service using satellite communications. The device reports position and groundspeed at a pre-set time interval, in this case every 2 minutes.
The last recorded point for JWB was at 1408 (Figure 2). At that time, the helicopter was departing the dam, where it had just taken on water, and was heading towards the fire ground. This was consistent with previous circuits.
Medical and pathological informational
Post-mortem examination
The forensic pathologist who conducted the post-mortem examination concluded that the pilot succumbed to injuries sustained during the accident sequence. The examination also identified a widespread area of acute lymphocytic myocarditis, likely of viral origin, and ischaemic (coronary) heart disease. The examining pathologist noted that the myocarditis and/or coronary heart disease found during the post-mortem may have caused sudden incapacitation.
The post-mortem also identified injuries to the pilot’s left arm and both hands. Specialist opinion was that this injury pattern evidence was inconclusive in determining whether the pilot was manipulating the flight controls at the time of the accident.
No witness marks were identified during the examination to indicate the pilot was wearing the available upper torso restraints over the shoulders and the time of the accident.
Finally, toxicological examination identified that a level of 5 per cent carboxyhaemoglobin was present in the pilot’s blood (see the section titled Carbon monoxide below). No other substances were identified that were likely to have impaired the pilot’s performance.
Lymphocytic myocarditis
Lymphocytic myocarditis (myocarditis) is an inflammatory change in the heart muscle, usually caused by an acute viral infection. Acute viral myocarditis can involve a period with mild early symptoms which can be followed by chest pain, heart rhythm abnormalities, heart failure, or sudden cardiac death. Myocarditis may also have a sudden onset with no early mild symptoms. The signs and symptoms of myocarditis vary, depending on the cause of the disease. Common myocarditis signs and symptoms include:
chest pain
rapid or abnormal heart rhythms (arrhythmias)
shortness of breath, at rest or during physical activity
fluid retention with swelling of the legs, ankles and feet
fatigue
other signs and symptoms of a viral infection, such as headache, body aches, joint pain, fever, sore throat and/or diarrhoea
The ATSB engaged two external aviation medicine specialists (consultants A and B), to provide advice regarding the pilot’s health, medications and medical conditions in relation the accident sequence.
The consultants advised that the standard aviation medical examination procedure would not have detected myocarditis. Myocarditis cannot be detected by medical screening, and there are no risk factors for the development of viral myocarditis. The only avenue for prevention is for pilots to self-monitor for any symptoms or signs of illness prior to and during each flight.
Advice was sought from the medical consultants as to the likelihood of the pilot having symptoms of the condition based on the post-mortem report. Consultant A, in conjunction with a cardiologist, reported that the presence of a focus of acute myocarditis in the pilot was a finding ‘likely to have functional significance for the risk of sudden impairment or sudden complete pilot incapacitation.’ Consultant A also stated that viral infections of all kinds are often characterised by quite severe illness developing suddenly, sometimes with early mild symptoms. They also advised that the risk of cardiac arrhythmia due to viral myocarditis and the apparent cessation of pilot control inputs were strongly suggestive of severe and sudden loss of situational awareness and/or loss of consciousness occurring as a result of myocarditis in the final moments of the flight.
Consultant B reported that it was possible the myocarditis was an incidental finding in the post‑mortem and did not cause any symptoms. However, they also advised that it was equally possible the pilot was suffering some medical incapacitation from this condition, however there was no evidence for this prior to the flight.
Coronary heart disease
Coronary heart disease describes a condition where narrowing of the coronary arteries by fatty deposits in the artery walls, or hardening of the arteries, causes a reduction of the blood to the heart muscle, reducing the oxygen supply. If this condition causes a blockage to one of the major arteries supplying blood to the brain, a stroke can occur. Depending on the part of the brain affected, sudden incapacitation and the inability to operate an aircraft may result.
Common symptoms of this disease include:
chest pain
dizziness
shortness of breath
decreased ability to function normally
The ATSB medical consultants advised that the pilot had undergone an aviation medical examination, including an electrocardiogram, by an aviation medical examiner three months prior to the accident and was found to be fit to fly. In addition, consultant A advised that the pilot’s medical examination and medical certification processes were appropriate and took into account the effective management of cardiovascular risk factors.
Opinion was sought from the consultants on the potential for the condition to have influenced the accident. They commented that coronary artery disease of the level found at post-mortem is often found in healthy people and can be regarded as part of the normal degenerative process of aging. The presence of calcification indicated that the pilot’s heart disease was longstanding and would not necessarily have caused symptoms.
Consultant A also commented that coronary artery narrowing without evidence of inadequate blood supply was reported at post-mortem, but the changes were longstanding and unlikely to have caused symptoms.
Observed behaviour
Several people were interviewed as part of the investigation who had contact with the pilot on the day of the accident and during the days immediately preceding the accident. With one possible exception, all commented that the pilot was generally well and in good spirits.
Following a lunch break on the 16 August, the pilot was observed having difficulty writing down the latitude and longitude of a new task location. The pilot was passed the latitude and longitude three times over the radio and the pilot was observed to write part of the numbers correctly, part incorrectly or just stop writing mid sequence. The latitude and longitude was described as being passed via the radio very clearly.
The observer knew the pilot in a professional capacity and had witnessed the pilot landing, taking off and attending briefings that day and the previous day with no indications the pilot was having any difficulties. The observer made comment that, when the pilot had difficulty writing down the latitude and longitude, nothing in the pilot’s movement, speech or facial expression appeared unusual.
With regard to this observation of apparent impairment, consultant A commented that it may have been associated with myocarditis-related arrythmia or transient ischaemic attack.
Consultant B commented that this apparent episode of confusion was non-specific and while it could be attributed to myocarditis, or the effects of heart disease, it could also have been unrelated.
Medication
During the wreckage examination four prescription medications and one over the counter antihistamine medication were found with the pilot’s possessions. It was confirmed with the pilot’s designated aviation medical examiner (DAME) that all four prescription medications had been taken by the pilot for a number of years and were consistent with their age and health. It was reported by a family member that the pilot did not suffer any side effects from the prescription medications.
Opinion was sought from medical consultant A, in conjunction with an aviation cardiologist, whether the medications could have influenced the accident. The potential for side effects such as sedation and drug interactions, were all considered and excluded by these specialists. The potential for cardiac irregularity due to an interaction between one of the antihypertensive drugs and the antihistamine was also assessed as very unlikely.
The antihistamine medication was for the treatment of hay fever and the pilot’s DAME was not aware of its use. The active ingredient of this medication is listed in the CASA guidance as prohibited. It was reported that the pilot was known to suffer from hay fever and used this medication to treat the symptoms.
Medical opinion regarding the possible sedating side effects of this medication was that, while some people experience sedation when taking this non-sedating antihistamine, this was recognisable on taking the first dose. The pilot was known to have been taking this medication regularly, so any adverse effects on the day of the accident were considered unlikely.
Carbon monoxide
Carbon monoxide (CO) is a colourless, odourless and tasteless gas. It is the by-product of the incomplete combustion of materials containing carbon. The Agency for Toxic Substances and Disease Registry (2012) stated that CO is produced from both human-made and natural sources.
When inhaled, CO is absorbed into the bloodstream where it readily binds with the haemoglobin to form carboxyhaemoglobin (COHb). The binding affinity of CO for haemoglobin is 200-300 times stronger than that for oxygen. Therefore, CO reduces the oxygen carrying capacity of the blood.
An individual’s COHb levels increase as the duration and intensity of the CO exposure increases.
Normal levels of carbon monoxide and effects
There have been a considerable number of studies examining CO exposure, though very few regarding such exposure in helicopters.
Hampson et al. (2007) cited various publications that indicated that there were differing views regarding the correlation between COHb levels and a patient's clinical symptoms.
Further, when comparing the COHb levels detected in individuals, Rathore and Rein (2016) highlighted that it was important to note that ‘both the concentration and length of time are key distinguishing factors. It is vital to note however that individuals exposed to the same source simultaneously can exhibit differing levels of COHb’. Taking this into consideration, when discussing the normal levels of CO contained in an individual’s blood, Consultant B stated that:
Normal levels of carbon monoxide in non-smokers are less than 2-3%. Smokers may have elevated levels around 3-5% or even as high as 9%, depending on number of cigarettes smoked and time since last cigarette smoked.
A police forensic pharmacologist involved in a previous ATSB investigation[7] reported similar levels, where a non-smoker’s maximum COHb level would be around 5 per cent, while smokers could have levels up to 10 per cent and up to 16 per cent for heavy smokers.
While the research shows some variability in what was considered to be the normal production of CO without occupational exposure, generally less than 3 per cent COHb saturation was considered normal for non-smokers. For smokers, levels up to 10 per cent, or even more were expected.
Recognising the potential for variability, physical symptoms and cognitive effects of CO exposure generally start to occur at COHb levels of around 10 per cent. These include headaches, nausea, dizziness, confusion, and disorientation.
ATSB report AO-2017-118 contains further details on the effects of CO.
Possible sources
Aviation fuels contain carbon so exhaust gasses are a source of carbon monoxide that can potentially enter the cabin during flight. Piston engines produce the highest concentrations of CO, however turbine engines also produce CO (Salazar).
Based on the configuration of the helicopter, with the engines above and behind the cabin as well as the cabin doors closed, it was considered unlikely for significant exhaust gasses to enter the cabin, even with the pilot door removed.
Carbon monoxide is also produced during combustion from bushfires. Studies have been conducted regarding the effect of the smoke on firefighters on the ground, however there is no data in relation to pilots conducting airborne firefighting. One study conducted by Reinhardt and Ottmar (2004) found 5‑10 per cent of firefighters exceeded exposure standards for respiratory irritants, of which carbon monoxide is one, while attending bushfires.
In a study conducted by MacSween et al (2019) it was noted that emissions and subsequent exposure levels were highly variable over the duration of a burn. Carbon monoxide levels present during fire-fighting activities depend on numerous variables, including fuel properties, temperature, moisture, ventilation of the area and proximity to the fire (De Vos, et al, 2008). The pilot was operating at varying altitudes and proximity to the fire and considered to be further from the fire source than ground-based firefighters.
The pilot’s smoking history was also examined. The pilot had been a non-smoker for more than 20 years and it was considered by consultant B to not be a factor in the elevated levels of CO found in the toxicology.
In summary, the source of the pilot’s slightly elevated CO could not be determined.
Medical opinion
The forensic pathologist, who performed the post-mortem, considered the level of carbon monoxide found in the pilot’s blood was unlikely to have had an effect on the pilot’s ability to fly the helicopter.
Consultant B reviewed the results of the CO testing and the post-mortem report. Taking into account the circumstances of the accident and the CO level found in the pilot’s toxicology, they similarly concluded it was extremely unlikely that the level of CO in the pilot’s blood would have affected their operation of the helicopter.
Survival aspects
Due to the inverted nature of the accident and resulting vertical compression of the fuselage, the accident was not considered survivable.
It was noted, however, that evidence from the first responders showed the upper torso restraint (UTR) was worn incorrectly. The UTR was fastened around the pilot’s waist rather than over the shoulders, meaning the upper torso was unrestrained. A photograph from a previous flight also showed the pilot with the UTR being worn in the same manner as found in the accident flight.
Related occurrences
The ATSB report Pilot incapacitation: Analysis of medical conditions affecting pilots involved in accidents and incidents examined medical conditions and incapacitation events between 1 January 1975 and 31 March 2006. This report concluded that the majority of pilot incapacitation events do not involve a chronic or pre-existing medical condition. That is, they are largely unforeseeable events, often involving acute illnesses or injury. Of the 10 accidents that resulted in fatalities, all involved single-pilot operations and in half of these, heart conditions were identified as a significant contributing factor.
The ATSB safety education publication Pilot incapacitation occurrences 2010–2014 (AR‑2015‑096) documents recent pilot incapacitation occurrences in high capacity air transport, low capacity air transport, and general aviation to help educate industry about the causes and risks associated with inflight pilot incapacitation. Part of the safety message reminded pilots to assess their fitness prior to flight. Assessment of fitness includes being aware of any illness or external pressures they may be experiencing.
ATSB investigation AO-2015-145: Flight crew incapacitation – Lake Macquarie Airport, NSW, on 15 December 2015
On the morning of 15 December 2015, a SOCATA TBM 700, aircraft, registered VH-YZZ, departed Gold Coast Airport, Queensland for Lake Macquarie Airport, New South Wales. On board were the pilot and one passenger.
The flight to Lake Macquarie was uneventful. However, when the aircraft was just about to land on the runway the pilot started to feel ‘woozy’ and, shortly afterwards, lost consciousness. The aircraft impacted the runway, bounced and impacted the runway a second time before the pilot regained consciousness. The pilot and passenger were not injured during the accident and exited the aircraft. Medical tests and monitoring after the accident found that the loss of consciousness was due to a previously undiagnosed heart condition.
During daytime fire-bombing operations the aircraft deviated off track without making a radio call, flew too low and caught the bucket in trees resulting in a collision with terrain.
Site and wreckage examination did not identify any defects or anomalies that might have contributed to the accident. The following analysis will focus on possible reasons why the aircraft diverted off track as well as medical and survivability aspects.
Pilot incapacitation
The pilot of JWB was familiar with the area of operations and the conditions on the day, having flown several circuits in the area that afternoon. No weather or mechanical issues were identified during the course of the investigation that could have influenced the accident.
The absence of any communication by the pilot after filling the bucket for the final time was unusual as it was standard practice to make a radio call when leaving the circuit for any reason and was a simple action to perform.
At any time during the flight the pilot had the option to dump the water and/or release the bucket and longline in total from the aircraft hook should circumstances have required it. However, this action was not completed by the pilot. Had the observed flight deviation been the result of the pilot responding to a mechanical issue, dumping the water and/or releasing the bucket would have increased the aircraft performance and made dealing with a mechanical malfunction easier.
If the pilot was attempting an emergency landing, then it would be expected that they would have tracked for one of the nearby suitable landing areas and, depending on the emergency, dumped the water and/or released the bucket and made a radio call. The area the accident occurred in was not a suitable emergency landing site due to the slope of the terrain and surrounding obstacles. In addition, the pilot did not perform any of the expected actions associated with an emergency. Therefore, it was considered unlikely that the pilot was attempting an emergency landing at the time of the accident.
The on-site assessment indicated that JWB was at least 19–22 m lower than expected at the time the bucket caught in the trees. The bucket and longline contacted the tree at least 13 m below the top of the tree. The pilot was aware of terrain having completed four circuits in the area and was on the fifth at the time of the accident. In addition, the pilot had been observed flying with a substantial level of clearance between the bucket and the trees on previous circuits.
With the pilot’s extensive experience working with a longline and at low level, as well as several standard pilot actions that were missing, it is unlikely that the pilot knowingly diverted off track, did not make a radio call and flew significantly lower than was safe resulting in the bucket snagging in the trees and the helicopter colliding with terrain.
In the absence of any mechanical issue, and considering the significant, unannounced tracking and height deviation from the normal operating procedure, the evidence indicated that the pilot probably suffered an incapacitating event. Due to this event the pilot unintentionally diverted off track, was unable to make a radio call and was unable to react to the low altitude of the helicopter. This led to the bucket becoming tangled in the trees and caused the helicopter to collide with terrain.
Possible sources of incapacitation
Although 5 per cent carboxyhaemoglobin was present in the pilot’s blood, the level was considered by medical specialists to be too low to have affected the pilot’s ability to operate the helicopter. Recognising the potential for individual variability, the conclusions of the specialists were consistent with research that indicated about 10 per cent carboxyhaemoglobin was generally required to produce adverse effects. As such, it was considered unlikely that carbon monoxide was the source of pilot incapacitation.
Lymphocytic myocarditis
Both medical consultants engaged by the ATSB agreed that myocarditis may have a sudden onset with no initial mild symptoms. In addition, the signs and symptoms of myocarditis vary depending on the cause of the disease and can include sudden incapacitation.
However, the consultants’ opinion differed in relation to the strength of the link between this specific condition and the outcome of the flight. Consultant A stated that the presence of a focus of acute myocarditis in this pilot was a finding likely to have functional significance for the risk of sudden impairment or sudden complete pilot incapacitation. However, consultant B concluded that it was possible that the pilot was suffering some medical incapacitation from myocarditis or heart disease or other causes that were not identified.
Due to the variation between the specialist conclusions, the ATSB was unable to determine if the effects of myocarditis contributed to the accident.
Coronary heart disease
Both medical consultants commented that the level of coronary heart disease found at the post‑mortem examination was likely typical of a large proportion of the population of similar age to the pilot and was not known to produce symptoms.
The pilot had undergone and passed a Class 1 aviation medical within 3 months prior to accident which included an electrocardiogram.
Due to the pilot’s current effective management of their cardiovascular risk factors and a lack of any other evidence linking this condition to the outcome of the flight, it was considered unlikely to have influenced the accident.
Over the counter medication
During the examination of the wreckage, the ATSB found an over-the-counter antihistamine in the pilot’s possessions, and it was reported that the pilot regularly took this medication for the treatment of hay fever. The Civil Aviation Safety Authority (CASA) provides guidance on medications that are approved, hazardous and prohibited for flight. CASA notes that just because a medication is available over the counter does not mean it is automatically safe for aviation. CASA also recommends that a pilot should always consult their designated aviation medical examiner or CASA about the safe use of medication.
The active ingredient of this medication is listed in the CASA guidance as prohibited in aviation. While the label stated it was non-sedating, it is classed by CASA as a sedating antihistamine. ATSB medical consultant A commented that the sedating effects of this medication would be recognisable on taking the first dose. The pilot had been taking this antihistamine for some time and had not reported any side effects. Therefore, any adverse effect on the day of the accident was considered unlikely.
Upper torso restraint
The pilot was found to have not been wearing the upper torso restraint correctly at the time of the accident. The ATSB medical consultant commented that had this been an un-inverted impact, or an impact with significant longitudinal aircraft deceleration, the absence of the shoulder harness restraint would have increased the likelihood of head injuries, with possible fatal consequences in an otherwise survivable accident.
Findings
ATSB investigation report findings focus on safety factors (that is, events and conditions that increase risk). Safety factors include ‘contributing factors’ and ‘other factors that increased risk’ (that is, factors that did not meet the definition of a contributing factor for this occurrence but were still considered important to include in the report for the purpose of increasing awareness and enhancing safety). In addition, ‘other findings’ may be included to provide important information about topics other than safety factors.
These findings should not be read as apportioning blame or liability to any particular organisation or individual.
From the evidence available, the following findings are made with respect to the collision with terrain involving Kawasaki Heavy Industries BK117, VH-JWB, which occurred 9 km west of Ulladulla, New South Wales, on 17 August 2018.
Contributing factors
While conducting fire-bombing operations, the pilot likely experienced an incapacitating event resulting in deviation off track, entanglement of the bucket in trees and subsequent collision with terrain.
Other factors that increased risk
The pilot had acute lymphocytic myocarditis which is known to affect heart rhythm and/or blood pressure. This can cause dizziness, impaired consciousness, and incapacitation.
The pilot had coronary heart disease which is known to reduce the supply of blood to the heart muscle. This can cause chest pain, dizziness, shortness of breath and possible incapacitation.
The pilot used an over-the-counter medication for the treatment of hay fever that, although labelled as non‑sedating, was not approved for use while conducting flying operations.
The pilot did not wear the upper torso restraint correctly. Although this accident was unsurvivable, the absence of such a shoulder harness restraint generally increases the likelihood of fatal head injuries.
Sources and submissions
Sources of information
The sources of information during the investigation included the:
Civil Aviation Safety Authority (CASA)
operator
pilot’s and crew of other helicopters airborne in the area
New South Wales Police Service and Rural Fire Service
aircraft and engine manufacturers
maintenance organisation for VH-JWB
Airservices Australia
next of kin
medical consultants
accident witnesses
recorded data from Spidertracks
References
Civil Aviation Safety Authority’s aviation medicine guidance, Medication, available from the CASA website.
De Vos, A. Reisen, F. Cook, A. Devine, B & Weinstein, P. (2008). Respiratory Irritants in Australian Bushfire Smoke: Air Toxics Sampling in a Smoke Chamber and During Prescribed Burns. Arch Environ Contam Toxicol (2009). 56:380-388.
Hampson, N.B. & Hauff, N.M. (2007). Carboxyhemoglobin levels in carbon monoxide poisoning: do they correlate with the clinical picture? The American Journal of Emergency Medicine, 2008(26), 665-669.
MacSween, K. Paton-Walsh,C. Roulston, C. Guerette, E. Edwards, G. Reisen, F. Desservettaz, M. Cameron, M. Young, E & Kubistin, D. (2019). Cumulative Firefighter Exposure to Multiple Toxins Emmitted During Prescribed Burns in Australia. Exposure and Health.
Rathore, O. & Rein, G. (2016). Carbon Monoxide Toxicology: Overview of Altitude Effects on the Uptake and Dissociation of COHb and Oxygen in Human Blood. Retrieved from RFImpactAltitudeCOToxicology.ashx (nfpa.org)
Salazar, G.J. Federal Aviation Administration. (n.d.). Carbon Monoxide: A Deadly Menace. Retrieved from CObroforweb (faa.gov)
Purpose of safety investigations
The objective of a safety investigation is to enhance transport safety. This is done through:
identifying safety issues and facilitating safety action to address those issues
providing information about occurrences and their associated safety factors to facilitate learning within the transport industry.
It is not a function of the ATSB to apportion blame or provide a means for determining liability. At the same time, an investigation report must include factual material of sufficient weight to support the analysis and findings. At all times the ATSB endeavours to balance the use of material that could imply adverse comment with the need to properly explain what happened, and why, in a fair and unbiased manner. The ATSB does not investigate for the purpose of taking administrative, regulatory or criminal action.
Terminology
An explanation of terminology used in ATSB investigation reports is available here. This includes terms such as occurrence, contributing factor, other factor that increased risk, and safety issue.
Publishing information
Released in accordance with section 25 of the Transport Safety Investigation Act 2003
Ownership of intellectual property rights in this publication
Unless otherwise noted, copyright (and any other intellectual property rights, if any) in this report publication is owned by the Commonwealth of Australia.
Creative Commons licence
With the exception of the Coat of Arms, ATSB logo, and photos and graphics in which a third party holds copyright, this publication is licensed under a Creative Commons Attribution 3.0 Australia licence.
Creative Commons Attribution 3.0 Australia Licence is a standard form licence agreement that allows you to copy, distribute, transmit and adapt this publication provided that you attribute the work.
The ATSB’s preference is that you attribute this publication (and any material sourced from it) using the following wording: Source: Australian Transport Safety Bureau
Copyright in material obtained from other agencies, private individuals or organisations, belongs to those agencies, individuals or organisations. Where you wish to use their material, you will need to contact them directly.
On 17 June 2018, at about 1309, passenger train NT32 collided with a track obstruction as it crossed the Wilson River Bridge, near Telegraph Point, New South Wales and sustained minor damage. The track obstruction was identified as an awning from a container being carried by freight train 7WB3, operated by Pacific National (PN), which had separated when it came open and struck the bridge structure as the train passed over.
What the ATSB found
The ATSB found that the container involved had been modified to include a large side opening awning. The awning was only held closed by spring-loaded bolts accessed from the inside of the container. This was not compliant with PN’s Freight Loading Manual (FLM), which required a system that could be locked and was externally visible to assure that openings remained secure and enable examination by inspection staff.
Inspections conducted by PN terminal operators at the departure location did not identify the modified container or the absence of locks. The customer did not notify PN that the container was modified as they were not aware of a requirement to do so. Consequently, PN were unaware of the need to assess the modifications against the FLM requirements.
While PN made the FLM available to customers, they did not actively advise them when they had a responsibility identified by the manual and did not have a process for ensuring customers complied with the manuals requirements.
Additionally, the training and checking processes for terminal operators who carried out inspections did not include the FLM requirements for modified containers. This removed an opportunity for the requirements to be reinforced and practiced during training and regular checking of inspection staff.
What's been done as a result
PN have advised that they have implemented a range of processes to ensure customers are aware of, and are compliant with their FLM requirements. These have included the development of an online course for the FLM, and an auditing program to monitor FLM compliance and performance. PN has further introduced a number of measures relating to the training and checking of inspection staff. These include trialling a change to their transport management system, which triggers mandatory checks by PN inspectors at any terminal where a non-standard or modified container enters, and updating training and checking packages to include the FLM requirements.
Safety message
Any item on a container that can open into the rail corridor represents a potential risk as, should they come open, they may strike infrastructure, opposing trains or bystanders. This highlights the significance of ensuring that such items are adequately secured prior to transit.
Further, this occurrence emphasised the importance of training and checking to reinforce operational procedures, in this case, for identifying and securing openings on modified containers. It also identified the need to have processes in place to advise customers of the requirements for the safe transport of modified containers and to ensure compliance.
The occurrence
Loading of container wagons
On 15 June 2018, a container (number 2200655) was delivered to the loading facility at Carrington, New South Wales (NSW), for loading onto a rail wagon. The container was loaded onto wagon RQSY 34371M, one of nine wagons loaded with container freight bound for Brisbane, Queensland (Qld). The container was a 20 ft (6 m) shipping container that had been modified for use as a canteen. The modifications included the addition of an awning on one side of the container, pictured below (Figure 1).
Figure 1: View of the container showing the awning on one side
Source: Pacific National
At about 1900 Eastern Standard Time,[1] the nine loaded wagons were moved from the loading facility to Morandoo Yard where they were to be attached to the incoming service 7WB3 the next day.
On 16 June, at about 0840, a Pacific National (PN) terminal operator completed an inspection of the nine wagons, referred to by PN as an FX inspection (refer to section titled FX inspection). Upon completing that inspection, he issued a train inspection certificate for the nine wagons, indicating that no issues were identified.
Train 7WB3 was a service carrying mostly steel products, originating from Port Kembla, NSW, with a final destination of Brisbane, Qld. The train arrived at Morandoo early the next morning on 17 June. The nine wagons were attached to the rear of train 7WB3 by PN terminal operating staff and a brake pipe continuity test was performed.
Train 7WB3 journey to Taree
A train crew from Taree, consisting of two drivers, arrived at Morandoo at about 0500. The crew were to drive train 7WB3 from Morandoo to Taree, NSW. Train 7WB3 subsequently departed Morandoo yard at about 0510. On departure, the train consisted of 3 locomotives and 55 wagons with a mass of 4,090 t and length of 1,036 m. Two terminal staff performed roll-by inspections (refer to section titled Roll-by inspection), one from each side of the train as it departed and did not report any issues.
Train 7WB3 proceeded north and was confirmed to have arrived at Stroud Road (the location of a passing loop) and crossed[2] a southbound train, 7BM4. The crew of 7BM4 performed a roll-by inspection of 7WB3 and did not report any issues. Train 7WB3 departed Stroud Road at about 0731.
At about 0754, the Australian Rail Track Corporation (ARTC) network control officer (NCO) controlling the NSW north coast train control section ‘Coast A’ received a telephone call from a member of public who reported an open wagon ‘door’ toward the rear of train 7WB3. The NCO advised the crew of the reported open ‘door’ and the crew of 7WB3 subsequently requested to stop their train at Craven North Loop to inspect. When the train came to a stand at Craven North at about 0756, one of the crew alighted and proceeded to inspect the train.
Upon returning to the lead locomotive, the crew contacted the NCO at about 0824 and reported finding and resecuring an ‘open window’ on an ‘office container’ on wagon RQSY 34371M. The NCO subsequently cleared 7WB3 to proceed. Photographs taken of the container by the crew member before and after resecuring show that the ‘door’ and ‘window’ referred to above were the awning on the side of the container (Figure 1 and Figure 2). The container number, 2200655, was visible in Figure 2.
Figure 2: View of the container with the open ‘door’ and ‘window’ (awning)
The image shows the awning open when inspected at Craven North. The container number 2200655 is also visible on the end door.
Source: Pacific National
7WB3 continued its journey and at about 1049, crossed train 6422 near Taree. The crew of train 6422 advised that they had seen a ‘door’ open on a container on 7WB3.
At about 1050, train 7WB3 arrived at Taree, which was a crew change location. The departing Taree crew informed the arriving Brisbane crew that a ‘door’ on a container at the rear of the train had been opening. They also informed the ARTC NCO that the ‘window’ had opened again. The Taree crew then proceeded to the back of the train to resecure the awning. They reported that, after they resecured the awning they tried to force it open again by pulling on it and were not able to do so. They informed the Brisbane crew that it was resecured, who relayed the message to the ARTC NCO at about 1105.
Occurrence
Train 7WB3 subsequently departed Taree at about 1107 and continued its journey north. At about 1257, it crossed the southbound passenger service NT32 at Telegraph Point. PN advised that 7WB3 was stationary in the passing loop for the cross, with NT32 proceeding past it on the main line. Although one of the drivers of train 7WB3 recalled hearing a ‘crackle’ on the radio after train NT32 had passed, the drivers did not receive a roll-by inspection report from NT32, nor any other message.
After crossing 7WB3 at Telegraph Point, train NT32 proceeded south and struck an object on the track while crossing the Wilson River Bridge, a steel through-truss bridge (Figure 3).
Figure 3: View of the Wilson River Bridge
The southern access to the Wilson River Bridge, facing north. This view shows the steel through truss structure that the awning struck.
Source: Pacific National
At about 1309, after bringing his train to a stop, the driver of NT32 reported this to the ARTC NCO. The driver described the object that had been struck as a metal object, ‘something about the size of a car bonnet’ and ‘looked like it might have come off a freighter’. The driver also reported that he would inspect his train and look for the metal object on the bridge.
Based on the description of the track obstruction, the ARTC NCO contacted the crew of 7WB3 at about 1319 and requested that they pull up to inspect their train. Ten minutes later the train pulled-up at Kundabung, NSW, and one of the crew members alighted. The other crew member drove the train forward slowly so that the person on the ground could inspect the train as it passed.
Meanwhile, the driver of NT32 had advised the NCO that he had completed the inspection of his train and had cut out the number 1 brake cylinder on the leading locomotive due to damage from hitting the track obstruction, and that NT32 was able to depart. The driver did not report seeing any issues on 7WB3, but indicated that one of the passenger service staff on NT32 reported hearing something hit the side of the train as they crossed by 7WB3. He further stated that he had not been able to inspect the bridge, as there was no safe access on foot. Train NT32 continued its journey without further incident.
At about 1332, the crew of 7WB3 reported to the NCO that a ‘window’ was missing from a container. They further advised that they had removed any loose items from the container, that nothing remained out of gauge,[3] and that they were ready to depart. The NCO subsequently allowed 7WB3 to depart and the crew moved the train off from Kundabung at about 1347.
Post-occurrence
At about 1352, the NCO radioed the crew of 7WB3 and requested that they inspect the other side of the train at Kempsey. The NCO indicated that this request was in response to the report from NT32 of hearing something hit as they crossed 7WB3. The crew subsequently pulled up, inspected both sides of the train and reported that no further issues were found. Train 7WB3 departed Kempsey at about 1442 and completed its journey to Brisbane without further incident.
The damaged container was photographed by PN upon arrival at the Brisbane Freight Terminal (Figure 4). The damaged awning was subsequently recovered from the Wilson River (Figure 5).
Figure 4: View of the container showing the damage from the missing awning
Source: Pacific National
Figure 5: The damaged awning when recovered from the Wilson River
Container number 2200655 had been modified by Port Shipping Containers to include a large side opening that was about 1.2 m high by 3 m long, approximately one-quarter of one sidewall of the container (Figure 1). This opening was intended for use as an awning. During the sequence of events, notifications by the train crews and the Australian Rail Track Corporation (ARTC) network control officer (NCO) referred to the awning as a ‘door’ and ‘window’. It was understood that all such references were to the awning and not the container end doors.
The awning was constructed from a rectangular hollow section steel frame with the section of steel sheet that had been removed from the container side welded back into the frame. Another rectangular hollow section steel frame was welded to the opening in the container. The awning was attached to the container with three outward opening hinges along the top edge. A gas strut was mounted on each side to assist with opening and to support the weight of the awning when open.
The awning was held closed with two spring-loaded bolts accessed from the inside of the container (Figure 7). There was no locking mechanism provided that was accessible from the outside of the container. The bolts latched into holes in the outside frame, one of which is visible in Figure 8.
Figure 7: A view of one of the spring-loaded bolts used to hold the awning closed
Source: Pacific National
Figure 8: Detail view of one of the holes used for latching the spring-loaded bolts
Source: Pacific National
A Convention for Safe Containers (CSC) compliance plate[4] was affixed to the container. However, the manufacturer’s number on the compliance plate, QXIC 3255502, did not match the number applied to the container end door, 2200655 (which was visible in Figure 2 above). The section of the compliance plate identifying the owner of the container was blank. The plate does not appear to have been amended, or compliance re-checked after the modifications were made. In addition, the container number, 2200655, did not comply with the applicable Australian Standard for container numbering (AS3711.9), as it did not include owner code or category identification letters and was not displayed on the side of the container. While the reason for these discrepancies were unknown, they did not contribute to the occurrence.
Pacific National Freight Loading Manual
Pacific National (PN) maintained a document suite called the Freight Loading Manual (FLM), which provided instructions on the loading and carriage of rail freight on their rolling stock. PN stated that the FLM:
Has been produced to provide guidance in the basic safety principles which must be followed and in particular the precautions which must be taken to ensure the safe carriage of customers loading.
Sections of the FLM related to the carriage and security of containers, including modified containers, including:
FLM 01-12_04 Provisional load process
FLM 03-06_11 Container door security
FLM 03-14_07 Non-standard and modified containers.
Each section of the FLM listed above contained information and instruction relevant to the loading of the occurrence container. They included, on the first page of each section, identification of the parties that had a responsibility for that section. All the sections above listed, among others, either ‘terminal staff’, ‘terminal operators’ or ‘PN employees’ as responsible parties. Sections 03-06_11 and 03-14_07 also identify customers as responsible parties.
Loading and carriage of non-standard or modified containers
The FLM provided instruction on the loading and carriage of standard, non-standard or modified containers, which were defined in the FLM as:
Standard container:
In the context of this procedure the term standard containers refers to all solid containers fitted with end or side doors, locking rods and catches that are compliant to ISO [International Organization for Standardization] and AS/NZ [Australian/New Zealand] Standards.
Non-standard or modified container:
…any container that was either not manufactured to ISO/AS Standards or has been altered since manufacture.
The FLM further stated that ‘specific approval must be obtained from PN for the consignment of all non-standard or modified containers’. Without this approval, the load was not allowed to be transported. PN advised that this approval was to be obtained through the ‘provisional load process’.
PN reported that non-standard or modified containers made up a relatively small portion of the container traffic moved by rail. To quantify the relative rarity, PN indicated that the provisional load process had been used only three times to transfer modified containers in the 12 month period prior to the occurrence.
Provisional load process
The FLM contained a section specific to the provisional load process (01-12_04) which stated that the purpose of the process was:
…to ensure any freight that is transported which does not conform to a specific freight loading procedure can travel under a provisional approval on a Pacific National service.
The FLM stated that the customer was required to notify PN of the need for a provisional load approval. Further, it detailed the information that must be supplied by a customer when this approval was required, and that 5 working days was needed for PN to assess and process this request to grant approval. Where a provisional load approval had been granted, the process also required the load to be inspected for movement and restraint integrity at all terminals en route and during roll-by inspections.
However, in the case of this container, a provisional load process was not conducted as PN were not aware that the container was modified.
Information from customer
Port Shipping Containers reported that they did not consider the modifications they made to the container to be major or requiring re-certification. Further, prior to the occurrence, they did not know of a requirement to notify PN that the container had been modified prior to transport.
They estimated that the company was transporting approximately 50 modified containers per year by rail, although not all would have included side-opening awnings. They also indicated that an externally visible lock could be, and had been in the past, applied to awnings, but that this had only been done when requested by their end customer.
Container door security
Container security is a broad topic that includes theft prevention, load restraint and prevention of damage. In the context of this occurrence, container security was primarily of concern in terms of ensuring that container doors and other openings were prevented from opening during transit.
Securing doors on standard containers
The FLM contained a section specific to the requirements for securing standard container doors, which identified that:
Container doors when opened may swing out of gauge on a travelling wagon and strike track infrastructure including signals and bridges. They can also pose a serious and unacceptable risk to persons, by striking opposing trains, track workers or members of the public.
The FLM required that ‘all standard container doors travelling on Pacific National Intermodal services must be in good condition, be properly secured, and locked with an approved device/seal’. The FLM provided requirements and examples of how and where to apply approved devices (padlocks) and seals.
PN provided a photograph, taken when the container involved in the occurrence was later inspected at Brisbane Freight Terminal, showing an approved type of seal applied to the latch of the end door of the container (Figure 9).
Figure 9: Security seal on the end door of the container
Source: Pacific National
Applicability to non-standard or modified containers
The FLM section covering container door security identified that all non-standard or modified containers required specific approval (through the provisional load process) as they may ‘incorporate locking mechanisms other than those on standard containers’. The FLM further stated that ‘any item or structure that can protrude from the container and become out of gauge, regardless of placement on a wagon, must be adequately secured with a separate locking system’. It was also a requirement that the locking system be in operable condition, locked with a padlock or seal, and clearly visible to enable examination by PN train examiners.
Freight loading manual availability and familiarisation
PN indicated that the FLM was not a publically available document. Access to up-to-date versions of the FLM sections was provided to PN staff through their intranet, and to external parties, including customers, through an online portal.
PN indicated that staff received familiarisation with the FLM through their normal on-boarding processes and where appropriate, specific training activities. When a FLM part was updated or revised, change management procedures were in place to communicate the update to PN staff via a ‘safety advice’ notice.
At the time of the occurrence, PN did not have any processes in place to familiarise or notify customers or other external parties of the requirements of, and updates to the FLM.
Inspections at Morandoo
Two separate inspections were conducted prior to departure of train 7WB3 from Morandoo, NSW. These were an FX inspection of the nine loaded wagons, conducted prior to their attachment to the train, and a roll-by inspection of the complete train as it departed.
FX inspection
An FX inspection is a broad examination of many safety related items performed by a competent person. Of relevance to this occurrence was that it included a check of the security of all loads and equipment on the train. The inspection also included many other tasks such as checking the mechanical condition of all vehicles in a train, confirming the correct operation of the braking system, identifying any vehicles on the train with non-functioning brakes, and checking the make‑up of the train confirming that it was consistent with safe and efficient operations of the train.
Training
PN required FX inspections be conducted by terminal operators who had undertaken training in the loading and securing of freight. PN advised the ATSB that the terminal operator who undertook the inspection on the day had completed:
The nationally accredited unit of competency TLIA1001A - Secure Cargo in August 2014
Verification for competence for full train inspection (VOCFX) in January 2018
PN also provided course material for their training package PNE0001 Basic Freight – Load and secure freight that was specific to PN’s rail freight operations. However, PN did not indicate whether the terminal operator had completed this training.
The training course material did not cover the requirements for modified containers or refer specifically to the relevant FLM sections. While it did identify that checking locking devices and wagon doors was a requirement, it did not elaborate that these requirements extended to ‘any item or structure that can protrude from the container and become out of gauge’ as defined in the FLM for non-standard and modified containers.
Assessment checklist
PN inspectors were assessed on their ability to conduct the FX inspection through periodic verification of competency or VOCFX checks. The assessment checklist for the VOCFX, among other tasks, required inspectors be evaluated on inspecting loads, checking container locking devices, the security of wagon doors, and accessing the FLM through the intranet. However, there was no requirement for inspectors to be checked in identifying non-standard or modified containers and the follow-up actions required.
FX inspections also involved numerous other tasks such as checking of brake system condition and a mechanical check of rollingstock. While these items were not relevant to the occurrence, they did constitute a significant portion of the FX inspection and were required to be conducted on all rollingstock types regardless of what load was being carried. As such, they would be more routine FX inspection tasks than the inspection of locking devices on non-standard or modified containers, which were carried infrequently.
Roll-by inspection
A roll-by inspection is a visual inspection of moving rail traffic to identify equipment, loading security or other defects or failures. Roll-by inspections were routinely performed by terminal staff at departure terminals, disembarking crew at crew changes, and the crew of other trains when they passed each other on track.
Due to the nature of roll-by inspections, being a visual inspection of many moving wagons from a distance, they were generally considered to only be effective as a gross error check. Given that the awning was not open at the time of the departure roll-by inspection at Morandoo, there was no gross error present. Therefore, it was reasonable that no issue with the container was detected during this inspection.
Train crew actions in response to prior openings
It was reported that train crews could sometimes use wire as a temporary solution to resecure open locks and doors en route. However, this was not an option in the case of the awning as there were no suitable locations provided to apply wire onto. Therefore, short of removing the wagon with the effected container from the train, the crew had no options available to them with which to further secure the awning. While it was not known whether removal from the train was considered, given that they had been able to re‑close the awning, it appears reasonable that the crew did not remove the wagon from the train before continuing.
Crossing between trains NT32 and 7WB3
PN reported that train 7WB3 stopped in the passing loop at Telegraph Point to allow NT32 to pass on the mainline. PN also indicated that the container was loaded on the train with the awning on the down[5] side of the train. As Figure 10 shows, this meant that the driver of train NT32 did not have visibility of the damaged side of the container as his train was passing on the up side of 7WB3.
Figure 10: Train NT32 passing Train 7WB3 at Telegraph Point
Note: Distance references were from the Australian Rail Track Corporation Network information Book Coast A.
Source: ATSB
Similar occurrences
The ATSB has conducted several investigations where the load was partially or completely unrestrained and subsequently moved during transit. None of these involved non-standard or modified containers. Relevant findings are documented below:
RO-2018-003 Maitland, NSW, 16 January 2018: It was likely that the container was not effectively secured to the twist locks[6] at one end, which was almost certainly not detected during the train examination. The affected container subsequently shifted out of gauge and collided with the Maitland Railway Station verandah.
RO-2015-013 near Bowser, Victoria, 24 July 2015: The twist locks designed to secure two containers to a wagon were in an unserviceable condition, which was not identified during pre‑loading inspections. Subsequently, the two containers were not adequately restrained and fell from the moving train in strong winds.
RO-2014-022 Great Western, Victoria, 9 December 2014: The load restraint and securement method used, in conjunction with a likely wagon hunting condition, allowed part of the load (a skeletal road trailer) to shift laterally and strike a bridge as the train passed.
2005/006 Eden Hills, South Australia, 30 September 2005: Inadequate load securement permitted movement of metal plates loaded on a container. Inspections by both the freight forwarder and the rollingstock operator did not detect the inadequate load securement. The metal plates subsequently moved out of gauge and struck a passenger train on an adjacent track.
In addition, the NSW Office of Transport Safety Investigation conducted an investigation into a 2010 incident (Investigation 04480). The findings included that the side gates of a container had come open during transport and swung out of gauge because their locking pins had dislodged from their retaining lugs. Inspections by several road and rail operators did not identify the inadequate restraint. Subsequently, one of the gates struck two platforms at Woy Woy Station, NSW, causing it to become dislodged from the train and strike a glass windbreak on the platform. __________
While on the journey from Morandoo (Newcastle), New South Wales (NSW) to Brisbane, Queensland, the awning of a modified container being carried by train 7WB3 had come open on two occasions, but was subsequently closed by the crew. When the awning again opened, it struck the steel structure of the Wilson River Bridge, near Telegraph Point, NSW, and separated from the container. Train 7WB3 continued north and passed the south-bound passenger service NT32. Shortly after, NT32 struck the awning, sustaining minor damage.
When train 7WB3 passed, the driver of NT32 had the opportunity to perform a roll-by inspection. By that time, the awning had become separated. However, as the awning opening and damage to the container was on the other side of the train (down side), it would not have been visible to the driver.
While a staff member on NT32 heard something hitting the side of the train when passing 7WB3, the subsequent inspection of both sides of 7WB3 by the crew did not find any evidence to indicate that there was train-to-train contact.
There was no evidence to suggest that the handling of either train, the condition of the rollingstock or track geometry contributed to the occurrence.
This analysis will examine the locking system on the container and why the absence of an externally visible lock was not detected during the pre-departure train inspection. Further, it will discuss Pacific National’s (PN) requirements regarding non-standard/modified containers, how this information was communicated to customers and the training and assessment for loading and security of freight.
Awning locking system
PN’s loading requirements, as documented in the Freight Loading Manual (FLM), required that any side opening be secured with a locking system incorporating a padlock or other approved seal. This requirement existed regardless of whether the container was a standard or modified container. The FLM further stipulated that, for an addition that could protrude outside the normal gauge of a modified container such as an awning, the locking system was required to be externally visible. These requirements served the dual purpose of providing assurance that the openings remained securely closed and to enable examination by staff.
The side-opening awning on the modified container was held closed by spring-loaded bolts positioned on the inside of the awning. There was no mechanism provided for applying a lock directly to the bolts or separately to the inside or outside of the awning. As such, the container did not comply with PN’s requirements for an externally visible locking system. It also meant that there was no option available for the train crew to externally secure the awning during the journey.
Detection of modified container
The modified container was loaded onto one of nine wagons that were to be attached to train 7WB3 at Morandoo, NSW. An FX inspection was undertaken on the wagons by a qualified inspector and was to include checking container locking devices and ensuring that wagon doors were secured. Likewise, the FLM also required the locking system used on all external openings to be examined. As such, the inspector was required to check for a locking system on the container end doors (which were appropriately sealed) and the side-opening awning (which had no locking mechanism present).
However, a train inspection certificate was issued for the nine wagons despite the awning not having the required externally visible locks. Therefore, it was likely that the inspector did not identify that the container was modified and the awning was not secure when he conducted his inspection.
It is likely the chance of identifying the container was modified was influenced by the numerous other more routine FX inspection tasks required, such as checking of brake system condition and a mechanical check of rollingstock. In addition, there was no expectation of a modified container due to the lack of notification from the customer. It is also possible that a lack of internal training on the requirements of checking modified containers had the potential to influence the chance of detecting such containers.
Notification of modified container
The FLM defined non-standard or modified containers as ones that were not manufactured to the required standards or had been altered since manufacture. The presence of the Convention for Safe Containers (CSC) plate on the container indicated that it was initially manufactured as a 20 ft container in accordance with the standards. It was subsequently modified, including the addition of a side-opening awning, and therefore met PN’s definition of a modified container.
While the organisation (customer) who modified the container did not consider the awning to be a substantial modification, they were not aware of the requirement to notify PN of this addition. As a result, the provisional load process was not undertaken by PN, which removed an opportunity for them to assess the modification and ensure that it was adequately secured prior to transport.
Inform external parties of FLM requirements
The FLM detailed the requirements for the preparation and loading freight for transport, which was available to customers through an online portal. However, PN did not have any process in place to inform customers when they had a responsibility under the FLM or to ensure that they complied with the appropriate requirements. Consequently, in this case, the customer was not aware of the need to advise PN that the container had been modified. Further, as the FLM was applicable to all freight travelling on PN trains, the absence of a process potentially had broader implications.
Internal training
The FLM indicated that terminal operators, including inspection staff, were responsible for checking the security of locking systems on non-standard or modified containers. However, the operator’s training course for the loading and security of freight did not reinforce the FLM requirements as it did not include any reference to this obligation.
In addition, when inspection staff were being checked on their ability to conduct the FX inspection (verification of competency), there was no requirement to assess if the inspector was able to identify a non-standard or modified container and what follow-on actions were required.
The terminal operator had access to the requirements through the FLM and it was unknown if he had participated in the training course. Therefore, it could not be determined if the lack of reference to these types of containers in the training and during the periodic assessment contributed to the operator not identifying the modified container during the FX inspection in this instance.
Despite this, the FX inspections form the last line of defence to prevent unsafe non-standard or modified containers from being allowed onto the network where they may result in significant risk to other trains, infrastructure and passenger services. Consequently, this removed an opportunity for the requirements to be reinforced and practiced during training and regular checking of inspection staff. The opportunity for practice was of particular importance given that these containers were relatively uncommon and therefore, the required process was not applied on a regular basis.
Findings
From the evidence available, the following findings are made with respect to the track obstruction due to the loss of freight involving train 7WB3 and subsequent impact of passenger service NT32 with a track obstruction on the Wilson River Bridge, south of Telegraph Point, New South Wales, on 17 June 2018. These findings should not be read as apportioning blame or liability to any particular organisation or individual.
Safety issues, or system problems, are highlighted in bold to emphasise their importance. A safety issue is an event or condition that increases safety risk and (a) can reasonably be regarded as having the potential to adversely affect the safety of future operations, and (b) is a characteristic of an organisation or a system, rather than a characteristic of a specific individual, or characteristic of an operating environment at a specific point in time.
Contributing factors
The awning on a modified container that was being carried on a freight train separated after opening in transit and striking a bridge, obstructing the track on the bridge. A passenger train struck it, damaging brake equipment on the leading bogie.
The awning on the modified container was only held closed by spring-loaded bolts accessed from the inside without a mechanism for applying a lock. This was not compliant with the Pacific National Freight Loading Manual, which required a locking system that was externally visible to assure openings remained secure and enable examination by inspection staff.
Terminal staff did not identify that the awning on the container did not have externally visible locks during inspections prior to departure from the yard. This was likely due to them not identifying that the container was modified.
The container was modified to include a large side opening awning on one side. The organisation requiring transport of the container were not aware of the requirement to notify Pacific National that it was modified. Consequently, this removed an opportunity for Pacific National to be aware of the need to assess the modifications against the Freight Loading Manual requirements.
While the Freight Loading Manual was available to customers, Pacific National did not actively advise them when they had a responsibility identified by the manual. Further, they did not have a process for ensuring that customers complied with the manual’s requirements. [Safety issue]
Other factors that increased risk
Pacific National's training course for the loading and securing of freight, and their verification of competency checks for inspection staff, did not include the Freight Loading Manual requirements for non-standard and modified containers. [Safety issue]
Safety issues and actions
The safety issues identified during this investigation are listed in the Findings and Safety issues and actions sections of this report. The Australian Transport Safety Bureau (ATSB) expects that all safety issues identified by the investigation should be addressed by the relevant organisation(s). In addressing those issues, the ATSB prefers to encourage relevant organisation(s) to proactively initiate safety action, rather than to issue formal safety recommendations or safety advisory notices.
Depending on the level of risk of the safety issue, the extent of corrective action taken by the relevant organisation, or the desirability of directing a broad safety message to the rail industry, the ATSB may issue safety recommendations or safety advisory notices as part of the final report.
Advise relevant external parties of container loading requirements and check for compliance
Safety issue description: While the Freight Loading Manual was available to customers, Pacific National did not actively advise them when they had a responsibility identified by the manual. Further, they did not have a process for ensuring that customers complied with the manual’s requirements.
Education on loading and inspection of modified containers
Safety issue description: Pacific National's training course for the loading and securing of freight, and their verification of competency checks for inspection staff, did not include the Freight Loading Manual requirements for non-standard and modified containers.
Additional safety actions
Whether or not the ATSB identifies safety issues in the course of an investigation, relevant organisations may proactively initiate safety action in order to reduce their safety risk. The ATSB has been advised of the following proactive safety action in response to this occurrence
Pacific National
Transportation of containers
As a result of this incident, Pacific National have made changes to how non-standard and modified containers are transported. Only their major freight terminals that are staffed by Pacific National employees will be accepting these containers for transport.
Load incident management procedure
Pacific National have reviewed and updated their load incident management procedure to ensure all load irregularity events are accurately identified, captured and investigated to ensure learnings are shared. Awareness packages have also been delivered to all Pacific National stakeholders as part of the change management program with the implementation of the revised procedure.
Sources and submissions
Sources of information
The sources of information during the investigation included the:
Australian Rail Track Corporation
Pacific National
New South Wales Trains
Port Shipping Containers.
References
Standards Australia. (2000). AS 3711.9-2000 Freight containers – Part 9: Coding, identification and marking. Standards Australia International Ltd: Strathfield, New South Wales.
Under Part 4, Division 2 (Investigation Reports), Section 26 of the Transport Safety Investigation Act 2003 (the Act), the Australian Transport Safety Bureau (ATSB) may provide a draft report, on a confidential basis, to any person whom the ATSB considers appropriate. Section 26 (1) (a) of the Act allows a person receiving a draft report to make submissions to the ATSB about the draft report.
A draft of this report was provided to Pacific National, Port Shipping Containers, New South Wales TrainLink, Australian Rail Track Corporation and the Office of the National Rail Safety Regulator.
A submission was received from Pacific National. The submission was reviewed and, where considered appropriate, the text of the report was amended accordingly.
Purpose of safety investigations
The objective of a safety investigation is to enhance transport safety. This is done through:
identifying safety issues and facilitating safety action to address those issues
providing information about occurrences and their associated safety factors to facilitate learning within the transport industry.
It is not a function of the ATSB to apportion blame or provide a means for determining liability. At the same time, an investigation report must include factual material of sufficient weight to support the analysis and findings. At all times the ATSB endeavours to balance the use of material that could imply adverse comment with the need to properly explain what happened, and why, in a fair and unbiased manner. The ATSB does not investigate for the purpose of taking administrative, regulatory or criminal action.
Terminology
An explanation of terminology used in ATSB investigation reports is available here. This includes terms such as occurrence, contributing factor, other factor that increased risk, and safety issue.
Publishing information
Released in accordance with section 25 of the Transport Safety Investigation Act 2003
Ownership of intellectual property rights in this publication
Unless otherwise noted, copyright (and any other intellectual property rights, if any) in this report publication is owned by the Commonwealth of Australia.
Creative Commons licence
With the exception of the Coat of Arms, ATSB logo, and photos and graphics in which a third party holds copyright, this publication is licensed under a Creative Commons Attribution 3.0 Australia licence.
Creative Commons Attribution 3.0 Australia Licence is a standard form licence agreement that allows you to copy, distribute, transmit and adapt this publication provided that you attribute the work.
The ATSB’s preference is that you attribute this publication (and any material sourced from it) using the following wording: Source: Australian Transport Safety Bureau
Copyright in material obtained from other agencies, private individuals or organisations, belongs to those agencies, individuals or organisations. Where you wish to use their material, you will need to contact them directly.
Occurrence summary
Investigation number
RO-2018-010
Occurrence date
17/06/2018
Location
Wilson River Bridge between Telegraph Point and Wauchope
On the evening of 15 August 2018, a Boeing 737-376 Special Freighter, registered VH-XMO, operated by Express Freighters Australia, was transporting freight from Brisbane Airport, Queensland to Melbourne Airport, Victoria when the master caution and a right wing-body overheat annunciator illuminated.
The non-normal checklist was actioned followed by further troubleshooting in consultation with maintenance personnel. This resulted in a reduction of cabin pressure. The crew donned oxygen masks and the aircraft was entered into an emergency descent. During the initial part of the descent the captain was temporarily incapacitated by a reaction to the increased supply of breathing oxygen from the mask. A MAYDAY was declared by the first officer and the aircraft was diverted to Canberra Airport, Australian Capital Territory. During the diversion, the first officer also experienced incapacitating symptoms. The aircraft landed at Canberra Airport, under the control of the captain, with no further issues.
What the ATSB found
The ATSB found that faults in the right wing-body overheat detection system likely led to intermittent flickering of the master caution light and illumination of the right wing-body overheat annunciator. The operating flight crew conducted the appropriate non-normal checklist, however the overheat indication could not be rectified due to the fault in the wing-body overheat detection system.
An additional fault with an isolation valve in the aircraft pressurisation system prevented isolation of the right wing-body pressure duct. This led the crew to conduct further troubleshooting during which the cabin air supply was reduced. In conjunction with a higher than normal cabin leak rate, the reduced airflow also lessened the cabin pressure.
The flight crew responded to the cabin pressure reduction by donning their oxygen masks and descending the aircraft. During the descent, the captain selected emergency flow on the oxygen mask resulting in an ingestion of gaseous oxygen, causing a temporary incapacitation. After the flight was diverted to Canberra, the first officer experienced symptoms consistent with hyperventilation, leading the captain to declare the first officer incapacitated.
Post‑occurrence medical testing and assessments were carried out on the flight crew with no effects from the flight identified. During post flight inspections, Qantas engineers identified a range of serviceability issues with the aircraft fuselage cabin drain valves, fuselage door seal, and the auxiliary power unit duct bellow seal that affected the capacity for the aircraft to hold cabin pressure.
What has been done as a result
The operator advised the ATSB that, following the occurrence, amendments were incorporated into the approved scheduled maintenance program to:
incorporate a functional check of the cabin drain valves
specifically verify the integrity of the auxiliary power unit duct bellows seal
introduce an enhanced aircraft cabin pressurisation system check.
The operator implemented an inspection regime to ensure timely detection and rectification of faults compromising the operation of the wing-body overheat detection system.
The operator also advised that in‑flight troubleshooting outside of the non-normal checklist procedures and Flight Crew Operations Manual is now prohibited.
Safety message
This occurrence is a reminder to flight crew of the hazards of dealing with system malfunctions that are not resolved using the approved non-normal checklist procedures. In such circumstances, associated system effects need to be taken into account when electing to conduct further troubleshooting outside of the non‑normal procedures, even with the assistance of external maintenance specialists. Configuration changes to an aircraft system may induce other effects due to underlying unserviceable components that may not be immediately apparent.
The ATSB also reminds flight crew to be cognisant that a non‑normal situation can lead to a misapplication of emergency equipment in the moment that it is actually needed. In this case the selection of the emergency flow setting on the fixed oxygen system resulted in temporary incapacitation of the captain.
Finally, a sequential series of non‑normal events, in conjunction with the use of emergency equipment, can add pressure and workload to the flight crew. Though it would seem unlikely to occur, these pressures may result in hyperventilation, increasing the potential for incapacitation during a critical phase of the flight.
The occurrence
On 15 August 2018, a Boeing 737-376 Special Freighter (SF), registered VH-XMO, and operated by Express Freighters Australia, was conducting a flight from Brisbane Airport, Queensland to Melbourne Airport, Victoria. The operating flight crew comprised of a captain and first officer. There were no passengers. The aircraft departed Brisbane at 1206 Coordinated Universal Time (UTC)[1] and climbed to a cruising altitude of Flight Level (FL) 260.[2]
At 1300 the flight crew observed a momentary illumination of the master caution[3] light within the flight deck of the aircraft. The master caution then began to flicker with increasing frequency. After about 2 minutes of continuous flickering, the flight crew identified illumination of the right wing-body overheat annunciator, indicating a possible bleed air leak from the ducting of the right wing.
The flight crew consulted the quick reference handbook (QRH)[4] and conducted the non-normal checklist[5] procedure for a right wing-body overheat annunciator alert. This procedure removed bleed air pressure from the right wing bleed air duct by closing the isolation valve, switching off the right air conditioning pack, and turning off the bleed air source from the right engine.
Following completion of the non-normal procedure, the right wing-body overheat annunciator remained illuminated and the master caution light continued to flicker. Additionally, the right wing‑body duct pressure gauge in the cockpit displayed a residual pressure of 14 pounds per square inch (psi),[6] indicating to the crew that the duct remained pressurised despite that system being isolated. The flight crew, concerned with the potential for leakage of high temperature bleed air into the right wing, contacted Sydney Line Maintenance Operations by VHF radio for technical assistance.
In consultation with a Sydney Line Maintenance Operations engineer, the flight crew began a process of troubleshooting with the intention of isolating the bleed air duct and extinguishing the right wing‑body overheat annunciator light. The flight crew advised of the already completed steps and discussed the non-normal checklist with the engineer. The engineer advised the flight crew to cycle components of the system and monitor the right bleed air duct pressure.
After noting that the residual pressure was lowest when the right pack was switched to AUTO the engineer assessed that the right wing-body overheat annunciator light was likely an erroneous warning. However, the engineer recommended that the right pack remain in AUTO for the remainder of the flight. Following receipt of that advice, contact with the engineer ceased due to the aircraft proceeding out of VHF radio range.
While continuing the flight toward Melbourne, the first officer conducted an instrument scan and identified the cabin pressure differential at 5 psi.[7] The cabin altitude[8] registered 6,000 ft and was increasing at 600 feet per minute. The flight crew discussed the rising cabin altitude, also commenting to each other that they both felt slightly unwell. The first officer recalled that the physical symptoms were not consistent with hypoxia[9] and became concerned about the possibility of incapacitation due to fumes within the cockpit. As the cabin altitude continued to climb and anticipating that it would exceed 10,000 ft,[10] the flight crew elected to don the emergency oxygen masks.
At 1325, the captain contacted air traffic control requesting a descent to FL 200. Air traffic control subsequently cleared the aircraft for a descent to FL 250. The captain immediately responded with a PAN PAN[11] call and advised air traffic control that they were descending the aircraft to FL 200.
At the commencement of the descent, the first officer switched the right air conditioning pack from AUTO back to OFF as per the original non-normal checklist instruction. This commanded the left pack into high flow mode, increasing and restoring air flow into the cabin.
During the initial stages of the descent the captain reported that after manipulating the mask settings an ingestion of pressurised oxygen occurred. This resulted in a choking and gagging response from the captain. The first officer, cognisant that they had previously discussed feeling unwell, observed the captain slumped forward, gagging, and gasping for air. The first officer recalled checking on the captain during this episode but not receiving a response.
At 1326, approximately 19 km north of Narrandera Airport, New South Wales, the first officer broadcast a MAYDAY[12] to air traffic control advising that they had issues with the aircraft and had commenced an emergency descent.[13] Air traffic control acknowledged the MAYDAY and advised the first officer that there was no other reported Instrument Flight Rules[14] aircraft traffic for their descent to 10,000 ft.
During the emergency descent, the captain recovered and subsequently removed their oxygen mask. Both the captain and first officer noted that oxygen could be heard continuously flowing from the captain’s mask. Due to their ongoing concern of fumes within the cabin, the first officer elected to remain on oxygen.
Air traffic control contacted the flight crew regarding their intentions to either continue to Melbourne or divert to an alternate airport. The first officer responded with a request for information on the lowest safe altitude for the area, and a heading for an immediate landing at Canberra Airport, Australian Capital Territory. After receiving direction from air traffic control, the captain elected to further descend the aircraft to 8,000 ft and tracked the aircraft toward Canberra.
During the diversion, the oxygen supply from the fixed onboard system depleted. In response, the first officer, who had elected to remain on breathing oxygen, retrieved and connected to the portable oxygen unit that was mounted on the bulkhead at the rear of the flight deck. While transferring to the portable oxygen system, the first officer also attempted to operate an iPad in preparation for the instrument approach to Canberra Airport. The captain recalled being unable to gain the first officer’s attention during that sequence. The first officer eventually responded to the captain, advising they were feeling unwell and had severe back pain.
The captain then instructed the first officer to transition to an observer-pilot role for the remainder of the flight. The captain subsequently declared a PAN PAN radio call to air traffic control informing of the first officer’s incapacitation and requested the attendance of emergency services on arrival at Canberra Airport.
At 1404, the flight landed at Canberra Airport and once the aircraft had been shut down, aviation rescue fire fighters entered the aircraft cabin and conducted an air sample test. No fumes were detected. Both the captain and first officer were transported to hospital via ambulance for medical assessment.
Following the occurrence, the ATSB retrieved the aircraft’s flight data recorder (FDR). A range of parameters were automatically recorded by the FDR including those associated with the cabin warning and aircraft pressurisation systems. ATSB’s download of the FDR showed that the total duration of the occurrence flight had been recorded. A plot of the relevant parameters relating to the environmental system is displayed at Figure 1. The following primary events were identified:
At 1259 UTC the master caution proceeded to rapidly flicker on and off for a period of 10 minutes, which correlated with the flight crew’s account.
At 1301 UTC the right air conditioning pack (ECS)[15] turned OFF, the left and right packs both signalled a switch to high flow, and the right engine bleed air turned OFF. These events were consistent with the crew actioning the non-normal checklist.
The FDR data showed that, at 1315 UTC, the right air conditioning (ECS) pack was switched ON and OFF multiple times in a short period. The left pack had switched between high- and low-flow modes. The right pack had also switched between high- and low-flow modes. These events correlated with the troubleshooting period conducted by the flight crew and the engineer at Sydney.
The FDR data recorded that, at 1325 UTC, the right air conditioning pack was turned OFF and the signals for the left and right packs had switched to high flow. The aircraft altitude then reduced rapidly signalling the commencement of the emergency descent.
Throughout the flight and reported period of cabin pressurisation problems, the FDR information showed that the cabin altitude did not exceed 10,000 ft.
Cockpit voice recorder
Following arrival to Canberra Airport, the aircraft was powered by engineers to facilitate maintenance action on the bleed air system and the wing-body overheat detection system. The cockpit voice recorder was not isolated during these activities and consequently the audio data was overwritten and not available for this investigation.
Figure 1: Recorded data from the occurrence flight.
Displayed is the master caution warning status, air conditioning system status and crew troubleshooting actions during the conduct of the flight through to the emergency descent and landing.
Source: ATSB
Pilot information
Captain
The captain held an Air Transport Pilot (Aeroplane) Licence issued on the 13 September 2012 and a multi-engine command instrument rating. The captain held an Australian Class 1 Aviation Medical Certificate that was valid until 12 November 2018.
The captain had been a company employee for about 8 years, initially as a first officer and then as a captain for the last 3 years. The captain was also a simulator instructor and a 737 ground training instructor with the company. At the time of the occurrence the captain had approximately 4,500 flying hours with 3,400 of those on the 737-aircraft type.
The captain last completed a flight review with the company on 18 February 2018.
First officer
The first officer held an Air Transport (Aeroplane) Pilot Licence issued on the 27 Jun 2014 and a multi-engine command instrument rating. The first officer held an Australian Class 1 Aviation Medical Certificate that was valid until 29 May 2019.
The first officer had been a company pilot since 26 September 2016. At the time of the occurrence, the first officer had approximately 5,000 hours total flying time with 700 of those operating the 737 aircraft-type.
Aircraft information
General
The Boeing 737-376 Special Freighter (SF) was originally manufactured as a passenger aircraft in the United States in 1987, before being converted for air freight operations. At the time of the occurrence the aircraft had accrued a total of 72,255 hours and 44,030 flight cycles. Express Freighters Australia operated four of this aircraft type within their national fleet service under the Express Freighters Australia air operator’s certificate.
Aircraft systems
Air conditioning and pressurisation system
The aircraft air conditioning and pressurisation system is designed to keep the flight crew comfortable within the cabin by maintaining adequate air flow, temperature, and pressure. Air temperature is controlled by processing bleed air from the engines in two air conditioning packs.[16] Conditioned air from the left pack flows directly to the flight deck. Excess air from the left pack and air from the right pack is combined in a mix manifold and distributed to the cargo cabin (Figure 2).
During normal operation, the left pack uses bleed air from the left engine and the right pack uses bleed air from the right engine. An isolation valve allows the left and right bleed systems to connect. Engine bleed air is obtained from stage five and nine of the compressor section. When stage-five low pressure bleed air is insufficient for the bleed air system requirement, the stage-nine valve modulates to maintain adequate bleed air pressure.
Figure 2: Air conditioning schematic for the Boeing 737-300 series aircraft showing the configuration of the system during normal operation
The left air conditioning pack is supplied by stage-five bleed air from the left engine and the right air conditioning pack is supplied by stage-five bleed air from the right engine. The left and right engine stage-nine valves modulate open if stage-five bleed air is insufficient for system requirements.
Source: Express Freighters Australia, annotated by the ATSB.
With both air conditioning pack switches in AUTO and both packs operating, the packs provide ‘normal’ air flow. However, with one pack not operating (OFF position), the other pack automatically switches to ‘high’ air flow to maintain the necessary ventilation rate. To ensure adequate engine power for single-engine operation the automatic switching is inhibited when the aeroplane is on the ground, or in-flight with the flaps extended. With the air conditioning pack switch in HIGH, the pack provides ‘high’ air flow.
A single pack when selected to HIGH flow mode is capable of maintaining cabin pressurisation and acceptable temperatures throughout the aeroplane up to the maximum certified ceiling of 37,000 feet.
A cabin pressurisation controller modulates the cabin pressure via an outflow valve. The cabin pressurisation controller normally controls the cabin altitude rate of climb as well as the cabin altitude. The system has both an aural and visual warning for cabin altitudes above 10,000 ft, a level requiring flight crew to use supplementary oxygen.
Oxygen system
The B737-300SF is fitted with a fixed oxygen system designed to provide oxygen to the flight crew in the event of high cabin altitude (such as an aircraft depressurisation) or compromised air within the cockpit due to fumes and/or smoke. The B737-300SF is equipped with a 76 cubic foot oxygen cylinder (approximately 2,152 litres) for flight crew supply. Oxygen pressure is displayed on the indicator located on the rear overhead panel and the flow level is controlled through a pressure-reducing regulator, to reduce supply to a breathable pressure.
Each crew position is fitted with an oxygen mask that is stowed in a box immediately adjacent to each crew seat. The mask has selectable features that permit the crew to select either 100 per cent oxygen when contamination of the flight deck air exists or a NORMAL position which provides an air/oxygen mixture (Figure 3). The mask regulator also provides an EMERGENCY setting which is used when needed to supply positive pressure in the masks and goggles to remove contaminants.
The aircraft is also fitted with a flight crew portable oxygen bottle. This is a self-contained oxygen system, offering both demand and constant flow capabilities. The portable oxygen cylinder is installed behind, and adjacent to, the first officer’s seat.
Figure 3: Oxygen mask and regulator fitted to the Boeing 737-300 series aircraft
A push button switch activates the pilot oxygen system for normal use. A rotary dial is used to enable the emergency flow mode.
Source: Express Freighters Australia, annotated by the ATSB.
Post-flight aircraft maintenance
Following the occurrence the aircraft was examined and tested by Qantas engineers at Canberra Airport with the following defects identified:
Aircraft pressurisation
An engine ground run was conducted to simulate the conditions encountered during the flight. That test identified that the aircraft was unable to maintain cabin pressure. Minor leakage of bleed air was discovered on the right-wing leading-edge ducting. The leak was rectified on tightening of the duct clamp.
It was also identified that the isolation valve between the left and right systems was not completely closing, resulting in leakage and the right bleed air duct to remain partially pressurised (Figure 2).
Finally, during single-pack operation in NORMAL flow, the aircraft was unable to maintain differential cabin pressure. The Qantas engineers identified that this was due to:
leakage of multiple cabin drain valves
minor door seal leaks
damage to the auxiliary power unit bleed air duct bellows and clamp.
Those defects created a cabin air escape route through the pressure bulkhead.
Overheat detector
A resistance check of the right wing-body overheat detector elements was completed in Canberra. The engineers identified that the centre wing-body overheat detector element was found out of tolerance and unserviceable. The overheat detector element along with an associated electrical connector was subsequently replaced. No additional faults were found with that system.
Oxygen system and fumes detection
Air sampling from the flight deck was conducted during extended engine operations. No evidence of fumes or odour was detected. The air quality testing showed no abnormal issues associated with carbon dioxide, carbon monoxide or particulate concentrations. The oxygen masks for the captain and first officer were inspected and tested. During replenishment of the aircraft oxygen system, the engineers reported that the captain’s mask had been set to emergency flow. No defects were identified with the oxygen masks.
Operational information
Flight crew operations manual
The Flight Crew Operations Manual (FCOM) was the primary flight crew reference for the operation of the aircraft along with the relevant checklists for normal, non-normal, and emergency conditions.
Non-normal checklists
Non-normal checklists were used by the flight crew to manage unexpected events that affect the normal operating procedures of the aircraft. Illumination of the master caution and system annunciator lights indicate a non-normal condition and are the cues to select and carry out the associated checklist.
Non-normal checklists begin with steps to correct the situation and, if needed, information for planning the rest of the flight. In all instances, the operator’s procedures require the captain to assess the situation to determine the safest course of action. The operator also noted that if further troubleshooting is determined to be the safest course of action, taking steps beyond published non-normal checklist steps may cause further loss of system function or a system failure. Consequently, the operator’s guidance to their pilot’s was that troubleshooting should only be considered when completion of the published non-normal checklist results in an unacceptable situation.
Non-normal checklists also have a list of assumptions. Assumptions relevant to this occurrence were listed within the FCOM:
- If the master caution and system annunciator lights illuminate, all related amber lights are reviewed to assist in recognising the cause(s) of the alert. Aural alerts are silenced, and the master caution system is reset by the flight crew as soon as the cause of the alert is recognised.
- The EMERGENCY position of the oxygen regulator is used when needed to supply positive pressure in the masks and goggles to remove contaminants. The 100% position of the oxygen regulator is used when positive pressure is not needed but contamination of the flight deck air exists. The Normal position of the oxygen regulator is used if prolonged use is needed, and the situation allows. Normal boom microphone operation is restored when oxygen is no longer in use.
Flight administration manual
The Express Freighters Australia Flight Administration Manual (FAM) was for the use of crew members and guidance for other personnel in dealing with matters associated with the operation of company aircraft. The FAM defined the policies, standards and procedures to be adhered to under all circumstances.
System failures and in-flight troubleshooting
The FAM stated that a component or system failure in flight should be dealt with according to established procedures, including completion of any associated checklist. Crew troubleshooting of system problems should not normally be attempted in flight unless there is an overriding operational requirement to do so, or where it may assist subsequent rectification. Before attempting any troubleshooting, flight crew were to attempt to contact Maintenance Watch for further guidance.
Medical information
Post occurrence, both flight crew were transported to hospital. Assessments and blood tests were carried out with no markers or indicators of a fumes event detected. The first officer recalled still feeling ‘dizzy’ and ‘foggy’ with a dry throat and lips during this time. The flight crew were subsequently released from hospital with no ongoing effects from the occurrence.
The flight crew were individually interviewed and medically assessed by their company doctor. It was reported to the ATSB that the first officer’s symptoms of tingling in the fingers and lips, along with the muscle tension were consistent with hyperventilation, although the symptoms can be confused with hypoxia or fume inhalation. An additional assessment of the symptoms was provided to the ATSB by an aviation medicine specialist, who similarly concluded that the first officer had developed hyperventilation as a response to the severity of the emergency.
Hyperventilation
Hyperventilation can be induced from rapid or deep breathing resulting from anxiety or panic. It occurs when the rate or tidal volume of breathing eliminates more carbon dioxide than the body can produce. The symptoms can be lingering and include dizziness, tingling in the lips, hands or feet, headache, weakness, fainting and seizures.
Nias (1998) explains that over-breathing can occur as part of the classic ‘fight-or-flight’ response as the body involuntarily prepares for action. Gradwell (2006) explains that even moderate hyperventilation has the potential to significantly impair motor skills, which, for a pilot, may lead to a reduced capacity to perform the necessary complex actions associated with the operation of an aircraft. Hyperventilation for aircrew can occur under certain conditions:
exposure to low-frequency vibration
during positive-pressure breathing
the mental stress of a sudden in-flight emergency
anxiety, apprehension, and fear.
Related occurrences
The ATSB research publication AR-2015-096 reviewed occurrences reported to the ATSB from 2010 to 2014. The publication identified 113 cases of pilot incapacitation with 86 of those in multi‑crew, high-capacity transport operations. Almost half of the incapacitation events for those pilots was due to gastrointestinal illnesses, such as food poisoning or gastroenteritis. There were no reported instances involving incapacitation due to hyperventilation.
The review indicated that most incapacitation occurrences do not involve a chronic or pre-existing medical condition and are largely unforeseeable events. Many are not in themselves life threatening but are capable of impairing pilot performance to the extent that safe operation of the aircraft may be adversely affected.
In most of the occurrences, the incapacitation was severe enough for the pilot to be removed from duty for the remainder of the flight. The ATSB found that approximately 10 per cent of the incapacitating events resulted in a return to the departure airport or a diversion to another airport.
ATSB investigation report AO-2013-120 describes the response to smoke in the cockpit by the flight crew of a Bombardier DHC‑8‑315. The crew found that communication became difficult once their oxygen masks had been donned. As a result, the crew removed their oxygen masks for the remainder of the flight to improve communication. However, that action increased the risk of crew impairment or incapacitation as there was still smoke in the cockpit.
The stress associated with the smoke resulted in a high workload for the crew and adversely affected their performance, leading to errors in aircraft management and checklist completion. This occurrence also highlighted the importance of flight crew familiarising themselves with the operation of the onboard emergency equipment.
The following analysis details the technical and operational issues encountered by the crew of a freight flight that led to pilot incapacitation during an emergency descent and diversion to Canberra Airport.
Aircraft depressurisation
While cruising at Flight Level 260, the flight crew observed the illumination and rapid flickering of the master caution light. Approximately 2 minutes later, the first officer identified the annunciator light for the right wing-body overheat was also illuminated. The concern from such an alert for the flight crew was the potential leakage of hot bleed air gases within the wing cavity damaging wiring and the internal structure of the wing. While various recommended actions were attempted to extinguish the warnings, the flight crew efforts were unsuccessful, and the flickering continued for approximately 10 minutes.
Though the flickering master caution and overheat annunciator light eventually extinguished, it is likely that these alerts were due to an electrical fault with the aircraft detection system rather than the result of elevated temperature within the wing body. After landing, maintenance engineers established that the centre conductor from a sensor within the overheat detection system was out of specification, leading to the observed erroneous system behaviour.
Actioning the non-normal checklist associated with the right wing-body overheat annunciator alert required isolating the bleed air systems from the right engine. Those actions were intended to remove high temperature bleed air, from the right wing-body duct and shut down that part of the air conditioning system.
However, following completion of the checklist the flight crew observed that the right duct remained partially pressurised, indicating that it was not isolated. Technical examination following the occurrence identified that a faulty isolation valve prevented complete closure of the duct.
The residual pressure after completion of the non-normal checklist operations led to the flight crew conducting further troubleshooting activities outside of that checklist in consultation with the Sydney Line Maintenance engineer. This resulted in the right air conditioning pack switch being selected to AUTO from OFF, which then transitioned the left (operating) pack from high flow to low flow, leading to a significant reduction of air available to pressurise the aircraft (Figure 4).
As the right air conditioning system remained partially pressurised, the captain’s decision to conduct further troubleshooting outside the non-normal checklist instructions was appropriate and completed in conjunction with assistance from Sydney Line Maintenance. Despite the attempts to extinguish the overheat alert by isolating the right bleed ducting, the effects of those actions unknowingly contributed toward a gradual depressurisation of the aircraft.
Figure 4: Air conditioning schematic for the Boeing 737-300 series aircraft showing the final configuration of the system post troubleshooting by the flight crew prior to the descent.
The right air conditioning system had been selected by the flight crew to AUTO mode which commanded the left air conditioning package from high flow to low flow. This reduced the conditioned air (highlighted blue) that was directed into the flight deck. The right engine bleed valve had been selected closed by the flight crew as part of their troubleshooting actions. The isolation valve had also been selected closed by the flight crew. A fault with the isolation valve allowed the right duct to become partially pressurised (highlighted yellow).
Source: Express Freighters Australia, modified by the ATSB.
Following the occurrence, the aircraft was found to have significant air leaks from the auxiliary power unit duct bellows, cabin drain valves that were found stuck open and minor leaks from the aircraft door seals. In combination, these leaks were significant however, when the aircraft was operating with both the left and right air conditioning packs operating, cabin pressure was still able to be maintained.
Single pack operation was configured as a result of the completion of the non-normal checklist. The additional troubleshooting actions by the flight crew reduced the air supply into the aircraft cabin. This, in combination with the excessive leakage pathways, resulted in a gradual depressurisation of the aircraft. That, in turn, resulted in the flight crew electing to don oxygen and conduct an emergency descent.
Pilot incapacitation
While wearing an oxygen mask during the descent, the captain selected the emergency purge setting on the oxygen mask resulting in the inhalation of pressurised 100 per cent oxygen. The flight crew operations manual stated that the emergency position of the oxygen regulator was to be used to supply positive pressure within the mask to remove contaminants such as fumes or particles from within the mask. Selection of the emergency position on this occasion produced a gagging reflex and led to the captain becoming temporarily incapacitated.
In response, the first officer declared a MAYDAY and continued the descent to 10,000 ft. While there was no enduring effect from the captain’s temporary incapacitation, had the system remained in normal operation mode administering an on-demand supply setting of regulated oxygen, it is unlikely to have occurred.
After landing at Canberra Airport, the flight crew were transported to hospital for medical assessment. Blood tests showed no markers or indicators that the crew were exposed to disabling or hazardous fumes generated from within the aircraft. This was supported by emergency services not detecting any hazardous gases during their post-landing check of the aircraft flight deck. Additionally, no medical problems were identified.
Despite that, the first officer recalled feeling ‘dizzy’ and ‘foggy’ with a dry throat and lips. They also reported feeling unwell and having severe pain during the descent. On balance, the ATSB concluded that the accumulation of stressors associated with the:
troubleshooting activities
use of the oxygen masks
temporary incapacitation of the captain
concern for hazardous fumes
emergency decent and subsequent diversion
probably led the first officer to a heightened state of anxiety, hyperventilation, and the development of further incapacitating symptoms.
ATSB research into pilot incapacitation occurrences showed that the majority of cases were due to gastrointestinal illnesses, such as food poisoning or gastroenteritis. There were no reported instances involving incapacitation due to hyperventilation. The report noted that once declared incapacitated, the pilot was often removed from active flying duty and the flight was sometimes diverted, such as occurred in this instance.
Findings
ATSB investigation report findings focus on safety factors (that is, events and conditions that increase risk). Safety factors include ‘contributing factors’ and ‘other factors that increased risk’ (that is, factors that did not meet the definition of a contributing factor for this occurrence but were still considered important to include in the report for the purpose of increasing awareness and enhancing safety). In addition ‘other findings’ may be included to provide important information about topics other than safety factors.
These findings should not be read as apportioning blame or liability to any particular organisation or individual.
From the evidence available, the following findings are made with respect to the depressurisation and crew incapacitation that occurred near Narrandera New South Wales, on 15 August 2018 involving a Boeing 737-376SF, VH-XMO.
Contributing factors
Faults with the right wing-body overheat detection system likely led to intermittent illumination of the master caution and wing-body overheat annunciator.
The crew were unable to isolate the right wing-body duct due to a faulty isolation valve.
In consultation with Sydney Line Maintenance Operations, the flight crew conducted troubleshooting activities that resulted in the right air conditioning pack being selected to AUTO. This resulted in a reduction of cabin airflow.
Due to the reduction in cabin airflow, along with a higher-than-normal cabin leak rate, the aircraft was unable to maintain required cabin altitude. This resulted in the flight crew electing to conduct an emergency descent.
During the descent, the captain selected the emergency setting on the oxygen mask resulting in an inhalation of pressurised oxygen. This caused a gagging reflex leading to a temporary incapacitation.
Throughout the diversion and landing the first officer experienced incapacitating symptoms consistent with hyperventilation from a heightened state of anxiety, leading the captain to declare the first officer incapacitated.
Other findings
Post‑occurrence medical testing and assessments were carried out on the flight crew with no lasting effects from the flight identified.
Safety action
Whether or not the ATSB identifies safety issues in the course of an investigation, relevant organisations may proactively initiate safety action in order to reduce their safety risk. All of the directly involved parties are invited to provide submissions to this draft report. As part of that process, each organisation is asked to communicate what safety actions, if any, they have carried out to reduce the risk associated with this type of occurrences in the future. The ATSB has so far been advised of the following proactive safety action in response to this occurrence.
Safety action by Express Freighters Australia
Following this occurrence Express Freighters Australia advised that the three other B737-300SF aircraft within the Express Freighters fleet were inspected, and that:
the auxiliary duct bellow seal from one other aircraft was similarly damaged
non-functioning fuselage drain valves were also identified in those other aircraft.
The ATSB was also advised that safety action implemented by Express Freighters as a result of those aircraft inspections included:
the implementation of an enhanced inspection regime to ensure timely detection and rectification of faults compromising the operation of the wing-body overheat detection system
an amended maintenance program to incorporate an enhanced pressurisation system check and scheduled functional checks of the fuselage drain valves
a specific task during scheduled maintenance of the aircraft to verify the integrity of the auxiliary power unit duct bellows seal.
Express Freighters Australia have also amended their policy for system failures and in‑flight troubleshooting, advising the ATSB that the following amendment has been incorporated into their Flight Administration Manual:
A component or system failure inflight should be dealt with according to established procedures, including completion of any associated checklist. Systems troubleshooting by crew is prohibited, except in accordance with the FCOM/QRH. Actions contrary to the FCOM/QRH cannot be authorised by Maintenance Watch.
Sources and submissions
Sources of information
The sources of information during the investigation included the:
Flight crew of VH-XMO
Express Freighters Australia
Qantas medical services
References
David J. Rainford & David P. Gradwell 2006, Ernsting’s Aviation Medicine, Hodder Arnold, fourth edition, London UK
David K B Nias 1998, ‘Addressing the causes of hyperventilation’ Practitioner, London
Submissions
Under section 26 of the Transport Safety Investigation Act 2003, the ATSB may provide a draft report, on a confidential basis, to any person whom the ATSB considers appropriate. That section allows a person receiving a draft report to make submissions to the ATSB about the draft report.
A draft of this report was provided to the following directly involved parties:
Flight crew
Express Freighters Australia
Civil Aviation Safety Authority.
Submissions were received from:
Flight crew (Captain)
Express Freighters Australia
The submissions were reviewed and, where considered appropriate, the text of the report was amended accordingly.
Purpose of safety investigations
The objective of a safety investigation is to enhance transport safety. This is done through:
identifying safety issues and facilitating safety action to address those issues
providing information about occurrences and their associated safety factors to facilitate learning within the transport industry.
It is not a function of the ATSB to apportion blame or provide a means for determining liability. At the same time, an investigation report must include factual material of sufficient weight to support the analysis and findings. At all times the ATSB endeavours to balance the use of material that could imply adverse comment with the need to properly explain what happened, and why, in a fair and unbiased manner. The ATSB does not investigate for the purpose of taking administrative, regulatory or criminal action.
Terminology
An explanation of terminology used in ATSB investigation reports is available here. This includes terms such as occurrence, contributing factor, other factor that increased risk, and safety issue.
Publishing information
Released in accordance with section 25 of the Transport Safety Investigation Act 2003
Ownership of intellectual property rights in this publication
Unless otherwise noted, copyright (and any other intellectual property rights, if any) in this report publication is owned by the Commonwealth of Australia.
Creative Commons licence
With the exception of the Coat of Arms, ATSB logo, and photos and graphics in which a third party holds copyright, this publication is licensed under a Creative Commons Attribution 3.0 Australia licence.
Creative Commons Attribution 3.0 Australia Licence is a standard form licence agreement that allows you to copy, distribute, transmit and adapt this publication provided that you attribute the work.
The ATSB’s preference is that you attribute this publication (and any material sourced from it) using the following wording: Source: Australian Transport Safety Bureau
Copyright in material obtained from other agencies, private individuals or organisations, belongs to those agencies, individuals or organisations. Where you wish to use their material, you will need to contact them directly.
The Australian Transport Safety Bureau was an accredited representative to assist the South African Civil Aviation Authority (SACAA) for their investigation of a General Dynamics Convair 340, registered ZS-BRV, which collided with a building near Wonderboom Airport, South Africa, on 10 July 2018.
During the initial climb, smoke was observed emanating from the left engine. The aircraft subsequently collided with a building. One person on board the aircraft was fatally injured and 18 people were injured. One person on the ground was fatally injured and two people sustained serious injuries.
The SACAA’s Accident and Incident Investigations Division has completed the investigation and the final report is now available. Any enquires relating to the investigation should be directed to the SACAA at: www.caa.co.za
On the night of 18 July 2018, a Malaysia Airlines Airbus A330, registered 9M-MTK, took off on a regular public transport flight from Brisbane, Queensland to Kuala Lumpur, Malaysia. There were 14 crew and 215 passengers on board. Covers had been left on the aircraft’s three pitot probes (airspeed sensors). The instruments showed a red speed flag in place of the airspeed indication from early in the take‑off, and unrealistically low airspeeds afterwards.
The flight crew did not respond to the speed flags until the aircraft’s speed was too high for a safe rejection of the take-off, and the take‑off was continued. The flight crew’s initial radio announcement of an urgency situation was not heard by the air traffic controller.
The flight crew climbed to 11,000 ft and circled while performing troubleshooting and other procedures, which led to the shutting down the aircraft’s air data systems. Doing so activated the back up speed scale (BUSS), a safety function that displayed safe flight envelope information to the flight crew in lieu of airspeed. Using this system, airspeed management procedures, and assistance from air traffic control, the flight crew conducted an approach and landing at Brisbane.
For technical reasons, the main landing gear doors did not retract and were slightly damaged on landing. Also, nose wheel steering was not available and the aircraft remained on the runway for a short period before being towed to the gate.
What the ATSB found
The ATSB identified safety factors across a range of subjects including flight deck and ground operations, aircraft warning systems, air traffic control, aerodrome charts, and risk and change management.
Ground operations and pre-flight walk-arounds
In accordance with a local informal procedure and recommended practice, a support engineer placed covers on the aircraft’s three pitot probes (airspeed sensors) to prevent them from becoming blocked by wasp nests (a particular hazard at Brisbane Airport). The operator’s certifying engineer, who was primarily responsible for the aircraft’s airworthiness, did not initially know about the covers due to a miscommunication with the support engineer who had fitted them.
The flight crew, engineers, and dispatch coordinator were required to conduct various pre‑departure checks, meant to identify aircraft damage or other unsafe conditions such as the fitment of pitot probe covers. However, these checks were omitted entirely or only partially completed, for a variety of reasons including inadequate communication and reduced diligence. On other turnarounds from the same operator, some flight crew, engineering, and dispatch walk-around checks were also omitted or incomplete.
The certifying engineer saw the covers early in the turnaround but later forgot about them, and there was ambiguity around the division of responsibilities with regard to the final walk-around portion of the transit check.
The support engineer who had fitted the pitot covers left to work on another aircraft and was unable to return before the occurrence aircraft was dispatched. There was no reliable method to ensure the return of tools and equipment before an aircraft departed.
The ATSB identified that the pitot probe covers used, which were different to those approved by the aircraft manufacturer, had streamers that were not prominent enough to be noticed by ground crews during incidental activities, including pushback, and so increased risk during turnarounds if other methods of ensuring their removal were not effective.
Flight operations
Surprise, uncertainty, time pressure, and ineffective communication between the two pilots during the take-off probably led to stress and high cognitive workload. The captain, as pilot monitoring, did not assertively announce the presence of a problem or clearly specify its nature when it was detected, delaying the first officer’s response. Then, although the captain and first officer attempted to convey information about the airspeed issues, there was limited coordination between them which reduced their capacity to interpret the situation and make a decision early enough to safely reject the take-off.
Pilots are trained to monitor airspeed on take-off, and Airbus recommends that pilots reject a take‑off if unreliable airspeed is identified early enough for this to be a safe action. However, take‑offs have sometimes been continued, or rejected at high speed, even with multiple airspeed anomalies. This suggests that the flight crews involved were not detecting unreliable airspeed early enough in the take-off, or if they did, other factors prevented or delayed a decision to reject the take-off.
Although the ATSB only examined Airbus occurrence statistics, these concerns are very likely to be relevant to other aircraft types. This is particularly important when aircraft and flight crews resume operations after a period of inactivity, due to increased likelihood of airspeed malfunction and limited flight crew recency.
The ATSB found that aircraft alerts related to unreliable airspeed were either not available during take-off, or were not prominent enough to gain both the flight crew’s attention in a manner that the presence and importance of the problem were both immediately apparent.
In addition, there was limited guidance provided to flight crews to aid in the detection and decision-making processes in response to unreliable airspeed indications. For example, there was no clear guidance to flight crews whether the failure of a single airspeed display should result in a rejected take-off when below a nominal speed, which can leave the flight crew in a difficult position when identifying such a problem when approaching the decision speed.
During and after the take-off, the flight crew attempted to troubleshoot the airspeed problem without first completing the required memory items, and they did not complete the After take-off/Climb procedure. However, their coordination and management throughout the rest of the flight was effective.
Once activated, the aircraft’s back-up speed scale (available on some Airbus aircraft) was highly effective in reducing flight crew workload.
Risk and change management
The operator had recently reintroduced flights to Brisbane, and although relevant risks were identified, risk controls were not implemented, including some that might have prevented the occurrence through a more controlled use of pitot probe covers. This was likely due to a combination of factors, including:
errors in the risk assessment itself
incomplete and unclear processes and guidance, which probably resulted in erroneous risk information not being reviewed, and
the organisation’s risk and action monitoring processes not being applied in this instance.
The operator’s change and risk management processes had insufficient information to assure their effective application, which enabled the review and oversight processes to be inadvertently circumvented. The change management process also omitted many elements of established practices.
What has been done as a result
Shortly after the occurrence, the ATSB issued a safety advisory notice (SAN) advising all operators that conduct flights to Brisbane Airport to consider the use of pitot probe covers and, if covers are used, ensure there are rigorous processes for confirming that covers are removed before flight.
Alongside the publication of this final investigation report, the ATSB issued a SAN encouraging all manufacturers and operators of larger air transport aeroplanes to consider what types of unreliable airspeed events can occur, how the information is presented to flight crews, and what responses are the safest in different phases of the take-off and in a range of potential situations. Aircraft alerting systems, flight crew procedures, and flight crew training should be designed to provide sufficient assurance that flight crews become aware of and understand how to appropriately respond to unreliable airspeed on take-off in a timely manner.
All organisations directly involved in the occurrence implemented safety action to address safety issues identified by the ATSB:
Malaysia Airlines:
added procedures requiring the placement of a placard on the flight deck as a visual alert for flight crews when pitot probe covers are fitted
made changes to engineering arrangements at Brisbane, reducing the likelihood of error
published a flight safety bulletin to flight crew about vigilance during walk-arounds
made numerous changes to the change and risk management processes.
Airbus:
implemented additional flight crew training standards about unreliable airspeed on take-off, including walk-arounds, airspeed monitoring, systems knowledge, and non-technical skills
added guidance to the flight crew techniques manual on the importance of airspeed monitoring on take-off
commenced a review of airspeed indications in A330 and other aircraft types.
Heston MRO implemented procedures to improve the consistency of pitot probe cover use and tool control measures.
Menzies Aviation implemented improvements to its internal auditing programme.
Safety message
There are several key safety messages that arise from this occurrence.
Despite the efforts of Brisbane Airport to manage wasp populations and reduce the incidence of nest-building in aircraft, it is unlikely that these wasps, and the hazard that they bring, will be eliminated. The population of mud wasps in the Brisbane area has probably already spread beyond the limits of practical control.
The loss of airspeed data due to mud wasp ingress can occur even after brief periods, and the use of pitot probe covers for aircraft turnarounds at Brisbane is largely an effective defence. However, it introduces another risk, which is the potential for aircraft to commence a take-off with pitot probe covers still fitted.
In locations where pitot probe contamination is possible, operators need to consider the use of pitot probe covers, while addressing the potential unintended consequences of using them. Mud wasps generally affect only one pitot probe, which can be detected early in a take-off if the flight crew are vigilant. Risk is increased considerably if the flight crew does not detect the problem in time to safely reject the take-off, or if they continue the take-off.
It is rare to see multiple pitot probe contamination on the same aircraft due to mud wasps, but when pitot probe covers are left on all probes are likely to be affected. It is important to have preventative processes and equipment to alleviate the introduced risk when using covers for pitot probes or other sensors, and to recognise that their use does not completely eliminate the risk of mud wasp infestation.
At first glance, an observer might be puzzled as to how multiple checks can fail to detect the fitment of pitot probe covers before flight, or how a flight crew can complete a take-off without any valid airspeed being displayed. This occurrence illustrates how a range of individually straightforward factors can combine to nullify multiple critical safety barriers.
For all individuals working in the aviation industry, the occurrence shows that coordination and diligence can make a difference. Several individuals on the night—as well as their counterparts on other occasions—all acted as though the conduct of various external aircraft inspections was someone else’s responsibility; in fact, all had separate, key roles in detecting problems with the aircraft before departure. Had all such inspections been conducted diligently it is very likely that the pitot probe covers would have been seen and subsequently removed.
Most of these problems could have been resolved with better communication. Nevertheless, the working environment allowed errors and miscommunications to occur and propagate because individual responsibilities and work processes were not well-defined.
For flight crew, the occurrence also highlights the importance of vigilance, communications, and decision-making in adverse circumstances. Had the flight crew reacted more quickly, the take-off could have been rejected at low speed. Flight crews need to bear in mind the typical symptoms associated with unreliable airspeed on take-off in order to detect this situation as early as possible and reject the take-off if still safe. If uncertain of the aircraft’s proximity to the decision speed when an anomaly is detected, Airbus flight crews should immediately apply full take-off thrust and attain 15° pitch attitude when they feel that the aircraft is close to the rotation speed to maximise aircraft performance.
However, the flight crew’s delayed response vividly illustrates the falsity of the assumption that flight crews will always act as expected. Accordingly, the contribution of aircraft warning and indication systems design, combined with flight crew training and guidance, must be considered. Flight crews need to have information presented in a way that the importance of an adverse event, and possibly the right decision, is immediately apparent.
From an organisational perspective, the occurrence shows how inconsistent approaches between multiple interacting organisations can have safety implications that are hard to predict. As the ATSB has stated before, it is important to ensure that procedures are harmonised to increase the likelihood that potential problems or mistakes are detected before causing harm. Local variations to procedures should be formalised to reduce the risk of the inconsistent completion of tasks, and to improve the organisation’s ability to identify and address potential safety concerns. In addition, with operators increasingly relying on external engineering and ground handling support, the ATSB encourages anyone in the aviation industry to identify procedural problems for review and enhancement.
The occurrence
Overview
On the night of 18 July 2018, a Malaysia Airlines Airbus A330-300, registered 9M-MTK, was being prepared for a regular public transport flight from Brisbane Airport, Queensland to Kuala Lumpur, Malaysia with callsign MH134. The preparation for flight, and the flight itself, were conducted at night in clear weather with light winds.
After the aircraft had arrived at the gate following its flight to Brisbane, an engineer placed covers on the aircraft’s three pitot probes[1] to prevent them from becoming blocked by wasp nests (a particular hazard at Brisbane Airport—information on this topic is provided in Appendix A). The pitot covers were not removed during the subsequent inspections and other activity throughout the turnaround (Figure 1).
Figure 1: Aircraft on bay during turnaround about to be pushed back with pitot probe covers in place
Source: Brisbane Airport Corporation, annotated by the ATSB
During take-off (commencing at 2331 Eastern Standard Time[2]) and the subsequent flight, the aircraft systems could not calculate and display airspeed correctly due to the pitot probes being covered.
The aircraft systems detected invalid airspeed when the aircraft reached 50 kt, and displayed a speed flag on the two primary flight displays (PFD).[3] The flight crew did not respond to the speed flags until the aircraft’s speed was too high for a safe rejection of the take-off, and the take‑off was completed at close to the pre-planned speed.
The flight crew made a PAN PAN[4] call to the tower air traffic controller, who did not hear it and asked the flight crew to change to the departures frequency. The flight crew then did so and made a PAN PAN call to the departures controller, who responded to it.
The flight crew climbed to 11,000 ft and circled while performing several procedures. These procedures resulted in the flight crew shutting down the aircraft’s air data systems, which activated a safety function called the back-up speed scale (BUSS) that displayed safe flight envelope information to the flight crew in lieu of airspeed. Using this system and airspeed management procedures, the flight crew conducted an approach and landing at Brisbane at 0033. There were no injuries reported among the 14 crew and 215 passengers.
The inoperative air data systems meant that normal landing gear extension was not available, so the flight crew had carried out a gravity landing gear extension. Because of this, the main landing gear doors did not retract and were slightly damaged on landing. Also, nose wheel steering was not available and the aircraft remained on the runway for a short period before being towed to the gate.
Personnel and required checks
To manage the turnaround operation at Brisbane between each flight, Malaysia Airlines had arranged for:
a travelling licensed aircraft engineer (LAE)[5] from Malaysia Airlines to carry out, manage, and certify technical handling (engineering) tasks including a transit check, maintenance, and refuelling
a support engineer, who was an aircraft maintenance engineer provided by Aircraft Maintenance Services Australia (AMSA)[6] to assist the LAE with non-certifying technical tasks as directed as well as act as security escort for the LAE[7] (another AMSA engineer was present for a brief period, but was minimally involved)
ground handlers provided by Menzies Aviation Services (Menzies) to carry out ground handling tasks such as dispatch coordination[8] and pushback[9] using a tug, as well as baggage and passenger handling services.
Formally, the engineers were operating primarily under Malaysia Airlines procedures and the ground handlers under Menzies procedures. Further information on the operator’s engineering and ground handling arrangements in Brisbane are provided in Activities and duties in preparation for flight.
Personnel information is provided in Appendix C.[10]
The following checks and inspections were required by applicable procedures, in approximate chronological order:
arrival walk-around (to be conducted by ground handlers)
engineering maintenance walk-around inspection (part of the engineering transit check)
engineering pre-departure walk-around inspection (part of the engineering transit check)
flight crew walk-around
dispatch walk-around (to be conducted by the dispatch coordinator).
The purpose of each walk-around and the responsible personnel are described in Activities and duties in preparation for flight.
Aircraft arrival and initial ground activities
Airport closed-circuit television (CCTV) recordings showed that the aircraft arrived at the bay at 2020. It was scheduled to depart (push back) at 2320. Artificial lighting around the bay provided good visual conditions, particularly around the forward part of the aircraft.
At the time of the aircraft arrival, the ground handlers:
aided with aircraft guidance to the bay
chocked the nose and main wheels
communicated with the pilots and ensured the aircraft was safe to work around
moved the airbridge into position for passenger disembarkation
began unloading baggage and freight.
The CCTV recording showed that a required arrival walk-around was not conducted by ground handlers.
The operator’s LAE arrived at the airport at about 2000. The LAE was based in Kuala Lumpur, Malaysia, and had been flown to Brisbane 2 days before to carry out maintenance tasks on two consecutive turnarounds. 9M-MTK was the second of these, and the LAE was required to return to Kuala Lumpur on the same flight.
After passing through airport security, the LAE was taken to the aircraft by a Menzies staff member. The LAE entered the flight deck at 2030 to commence the required transit check, which included a review of the aircraft’s technical documentation.
At 2045 the AMSA support engineer arrived at the aircraft carrying a set of pitot probe covers, which are commonly used in Brisbane to prevent mud wasp infestation.[11]The support engineer moved an access stand (moveable ladder/platform) to the nose of the aircraft and fitted the pitot probe covers. Ribbons attached to each of the pitot probe covers were visible on the CCTV recording. The support engineer then moved the access stand away and proceeded to the flight deck.
At 2047 the support engineer arrived on the flight deck. According to interviews with the LAE and support engineer, their discussion was brief. The support engineer reported telling the LAE (who was checking aircraft records at the time) that pitot probe covers were fitted to the aircraft. According to the support engineer, the LAE did not acknowledge what had been said, or make an entry in the technical log for the fitment of pitot probe covers (which the support engineer normally expected). The support engineer did not question this.
The LAE had not been aware of the common and recommend practice for the use of pitot probe covers at Brisbane Airport. The LAE stated that it was not normal practice to fit them during transits and later did not recall the support engineer advising of their fitment during the turnaround. The LAE also stated that, had they known pitot probe covers were fitted at that point, they would have either made an entry in the aircraft’s technical log that the pitot probe covers were fitted, or told the support engineer to remove them.
Engineering activities
The support engineer facilitated LAE access to the apron. The LAE instructed the support engineer to add oil to the engines and hydraulic system and the support engineer left the area to obtain the necessary supplies.
The LAE then conducted the external inspection component of the walk-around transit check beginning at 2054 (this component will be referred to as the ‘engineering maintenance walk-around inspection’). The CCTV recording showed that the LAE shone a torch on the area of the two left pitot probes for about 4 seconds while walking towards the nose (Figure 2). The LAE then appeared to look at the area of the right pitot probe.
Figure 2: LAE shining torch on left pitot probes with covers fitted
Part of this image is overexposed due to the brightness of the torch.
Source: Brisbane Airport Corporation, annotated by the ATSB
The LAE reported noticing the pitot probe covers fitted to the aircraft at the time the nose area was inspected and intended to talk to the support engineer about them. As the support engineer was still absent from the aircraft retrieving supplies, the LAE decided to continue with the engineering maintenance walk-around inspection. The next interaction between the LAE and support engineer was ten minutes later. The LAE, busy with continuing the engineering maintenance walk-around inspection through that period, forgot about the pitot probe covers.
At about 2155, refuelling of the aircraft commenced under the supervision of the LAE, and was completed at about 2234. At 2237 the LAE and support engineer returned to the flight deck, where the LAE delivered the fuel receipt to the flight crew and certified that the transit check was complete.
The support engineer asked the LAE if there were any further tasks required. The LAE stated that the support engineer was no longer required. Both engineers left the flight deck at 2246. The LAE then sat in their assigned cabin seat for the return flight to Kuala Lumpur. The LAE reported being mindful of the need to board at a reasonable time before the international departure.
There was no formal or informal arrangement for the support engineer to remain with the aircraft. After leaving the vicinity of the aircraft at 2248, the support engineer took paperwork to the office, then went to assist other AMSA engineers on another aircraft. The support engineer reported having the intention to return to 9M-MTK but was assigned a rectification task on the other aircraft.
The support engineer was delayed further when leaving that aircraft while boarding was taking place. By the time the support engineer was able to return (about 2320), 9M-MTK had departed.
The Malaysia Airlines transit check requirements included another inspection, an engineering pre‑departure walk-around inspection, to check (among other things) that pitot probe covers were removed, and all doors and hatches were secured just prior to departure.
The support engineer reported that they understood their tasking was as directed by the LAE. The support engineer expected a pre-departure walk-around would be done by the ground handlers as the dispatch was conducted by them.
The LAE assumed the support engineer was responsible for the dispatch coordination and would subsequently conduct a final walk-around. Both engineers reported that the LAE did not instruct the support engineer to perform a final walk-around and did not ask about it.
Flight crew pre-flight activities
The flight crew arrived at the aircraft flight deck at about 2210, shortly before refuelling began, and commenced a series of pre-flight checks. As part of these checks the flight crew were required to review the aircraft’s technical log for outstanding defects. No defects relevant to the occurrence were recorded.
For this flight, the first officer (FO) was assigned the pilot flying (PF) role, and the captain was the pilot monitoring (PM).[12]The aircraft manuals assigned responsibility for various tasks to each crewmember. The Preliminary cockpit preparation procedure had a requirement for the PM to check that the gear pins and covers (pitot probe covers) were stowed and to conduct an exterior walk-around (termed ‘flight crew walk-around’ in this report). The cockpit voice recorder (CVR) did not record this part of the pre-flight preparation.
The ‘gear pins and covers’ check, assigned to the PM, involved checking a compartment located behind the left pilot seat (Figure 3) for the presence of landing gear pins and pitot probe covers. Pitot probe covers were not routinely carried with the operator’s aircraft and were not carried on this occasion. Both flight crew later reported that they had not seen pitot probe covers in use in normal flight operations, and they were not informed of their use in Brisbane.
As the PM, the captain was responsible for the exterior flight crew walk-around. The captain commenced the walk-around at 2254, during which the captain briefly shone a torch over one of the left side pitot probes (Figure 4); the captain did not inspect the right side of the nose. In interview with the ATSB, the captain did not recall seeing pitot probe covers. Based on the captain’s walk-around path, torch use (particularly dwell time on check items), and total time taken, the ATSB assessed the captain’s walk-around as having omitted many of the required check items and was conducted without due attention (see Flight crew pre-flight walk-around for the occurrence flight).
Figure 3: Stowage compartment for landing gear pins and pitot probe covers (if carried)
Source: Airbus, annotated by the ATSB
Figure 4: Captain briefly shining torch on left side pitot probe area
Source: Brisbane Airport Corporation
After the captain returned to the flight deck, the flight crew compared their separate calculations of the aircraft’s V speeds, which denote different phases of the take-off based on airspeed. The flight crew calculated:
the decision speed V1 (the maximum airspeed at which a rejected take-off can safely be initiated in the event of an emergency) as 153 kt[13]
the rotation speed VR (the airspeed at which rotation should be initiated) as 160 kt.
At 2312 the FO called for the Before start procedure. The captain (as PM) commenced the check by stating a phrase captured on the cockpit voice recorder (CVR) that sounded like ‘gear pitot covers’ but could also have been ‘gear pins and covers’. The FO immediately responded with ‘removed’.
Dispatch and taxi
At 2311 the towbar was connected to the aircraft, the main passenger entry door was closed and the airbridge retracted.
Menzies had assigned a team of ground handling personnel to the turnaround of 9M-MTK. A leading hand was in charge of all aspects of the non-engineering ground handling duties and held the responsibility for coordinating the dispatch.[14]
The leading hand had not received operator-specific training and believed that they were not qualified to perform coordination of this dispatch. For that reason, just before the aircraft was to depart, the leading hand arranged for a ground handler from another Menzies team to coordinate the dispatch. According to the recollection of both individuals, the leading hand asked, ‘Are you good to do the headset?’ and the person taking on the role of dispatch coordinator gave a ‘thumbs up’ signal.
A dispatch coordinator was required to conduct a final walk-around before departure. The leading hand stated that they (the individual) would normally do a complete walk-around of the aircraft just after arrival to inspect it for obvious damage. They would also do a dispatch walk-around as part of the dispatch duty, which meant a check around the entire aircraft to ensure that all the baggage doors and hatches were secured and other similar ‘last-minute’ checks.
The leading hand did not advise the dispatch coordinator that a dispatch walk-around of the aircraft had not been conducted. The dispatch coordinator stated that the aircraft appeared to be ‘ready to go’ at the time of this handover: the airbridge was retracted, the tug was connected, and the driver was in position. The dispatch coordinator assumed that the leading hand had already conducted a dispatch walk‑around and did not ask about it.
The CCTV recording showed that neither of the Menzies personnel conducted a dispatch walk‑around. The dispatch coordinator donned the headset to communicate with the cockpit at 2315 and both Menzies personnel waited near the nose gear for pushback.
The CVR recorded the FO stating to the dispatch coordinator ‘confirm ground checks complete’. The dispatch coordinator responded by stating ‘correct, that is affirmative’.
Pushback commenced at 2318, 2 minutes ahead of schedule. The tug driver could not see the pitot probes from within the tug cabin. The leading hand remained near where the nose gear had been and appeared to look in the general direction of the aircraft for about 18 seconds before turning to take equipment away from the bay (Figure 5).
Figure 5: Aircraft about to be pushed back with pitot probe covers in place (two of three visible)
Source: Brisbane Airport Corporation, annotated by the ATSB
The dispatch coordinator walked alongside the nose gear until the tug driver stopped pushing the aircraft back. During this period, the dispatch coordinator was likely checking for sufficient obstacle clearance behind and to the sides of the aircraft and would not have had a need to look behind and above towards the area of the pitot probes.
The towbar and dispatch coordinator’s headset were then detached from the aircraft. CCTV footage from an adjacent bay showed the dispatch coordinator standing back from the left side nose of the aircraft showing the aircraft’s nose gear steering pin to the flight crew, in accordance with procedure, as confirmation that it had been removed (Figure 6). The pitot probe cover streamers would have been visible from this position.
After pushback and engine start the flight crew requested clearance to taxi. At 2324, the flight crew commenced taxi for a full-length take-off on runway 01. During the short duration of taxi, they were mostly engaged in conversation that was not pertinent to the flight. This conversation ended about 3 minutes before the take-off commenced.
Figure 6: Dispatch coordinator in position after pushback
Source: Brisbane Airport Corporation, annotated by the ATSB
Take-off
At the time of the take-off, there was no cloud and surface winds were variable at 3 kt. Winds aloft varied up to about 10 kt from the north or north-north-east, providing a slight headwind on take-off and landing. Due to the low winds in the area, groundspeed (which was recorded) was likely to have been very similar to airspeed, particularly up to 1,000 ft, so groundspeed is provided as an approximation to airspeed throughout this report.
Events throughout the take-off, based on recorded information and flight crew interviews, are listed and illustrated in Figure 7. Unclear utterances are marked in parentheses; some of these were recorded on multiple CVR channels and sounded different on each channel. In these cases, alternative interpretations are provided with the ATSB’s assessment of the most likely interpretation provided first.[15] Further details and analysis of the data recordings and interpretation of the CVR is provided in Appendix C. Further information about the faults, warnings, and displays associated with the erroneous airspeed data is provided in Aircraft information.
Figure 7: Sequence of events on take-off
Source: ATSB. Runway image: Google Earth
Audio analysis of the captain’s ‘speed’ statement at 2331:18 found that it was significantly quieter than both crewmembers’ other statements made throughout the take-off (see Appendix C). Later, both flight crew did not recall seeing a speed anomaly until the aircraft reached 100 kt, and the captain did not recall making the 100 kt call.
The captain’s breathing rate and intensity increased as the aircraft passed about 60 kt. The captain later recalled that the take-off seemed to happen ‘in a split second’. The FO’s breathing rate and intensity increased at about the same time as the captain said ‘borders are red’ or ‘both also don’t have’.
The captain later did not recall hearing the FO suggest a rejected take-off and reported seeing the airspeed display ‘flickering’. The FO recalled seeing a red speed flag during the 100 kt speed check.
ATSB observation
The captain’s ‘speed’ statement, 2 seconds after the likely point at which the speed flag was first displayed, indicated that the captain identified the presence of an airspeed problem almost immediately. This was about 10 seconds before the point at which the flight crew are advised to be ‘go-minded’ (that is, when they should only reject a take-off for serious problems).
Apparently not checking airspeed until the 100 kt call, the FO was likely unaware of the presence of a problem until after that point.
According to analysis of the recorded data, both PFDs showed the red speed flag until about 2331:40, or about when the aircraft’s nose began to lift. At this point one or both PFDs displayed the airspeed tape with an erroneous airspeed close to the minimum displayable speed (30 kt). The displays probably intermittently transitioned between unrealistically low airspeeds and the red speed flag for a period. It is possible that multiple transitions occurred between recorded data points (1 second apart), which may have appeared as ‘flickering’ to the flight crew.
The FO reported that they commenced rotation by judging the aircraft’s position on the runway (and possibly also referencing the groundspeed display). Later analysis indicated that rotation was commenced at almost exactly VR. The FO rotated to about 13° nose up pitch attitude and maintained FLEX[19] thrust. Passing about 120 ft, following confirmation of a positive rate of climb, the landing gear selector lever was selected to the UP position.
At rotation, the PF normally increases pitch towards 15° until lift-off. Memory items of the Unreliable speed indication procedure[20]require the PF to attain 15° nose-up pitch and apply TOGA[21] thrust. At this time, the flight crew did not call out ‘unreliable speed’ (as required when initiating the procedure), and the FO did not announce an intention to maintain a certain thrust setting or pitch angle. The FO later reported maintaining maximum continuous thrust (the same detent as FLEX and one setting below TOGA) and 12.5° pitch to limit the risk of a tail strike. The captain, acting as PM, did not confirm or announce deviations from the pitch attitude and thrust settings listed in the memory items of the procedure.
Initial climb
After take-off, the PFDs probably both displayed mostly a speed flag and sometimes an erroneously very low airspeed. The integrated standby instrument system (ISIS) displayed speed at or near the bottom of the speed scale (30 kt) throughout the take‑off and less than 60 kt for the remainder of the flight.
At about 300 ft, the FO again asked ‘ADR 3 to put to ADR 3?’, and receiving no immediate response, said ‘you put to ADR 3?’; the captain said something indistinct but similar to ‘autof...’ at the same time as this second question. The air data source was switched to F/O ON 3 at 2332:10, with the aircraft climbing through 600 ft.
At about 700 ft the FO reduced the pitch attitude and maintained about 9° nose up pitch and maximum continuous thrust. Although the aircraft was below the minimum safe altitude at night (2,500 ft), the flight crew did not discuss whether the safe conduct of flight was assured. However, there were no notable ground hazards in the vicinity and no other aircraft that were likely to present a collision threat.
The FO called for the autothrust ECAM[22]actions in response to an alert advising autothrust disengagement at 2332:22, when passing 1,000 ft. The captain immediately responded and the flight crew commenced the ECAM actions.
At 1,500 ft, a master caution alert occurred, associated with a chime and the message FCTL ALTN LAW (flight control alternate law). Alternate law is a degraded flight control mode that was entered as the result of invalid air data. The aircraft had actually entered alternate law just after lift-off, however, the message is inhibited until the aircraft reaches 1,500 ft. This mode was also displayed as four small amber crosses on each PFD.
The flight crew continued the ECAM actions, which were interrupted at 2332:45 by the tower controller asking them to contact departures. The captain requested the departures frequency, which the controller provided and was read back by the captain. At this time the aircraft was passing 2,500 ft.
Urgency radio call
At 2333:04, immediately after the captain’s read back, the FO suggested they call PAN PAN and the FO then immediately transmitted over the tower frequency ‘PAN PAN, PAN PAN, PAN PAN, Malaysian one thirty four, we have unreliable airspeed and request maintain runway track and request climb to six thousand [ft] initially’.[23]The tower controller did not later recall hearing this call and did not respond to it.
Recorded air traffic control (ATC) data shows that the call was received by the ATC radio on the tower frequency. Other recorded data showed that there were no other transmissions or calls around this time. The PAN PAN call came about 40 seconds after the end of a coordination telephone call between the tower and departures controllers, in which they also briefly discussed equipment upgrades that were being conducted at the time (the tower controller later reported that the upgrades had no adverse effect on their workload or performance).
About 28 seconds after the end of the PAN PAN call, the flight crew of another aircraft requested take-off clearance from the tower controller. The tower controller responded with the clearance.
Immediately after that clearance was provided, the tower controller received a coordination call from the departures controller, who asked if the Malaysia Airlines aircraft could be transferred to the departures frequency, which is normally done shortly after take-off. The tower controller advised that it had already been done, and that they would ask again.
During that call, as the tower controller was speaking, the flight crew of the aircraft taking off asked over the tower frequency if the controller heard the PAN PAN call. The tower controller thought that this transmission came through the telephone connection from the speakers at the departures controller’s terminal and accordingly did not respond.
The tower controller then asked the flight crew a second time to change frequency, which the FO read back.
Continued climb and stabilisation
Through the above period the aircraft was passing about 3,800 ft. The FO called for the Unreliable speed indication procedure. No memory items were called by either flight crew, and the captain proceeded to locate the procedure in the quick reference handbook (QRH).
After changing to the departures frequency, the FO made a second PAN PAN call at 2334:21 (passing 5,800 ft), asking to climb to 10,000 ft and maintain runway track. The departures controller acknowledged the PAN PAN and provided the requested clearances.
The captain then asked the FO if the autopilot could be selected on, and the FO replied that it could not.
The After take-off/Climb procedure was not actioned.[24] At about 2335, when the aircraft was climbing through about 7,000 ft, the flight crew commenced the Unreliable speed indication procedure, including pitch and thrust settings, confirming the maximum permitted altitude with the current flap extension. The thrust levers remained in the maximum continuous thrust detent and the FO maintained 9–12° pitch until the aircraft was levelled off.
As the aircraft approached 10,000 ft, the FO requested further climb to flight level (FL) 1502[25] which was cleared by ATC. The flight crew resumed the procedure discussing the required pitch and thrust settings to level the aircraft. The FO advised the captain to pause the procedure, citing the FO’s need to focus on flying the aircraft.
The FO stabilised the aircraft in level flight at about FL110. A short time later the FO obtained an ATC clearance to remain at this altitude and to manoeuvre the aircraft to the east of Brisbane Airport (Figure 8).
At this time, the FO retained control.[26] The flight crew resumed the Unreliable speed indication procedure. During the troubleshooting, the air data switch was changed to NORM, and remained at that setting for about 48 s. The flight crew then changed it to CAPT ON 3 for about 4 s, to F/O ON 3 for about 2 s, then to NORM where it remained for the rest of the flight. During the switching the FO cross checked and described to the captain which ADR system was providing data to which PFD and what indications were observed on the PFD.
After the switch was returned to NORM the FO stated that all three ADR systems appeared inoperable. The captain revised the actions for identifying the affected ADR, cross-checked the PFD indications and said that either the affected ADR(s) could not be identified, or all ADRs were affected.
Figure 8: Flight path of 9M-MTK during take-off, turn-back and landing
Source: Google Earth, annotated by the ATSB
After further discussion and revision of the required actions the flight crew determined that all ADRs should be selected off, which is a procedurally irreversible action in-flight (that is, there is no procedure to enable the crew to turn them back on until after landing).[27] As a way of cross-checking the correct action before taking it, they decided to exchange duties so that the captain would fly and the FO would perform the procedural actions. The FO announced the current pitch and thrust settings to maintain level flight, and the assigned heading before handing control of the aircraft to the captain. The FO revised the required actions for the Unreliable speed indication procedure and reconfirmed the required action with the captain before switching all ADRs off. Once completed, the flight crew confirmed the amount of fuel remaining and requested a block level altitude between 10,000 ft and FL 120 which was approved by ATC.
The FO pre-read the All ADR off procedure in preparation for the next step, which was to turn all ADRs off. At 2343, with the aircraft at about 11,000 ft, the flight crew turned all three ADRs off. This activated the back up speed scale (BUSS), an alternate display mode which permits pilots to keep the aircraft in a safe performance envelope when airspeed data is unreliable or unavailable (Figure 9). Further information on the BUSS is provided in Back up speed scale. The airspeed tape on the ISIS is retained, and in this case would have stayed at the bottom of the speed scale (30 kt).
Figure 9: Example of the BUSS, showing the colour-coded scale (left) that indicates derived speed, and a GPS altitude scale (right)
This image does not reproduce the exact PFD display during the occurrence.
Source: Airbus
In addition to activating the BUSS, turning off all ADRs resulted in the following notable effects:
the ECAM warning message NAV ADR 1 + 2 + 3 FAULT (fault with all 3 ADRs)
pressure altitude was replaced with GPS altitude
spoilers and speed brake are not to be used
normal hydraulic extension of the landing gear was not possible, and the main landing gear doors could not be retracted after a gravity extension
cabin pressure needed to be manually controlled by the flight crew
nose wheel steering was not available on
ATSB analysis of flight data indicated that the aircraft did not approach an aerodynamic stall condition at any point during the flight[28]
ATSB observation
Initially, the absence of airspeed indication required increased flight crew vigilance and coordination to maintain a safe flight envelope. After the crew followed the required procedures, the BUSS presented a clear primary indication of the aircraft’s safe flight envelope and probably greatly reduced the likelihood of error.
At 2344 the FO briefed the cabin crew manager of the situation and advised the flight would be returning to Brisbane for a normal landing.
The departures controller asked the flight crew about their intentions and they advised that they had no airspeed information. In response, the controller provided groundspeed information and offered to provide regular groundspeed updates, which the captain accepted. The controller advised the tower controller of the situation, and the tower controller performed many of the required alert phase[29] actions including preparing for fire services.
At 2353, the flight crew discussed available options for landing. They decided to conduct an overweight landing on runway 01 and began planning their approach and landing accordingly.
Approach and landing
The flight crew requested a descent from ATC, which the captain, as PF, commenced at 2358. The plan was for an instrument landing system approach with a long (20 NM) final approach leg[30] to runway 01, with ATC providing vectors, groundspeed, wind and distance to run. The BUSS provided the primary speed reference and the FO provided pitch, thrust, and speed reference information from the QRH to the captain.
The flight crew obtained the Brisbane automatic terminal information service, and reviewed the systems affected and the potential effects. They advised ATC that the aircraft would require a tug after landing (due to the loss of nose wheel steering). The flight crew discussed what they would do if a missed approach was required.
The flight crew also discussed who should fly the approach and landing. Operator policy required the captain to do so in abnormal situations, but in this case the captain felt it better to effectively monitor and manage the unfamiliar situation personally while delegating the PF role to the FO who had significant experience on the A330.
ATC transferred the aircraft to the tower at 0031, when the aircraft was at 1,900 ft on approach. The departures controller advised the tower controller, who was the same controller as during the take-off, that the flight crew requested groundspeed information.
At 0033, the flight crew conducted an overweight[31] landing on runway 01 at 152 kt groundspeed, touching down at about 390 m from the threshold, near the aimpoint. The maximum recorded vertical acceleration on landing was 1.26 g, which the aircraft manufacturer reported was within the design load limits. The FO selected reverse thrust and stopped the aircraft about 1,600 m short of the runway end.
The aircraft could not be moved immediately due to the main landing gear doors, which do not close following a gravity extension, being in contact with the runway. The LAE was called to the flight deck and, after the flight crew explained the instrumentation problem, recalled that pitot probe covers had been fitted and suspected that they may not have been removed. The LAE opened and leaned out of a side window and identified the presence of covers on the pitot probes.
After ground inspections established that the aircraft was safe to tow, it was towed to the terminal where the passengers and crew disembarked. There were no reported injuries.
Aircraft damage
The main landing gear doors had minor abrasion damage where they contacted the runway surface on landing. If the main landing gear doors are opened on the ground, such as for maintenance activity, they typically remain clear of the ground. However, compression of the main landing gear struts during the overweight landing led to contact between the doors and the runway surface (Figure 10).
Figure 10: Right main landing gear door showing runway contact mark
Source: ATSB
The pitot probe streamers were damaged by airflow and left red marks on the fuselage skin where they rubbed during the flight (Figure 12). The sheaths were partially burned where they folded over the heated pitot probes in the airflow.
Figure 11: Reconstruction of pitot probe covers on 9M-MTK, showing pitot probe cover damage and contact marks on aircraft skin from the streamer
Source: ATSB
Figure 12: The right and left sides of the aircraft’s nose shortly after landing, showing pitot probe covers installed
Source: Brisbane Airport Corporation, annotated by the ATSB
Due to the absence of airspeed data the flight crew did not have the usual indications for maximum flap and landing gear speeds. Airspeed estimates using groundspeed, wind data, and atmospheric data indicate that the maximum flap extension speed was most likely exceeded by up to 14 kt during the climb through 4,000 ft, and by up to 5 kt on descent through 7,500 ft. The maximum landing gear extension speed was probably not exceeded. Inspections (required after potential speed exceedances) were carried out and did not identify any damage.
Brisbane Airport’s main runway was 01/19, which was 45 m wide and 3,560 m long. It was equipped with edge lighting, centreline lighting, and instrument landing system (ILS) in both directions. Runway 01, used for the take-off and landing, was fitted with approach lighting and a precision approach path indicator,[32] and was approved in the ILS category I. To its north was a secondary runway (14/32), and a parallel main runway (01L/19R) was under construction to the west.
Mud wasp hazard
‘Mud wasp’ is a colloquial term encompassing numerous species of wasp, including those known as mud‑dauber, keyhole, and potter wasps.[33] They are named for their nests, constructed mostly from mud or sand, which are sometimes built within abandoned nests of other species or small cavities within human-made objects. The wasps then place captured spiders or insects inside as food for their larvae. Other wasp species can take over these nests parasitically. For these reasons, analysis of the nest’s contents may not always reveal the species of wasp responsible for the original construction of the nest.
Mud wasps are found throughout Australia with the majority found along the eastern seaboard, especially in tropical Queensland.[34] At least 10 distinct mud wasp species have been identified at Brisbane Airport.
Historically, mud wasps have been known to build nests in aircraft pitot probes, entering through the forward-facing opening (Figure 13). Nesting and food material placed in the cavity blocks the probe, to the point where it may no longer provide accurate airspeed information. A partial blockage, such as that caused by the first addition of mud for a nest, may be enough to cause anomalous airspeed readings as air flow is disturbed.
The Civil Aviation Safety Authority (CASA) reported that the potential for pitot probe contamination may arise within 20 minutes of availability (Appendix A). Wasps have been observed inspecting aircraft within a few minutes of arrival at the gate. There may not be external signs of the presence of a nest or partial nest within the probe, and there have been occurrences at Brisbane airport where pitot probes were blocked during a turnaround by a partially completed wasp nest (see Related occurrences).
House and others (2020a) conducted a study at Brisbane airport to determine the species and prevalence of mud wasp nest building using replica pitot probes of various types, finding that only keyhole wasps (Pachodynerus nasidens, originating from the Caribbean-South American region) constructed nests in the replica probes, although other species could not be excluded. Brisbane Airport is the only place in Australia that is known to have a resident population of this species. It is also present in Hawaii and Micronesia.
Figure 13: Female keyhole wasp (Pachodynerus nasidens) on a replica DHC8 pitot probe, Brisbane Airport, May 2016
Source: House 2020b
The Brisbane Airport study found that the wasps could nest in replica pitot probes of all types. Replica pitot probes with apertures of 7.2 mm (modelled after those fitted to a typical Boeing 737‑400) were the most affected, followed by 5.5 mm (A330) and 5.0 mm (Boeing 737-800).
The study also found that 96 per cent of keyhole wasp nesting occurred between November and May. Keyhole wasps are generally active only during the day, but strong airport lighting appears to have allowed them to build nests at night on at least one occasion. Ecosure (2017) stated:
At [Brisbane Airport], mud nests have been reported on all types of buildings including hangars, terminals and other structures, but only in pitot probes of aircraft parked near terminal buildings or in hangars. This suggests that aircraft parked in open areas are difficult for wasps to locate and nest on.
Airworthiness bulletin on wasp nest infestation
In May 2015, CASA issued Airworthiness Bulletin (AWB) 02‑052 ‘Wasp Nest Infestation – Alert’ to ‘urgently advise operators, maintainers and pilots of the dangers associated with undetected wasp infestation in aircraft, and the circumstances under which they can occur.’ It was available on the CASA website and emailed to subscribers. Its two pages contained background information regarding Australian mud-dauber wasps and their potential to make nests in aircraft, originally stating that their nests can completely block a pitot tube within 2 hours. Recommendations were given for the parking and storage of aircraft.
The AWB was updated from time to time with amendments summarised as follows:
From issue 2 (March 2016):
included anecdotal evidence that mud dauber wasps ‘can build a significant nest capable of completely blocking a pitot tube, vent, or drain in around 20 minutes’
recommended operators ‘be aware that on-ground pre-flight air data module [built-in] tests and/or computer checks will usually not test pitot probes or static vents for blockages.’
From issue 3 (December 2017):
provided information on the criticality of relevant failures in accordance with the United Sates Federal Aviation Administration (FAA) advisory circular (AC) 23.1309-1E as follows:
Pitot tubes blocked in flight can cause total loss of function of airspeed or altitude indication. This is classified as hazardous.
Total loss of function of flight controls is catastrophic.
Misleading and/or malfunction without warning of electrical trim control systems is catastrophic.
advice regarding the fitment of pitot probe covers during turnarounds, and that it was important the covers were approved by the manufacturer, as others may not fit correctly.
From issue 4 (May 2018):
a significant expansion of information from 5 to 11 pages including information from a report commissioned by Brisbane Airport Corporation about keyhole wasps, and noted that as their eradication was not possible, notification of their presence was permanently published in the Airservices Australia’s En Route Supplement Australia (ERSA) section on Brisbane Airport (see Aeronautical charts).
mentioned newer design pitot probe covers fabricated from materials ‘such as fibreglass or Nomex’ being able to withstand higher temperatures, as would be required during turnarounds prior to heated pitot probes having cooled sufficiently.
From issue 5 (February 2021), AWB 02-052 stated the criticality of failure differently:
Pitot tubes or static ports blocked (or even partially blocked) in flight can cause total loss of airspeed or altitude indication. This is classified as hazardous. Misleading and/or malfunction without warning can be catastrophic.
Airbus guidance
In July 2016 Airbus published an article on pitot probes blocked by insect activity in its free Safety First magazine, which shares non-mandatory safety information with Airbus operators and flight crews. The article mentioned a 2013 occurrence investigated by the ATSB (see Related occurrences) and presented an excerpt from an Brisbane Airport ERSA entry that warned of the potential for wasps to block pitot probes. It proposed the use of pitot probe covers as a preventative measure, stating (Airbus 2016):
Parking procedures available in the Aircraft Maintenance Manual [AMM] will request that approved protective covers are installed on each of the air data probes or devices, including Pitot probes. But many operators will not apply the AMM parking procedure if the aircraft only has a short turnaround time or remains on the flight line. …
With the recent finding from the example incident where a Pitot probe obstruction occurred in less than two hours, it is important to know if Pitot probe protection is a priority in local airport ground handling or turnaround procedures. The aircraft operator should collaborate with the local airport authorities to assess the risk of Pitot probes being blocked by sand, dust, dirt or insects activity at their operational base or destination airports. For example, check if a wildlife management plan is part of the airport’s hazard management strategy and what mitigations are in place to detect or manage insect activity. Confirm how each airport will alert airlines or operators where there is evidence that local conditions may contribute to an increased risk of Pitot blockage to aircraft on the ground.
Depending on the outcomes of this risk assessment, the operator should consider implementing a specific policy on the use of Pitot covers even for a short turnaround time. Some airlines already have policies in place for certain airports that require Pitot covers to be used for all aircraft on the ground regardless of turnaround times.
Brisbane Airport wasp management activities
Brisbane Airport Corporation manages the risk to aircraft posed by mud wasps as part of a broader wildlife hazard management. The airport conducts bi-monthly internal wildlife management meetings and quarterly external wildlife management meetings and produces education material for airport workers. Other activities for wasp management include the application of direct and indirect control methods such as removal of nests, limiting availability of nesting materials and food sources, and selective eradication. In addition, there are ongoing studies into the activity and biology of mud wasps in the area and the effectiveness of control methods (Ecosure 2017). Some operators and ground service providers also have wasp management programmes in place.
Aircraft information
General information
The aircraft was one of 15 Airbus A330-300 aircraft operated by Malaysia Airlines. The Airbus A330 is a large capacity, wide-body, twin-engine aircraft, which is used for medium-to-long-range air transport operations and was first certified in Europe in 1993.
Inspection of the on-board aircraft documentation showed that the aircraft had one deferred defect which was an unserviceable park brake light indicator, which is located on the nose gear. It illuminates to indicate to ground personnel when the park brake is set. No other maintenance issues were recorded.
Flight control system
The Airbus A330 has fly-by-wire flight controls. The aircraft’s flight control surfaces are electrically controlled and hydraulically actuated, and flight control computers process pilot and autopilot inputs to direct the control surfaces as required. There are three flight control primary computers and two flight control secondary computers.
The flight control computers continuously monitor outputs from the 3 air data inertial reference units (ADIRUs). There are different rules for comparing discrepant values; typically, each individual value is compared with the median value. If the difference is above a predetermined threshold for a predetermined duration, then the associated part of that ADIRU was rejected and the two remaining sources were used for flight control purposes. When two sources are rejected, the system reverts from normal law to alternate law.
In normal law, the computers prevent the exceedance of a predefined safe flight envelope using a range of protections (load factor, pitch attitude, angle of attack, high speed, and bank angle).
Alternate law is used when there is insufficient air data for normal law to operate correctly. Some of the protections are not provided or are provided with alternate logic. There are two levels of alternate law; the loss of reliable airspeed means the aircraft enters the more degraded level where only load factor protection remains, and the high angle of attack protection is replaced by a stall warning.
Flight crew alerting systems
The A330’s electronic centralised aircraft monitoring (ECAM) system presents aircraft system data to the flight crew. The ECAM comprises the engine and warning display (E/WD) and system display in the centre of the instrument panel.
The lower part of the E/WD displays messages and specifies flight crew actions to be taken in the event of abnormal or emergency situations. The left section presents warning messages and the right section lists the affected systems, secondary failures, memos or special notices (such as ’LAND ASAP’).
Individual aircraft system failures are graded according to their safety effect on the aircraft. The ECAM has three failure mode levels (Figure 14). Alerts are prioritised so that higher-level alerts are displayed first, and also prioritised within each level.
Figure 14: Airbus A330 failure mode levels
WARN: warning. CAUT: caution. Source: Airbus
Master warning (flashing red) and master caution (steady amber) lit buttons are located on the glareshield in front of each pilot to draw their attention to important messages on the ECAM, and can be pushed to suppress the alerts until a new alert occurs. A continuous (repeating) chime plays when a master warning occurs, and a single chime plays when a master caution occurs.
In addition to the ECAM system, Airbus has a series of procedures for abnormal or emergency situations where flight crew may not receive an ECAM alert or warning. These are known as memory items. Memory items are procedures, or critical immediate actions of an ECAM/quick reference handbook (QRH)/operations engineering bulletin (OEB) procedure, that the flight crew must apply by memory to ensure continued safe flight. In some time-critical situations, the flight crew has no time to refer to the ECAM and/or to the QRH.
Air data indicating systems
Measurement
Most modern aircraft measure airspeed by comparing total air pressure at the front of a pitot probe with static (still) air pressure measured elsewhere. The A330 has 3 pitot probes—2 on the left side and 1 on the right side—and 6 static ports (Figure 15 and Figure 16). On the A330 and A340, the pitot probes are about 2 m above typical eye level and cannot be closely inspected without an access stand (moveable platform). Specialised equipment is needed to detect internal contamination or leakages.
Figure 15: Airbus A330 pitot probe and static port positions
Source: Airbus
Figure 16: View of an exemplar A330 from eye level, with similar pitot probe covers to those used on the occurrence aircraft
Source: ATSB
The pitot probes had a tube that projected out from the fuselage, with the opening of the tube pointed forward into the airflow. The tubes had drain holes to remove moisture and were electrically heated to prevent icing during flight. The A330 uses UTC Aerospace Systems 0851HL pitot probes (Figure 17 and Figure 18), also used on Airbus A318, A319, A320, A321 and A340 aircraft.
Each of the A330’s pitot probes and static ports are connected to a separate air data module, which converts air pressure into digital electronic signals that are passed to one of the 3 ADIRUs.
Each ADIRU comprises two parts which are integrated into a single unit: an air data reference (ADR) part and an inertial reference part. One part can be switched off while the other part can still operate. The ADRs use total pressure and static pressure to compute indicated airspeed and Mach number, which are then passed to other systems including the flight deck instruments. The inertial reference part independently calculates parameters such as groundspeed.
Figure 17: Pitot probe external view
Source: ATSB
Figure 18: Pitot probe internal construction
Representative only; the drawing shows a Thales pitot probe and not a UTC Aerospace Systems pitot probe as used on 9M-MTK.
Source: Airbus
The ADRs feed each primary flight display (PFD):
ADR 1 processes data from the captain’s pitot probe on the mid-lower left side of the airframe, digitised by the associated air data module, and is presented on the captain’s (left side) PFD.
ADR 2 processes data from the first officer’s pitot probe on the lower right side of the airframe, digitised by the associated air data module, and is presented on the first officer’s (right side) PFD (identical to the captain’s PFD).
ADR 3, processing data from the standby pitot probe on the lower left side of the airframe, digitised by the associated air data module.
The pitot probe and static ports used by ADR 3 are also used by the integrated standby instrument system (ISIS) for its display of air data.
Displays
The electronic flight instrument system displays comprise two PFDs, one in front of each pilot, showing mostly flight parameters, and two navigation displays (NDs) that show navigation data (Figure 19). The ISIS is to the right of the captain’s displays.
Figure 19: A330 instrument panel
Source: Airbus, annotated by the ATSB
Airspeed is normally displayed as a vertical tape on the left side of each PFD (Figure 20) and the ISIS (Figure 21), with altitude on the right of each. A speed trend (acceleration) vector is shown as a vertical yellow arrow when airspeed is above 30 kt, and V1 is shown with a ‘1’ symbol. Groundspeed is displayed at the top left of the NDs (Figure 22).
Figure 20: PFD on a typical take-off, showing airspeed scale (left) at 120 kt
Source: Airbus
Figure 21: ISIS showing airspeed (left) at the bottom of the scale (30 kt)
Source: ATSB
Figure 22: Groundspeed indication on ND
The ND has a number of selectable display modes, including weather radar as shown.
Source: Airbus
An air data switch on the switching control panel, at the forward end of the centre pedestal, permits the flight crew to change the source of air data for one of the PFDs to ADR 3 (Figure 23 and Figure 24). An overhead panel shows the status of each ADIRU and allows the flight crew to turn the air data or inertial part of each ADIRU off separately.
Figure 23: Air data switch
Source: ATSB
Figure 24: Part of the operator’s safety reporting process, also used for general safety risk management
Source: Airbus
Validity monitoring
The air data system has a complex and interrelated set of rules to evaluate the validity of data from the sensors. ADIRUs, flight control computers, and other equipment continuously conducts various validity checks, including the following:
Airspeed is not recorded or displayed to the flight crew when it has a calculated value below 30 kt.
When the aircraft is on the ground, airspeed is below 30 kt and groundspeed above 50 kt, the associated PFD displays a red speed flag (similar to Figure 25). The ISIS will show airspeed at the bottom of the scale at 30 kt under these conditions, and a speed flag for some other failures of the third air data system.
Generally when all airspeeds are above 90 kts on ground, or at all times in flight, the flight control system uses the median value of the 3 sources. If any of the sources deviates from the median by more than 16 kt for at least 10 s:
that airspeed source is considered invalid
the associated ADR is rejected (no longer used)
the NAV IAS DISCREPANCY (navigation indicated airspeed discrepancy) message and master caution are presented if the airspeed source was displayed on a PFD.
If an ADR is rejected or flags its data as invalid and there are then differences between the two remaining sources of more than 16 kt for at least 1 s, the remaining ADRs are rejected and the NAV ADR DISAGREE (navigation ADR disagreement) message and master caution is presented.
Angle of attack is flagged invalid when airspeed is invalid or below 60 kt.
A rejected ADR is not used by the electronic flight control system (which manages control surface movement). Autopilot and autothrust require two or three valid ADRs.
Figure 25: Speed flag on left of PFD (indicative)
This is a composite image and does not exactly reproduce the aircraft display.
Source: Airbus, modified by the ATSB
Alerts on take-off
The flight warning computer inhibits some warnings and cautions for each of the 10 predefined flight phases. Most warnings and cautions are inhibited (temporarily disabled) during some phases, including take-off, to prevent flight crew distraction from more important and time-critical tasks. In these phases, failures that require immediate crew action or affect the safety of flight (such as fire detection) remain active.
Warnings and cautions that are not considered by the manufacturer to be essential to safety in certain flight phases are inhibited (prevented from being displayed) if they appear in those phases. This is to avoid unnecessarily alerting the pilots at times of high workload (such as take-off or landing). They are displayed in the next flight phase for which they are not inhibited if the condition still exists. Examples are listed in Table 1.
Table 1: Selected warnings and cautions and applicability during take-off
Annunciation
Description
Availability during take-off
Alert level
Alert type
NAV IAS DISCREPANCY
With 3 valid airspeed sources, one airspeed source deviates from the median by more than 16 kt for at least 10 seconds
Active after the aircraft reaches 80 kt, but may not always trigger as it requires all airspeeds to be above 30 kt, and a 16-kt discrepancy to remain present for at least 10 seconds
Caution
Aural and visual
NAV ADR DISAGREE
After an ADR is rejected or flags its data as invalid, there are then differences between the two remaining sources of more than 16 kt for at least 1 second
Inhibited
Caution
Aural and visual
NAV ADR 1 FAULT
Fault within ADR(s) or absent data from ADR(s)[35]
Inhibited after 80 kt if valid airspeed is available
Caution
Aural and visual
NAV ADR 1+2 FAULT
NAV ADR 1+2+3 FAULT
Warning
Aural and visual
ENG FIRE
Engine fire detected
Active except from V1 to 15 seconds after lift-off
Warning
Aural and visual
APU FIRE
Auxiliary power unit fire detected
Active except from V1 to 15 seconds after lift-off
The back up speed scale (BUSS), fitted to 9M-MTK, has been available as standard fitment on the Airbus A380, and as an option on the A330/A340 since 2006 and the A320 series since 2007, with a reported cost of about €300,000 per aircraft in 2010.[37]
The BUSS is activated by turning off all the ADRs. The BUSS then provides flight crews with a visual indication of the safe speed envelope related to angle-of-attack, obtained through the inertial reference part of the ADIRUs (Figure 26). The airspeed tape on the PFDs, or speed flag if present, is replaced with a colour-coded scale. The pilot flying (PF) maintains the indication within the green zone by adjusting pitch and thrust. Since turning the ADRs off makes static pressure unavailable, pressure altitude is replaced with GPS altitude (Figure 27).
Figure 26: Back up speed scale display
Source: Airbus
Figure 27: Back up altitude display with BUSS active
Source: ATSB
With the BUSS active:
the flight crew adjusts aircraft pitch and thrust to keep the indicator within the green area of the speed scale
the stall warning remains operational
cabin pressure must be controlled manually
the flight crew are not permitted to use speed brakes (because this affects the relationship between angle-of-attack and airspeed and will cause the BUSS to display erroneous data)
the flight crew should aim to change the aircraft configuration (extending or retracting flaps or landing gear) with wings level and aim to do so when the indicator is within specific regions of the green band.
Flight crew information
The captain had flown for Malaysia Airlines since 1993 on Boeing 747 and 737 variants, transferring to the Airbus A330 in May 2017 and cleared to line operations in the A330 in September 2017. The FO had flown for the operator since 2009 on the Boeing 737, transferring to the Airbus A330 in 2011. Both pilots held the appropriate qualifications to conduct the flight.
The captain had 14,411 total flying hours, including 555 on the A330. The FO had 6,544 flying hours, including 4,583 on the A330.
The flight crew had arrived in Brisbane on 16 July and had 48 hours’ opportunity to rest before the flight. The captain reported feeling adequately rested.
Further flight crew details are in Appendix B.
Flight crew procedures
See Activities and duties in preparation for flight for information about the flight crew walk-around procedure.
General principles
Flight crew procedures and guidance were tailored to the operator from standard Airbus documents, and comprised the:
flight crew operating manual (FCOM), which included information about the aircraft systems, performance information, loading data, and standard operating procedures
quick reference handbook (QRH) for in-flight reference of some procedures and performance information
The operator also had an operations manual for general policies and procedures not specific to aircraft types.
The FCTM stated that the PF is required to ‘monitor and control the pitch attitude, bank angle, airspeed, thrust, sideslip, heading, etc., in order to achieve and maintain the desired targets…’ The PM was required to ‘actively monitor’ flight parameters and call out any excessive deviation. This role was described as ‘very important’.
According to the relevant policies, flight crew were required to announce and confirm the initiation of any procedure, as well as changing aircraft settings other than flight control, thrust manipulation, seat adjustment and the like.
On first recognition of an abnormal situation or emergency that requires a procedure to be completed, the crewmember who first recognised the situation was required reset the master warning/caution if applicable. For each ECAM procedure, the pilot monitoring was required to call out the title of the applicable procedure. This allowed each pilot to be aware of the situation and be prepared to react correctly in regard to standard operating procedures, crew coordination, task sharing and communication.
In some time-critical situations, there may be critical actions of a procedure that the flight crew must apply immediately by memory to ensure a safe flight path rather than refer to the ECAM or QRH. If the procedure has memory items the flight crew must carry them out before any other actions, while calling the relevant procedure using specific terms, such as ‘unreliable speed’.
The FCTM stated:
The flight crew must ensure a safe flight path. If the safe conduct of the flight is affected, the flight crew applies the memory items.
The memory items enable to rapidly establish safe flight conditions for a limited period of time in all phases of flight and in all aircraft configurations (weight and slats/flaps).
The flight crew must apply the memory items, if they have a doubt on their ability to safely fly the aircraft in the short term with the current parameters, i.e.:
- The flight crew has lost situation awareness, or
- The current pitch and thrust are not appropriate for the current flight conditions, or
- The aircraft has an unexpected flight path for the current flight conditions.
There were ten A330 procedures with memory items:
loss of braking
emergency descent
stall recovery
stall warning at lift off
unreliable speed indication
EGPWS cautions
EGPWS warnings
TCAS warnings
windshear
windshear ahead
After the memory items are complete, the PF should then command applicable ECAM or QRH actions. This prompts the pilot monitoring (PM) to manage the failure by first confirming the failure and then conducting the procedure as displayed electronically or with the QRH carried in the flight deck.
In abnormal operations the following principles applied, as written in the FCTM:
The FCTM stated that the PF takes over communication duty from the PM in abnormal operations because ‘the cognitive skills of the PM are mostly dedicated to the understanding and the application of the ECAM/QRH/OEB actions. Therefore, their situation awareness of the environment and the navigation is less effective than the PF’s one.’
The FCTM stated that the flight crew must pause any normal or abnormal procedures or ECAM actions currently underway to perform the After Take-off/Climb procedure (or any other normal procedure that is due), stating:
The flight crew must perform the pending normal C/L [checklist (procedure)] at this stage as it is a good compromise between the necessary application of ECAM procedures and system analysis and the delay in the check of systems status (e.g. in the case of failure after takeoff, flaps and landing gear retracted)
Pre-flight procedures
The relevant parts of the Preliminary cockpit preparation procedure and the Before start checklist are shown in Figure 28 and Figure 29 respectively.
The Preliminary cockpit preparation procedure required the pilot monitoring to check that the gear pins and covers (meaning pitot probe covers and the like) were stowed onboard (in the flight deck), followed by the external aircraft walk-around. More information on the walk-around is in Flight crew walk-around procedure.
The first item of the Before start procedure required the crew to both confirm that they had previously completed the Preliminary cockpit preparation procedure.[40] The second item of the Before start checklist was for the flight crew to cross-check that the ‘gear pins and covers’ had been removed. Since this is after the completion of the flight crew walk‑around and flight deck compartment check (both part of the Preliminary cockpit preparation procedure), this item effectively reconfirms the findings of those checks with regard to the gear pins and covers.
Figure 28: Extract from Preliminary cockpit preparation procedure
Source: Malaysia Airlines
Figure 29: Before start checklist
Source: Malaysia Airlines
Take-off procedure
Tasks and monitoring
During a take-off, the PF is required to set take-off thrust, maintain directional control along the runway centreline and occasionally scan the engine instruments and airspeed. The PM is required to monitor engine instruments and airspeed.
The take-off procedure as written in the QRH is provided in Figure 30, and additional guidance from the FCOM is provided in Figure 31. The 100 kt announcement (by the PM) and cross-check (by the PF) must be referenced using airspeed. The PM is required to monitor for an automatic callout at V1; if it is not made, the PM must announce it.
Figure 30: Take-off procedure in QRH
Source: Malaysia Airlines
Figure 31: Take-off guidance in FCOM
EPR and EGT are engine parameters.
Source: Malaysia Airlines
In addition to the required actions, it is normal for both flight crewmembers to perform some monitoring of things that are not their primary responsibility. For example, the PF may check flight and engine instruments and the PM may look outside the aircraft to check for traffic and monitor the aircraft’s course.
The PF normally rotates to 15° pitch attitude then follows the aircraft’s speed reference system (SRS) guidance, which provides an indication of the required pitch attitude to maintain a predetermined climb speed in the current configuration. The autopilot can be used to follow the SRS. In alternate law, SRS is not available.
Rejected take-off
The Malaysia Airlines operating procedures stated that the captain held sole responsibility for the decision and action to reject the take-off or continue.
The FCTM included guidance to assist captains with their decision-making process, and provided standard terminology for take-off decision callouts:
It is … recommended that the Captain keeps his hand on the thrust levers until the aircraft reaches V1, whether he is Pilot Flying (PF) or Pilot Monitoring (PM).
- If a malfunction occurs before V1, for which the Captain does not intend to reject the takeoff, he will announce his intention by calling "GO".
- If a decision is made to reject the takeoff, the Captain calls "STOP". This call both confirms the decision to reject the takeoff and also states that the Captain now has control. It is the only time that hand-over of control is not accompanied by the phrase "I have control".
The take-off is divided into two phases: low speed (below 100 kt) and high speed (above 100 kt). Guidance on the decision-making for a rejected take-off from the FCTM is shown in Figure 32.
Figure 32: Rejected take-off decision guidance in FCTM
ENG: engine. F/CTL: flight control. EGT: exhaust gas temperature. Source: Malaysia Airlines
Unreliable airspeed procedure
Detection
Erroneous (or unreliable) airspeed can be detected in a number of ways, including:
the aircraft detects a problem and alerts the flight crew through:
a speed flag on the PFD
an ECAM alert
the flight crew detect a problem directly, through:
observing abnormal airspeed values or trends
comparing any of the three airspeed displays throughout the take-off, all of which can be seen from both flight crew positions
performing the 100 kt cross-check.
Airbus analysis of reported unreliable airspeed events at take-off found that all significant airspeed anomalies appeared before the aircraft reached 100 kt.
The FCTM stated:
The ADRs detect most of the failures affecting the airspeed or altitude indications. These failures lead to:
- Lose the associated speed or altitude indications in the cockpit
- Trigger the associated ECAM alerts.
However, there may be cases where an airspeed and/or altitude output is erroneous, while the ADRs do not detect it as erroneous. In such a case, no ECAM alert is triggered and the cockpit indications may appear to be normal whereas they are actually false. Flight crews must have in mind the typical symptoms associated with such cases in order to detect this situation early and apply the "UNRELIABLE SPEED INDICATION" QRH procedure.
The FCTM detailed the effects in normal flight, with one erroneous ADR, and with two or three erroneous but different ADR outputs. The FCTM additionally provided the following case (in entirety):
ONE ADR IS CORRECT, BUT THE OTHER TWO ADRS PROVIDE THE SAME ERRONEOUS OUTPUT, OR IF ALL THREE ADRS PROVIDE CONSISTENT AND ERRONEOUS DATA:
The systems reject the correct ADR and continue to operate using the two erroneous but consistent ADRs. The flight crew can encounter such a situation when, for example, two or all three pitot tubes are obstructed at the same time, to the same degree, and in the same way. (Flight through a cloud of volcanic ash, takeoff with two pitots obstructed by foreign matter (mud, insects)).
Regarding differences between airspeed indications the FCTM stated:
The most probable reason for erroneous airspeed and/or altitude information is an obstruction of the pitot and/or static probes. Depending on how the probe(s) is obstructed, the effects on cockpit indications differ.
It is highly unlikely that the aircraft probes will be obstructed at the same time, to the same degree and in the same way. Therefore, the first effect of erroneous airspeed/altitude data in the cockpit will most probably be a discrepancy between the various indications (CAPT PFD, F/O PFD and STBY instruments).
ATSB observation
Although the A330 flight crew techniques manual correctly stated that an ADR would be rejected by aircraft systems with two erroneous yet similar air data indications, it incorrectly stated that the same effect would also occur in the case of three erroneous yet similar air data indications. However, the ATSB considered it very unlikely that two flight crew members faced with this scenario would both misunderstand the description to the extent that it would lead to an incorrect diagnosis of the problem or an incorrect response.
The FCTM provided five non-exhaustive examples of airspeed failure cases and their varying consequences, and explained in detail the effects of pitot probe obstruction during flight, where ice blockages are a significant hazard. One example discussed the effects of total pitot obstruction due to foreign objects, one of the effects of which was constant indicated airspeed. There were no examples specific to the take-off phase of flight. The FCTM stated:
It should be noted that the cases described … cover situations where probes (eg pitot) are totally obstructed. There can be multiple intermediate configurations with similar, but not exactly identical consequences. The … table clearly illustrates that no single rule can be given to conclusively identify all possible erroneous airspeed/altitude indications cases.
In correspondence with ATSB in 2021, Airbus emphasised the importance of flight crew monitoring on take-off, stating that the known causes of unreliable airspeed would lead to the condition being detectable by pilots prior to 100 kt.
Management
When detecting erroneous airspeed, the observing pilot is required to immediately call ‘unreliable speed’ and the flight crew then apply the Unreliable speed indication procedure. The procedure is not associated with an ECAM message. This procedure stated that if the ‘safe conduct of the flight is impacted’ the flight crew were required to carry out a set of memory items which included:
autopilot, autothrust, and flight directors off
pitch and thrust:
15° pitch and take-off/go-around (TOGA) thrust (when below the thrust reduction altitude[41]
10° pitch and climb thrust (when between the thrust reduction altitude and 10,000 ft)
5° pitch above 10,000 ft
maintain flap configuration, or set to configuration 3 if full flaps are set
retract speedbrake and landing gear
level off for troubleshooting when at or above the minimum safe altitude or circuit altitude.
The Unreliable speed indication procedure did not give separate instructions for take-off. There was no specific instruction or guidance in the flight manuals on the type or number of unreliable airspeed indications for which a take-off should be rejected. In a March 2021 article of the Airbus Safety First magazine[42] titled Unreliable airspeed at takeoff, Airbus stated that a ‘flight crew should be prepared to reject the takeoff at the time of the 100 kt crosscheck if an airspeed discrepancy is observed.’
When a safe flight path is assured, the flight crew can level off and maintain a safe speed using tables in the QRH that provide pitch angles and thrust settings (these vary depending on the aircraft’s altitude, weight, and configuration).
When all ADRs are affected or the flight crew cannot identify the faulty ADR(s), and the aircraft is below flight level 250, the flight crew are required to switch OFF all ADRs, activating the BUSS.
Training
Unreliable airspeed indication is a standard training scenario delivered to most pilots, usually simulated during climb, cruise or descent. Anecdotally, specific training for unreliable airspeed on take-off is rarely, if ever, part of an airline’s regime. The operator’s pilots received separate training and guidance on unreliable airspeed and rejected take-off scenarios separately, but there was no specific guidance for unreliable airspeed on take-off in the aircraft flight manuals, and the occurrence pilots did not receive training for this situation
Non-mandatory additional guidance
A number of articles published by Airbus in its Safety First magazine addressed unreliable airspeed in flight and during take-off. A 2007 article stated:
An unreliable speed situation may be difficult to identify, due to the multiple scenarios that can lead to it. Therefore, training is a key element: indeed the flight crew’s ability to rapidly detect the abnormal situation, and to correctly handle it, is crucial. In case of any doubt, the pilot should apply the pitch/thrust memory items, and then refer to the QRH to safely fly the aircraft, and to positively determine the faulty source(s) before eliminating it (them).
With regard to take-off, a later article stated (Airbus 2021):
Early detection of an unreliable airspeed event will enable the flight crew to reject the takeoff at a lower speed. From the start of the takeoff roll, the pilot monitoring must check for inconsistent airspeed indications, abnormal airspeed trends, or the absence of airspeed indications, and alert the pilot flying as early as possible if an issue is detected.
In correspondence with the ATSB, Airbus later confirmed that a flight crew has to consider rejecting the take-off if unreliable airspeed is observed before reaching 100 kt. Articles that addressed unreliable airspeed during take-off advised to reject the take-off if unreliable airspeed is observed before the decision speed. The 2021 article stated:
The 100 kt crosscheck is the last line of defense to prevent taking off with an unreliable airspeed indication. The flight crew should be prepared to reject the takeoff at the time of the 100 kt crosscheck if an airspeed discrepancy is observed.
An earlier Safety First article (Airbus 2006) also advised pilots to ‘abort their take-offs when airspeed indication is detected unreliable’, adding:
…after take-off thrust setting, both crewmembers should scan airspeed indications. In case of detection of an unreliable condition of one of the airspeeds before V1, take-off should be aborted.
In some articles, Airbus advised flight crews to follow the Unreliable speed indication procedure in all flight phases, including take-off (Airbus 2007):
If the safe conduct of the flight is affected, the flight crew applies the memory items: these allow “safe flight conditions” to be rapidly established in all flight phases (take-off, climb, cruise) and aircraft configurations (weight and slats/flaps). The memory items apply more particularly when a failure appears just after take-off.
A further Safety First article about ice ridges (which can form on the ground in cold conditions and disrupt airspeed measurements during take-off) similarly advised (Airbus 2018):
What to do in the case of an unreliable speed event during takeoff?
…in any event where an airspeed discrepancy is detected by the flight crew, the UNRELIABLE SPEED INDICATION must be applied. Refer to FCOM UNRELIABLE SPEED INDICATION procedure and associated FCTM chapter for more information on the procedure application.
With regard to how unreliable airspeeds will appear to pilots, the 2006 Safety First article gave an example where an aircraft had two simultaneous and near-identical pitot probe blockages on take-off and discussed the potentially very serious effects of this scenario on aircraft controllability, particularly at higher speeds. Conversely, a later article titled The Adverse Effects of Unrealistic Simulator Scenarios stated (Airbus 2019):
Multiple Pitot obstructions can never occur exactly at the same time and can never have permanently the same obstruction characteristics [over] time. This is fundamental because multiple Pitot obstructions will undoubtedly lead to airspeed discrepancy detected by the flight control system which, in this case, will reject the erroneous airspeed information and associated ADR and revert to alternate law.
This 2019 article was about training scenarios that simulate simultaneous blockage of both openings in multiple pitot probes (which has different effects to this occurrence), arguing that it is not a realistic training scenario because such an occurrence had never happened in operation.
In 2021, the ATSB asked Airbus for its recommendation for how flight crews should respond to an airspeed discrepancy that is identified after 100 kt but before V1. Airbus stated that:
…above 100kts, and approaching V1, the Captain should be "go-minded" and only reject the takeoff in very few occasions such as sudden loss of thrust, any indication that the aircraft will not fly safely, any triggering of ECAM alert. Thus, UAS [unreliable airspeed] events do not belong to the events that the crew has to consider for discontinuing the take-off above 100 kt.
In further correspondence in 2022, the ATSB asked Airbus to provide further guidance on specific scenarios (such as the single complete loss of airspeed detected before the 100 kt airspeed check, or scenarios where unreliable airspeed was detected at 100 kt). Airbus responded that the decision to continue or reject a take-off lies with the captain and that all significant unreliable airspeed events were present from low speed and were detectable before 100 kt. The French Bureau d'Enquêtes et d'Analyses pour la Sécurité de l'Aviation Civile (BEA) and Airbus advised the ATSB that they ‘do not consider that there is a need to specifically address the case of unreliable airspeed being identified after 100 kt.’
Sterile flight deck procedure
The purpose of a sterile flight deck is to focus the flight crew’s attention on their primary operational duties, usually applied during the departure and approach phases of flight. In these periods, pilots are not permitted to engage in non-essential conversations that are not pertinent to safe aircraft operation or to engage in any activity which could distract any flight crew member from the safe conduct of their duties.
The operator’s sterile flight deck policy was outlined in its operations manual. It stated the requirements for departures which included:
The period shall be in effect during critical phases of flight. Critical phase of flight involves all ground operations from taxi, take-off, landing, and all other flight operations below 10,000 feet above mean sea level, except cruise flight.
Specifically, the departures phase was defined as:
…from pushback (or as determined by the PIC [pilot in command; i.e. captain] due operation reasons) until the Fasten seat belt sign is switched off during climb.
Flight crew training
Flight crew training overview
Malaysia Airlines flight crews were required to complete recurrent training and checks. Normal procedures were assessed during aircraft flights (line checks) and simulator sessions (recurrent training and proficiency checks). Abnormal and emergency procedures such as unreliable airspeed and rejected take-off scenarios were included in simulator training and proficiency checks. Several recurrent elements would be trained or assessed in each session, with full coverage expected over a period of years (3 years in Australia).
In flight operations generally, assessable skills can be divided into two categories:
technical skills: the manipulative and knowledge skills a pilot employs while operating an aircraft
non-technical skills (NTS): the cognitive, social, and personal resource skills that complement technical skills and contribute to safe and efficient task performance (Flin and others 2008).
The operator graded performance in technical skills for line and proficiency checks using a 5‑point scale with the option for the trainer to provide additional information about each grading by marking one or more reason codes. The 7 reason codes were split into domains (knowledge, skills, and affective) and global markers (communications and communication environment, leadership, situation awareness, and decision-making).
NTS was evaluated and separately graded at each training session, proficiency check, and line check. The operator defined 10 assessable NTS elements (such as monitor/cross check, workload assignment and management, assertiveness and receptiveness), and 3 phases of flight to which some or all elements applied (before take-off, take-off to cruise, and descent to taxi). This meant the evaluator marked a total of 26 NTS elements during each flight crew assessment. NTS grades used a 3-point scale: satisfactory, satisfactory with briefing, and unsatisfactory. Behavioural markers (observable behaviours) for each skill were defined.
The ATSB compared the Malaysia Airlines approach to NTS evaluation with that of 4 other airlines operating in Australia and New Zealand. These operators all provided 4–5 NTS markers among the reason codes for grading technical skills, and only one graded NTS separately to technical skills (using a 5-point scale).
ATSB observation
Unlike most other reviewed operators, Malaysia Airlines assessed NTS separately to technical skills. This probably provided significant advantages over the method of evaluating NTS only as markers for the performance of technical tasks. This was with a 3-point grading scale, whereas the other operator that evaluated NTS separately used a 5-point scale.
The flight crew’s most recent simulator proficiency checks and recurrent training were in January 2018 (captain) and March 2018 (FO). They were assessed as meeting the operator’s standard. The captain was debriefed on standard operating procedures, ECAM management, task management and problem solving. The FO was debriefed on monitoring/cross-checking and assertiveness.
Flight crew walk-around
The captain was last assessed in external visual inspection of the A330 in September 2017, receiving a grading of 3 (‘consistently meets and sometimes exceeds expectations’). The captain’s only other assessments on record for the flight crew walk-around since 2015 were during line checks on the 737, for which the captain received one grading of 4 (‘consistently exceeds expectations and sometimes only meets expectations’) and one grading of 5 (‘consistently exceeds expectations’ and ‘no area for improvement is readily identifiable’).
In interview, the captain said that the walk-around training took about an hour. The captain described the flight crew walk-around as ‘cursory’. The captain reported that they were not shown what a static or pitot probe cover looked like during walk-around and had not seen them before, other than on aircraft in storage from a distance.
Unreliable airspeed indication
Both flight crew demonstrated competency separately in an unreliable airspeed scenario during their last recurrent training in early 2018. Records showed that both received ‘satisfactory with briefing’ gradings on the element relevant to this scenario. The records did not state the phase of flight where this scenario was applied; the FO recalled theirs to be during the cruise phase and stated that they had not received training for unreliable airspeed during take-off, and until this occurrence did not know whether to reject the take-off. Both flight crew had used the BUSS during the scenario.
The captain’s training record had check marks in the ‘knowledge’, ‘affect’, and ‘situational awareness’ reason boxes and remarks indicating that a briefing was conducted on the application of the unreliable airspeed procedure and flight path management.
The FO’s training record had check marks in the ‘knowledge’ reason box and remarks indicating that there was a briefing on assertiveness and knowledge.
Rejected take-off
Pilots were required to complete a proficiency check in a simulator every 6 months, and it was mandatory for pilots to be assessed in rejected take-off procedures during that check. Anecdotally, rejected take-off scenarios are commonly associated with ECAM alerts and engine failures.
Both flight crew had been assessed in the conduct of a scenario described as ‘a rejected take-off at a reasonable speed before reaching V1’ during their last proficiency checks, each receiving a grading of 4.
The captain had been assessed on this element for the A330 on only one other occasion, receiving a grading of 3. The captain previously received gradings of 4 or 5 in proficiency checks for the 737.
The FO had been assessed on this element for the A330 on several occasions in the previous 3 years, receiving a grading of 4 each time.
Non-technical skills
In the 2 years prior to the occurrence, the captain was assessed for NTS 5 times and the FO was assessed 10 times. They each mostly received almost entirely ‘S’ gradings with the following relevant exceptions:
on the captain’s most recent assessment, they received a ‘satisfactory with briefing’ grading for the ‘monitor/cross check’ element for the flight phase from take-off to cruise, and the phase from descent to taxi.
the FO received ‘satisfactory with briefing’ gradings for the ‘assertiveness’ and ‘monitor/cross check’ elements in March 2018 and August 2017 respectively.
Study on flight crew take-off monitoring
In 2018/19, a study of flight crew monitoring in an Airbus A380 simulator was conducted using specialised eye-tracking equipment (Knabl and others 2018). It examined aspects of instrument monitoring for several captains and first officers as both PF and PM, including how this affected their decisions to continue or reject a take-off with a simulated engine failure at 10 kt before V1 (a period of about 3 s) when presented with ‘ambiguous cues in a time-critical situation’. The cues were abnormal engine indications and a slight yaw movement to simulate an engine failure with limited cues:
A non-critical engine failure (ENG [engine] 2 flame-out) occurred at V1-10kt which was set at 119kt. No ECAM [message] was triggered but the ENG failure could be identified by monitoring the engine display. Moreover, a slight yaw movement of the aircraft would have served as a cue which would have been easier to detect for the PF than the PM.
There were no master warning/caution alerts generated by the simulated engine failure. A total of 13 scenarios were observed, with a captain being assigned as PF on 6 occasions and PM on 7 occasions.
The participants generally reported having a ‘more active monitoring’ behaviour than usual, including more attention on the instruments, due to the nature of the test and their expectation that something would go wrong. It should also be noted that the flight crews were being examined on their ability to detect changes on a different display (the engine/warning display in the centre of the instrument panel) than the PFD.
The study found that:
visual behaviour (scan patterns) ‘differed greatly’ among the pilots
6 crews rejected the take-off and 7 continued
6 of the 7 captains in the PM role continued the take-off, while 5 of the 6 captains in the PF role rejected the take-off
for crew who continued the take-off, the PM spent ‘considerably’ more time looking outside (particularly those qualified as captains), and less time looking at the PFD, to those who rejected the take-off
the PM of crews who rejected the take-off generally spent more time looking outside than PMs of crews who continued, and less time looking at the PFD
overall, above 100 kt, the PF primarily looked at out of the windscreen (82% of the time) followed by the PFD (9%)
above 100 kt, the PM primarily looked at the PFD (40% of the time) and out of the windscreen (35%)
two PMs (who were also both captains) were looking at the engine instruments at the time of the simulated failure but did not respond (‘looking without seeing’).
Aeronautical charts
En route supplement Australia
General information
Australian regulations required an aerodrome operator to ensure sufficient information about the aerodrome was published in the En Route Supplement Australia (ERSA).[43] These include runways specifications and local precautions. The ERSA contains information used for planning a flight and for the pilot in flight.
The manual of standards for Civil Aviation Safety Regulation (CASR) Part 139 – Aerodromes provided further details of the information to be included in the ERSA. This included the width and lighting information for each runway and ‘important cautionary or administrative information relating to the use of the aerodrome’. For example, the ‘additional information’ section of the ERSA for the aerodrome was also required to include ‘significant local data’. For many Australian aerodromes, this section contained hazards such as birds or other animals, weather balloon launches, or the likelihood of turbulence on approach to a runway.
Brisbane airport En Route Supplement
From November 2015 onwards, the ERSA information for Brisbane Airport included a note regarding significant mud wasp activity, and the following other safety-relevant information:
2. Significant bird hazard exists.
a. Nankeen Kestrel (birds of prey), peak activity on airfield expected March-July.
b. Australian White Ibis flocking on airfield HJ [sunrise to sunset], increased numbers expected February-June.
c. Straw Necked Ibis present on airfield HJ, increased numbers expected July-October.
d. Flying Fox HN [sunset to sunrise] only.
e. Cattle Egret present on airfield HJ, increased numbers expected NOV-MAR.
f. Increased pelican and cormorant in VCY of AD [vicinity of aerodrome].
3. Significant mud wasp ACT WI AD VCY [activity within aerodrome vicinity] affecting pitot tubes. Pitot tube covers recommended.
The ERSA entry for Brisbane Airport also had information about the potential for false course capture from a navigation aid.
Lido route manual
Airport operational information
The Lido route manual, published by Lufthansa Systems, was used by Malaysia Airlines to provide charts and aerodrome information to its flight crew. The suite of documents included the airport operational information (AOI).
The Lido AOIs contain information about a particular airport. The AOIs are arranged into general, arrival, and departure chapters, with a subsection for ‘warnings’ in the general chapter. The Lido AOI warning information for Brisbane Airport included the same information as in the ERSA about the false course capture (but presented differently), and the following:
Birds in vicinity of AD [aerodrome], increased number expected NOV-MAR.
The ATSB compared the warning information in the 2020 Lido AOIs for Melbourne, Darwin, Perth, and Sydney with the relevant ERSA information. Melbourne and Perth closely aligned with the ERSA data. The Darwin AOI did not include information regarding unlit military helicopter operations in the area and the Sydney AOI did not include information about the hazard posed by a searchlight in the area.
Lido chart development process
The ATSB sought information from Lido about the content development, and revision process of its AOI. Lido stated that as the Lido route manual is designed to carry relevant information for pilots only, not all AIP content is transferred to the AOI. Lido’s guidance manual for such decisions stated that charts should include:
Caution notes for dangers such as bird hazards or strolling animals on RWY [runway] shall be published.
With regard to the expertise of the people involved, Lido advised the ATSB:
Generally, if a person applies to work for our Route Manual production, he or she shall have a strong aviation background (pilot, air traffic controller, dispatcher) or have long-term experience in the area of professional aviation. Then, after having applied successfully, the person undergoes training according to a team dedicated training concept. Amongst many other topics, the content of the QuickRef [Lido’s guidance manual] is part of this.
The relevant process flowchart provided showed a quality check at the end of production.
Other sources of aerodrome information
The Australia Airport Directory, a similar publication published by Jeppesen used by some other airlines operating in Australia, had the following in the Brisbane airport information section:
Significant mud wasp activity within apt [airport] vicinity affecting pilot tubes. Pitot tube covers recommended.
Pitot probe covers
Overview
Pitot probes can become blocked by a range of contaminants including dust, sand, water (such as rainwater, ice accumulation, condensation, or water used during washing), by the remains of insects or other animals after in-flight impact, or by the nesting activity of insects such as mud wasps.
Pitot probe covers provide protection from foreign object obstruction when the aircraft is on the ground. The need for pitot probe covers is dependent on a number of factors, such as the duration the aircraft is on the ground, and local factors such as wildlife and weather. There may be a formal requirement by operators to fit pitot probe covers in these circumstances. Because pitot probes are heated in-flight, maintainers need to wait 15-30 minutes for them to cool after landing before fitting covers (Airbus 2016).
Pitot probe covers typically incorporate a ‘remove before flight’ warning streamer (also known as a flag or ribbon) intended to alert relevant personnel of its presence. Streamers come in various lengths[44] that are determined by a design specification, or locally fabricated as required. Visibility of the streamer may be improved by fitting an extended streamer or incorporating a lanyard between the cover and its streamer.
Pitot probe covers are regarded as ground service equipment (GSE). Other examples of GSE include towbars, landing gear lock pins and aircraft jacks. While there are some exceptions, GSE is not fitted to an aircraft for flight. GSE can be supplied by an aircraft manufacturer, be generic across multiple aircraft types, or be manufactured by a third party to be comparable in function, however sometimes it may be different in design. GSE manufactured by a third party or locally can be approved internally by operators as there are no regulatory requirements for GSE.[45]
Pitot probe covers are typically supplied by the aircraft manufacturer with a new aircraft. Over time as they become worn, operators may choose to replace them with a cover manufactured by a third party. Airbus advised the ATSB:
Flight kit and its content (including Pitot covers) are referenced in the IPC [illustrated parts catalogue] (IPC 25-73-04-01). As such, it is part of aircraft configuration. Airbus recommends managing the flight kit and its content like any IPC item. If an operator uses alternative covers not included in the IPC, it is under its own responsibility. This is what is reminded in ISI [in-service information] 34.11.00026, section 5.6.4.
Malaysia Airlines pitot probe covers
At some time in 2018 prior to commencing flights to Brisbane, Malaysia Airlines supplied Aircraft Maintenance Services Australia (AMSA) with a set of Airbus-approved pitot probe covers (Figure 33). These were not fitted to the occurrence aircraft.
Figure 33: Airbus-approved pitot probe covers supplied by Malaysia Airlines to AMSA
Source: AMSA
Aircraft Maintenance Services Australia pitot probe covers
The pitot probe covers fitted to the occurrence aircraft were the property of AMSA, and manufactured by a company specialising in ground support equipment. AMSA fitted these covers to any operators’ A330 aircraft as part of AMSA’s compliment of equipment used during aircraft receipt and dispatch.
The pitot probe covers fitted to 9M-MTK were manufactured by Sesame Technologies with part number KPC4-480-321. They consisted of a triple-layer woven Kevlar sheath about 12 cm long, with a non-reflective 30 cm ‘remove before flight’ warning streamer attached by a short lanyard (Figure 34). They could be installed by hand using an access stand, or alternatively, a pair of loops at the opening of the cover enabled them to be fitted from the ground using a special pole. A single loop on the opposite end enabled them to be removed with the same pole. These poles were not used by AMSA.
Figure 34: Pitot probe covers removed from 9M-MTK after the occurrence flight, and exemplar covers of the same type
Source: ATSB
Airbus pitot probe covers
The pitot probe covers approved for use by Airbus are a synthetic fabric sheath 22 cm long (Figure 35 and Figure 36). The sheath is held in place on the pitot probe by spring clips. A 30 cm ‘remove before flight’ warning streamer is attached to the sheath by a 21 cm lanyard making the overall length of the streamer/lanyard assembly about 51 cm. This pitot probe cover is listed in the A330 illustrated parts catalogue as part number 98A10001005000, with an alternate part number of A1000100500000. There are no other alternatives approved by Airbus, which stated that ‘using the approved pitot probe covers is important as the covers for other manufacturers’ aircraft may not be the correct fit or offer complete protection for the pitot probes of Airbus aircraft’ (Airbus 2016).
Figure 35: Airbus-approved pitot probe cover with lanyard and streamer
Source: ATSB
Figure 36: Airbus-approved pitot probe covers fitted to the left side pitot probes of an A330
Source: Malaysia Airlines
Other pitot probe covers and flight deck warning placard
Some operators use extended streamers for improved visibility during turnaround operations in Brisbane (Figure 37) or flight deck placards to alert flight crews of the presence of covers (Figure 38). A manufacturer of pitot probe covers is developing a system to alert flight crews of the presence of covers with a visual indicator that attaches to an aircraft’s window (Figure 39).
Figure 37: Exemplar pitot probe covers with extended streamers for improved visibility
Figure 39: Visual indicator of probe cover fitment
Source: Sesame Technologies
Activities and duties in preparation for flight
Use of pitot probe covers
Brisbane Airport is the only port used by Malaysia Airlines with a known mud wasp problem, and one of a very small number worldwide where the use of pitot probe covers during short turnarounds is recommended to prevent insect infestation.
Malaysia Airlines sent one set of pitot probe covers to AMSA but had not formalised their use. The provisional contract with AMSA included a provision for AMSA to provide various covers, including for pitot probes, with no detail on requirements for their fitment.[46]
AMSA was contractually required to use pitot probe covers for some other airlines in Brisbane. There was no written guidance on this subject issued by AMSA to its employees. AMSA managers and engineers reported that they preferred to use pitot probe covers for airlines that did not specifically request it, including Malaysia Airlines, because of the risk of mud wasp infestation.
The Malaysia Airlines technical handling manual did not require a technical log entry to record the fitment of pitot probe covers, but engineers were able to do so. When interviewed, AMSA managers stated that they expected a maintenance log entry would be made by an appropriately approved person for the fitment of pitot probe covers. The technical log is checked by flight crew prior to departure, and any open entry such as the fitment of pitot probe covers would require rectification before dispatch.
Of the 21 available technical logs of Malaysia Airlines A330 turnarounds in Brisbane between 9 June and 18 July 2018, 4 contained entries for the fitment of pitot probe covers. Covers might have been used on other flights but were not recorded.
Records showed that the AMSA support engineer had handled 4 other Malaysia Airlines aircraft in this period, as well as the occurrence aircraft. One of these was the 12 July turnaround for which a CCTV recording was available, where pitot probe covers were not used. Technical logs for the other 3 flights recorded the use of pitot probe covers once. This was the only turnaround for Malaysia Airlines that the support engineer recalled, reporting that they were instructed to fit (and later remove) the covers by the Malaysia Airlines engineer.
The Malaysia Airlines’ investigation report indicated that engineers had sometimes requested permission from the Malaysia Airlines engineers to fit covers or told the engineers that covers had been fitted. When asked, the Malaysia Airlines engineers typically instructed AMSA engineers not to install pitot probe covers when they were asked, due to the short turnaround time and because it was not a standard procedure for Malaysia Airlines. After the occurrence, the licensed aircraft engineer (LAE) heard from another engineer that, on at least one previous occasion, another of the Malaysia Airlines’ engineers had noticed that pitot probe covers were fitted and asked for them to be removed.
Flight crew
Flight crew walk-around procedure
The Malaysia Airlines operations manual stated:
Prior to each flight, maintenance must verify the airplane condition is acceptable for flight. The flight crew will also conduct a cursory walk around to verify the aircraft exterior is in a satisfactory condition. During the exterior aircraft inspection (walk-around), flight crew shall focus on safety critical areas of the aircraft and ensure that:
i. The pitot and static ports are not damaged or obstructed
ii. Flight controls are not locked or disabled (as applicable, depending on aircraft type);
iii. Frost, snow or ice is not present on critical surfaces; and
iv. Aircraft structure or structural components are not damaged.
The FCTM stated:
The objectives of the exterior inspection[47] are:
- To obtain a global assessment of the aircraft status. […]
- To ensure that main control surfaces are in adequate position relative to surface control levers.
- To check that there are no leaks. For example, engine drain mast, hydraulic lines.
- To check the status of the essential visible sensors, i.e. AOA, pitot and static probes.
- To observe any possible abnormalities on the landing gear status.
The FCOM stated:
The exterior walkaround ensures that the overall condition of the aircraft and its visible components and equipment are safe for the flight.
Complete inspection is normally performed by maintenance personnel or, in the absence of maintenance personnel, by a flight crewmember before each originating flight.
An accompanying illustration showed a path that the flight crew can take when conducting the walk-around (Figure 40). Numbers represent a pause point to inspect a particular section of the aircraft, each associated with a section of a list of 42 check items. All the pause points except numbers 5, 13 and 16 had check items, including number 2 for a condition check of the pitot probes (Figure 41). The check is done by memory.
The ATSB estimated that to walk directly through all the pause points in the recommended order would require a path of about 250 m, which would take about 3 minutes at average walking speed (1.4 m/s) if done without pausing.
Figure 40: Flight crew operating procedure illustration of the flight crew walk-around
Source: Malaysia Airlines
Figure 41: Extract from the flight crew walk-around procedure
Source: Airbus
Airbus provided operators with computer software that showed a narrated animation of a full flight crew walk-around, and enabled users to self-assess their recall of check items (Figure 42).
Figure 42: Airbus Virtual WalkAround software
Source: Airbus
Other guidance
In July 2016, Airbus published an article in its Safety First magazine titled Pitot Probe Performance on the Ground, which provided information about pitot probes and potential blockages, advising:
Always look at the Pitot probes carefully during the pre-flight exterior inspection and check that all of the covers are removed before flight. Ensure there is no damage to the Pitot probe and that the general condition is good. This will give confidence that the correct airspeed readouts will be available on all of the instruments in all flight phases.
Flight crew pre-flight walk-around for the occurrence flight
Figure 43 compares the flight crew walk-around check procedure with the path taken by the captain as recorded on the single-view video. While walking towards the aircraft, the captain shone a torch on the lower left forward fuselage area for a total of about 4 seconds, including towards the left upper pitot probe for about 1 second when about 7 m away. The captain did not shine the torch on the area of the left lower pitot probe, or on the right side of the nose where the third probe was located. After pausing to inspect the nose gear, the captain walked directly from the rear of the nose gear towards the front of the right engine, out of view.
About 30 seconds later, the captain’s torchlight could be seen for a few seconds as the captain moved from right to left under the fuselage near the main landing gear.
The torchlight then reappeared on the ground outboard of the left engine, before apparently being shone on the side of the left engine cowl (out of sight of the camera) for about 2 seconds. The captain then walked directly out of view to the gate entry point. The walk-around took about 1 minute 32 seconds to complete and the captain was not observed looking in detail at any part of the aircraft apart from the nose gear.
Figure 43: CCTV still image of 9M-MTK overlaid with the required flight crew walk-around path and the captain’s visible walk-around path.
Source: Brisbane Airport Corporation, modified by the ATSB
Engineering
Aircraft certification
At the time of the occurrence the technical handling (engineering) functions in Brisbane were the responsibility of the Malaysia Airlines licensed aircraft engineer (LAE). Technical handling tasks in Brisbane included:
engineering inspections (a transit check)
refuelling
general maintenance
rectifying defects
certification of all engineering work.
The LAE’s assignment was to travel on a flight from Kuala Lumpur to Brisbane and conduct technical handling of that aircraft before it returned. After an overnight rest in Brisbane, the LAE would return to the airport in the evening and conduct technical handling of the next aircraft, and then board it for the return flight. In this way, one LAE would be assigned technical handling of two successive turnarounds in Brisbane across three days (with one rest day between), and then another LAE would be assigned the next two successive aircraft, and so on.
The LAE reported that they were informed by Malaysia Airlines that their task was to conduct transit and rectification duties in Brisbane, and would be receiving engineering support assistance. However, Malaysia Airlines did not provide details about who would be doing dispatch duties, or anything related to the requirements for the fitment of pitot probe covers in Brisbane.
The LAE involved with the occurrence aircraft had arrived on another aircraft on 16 July and performed defect rectification, inspections, and certification of that aircraft, aided by a different AMSA engineer. Neither engineer stayed with that aircraft for dispatch.
Engineering support
Throughout June and July 2018, AMSA provided security escort and technical assistance to Malaysia Airlines travelling engineers and did not provide aircraft certification or dispatch coordination. The organisations worked under written ad-hoc indemnity release agreements, signed on site by line personnel from both organisations at the time of each arriving flight. These agreements did not contain information about services expected or provided.
AMSA managers and engineers advised the ATSB that their understanding of AMSA tasking was to facilitate LAE access to the apron and provide general engineering assistance as instructed by the LAE on the day.
There was no agreement or procedure in place for the fitment of pitot probe covers and no written requirement for the support engineer to be present at the aircraft for arrival or at the time of dispatch.
The support engineer reported assuming that the ground handlers, being responsible for dispatch, would perform a final walk-around to check doors, gear pins, pitot probes, and the like. As a result, the support engineer did not think it was necessary to be present for dispatch.
Tool control
AMSA had documented tool control policies and procedures which required AMEs and licensed aircraft maintenance engineers (LAMEs) to record the removal of company tooling from its storage location. LAMEs were required to account for all tooling prior to certifying an aircraft for release to service. At the end of a shift, AMEs and LAMEs were required to account for personal tooling, and regional managers were required to review the movement of company tooling. Tooling that for operational reasons remained away from its storage location at the end of a shift, was to be recorded in the shift handover diary by the regional manager.
AMSA supplied basic tooling specific to aircraft turnarounds in a transit toolbox. This included a headset to communicate with the flight crew, marshalling wands, and a steering bypass pin[48] specific to an aircraft type. Additional items such as pitot probe covers could be added to the transit toolbox as required. The relevant procedure required its removal from its storage location be recorded, and for its return to be recorded along with a condition check of the items it contained.
According to interviewed engineers, at the time of the occurrence, transit toolboxes (containing pitot probe covers) were being removed from their storage location without the action being recorded.
Transit check requirements
Malaysia Airlines technical handling manual required that the aircraft undergo a transit check (a type of engineering inspection) while in Brisbane. This required certification in the technical log when completed. The LAE indicated that there were paper copies of the transit check sheets available in all company aircraft as a reference. The LAE stated that they did not use a paper copy as they were very familiar with the check requirements.
The requirement to check various items on the aircraft exterior was not described as a ‘walk‑around’, but it was likely to be done in that way for the sake of convenience (for example, it would make sense to check the nose landing gear while checking other items near it, rather than returning later). For simplicity, this report refers to this element as an ‘engineering maintenance walk-around inspection’.
The transit check procedure began with tasks mainly related to verifying the aircraft’s airworthiness, and later tasks were primarily concerned with verifying the aircraft’s general condition (that no damage had been incurred during the turnaround) and readiness for flight. It had the following general sequential structure:
initial parking
check technical log for reported defects
check engine oil, hydraulic oil, auxiliary power unit oil, and conduct other similar tasks (from cockpit indications)
check fuselage, empennage, engines, wings, landing gear, and doors for damage, leaks, missing fasteners, and the like
check pitot probes, angle of attack sensors, static ports and their surrounding areas for ‘obvious damage’
check interior and conduct interior maintenance tasks
refuel the aircraft.
After refuelling, the following tasks were required:
‘remove all landing gear lockpins, engine blanks, airframe blanks and pitot covers if installed’
check air intakes for foreign objects or obstruction
check all doors and panels are closed and secured
‘perform a walkaround inspection of the aircraft exterior. Identify and report external damage found’
‘verify that no tools are being left in the aircraft and any tools loaned out from the Tool Crib are returned prior to aircraft departure’
check all required documents are on board
certify (sign) that a transit check has been performed
depart the aircraft.
Review of the CCTV footage indicated that the LAE conducted a transit check walk-around which appeared to follow the correct path of the transit check procedure up to the point of refuelling the aircraft. This walk-around of the aircraft took the LAE about 12 minutes.
Following the aircraft refuelling, the transit check takes on a preparation for flight aspect to ensure that the aircraft is correctly configured for flight with panels and doors closed, tools, blanks, and covers removed. The portion of the transit check following the refuelling of the aircraft was not undertaken.
Ground handling
Ground handling functions
Menzies provided Malaysia Airlines with ground services including ramp support, equipment, towing/pushback of aircraft, and dispatch coordination from the commencement of flights on 6 June 2018. Menzies ground handlers in Brisbane routinely performed dispatch coordination for 3 operators, including Malaysia Airlines. Menzies did not have the capability to provide engineering services in Brisbane.
Menzies reported that dispatch coordination was rarely conducted by Menzies employees; the operators usually engaged engineers from other organisations for this function.
Ground handling procedures were provided in the Menzies aviation ground operations manual. The applicable Menzies procedures required ground handling personnel to conduct:
an arrival walk-around, immediately after arrival
a dispatch walk-around, immediately prior to dispatch.
Details on these procedures are provided in the following sections.
At the time of the occurrence, a ground handling agreement between Malaysia Airlines and Menzies had not been signed (see Operator planning for resumption of Brisbane operations) and Menzies was working under its own standard procedures. There were no significant differences between the Menzies and Malaysia Airlines procedures. The agreement signed after the occurrence equivalently required a ‘visual external safety/ground damage inspection’ to be performed ‘immediately upon arrival’ and ‘immediately prior departure’.
Ground handling tasks
The ground handling roles included:
A leading hand (or flight supervisor), who was responsible for the management of the ground handling requirements of the aircraft turn around. In some instances, this responsibility could be split between teams with one responsible for the arrival and one responsible for the dispatch. In the case of the incident aircraft, the same leading hand was responsible for the arrival and the dispatch.
A dispatch coordinator (or headset operator), who was responsible for aircraft dispatch communications from the ground to the flight deck during pushback. The role also included a requirement to conduct a post-arrival walk-around and dispatch walk-around inspections of the aircraft. This role within Menzies was usually conducted by the leading hand but in this case was performed by another ground crewmember who had finished assigned duties with another aircraft.
The leading hand and dispatch coordinator both reported being aware of the need to conduct a dispatch walk-around.
Prior to aircraft arrival, the leading hand was required to conduct a briefing and assign responsibilities for the turnaround, including ensuring that required staff are present.
ATSB observation
The Menzies leading hand was required to ensure that appropriately qualified staff were available for the turnaround. The leading hand later reported that they thought they were not qualified to coordinate dispatch for Malaysia Airlines aircraft, but if so, this means the leading hand did not ensure that a qualified person would be available. This indirectly led to a last-minute handover of dispatch duties, during which a breakdown in communication occurred meaning that the incoming dispatch coordinator remained unaware that a walk-around had not been conducted.
Procedure for arrival walk-around
The manual stated that:
Upon arrival…the responsible person (Team Leader or equivalent) is required to perform an aircraft inspection for any aircraft damage. This shall be conducted prior to any equipment, including all GSE and Passenger Boarding Bridge (Jetty), positioning to the aircraft. Minimal arrival aircraft inspection shall consist of the following:
- All cargo doors
- All access panels and servicing access points
- Aircraft fuselage
- Aircraft engine cowlings
- Aircraft passenger doors.
Procedure for dispatch walk-around
The dispatch walk-around was not an engineering inspection; it was intended to verify the aircraft’s general condition and readiness for flight. The manual stated:
Headset operatives [dispatch coordinator] must carry out a pre-flight check that:
- All doors and hatches are secured and handles are flush with the aircraft fuselage
- Nosewheel steering by-pass pin inserted if applicable
- No visible damage of the aircraft caused by equipment during ground operations
- No loading or other debris is left in the area of engine intakes
- All ground locks, engine blanks, pitot head and static vent covers removed (if appropriate)
- Static vents and pitot tubes are clear of debris or de-icing fluid etc. (as appropriate).
The manual further stated:
A pre-departure walk-around MUST be made before the aircraft is allowed to depart.
Staff must be vigilant and check for any damage or loose hatches (even if a hatch has not been opened at your station).
Any hold or passenger door that is opened after the walk-around (or not closed at that time) the closure must be personally supervised by the headset operative.
Note: The walk-round is primarily a visual check, which is performed at normal walking pace. Hold and access doors and hatches are ‘pushed’ to ensure correct closure. Other hatches can be confirmed as secure if all latches are closed and laying flush in recess.
Note: The walk-round should be carried out prior to engine start-up. To facilitate an on-time departure the main check can be carried out prior to completion of loading, or before doors are closed. Any holds or doors open at this time can be rechecked when closure takes place, without the need to re-check other items.
The relevant Menzies training notes listed 12 key check items, including ‘pitot tubes’, and contained the following information about dispatch:
NOTE: although a licenced engineer or member of the flight crew will have carried out and signed for a Pre-Departure inspection (PDI) of the aircraft, it is vital that the headset operator visually completes a thorough PDI check of the aircraft and immediate areas. … Confirm all doors, panels, hatches secure…
After the tow bar is connected to the push back tractor the headset operator should allow plenty of time to perform the walk round inspection of the aircraft. When all loading and service functions have been completed, the headset operator is required to walk-around again and ensure that all hatches and latches are secure.
After the air bridge or steps have been removed the cabin door/s must be checked to ensure they are closed and secured correctly. Particular attention to the likelihood of straps etc. protruding of door handle/s not stowed in the recess correctly.
The trainer’s notes on operating headsets stated:
The headset operator is required to follow the illustrated walk round sequence when inspecting the aircraft prior to departure. The walk round shall start on the left side of the aircraft nose leg and proceed in a clockwise direction.
A diagram was provided to show the conduct of the dispatch walk-around, including symbols drawing attention to the pitot probes (Figure 44).
Figure 44: Menzies diagram of dispatch walk-around sequence for ground handlers
Source: Menzies
Training and qualifications for dispatch coordination
Menzies stated that staff were chosen for training in dispatch duties only after they had at least 2 years’ general ground handling experience. They were required to conduct a classroom theoretical training session, followed by 15 supervised dispatches on various aircraft types. They were then assessed over 2 flights and provided they were found to be competent were considered qualified to conduct dispatches. Staff also undertook recurrency training every 3 years.
The leading hand believed that dispatch coordination required specialist training on each aircraft type. The leading hand stated that they personally had the appropriate qualification to perform dispatch coordination but believed that none of the team assigned to 9M-MTK had the requisite training to do this for a Malaysia A330 specifically.
On whether airline and/or aircraft specific training was required for the headset coordinator role, Menzies stated that:
No specific training was required, as no differences had been identified either by [Malaysia Airlines] or Menzies.
Menzies stated that both the leading hand and ground handler who dispatched the aircraft were qualified to conduct the dispatch.
The leading hand’s training records indicated that they had received training for dispatch duties on 16 August 2017. There was no record of training for specific aircraft types or operators. The training material in place at the time of the occurrence indicated that the training was generic in nature with a reference to numerous aircraft types including the Airbus A330.
Operator training of Menzies ground handling staff
On 28–29 May 2018 Malaysia Airlines provided training to 3 Menzies instructors to enable them to deliver training to other Menzies staff on the operator’s requirements and any differences with Menzies standard operating procedures. Menzies and Malaysia Airlines compared the required processes for receipt and dispatch, and no substantive differences were identified.
The operator provided further training to 3 Menzies instructors on 6 June 2018 (the day that operations commenced in Brisbane). This was to enable them to deliver training on receipt and dispatch, including dispatch coordination, to other Menzies staff.
Menzies reported that operator-specific training was gradually rolled out over the course of 2–3 weeks in June. However, no records of training delivery of this type were available and neither the leading hand nor dispatch coordinator reported having received training specific to Malaysia Airlines.
Dispatch coordinator communications and phraseology
Ground to flight deck communications has common phraseology for each phase of the aircraft turn around, for arrival, push back and tug disconnection.
At the beginning of the push back phase, the flight crew will prompt the dispatch coordinator that they are ready by stating ‘ready for departure checks please’. Provided the ground handlers are ready, the dispatch coordinator will respond by stating ‘departure checks complete, all doors and hatches closed and secure’.
ATSB observation
The dispatch coordinator did not use the standard phrase ‘all doors and hatches closed and secure’, which might have provided a stronger prompt for the dispatch coordinator to perform the required walk-around or to check whether the leading hand had done so.
Menzies quality assurance
Menzies had eight external audits by airlines in 2018 with no significant adverse findings. Menzies, as a major international ground handling group, also conducted audits on various sections of its operations from time to time, with the last Brisbane group audit before the occurrence being conducted in 2016 with no significant adverse findings. One such area audited included:
If an airline is providing the same training instead of the Menzies training, a GAP analysis[49] must be done to identify the difference between the [Menzies] & airline training and [Menzies] staff trained on the differences as appropriate.
Menzies Brisbane also conducted continual internal incremental line audits (observation audits) on various sections of the operation. In the area of ground handling arrivals and dispatch there were specific audit ‘questions’ such as:
- Does the Headset Operative carry out a pre-departure check (walk around) that ensures there is no visible damage to the aircraft caused by equipment during ground operations and all cargo/access doors are closed and secured?
- Before the aircraft commences taxiing under its own power, all equipment and personnel must be moved clear of the aircraft. Does the headset operative ensures that no equipment remains within the aircraft footprint?
- Does the Headset Operative carry out a pre-departure inspection (walk around) to ensure all ground locks, engine blanks, pitot head and static vent covers have been removed and are clear of debris, de-icing fluid or other substances?
- Does the Headset Operative carry out a pre-departure inspection (walk around) to ensure Power cables and the boarding bridge is fully retracted and not in the path of the aircraft?
Does the Headset Operative carry out a pre-departure inspection (walk around) to ensure there are no visible leaks of lubricants or hydraulics from the undercarriage?
- Does the pre-departure inspection (walk around) include check that engine cowling latches are engaged?
- Is aircraft clear of all obstacles along the intended movement path?
- Is departure damage check performed?
- Is predeparture walkaround inspection performed, ensuring landing gear pins are removed?
The audit logs for Brisbane operations over two separate 9-month periods in 2018 and 2019 indicated:[50]
Overall, there were 3,181 audits (averaging 6 per day), answering 53,357 audit questions. There were 145 recorded non-compliances in total, which is a compliance rate of 99.7%.
There were 544 turnarounds where the dispatch coordination function was assessed, asking 872 questions with a compliance rate of 100%. Of these, 414 audits asked questions relating to specific elements of the dispatch walk-around[51] (a total of 595 questions). The question ‘Is a complete walk-around inspection done to check that cargo/access doors are closed and secured, that there is no visible damage to the aircraft and that the gate area is clear of equipment? (incl wing tips)’ was asked 104 times.
There were 122 turnarounds for which the arrival walk-around was assessed, with one non-compliance, equivalent to a compliance rate of 99.2%. The non-compliance was for a Malaysia Airlines flight in 2019.
Malaysia Airlines turnarounds were audited for arrival and/or departure walk-arounds 24 times, including 3 times in Jun–July 2018, with records of the latter indicating:
2 arrival walkarounds were assessed and completed
1 departure walkaround was assessed with 5 distinct questions, of which 1 was answered ‘yes’ and the others ‘n/a’
Menzies staff coordinated dispatch for at least 11 different airlines in June–July 2018.
Review of other turnarounds
Video recordings of Malaysia Airlines turnarounds
CCTV recordings showing four Malaysia Airlines A330 turnarounds in Brisbane in July 2018, including the one on the night of the occurrence, were assessed by the ATSB. A summary of the assessment is provided in Table 2, with a focus on the use of pitot probe covers and the required turnaround checks. Different personnel appeared to be involved in all turnarounds, except that only two LAEs were involved, each handling two successive flights. The walk-arounds were not assessed in detail for completeness; a walk-around was assessed as ‘partial’ if there were areas of the aircraft and/or obvious check items that were missed. The time taken for the inspections was also noted as a general reflection of the quality and detail.
Table 2: Malaysia Airlines turnarounds in Brisbane during July 2018
Turnaround date
(duration)
12/07/2018 (2:45)
14/07/2018 (2:45)
16/07/2018 (about 6:00[1])
Occurrence flight 18/07/2018 (2:45)
Pitot probe cover use
(AMSA)
No
No
No
Yes
Arrival walk-around
(Menzies)
Yes, with torch.
Partial, without torch.
Yes, with torch.
No
Engineering inspections
(Malaysia Airlines)[2]
Maintenance walk-around inspection (other than pre-departure)
Partial, with torch.
(00:02:15)
Partial, without torch.
(00:01:47)
Yes, with torch.
(00:08:32)
Yes, with torch
(00:11:45)
Pre-departure walk-around inspection
No
No
No
No
Flight crew pre-flight walk-around
(Malaysia Airlines)
Yes, with torch
(00:04:26)
Yes, with torch.
(00:04:56)
No
Partial[3] with torch
(00:01:32)
Dispatch walk-around
(Menzies)
Partial, with torch.
(about 00:03:30)
Yes, with torch.
(00:02:45)
Yes, (twice) with torch.
00:03:21 the first time, 00:03:55 the second time.
No
[1] This turnaround was extended due to an aircraft repair being carried out.
[2] The Malaysia Airlines engineers were responsible for certification for these checks but could delegate parts of the check (other than certification) to an AMSA engineer. One engineer handled the 12 and 14 July turnarounds, and another handled the 16 and 18 July turnarounds.
[3] See Flight crew pre-flight walk-around for the occurrence flight.
Video recordings of other operator turnarounds
The ATSB reviewed video of 3 other long-haul passenger aircraft turnarounds on 18 July 2018 involving other operators and engineering organisations. All the dispatch walk-arounds appeared to be conducted by engineers.
All the arrival, engineering, flight crew, and dispatch walk-arounds appeared to be completed in full for each turnaround, except for one dispatch walk-around which was done partially. The range of durations of fully completed walkarounds were 7–8 minutes (engineering), 3.5–8 minutes (flight crew), and 3–7 minutes (dispatch).
Pitot probe covers were only used on the longest of these 3 turnarounds, with the covers being fitted for a total of about 9.5 hours of the 12-hour turnaround. The other turnarounds were 69- and 80-minutes’ duration.
ATSB observation
Although the number of reviewed Malaysia Airlines turnarounds was limited, video evidence indicated that the required walk-around inspections and checks by ground handlers, engineers and flight crew were not always conducted, and in some cases were not conducted to the required standard. The 3 reviewed turnarounds involving other operators and engineers had more consistent and thorough engineering and flight crew walk-arounds.
The absence of any final engineering walk-around inspection over the course of the four reviewed Malaysia Airlines turnarounds, including by the occurrence engineer whose other inspections were satisfactory, is likely to indicate systemic problems with Malaysia Airlines engineers.
Further, the extremely high level of recorded compliance during Menzies audits, including the assessed 100% compliance for dispatch walk-arounds, was very unlikely to be an accurate reflection of actual compliance based on video evidence showing that the required arrival and dispatch walk-arounds were only completed in full on 1 out of 4 flights.
Operator planning for resumption of Brisbane operations
General information
Malaysia Airlines operated flights into Brisbane for many years prior to 2015.[52] During this period, the operator did not routinely use pitot probe covers in Brisbane. Operations to Brisbane were suspended in August 2015 for commercial reasons. This was about 3 months after the first issue of the CASA AWB on wasp nest infestation was first introduced. The operator did not use pitot probe covers in the intervening period.
The operator later prepared to resume Brisbane operations, planning 4 round trips per week between Kuala Lumpur and Brisbane from 6 June 2018. The project for the resumption of services was led by the airport services department (AS) under the regional AS head (one level below the AS department head), with involvement with the engineering and maintenance (E&M) and flight operations departments for matters relevant to them (such as planning for the use of engineers and pilots, respectively).
The ground handling and engineering arrangements in place at the time of the incident (18 July 2018) were an interim measure put in place until approval from the Malaysian Civil Aviation Authority was received for AMSA to certify for Malaysia Airlines aircraft in Brisbane. After that, the operator planned to permanently engage AMSA for all technical handling (engineering) functions plus dispatch coordination; Menzies would then cease dispatch coordination but continue with its other ground handling functions and there would no longer be an operational need for Malaysia Airlines to supply its own engineers for the Brisbane turnarounds.
The agreements were made in the form of a standard ground handling agreement (SGHA) between Malaysia Airlines and each of the two ground services providers, and a service level agreement (SLA) between Malaysia Airlines and Menzies (Table 3). When the operator resumed flights between Kuala Lumpur and Brisbane on 6 June 2018, no formalised service agreements had been finalised with either Menzies or AMSA.
Table 3: Agreements between the operator and service providers
Agreement
Operator signature date
Completed date
Effective at start of operations
Finalised before occurrence
Standard ground handling agreement (SGHA) between Malaysia Airlines and AMSA
10 July 2018
18 July 2018
No
Yes[1]
Service level agreement (SLA) between Malaysia Airlines and Menzies
25 May 2018
10 August 2018
No
No
Standard ground handling agreement (SGHA) between Malaysia Airlines and Menzies
6 June 2018
23 July 2018
No
No
[1] Both organisations reported that this agreement was signed prior to the occurrence. The original physical copy was sent by Malaysia Airlines after signing, arriving on 16 July 2018. In practice, line personnel were unlikely to be aware of its completion at the time of the occurrence.
An SGHA is an agreement used commonly by aviation organisations worldwide. The International Air Transport Association (IATA) SGHA contains a pro-forma list of potential services for each arriving and departing aircraft, and the two organisations adapt the list to form their agreement by including only those services they agree upon. The SGHAs between Malaysia Airlines and the two service providers had a simple list of services (without detailing how they should be provided) as well as financial and legal obligations. The SGHA is primarily a commercial agreement, and not operational. That is, it typically contains information about the type of services and equipment provided, but details about how they are to be applied would only be in a very general sense (‘as required’) or absent entirely.
An SLA is a commitment between a service provider and client which, among other things, lists and/or details services that are to be provided. In the case of the SLA between Malaysia Airlines and Menzies, it included details about how some of the services were to be provided (for example, punctuality instructions). It also included agreed performance measures between the two parties, applicable charges, penalty clauses and other matters not covered in the SGHA. A timeline illustrating the key events related to the resumption of Brisbane services is provided in Figure 45, with further details provided in the following sections.
Figure 45: Timeline of key events for the Malaysia Airlines resumption of Brisbane services
Source: ATSB
Engineering support and certification
A number of documents and records of communication from February 2018 onwards show that Malaysia Airlines intended to engage an external provider for engineering services. The operator conducted evaluations of prospective engineering service providers, including AMSA, in February and April.[53]
A Malaysia Airlines email sent to AMSA on 17 April 2018 listed items to be included in a proposed agreement, which included only the provision of some ground support equipment and did not include any services. A letter of intent sent to AMSA by the operator dated 28 April[54] stated that there had been a decision to engage AMSA for ‘technical handling with [aircraft] certification’ at that time.
The operator was required to obtain approval from the Malaysian Civil Aviation Authority for any foreign (non-Malaysian) entity to conduct certification of its aircraft. An application for AMSA to conduct certification of Malaysia Airlines aircraft was submitted on 1 June 2018 and approval was granted later that year.[55] In the interim, AMSA engineers were not permitted to certify for work conducted on the operator’s aircraft.
The SGHA between Malaysia Airlines and AMSA, finalised on the day of the occurrence but not effective in practice, indicated that AMSA was to provide engineering services including, among others:
provide, position and/or remove pitot probe covers
perform line inspection in accordance with the operator’s current instructions and certify for its conduct in the aircraft technical log
provide personnel to assist the flight crew or ground staff in the performance of the inspection
conduct ramp to flight deck communications during arrival and dispatch (that is, arrival and dispatch coordination)
carry out a safety/ground damage inspection immediately upon arrival and prior to departure
check that all doors and access panels are properly closed and locked.
ATSB observation
The prospective agreement with AMSA, signed by Malaysia Airlines a few weeks after the resumption of services and by AMSA on the day of the occurrence, included the requirement to provide, position, and/or remove pitot probe covers. As with many other services listed, and in accordance with how the IATA SGHA is typically applied, it did not specify whether this meant that pitot probe covers were to be used for all turnarounds or on an ‘as needed’ or other basis. This information was not recorded elsewhere.
An application for regulatory approval for AMSA to provide certification to Malaysia Airlines aircraft was not submitted until a few days before operations were due to recommence. The operator probably did not allow sufficient time for the regulator to evaluate the application.
Over 25–29 June, 2 AMSA engineers were trained in Malaysia Airlines engineering certification procedures, including:
online access to and general use of publications and forms including check sheets and technical logs
transit check requirements and access to the check sheets (the training did not cover the content of check sheets)
ground handling requirements for Malaysia Airlines aircraft, including the A330, and
general notes about dispatch coordination.
The operator provided AMSA with copies of, and online access to, relevant procedures and other documents.
Ground handling
Malaysia Airlines conducted an evaluation of Menzies across a range of areas in April 2018.[56] A plan for the engagement of Menzies was drafted on 27 April 2018 and finalised in May 2018. It did not explicitly state whether Menzies would be responsible for dispatch coordination, but had provisions for Menzies to provide numerous ground services including ramp handling.
Both draft agreements between Malaysia Airlines and Menzies listed the following services to be provided, among many others:
carry out a safety/ground damage inspection immediately upon arrival and prior to departure
check that all doors and access panels are properly closed and locked.
Dispatch coordination
The April 2018 letter of intent advising of the decision to engage AMSA for technical handling (engineering) did not explicitly specify that AMSA were to conduct dispatch coordination, although that could be interpreted to be included in the term ‘technical handling’. The draft agreements between Malaysia Airlines and Menzies, signed by the operator in the two‑week period leading up to the resumption of operations, both required Menzies to conduct ramp to flight deck communications during arrival and dispatch (that is, arrival and dispatch coordination).
The Malaysia Airlines investigation report stated that on 4 June 2018 AMSA advised Malaysia Airlines that it would withdraw from the proposed agreement to provide services in Brisbane, which included dispatch coordination. The report stated that tasking for dispatch coordination was transferred from AMSA to Menzies from this point The Malaysia Airlines investigation report stated:
After further discussion, AMSA had later agreed to provide technical support to MAB [Malaysia Airlines]. In the meantime, MAB appointed Menzies to perform headset function during aircraft pushback operations, as an interim measure. This arrangement was different from other Australian airports where the headset function is normally assigned to the engineering support (AMSA) personnel, rather than ramp handlers such as Menzies.
AMSA had no records relating to a change of services from the initial arrangement to what was actually provided when operations resumed. As stated above, the SGHA between the operator and AMSA (signed by Malaysia Airlines on 10 July) included a requirement for AMSA to conduct dispatch coordination.
ATSB observation
Malaysia Airlines reported that in early June 2018 AMSA withdrew from an agreement to provide ground services, which led to the requirement to engage Menzies for dispatch coordination. However, Malaysia Airlines had signed a draft agreement for Menzies to perform this function two weeks before that, and there was no evidence available to indicate that Malaysia Airlines intended to engage AMSA for dispatch coordination at that time.
The first unambiguous record available engaging AMSA for dispatch coordination was the draft agreement signed by Malaysia Airlines on 10 July, after Brisbane flights had resumed. This agreement was most likely the result of an intent to engage AMSA for both engineering certification and dispatch coordination once regulatory approval for certification was gained.
Acquisition of mud wasp information
Malaysia Airlines reported that it did not have a formal process to monitor some types of safety information (including AWBs) from foreign civil aviation authorities. Nevertheless, the operator reported that both the E&M and flight operations departments obtained the March and May 2018 issues of AWB 02‑052 Wasp Nest Infestation – Alert, possibly through subscriptions to CASA’s automated email alert system.
The operator reported that the flight operations department performed a risk assessment in relation to hazards affecting flight operations at Brisbane Airport. The operator reported that the assessor examined the available Lido chart for Brisbane Airport and, based on the observation that the airport characteristics (such as runway length and approach procedures) and published hazards presented a similar risk profile to other major airports, did not document the risk assessment.
Flight operations evaluators did not visit the airport and relied on the information contained in the Lido aeronautical charts for flight risk information, and the individuals involved in the port assessment process were unaware of the mud wasp hazard.
AMSA and Menzies reportedly both advised the operator’s evaluation team about the mud wasp hazard at Brisbane during the operator’s on-site visit.
In the 17 April 2018 email exchange between Malaysia Airlines and AMSA, the operator included pitot probe covers in a list of required equipment. The AMSA representative advised:
…please be aware that all other carriers into BNE install pitot covers because of wasp infestations at this airport, you may also want to position the covers with AMSA and we will fit them as part of the transit, this will not incur an additional charge provided we do not have to provide the covers.
The operator sent a set of pitot probe covers to AMSA, however, no record of the date, the sender, or recipient was available.
An email from the operator’s station manager in Brisbane to a manager in Malaysia, dated 20 June 2018, stated that there was a ‘known issue’ and regulator advice about mud wasps building nests in pitot probes in Brisbane, adding that they can do so ‘very rapidly’. The station manager asked if it were possible to arrange for pitot probe covers to be fitted for every turnaround in Brisbane as a preventative measure, suggesting that AMSA could do so.
A response to this email on the same day stated that one set of pitot probe covers was now in AMSA’s possession, and that the operator would ‘advise our LAE to comply’ with the recommendation for their fitment.
ATSB observation
Different departments in Malaysia Airlines became aware of the mud wasp hazard at Brisbane Airport through various means, including through regulator publications and local knowledge of the service providers.
Individuals within the operator’s engineering and maintenance department were aware of the hazard several weeks before the commencement of operations, and sent a set of pitot probe covers to AMSA to be used on the operator’s aircraft without providing guidance or instructions on their intended use to the operator’s line engineers.
Although some flight operations staff had obtained the relevant CASA airworthiness bulletin about mud wasps at Brisbane, this information did not reach, or was not used by, the individuals responsible for assessing the port safety from a flight operations perspective.
Risk assessment for Brisbane operations
On 25 May 2018, the operator’s AS department completed a risk assessment relating to the resumption of services to Brisbane. The risk assessment covered aviation safety risk as well as other business- and service-related risks. The record indicated that it was conducted and approved by the regional head of AS (one level below the AS department head). There was no record of other individuals or departments being involved, and no recorded risk assessment by any other department in relation to the resumption of Brisbane services.
The assessment used the ‘change management risk register form’ (see Operator change and risk management processes). This form allowed for an evaluation of initial risk, identification of treatments in the form of risk controls, and evaluation of residual risk (the risk that remains after treatment). The form also afforded the user space to name the assessor and set a status for each risk.
The ATSB’s examination of the overall risk assessment found that:
four risks, including a risk that identified the mud wasp hazard, had a residual risk rating that was incorrectly calculated one level lower than it should have been (‘low’ instead of ‘medium’)[57] no risk category information was recorded in the individual risk or control descriptions (for example, a fatigue risk due to having an unsupported station head was recorded; it was not stated whether this was an individual health and safety risk, a risk to customer service, or a risk to the safety of flight)
there was insufficient information recorded about the nature of each risk and the risk controls to justify reductions in likelihood and severity, including:
risks were reduced in severity without listing controls that would feasibly have an effect on severity
some of the risk controls were vague or would have no effect on the identified risk (for example, ‘[ground handling agent] assured, will ensure smooth MH [Malaysia Airlines] Operations.’)
two of the initial risk ratings were incorrectly labelled ‘minor’ (a severity rating) instead of ‘medium’
some risk controls listed as initial (or existing) were prospective (that is, should have been listed as additional risk controls)
some risk controls were more about planning than directly controlling risk (such as ‘oversight will be done by airport services trainer and station head’)
some additional controls were rewordings of existing controls or stating how they were to be achieved, rather than separate controls (for example an existing control for one risk was ‘engineering … to provide flying engineer for aircraft certification at station’ and two additional controls associated with the same risk were ‘engineer will be onboard all aircraft and provide certification for all in and outbound flights’ and ‘station head to ensure engineer is available on all flights’)
there was no identification of new risks introduced by the implementation of controls, including the risk of having mixed engineering responsibilities or the use of pitot probe covers
there was no action associated with prospective risk controls or a record of responsibility to ensure that action would be taken, and
all of the ‘risk assessor’ and ‘risk status’ cells, probably intended to track individual responsibility and completion of risk activities, were blank.
In all, there were 7 identified risks, each of which were assessed as having ‘medium’ initial risk and ‘low’ residual risk. Six of the risks related to turn around times, ground services and management of customers, with no immediately obvious relevance to safety. The other risk, the mud wasp hazard, was described as relating to aviation safety and is reproduced verbatim in Table 4.
Table 4: Record of operator’s risk assessment for the mud wasp hazard at Brisbane
Risk
Mud Wasp effecting Safety of aircrafts. Wasp build nest at tiny holes. Mainly at "pitot".
Existing risk controls
a. Engineer and Technical handler briefed to ensure pitot holes are covered during transit.
b. GHA [ground handling agent] to remind Engineering and Technical handler comply to work process.
c. To prepare checklist ensure compliance.
Initial risk assessment
Likelihood: remote
Severity: moderate
Risk: medium
Additional risk controls
a. Engineer will log in daily service register to ensure pitot holes are covered.
b. Hazard reports to be raised and ensure corrective action.
Residual risk assessment
Likelihood: improbable
Severity: moderate
Risk: low
The risk assessment identified the need for the installation of pitot probe covers for aircraft transits at Brisbane Airport as a risk control. According to the operator, the risk assessment was entered into the AS business unit risk register, but not the applicable domain operational risk register. It was reported that the flight operations department personnel responsible for the operational aspects of the change were not appraised of risks relevant to it, including the mud wasp hazard.
The operator reported that the risk controls concerning mud wasps were communicated to the E&M department, outside of the mechanisms intended to support mitigation of risk and implementation of controls. There was no evidence of E&M department involvement in the conduct of the risk assessment or identification of risk controls, and the E&M department did not perform a separate risk assessment. The AS department did not follow up on the required actions and no risk controls were implemented by E&M as a result of this risk assessment.
ATSB observation
The operator’s risk assessment for the resumption of Brisbane flights identified the presence of a mud wasp hazard. Issues with the risk assessment meant that its evaluation of the effectiveness of risk controls, and the remaining residual risk, had limited value. In any case, the identified risk controls were ultimately not implemented.
Additionally, the unusual ground operations arrangements in Brisbane were not treated as a safety risk, and not effectively managed.
Operator change and risk management processes
Overview
The operator’s corporate safety management manual (CSMM) contained information about its safety management system and broadly aligned with the format and headings of the framework provided in the International Civil Aviation Organization (ICAO) Annex 19, Safety Management. It included policy, procedures, and guidance on change management and risk management.
Safety risk assessment team
The CSMM stated:
Safety Risk Assessment Team (SRAT) is one of a management review venue which will be held on a regular basis. SRAT comprises of departmental managers, subject matter experts (SME) and other related personnel nominated by the BU [business unit] Head.
The SRAT included managers and other personnel from across the organisation, including the AS and E&M departments. Its objectives included hazard/risk identification and assessment, and change management. The operator reported that activities deemed to trigger change management process were to be identified to and deliberated by the SRAT. The CSMM stated:
During the year, SRAT representatives are responsible for ensuring supplemental risk assessment activities are undertaken and risk registers are updated whenever there is a significant change
The CSMM also stated:
SRAT representatives are to ensure that Risk Assessment Records are reviewed a minimum of once each quarter. This review will provide evidence that identified risks are being monitored, and risk ratings and mitigation plans are being updated to reflect the current status and operating environment.
The operator required that (untreated) risks assessed as ‘medium’ or above were to be notified to, and then monitored by, the SRAT. The SRAT was not notified of the risks identified for Brisbane operations.
The ATSB reviewed SRAT meeting minutes for the 5 monthly meetings held over the period that the changes were being planned and implemented for the resumption of Brisbane services (that is, January–July 2018). The minutes recorded 23–34 attendees and 24–33 absences from each meeting, across all departments. There was a nominated ‘accountable person’ for each department including AS, E&M, and flight operations.
Representation from the 3 departments involved in this activity (AS, E&M, and flight operations) is detailed in Table 5. In some cases, an alternate representative from the department presented information in the absence of the accountable person. One of the attendees at the April 2018 SRAT meeting noted that the meeting schedule sometimes clashed with flight operations roster for some attendees.
Table 5: Departmental representation at SRAT meetings in 2018
SRAT meeting
Department
1 February
9 March
17 April
16 May
28 June
Airport services (AS)
None
None
Alternate
Alternate
Alternate
Engineering and maintenance (E&M)
Alternate
None
Alternate
None
None
Flight operations
None
Accountable person
None
Accountable person
Unknown[1]
[1] The minutes for June were inconsistent: the attendance list had the flight operations accountable person as absent, while the minutes proper indicated that they were possibly present.
There was no record of discussions relating to the Brisbane operations in the minutes, and the operator’s investigation found that this topic was not discussed. The regional AS manager, who approved the change risk assessment for the resumption of Brisbane operations, was not among the usual required attendees, and did not attend any of the meetings.
ATSB observation
There was limited involvement from the relevant departments with the operator’s SRAT meetings in the first 6 months of 2018 when the resumption of Brisbane operations was being planned. Most notably, the ‘accountable person’ for the department responsible for coordinating and planning the resumption of Brisbane services was not present at any of the meetings, and an alternative was only present for some.
The risk assessment for the resumption of Brisbane operations was performed between the May SRAT meeting and the 6 June resumption of operations, so there was no opportunity to present the results until after that. Finally, relevant risks were not raised by the alternative representative at the next meeting in late June.
Change management
International Civil Aviation Organization guidance
ICAO Annex 19 describes the responsibility of the operator with respect to the management of change:
The service provider shall develop and maintain a process to identify changes which may affect the level of safety risk associated with its aviation products or services and to identify and manage the safety risks that may arise from those changes.
Annex 19 is supported by ICAO document 9859 (Safety Management Manual), the 4th edition of which was published in January 2018. The 4th edition of the ICAO Safety Management Manual was updated from the 3rd edition (published in 2013) to be less prescriptive and to focus on the intended outcomes of each activity and process.
ICAO Annex 19 and the Safety Management Manual tie the management of change directly to safety risk and integrate it with safety risk management processes. The Safety Management Manual states:
Safety management practices require that hazards resulting from change be systematically identified, and strategies to manage the consequential safety risks be developed, implemented and subsequently evaluated.
The ICAO Safety Management Manual further stated:
The organization’s management of change process should take into account the following considerations:
a) How critical is the change? The service provider should consider the impact on their organization’s activities, and the impact on other organizations and the aviation system.
b) Availability of subject matter experts. It is important that key members of the aviation community are involved in the change management activities; this may include individuals from external organizations.
c) Availability of safety performance data and information. What data and information is available that can be used to give information on the situation and enable analysis of the change?
Malaysia Airlines processes
The operator’s CSMM included policy, procedures, and guidance on change and risk management. It included a 3-page section on change management. About half of this section contained a detailed list of events to trigger change management procedures, which included:
addition or removal of an airport/station
new routes
any other significant change that is deemed to carry operational risk.
Beyond this, there was a change management process, described by a flowchart (Figure 46), and a written description which stated, in entirety:
Relevant Divisional Heads are responsible for initiating change management procedures for activities for which he/she is responsible, and for maintaining a record of each assessment.
Activities deemed to be change management triggers are to be identified at the monthly operational risk meetings (SRAT). A risk assessment must be conducted and identified risks and mitigation plans must be documented in the applicable domain or subsidiary operational risk register.
Refer to Appendix A.12 for the Change Management Risk Register Form.
Figure 46: Malaysia Airlines change management process flowchart
Source: Malaysia Airlines
ATSB observation
The resumption of Brisbane operations qualified as a change management trigger. However, although there was generally wide representation at the SRAT meetings and individuals aware of the change were probably present, there were no records of its discussion at the SRAT as required by the change management process.
The ‘change management risk register form’ in the manual’s appendix was used for the risk assessment for Brisbane operations, and had the same headings as that assessment. The form was a basic register of risks, and did not support any type of transition planning or management in respect of management of change.
As an example of current aviation industry practices, the 4th edition of the ICAO Safety Management Manual provided enhanced guidance on change management processes over the 3rd edition including greater detail of the steps involved. An ATSB comparison of the operator’s change management process with this guidance is provided in Table 6.
Table 6: Current aviation change management guidance and Malaysia Airlines implementation in 2018
ICAO Safety Management Manual guidance
ATSB observation of Malaysia Airlines implementation
a) understand and define the change; this should include a description of the change and why it is being implemented;
The process did not specifically require, or include guidance or instruction, on how to define the change.
b) understand and define who and what it will affect; this may be individuals within the organization, other departments or external people or organizations. Equipment, systems and processes may also be impacted. A review of the system description and organizations’ interfaces may be needed. This is an opportunity to determine who should be involved in the change. Changes might affect risk controls already in place to mitigate other risks, and therefore change could increase risks in areas that are not immediately obvious;
The process did not include a step to define relevant stakeholders. There was no requirement to involve stakeholders in the management of the change except through the risk management process, if the risk was not ‘acceptable’.
The process did not require existing risk controls to be linked to the new hazard in the risk register, increasing the likelihood that the link could be overlooked in future.
c) identify hazards related to the change and carry out a safety risk assessment; this should identify any hazards directly related to the change. The impact on existing hazards and safety risk controls that may be affected by the change should also be reviewed. This step should use the existing organization’s SRM [safety risk management] processes;
The process required a risk assessment mitigation plan to be completed.
There was no guidance on the purpose, content, or development or use of a risk assessment mitigation plan.
There was no requirement for a change management action plan or the nomination of a responsible person to plan or document the change overall. There was no requirement to produce or track actions.
d) develop an action plan; this should define what is to be done, by whom and by when. There should be a clear plan describing how the change will be implemented and who will be responsible for which actions, and the sequencing and scheduling of each task;
e) sign off on the change; this is to confirm that the change is safe to implement. The individual with overall responsibility and authority for implementing the change should sign the change plan; and…
There was no guidance about what level of authority was required for a change (although the risk management section provided guidance on the levels of authority to accept risk).
f) assurance plan; this is to determine what follow-up action is needed. Consider how the change will be communicated and whether additional activities (such as audits) are needed during or after the change. Any assumptions made need to be tested.
There was no means of assurance for change management implementation and follow-up to monitor and review changes.
Risk management
General content
The safety risk management section in the CSMM was more substantial than the change management process, with elements such as a reporting policy, flight safety analysis, just culture, investigation, and fatigue risk management.
Information about safety risk assessments was distributed across several subsections, with a flowchart, risk matrix and associated category definitions in a section about safety incident and hazard reports, and a broad text description of the process in a separate section on safety risk assessment.
The section detailing the method of performing a safety risk assessment was about 3 pages long, including 1 page of definitions and several subsections describing how risk assessments fit in with the broader operational environment (such as how risk registers are managed and information about annual reviews). The risk management process was described as follows:
Operational risk assessments will be performed using the same 5 x 5 risk matrix and process as defined for occurrence report risk rating at section 2.2.5 of this manual.
All identified risks will be fully documented on the Risk Assessment Record (Appendix A).
SRAT representatives are to ensure that Risk Assessment Records are reviewed a minimum of once each quarter. This review will provide evidence that identified risks are being monitored, and risk ratings and mitigation plans are being updated to reflect the current status and operating environment.
Risk assessment categories and matrix
The CSMM defined multiple categories of risk (for example, safety of flight, business or environmental). Neither the standard risk assessment form or the change management risk register form required the category of each risk to be defined.
The risk level was determined using a 5x5 risk matrix and a risk tolerability table. The CSMM defined 5 ratings for likelihood (from ‘extremely improbable’ to ‘frequent’) and 5 ratings for severity (from ‘negligible’ to ‘catastrophic’). There were 4 levels of overall risk, from ‘low’ to ‘critical’. The CSMM provided guidance for each of the risk levels, indicating that ‘low’ risks were acceptable (tolerable) and were to be routinely monitored by the head of the relevant department.
Severity could be assessed in terms of 14 categories, including injury/illness, airworthiness, and safety of flight. Within each category, a description of the kinds of impact or severity associated with each severity level was provided, with relevant examples reproduced verbatim in Table 7.
Table 7: Safety of flight severity categories used by the operator
Safety of flight severity category
Description
Minor
· deviation with some potential to impact safe operation of an aircraft, or
· managed by air crew using non-normal checklist procedures.
Moderate
· deviation impacting the continued safe operation of an aircraft
· managed by air crew using multiple non-normal checklist procedures or additional actions
The risk assessment record template in the manual’s appendix was separate to the change management form template, and required additional information, including:
impact category
tracking source
details about safety actions
remarks
review
Unlike the change management form template, the risk assessment record template did not include a space to record the residual likelihood or residual consequence (only the overall residual risk).
Risk management process
The ‘process as defined for occurrence report risk rating’ (referred to by the risk management process for identified operational risks) had a flowchart to illustrate the process (partially reproduced in Figure 47). It indicates the steps involved in processing hazard and occurrence reports. These steps included determining the risk level of each hazard or incident, investigation level, assignment to respective business unit, and closure of investigation.
After initial report collection and risk classification, there was a decision point where incidents and hazards with:
‘high’ or ‘medium’ risk were to follow a detailed investigation process with differing priorities, including steps for corrective actions, review, acceptance, implementation, monitoring and closure (via the arrows to the right of Figure 47).
‘low’ risks were directed to a decision labelled ‘Investigate?’; following the ‘no’ path ends the process without further steps, and the second unlabelled path passes to the same investigation process as for higher risks but with low priority.
The CSMM did not clarify whether the ‘risk’ decision point was to be based on initial or residual risk.
Figure 47: Part of the operator’s safety reporting process, also used for general safety risk management
Source: Malaysia Airlines
There was no guidance on identifying and involving stakeholders, and although the process listed ‘monitoring’ as a key step, there was no guidance for how this should be accomplished.
The CSMM stated:
Domain and subsidiary Risk Assessment Records are to be consolidated into a business unit [departmental] operational risk register and this is to be [consolidated] into a Master Operational Risk Register.
Related occurrences
Brisbane Airport
Overview
A review of the ATSB occurrence reporting database[58] indicated that, from 2008–2018, there were at least 20 other airspeed anomaly occurrences involving high-capacity regular public transport aircraft on take-off from Brisbane.[59] There were 5 reported airspeed anomalies during take-off due to system failures other than pitot system blockages, and 15 due to pitot system blockages.
In all the occurrences involving pitot system blockages, one pitot probe was blocked. Six of them were associated with insects or insect nests, all between the months of January and April, with the remaining 9 having no recorded cause. There were 5 different aircraft types involved: Airbus A330, Boeing 737, ATR 72, Fokker F28, and Dornier 228. None were operated by Malaysia Airlines.
The ATSB investigated two other A330 aircraft where one of the pitot probes had been blocked with wasp nests: one in 2006 and one in 2013. There have been no reported instances where more than one pitot probe was blocked by wasps.
Overall, the 20 airspeed anomaly occurrences that were examined resulted in 10 rejected take‑offs, 9 flights turning back after take-off, and 1 flight that continued to its destination. The occurrences involving Airbus aircraft (all A330s) resulted in 3 rejected take-offs and 1 air turn-back.
2006 occurrence
In 2006, the flight crew of an Airbus A330 taking off from Brisbane observed a discrepancy between their airspeed indications: at that time, the PF’s airspeed was 110 kt and the PM’s airspeed was 70 kt.[60]The crew rejected the take-off, and the aircraft reached 122 kt before decelerating. Reverse thrust was not used. Due to excessive heat in the aircraft’s main landing gear brakes, the fusible plugs on six of the eight main landing gear wheels melted and the respective tyres deflated during taxi. There were no injuries.
The operator required the fitment and removal of pitot probe covers ‘as necessary if the ground time exceeds 12 hours, or less at the discretion of the certifying engineer.’ About 2 months before the occurrence, an email instructed maintenance staff to ‘fit pitot probe covers as soon as possible and remove them as close as possible to departure.’ In this case, the relevant engineer did not fit pitot probe covers because the aircraft’s turnaround was expected to be short: about 55 minutes.
There had been 5 incidences of pitot system failure associated with Brisbane operations in January–March 2006, including the investigated occurrence. At the time, they were suspected to be the result of mud wasp infestation but debris was only reported to have been found in the pitot probe of the investigated occurrence aircraft. Of the 5 occurrences, 3 resulted in rejected take-offs in Brisbane, and 1 other aircraft later had 2 rejected take-offs after the problem was not identified during maintenance.
2013 occurrence
In 2013 at Brisbane Airport, an Airbus A330 took off with two airspeed sources inoperative.[61] The flight crew had rejected an earlier take-off attempt at about 88 kt after observing an airspeed indication problem on the captain’s display. The flight crew taxied back to the terminal where troubleshooting was carried out. During troubleshooting, in accordance with manufacturer instructions, ADIRU 1 was suspected faulty. It was exchanged with ADIRU 2 and disabled, with the FO’s air data source now set to ADIRU 3, which was permissible under the minimum equipment list. During a second take-off with the captain as PF, the aircraft passed the V1 decision speed (151 kt in this case) before the flight crew detected that the captain’s display remained erroneous. The investigation report stated:
During the second take-off roll, the crew reported that the red airspeed flag was not apparent until after V1. However, the recorded flight data again indicated that it was likely that a red airspeed flag would have been displayed on the captain’s PFD, after the groundspeed had reached 50 kt.
The take-off was continued. Once airborne, with only one valid source of airspeed data, the crew declared an emergency and returned to Brisbane. There were no injuries. Remnants of an insect nest consistent with that of a mud wasp was found in the captain’s pitot probe, likely formed during the 2-hour turnaround (pitot probe covers were not fitted).
Database searches
Australian aircraft defect reports
An ATSB search of the CASA Defect Report Service database for reports from 2010–2020 involving transport category[62] aircraft identified:
54 reports of wasp or insect infestation of pitot probes:
10 were in Brisbane, 2 elsewhere in Queensland (Coolangatta and Townsville), 4 in Sydney, 3 in Perth, 2 in Fiji, and 1 in a remote town in Western Australia (32 locations were not stated)
21 events involved failures that would probably not be detectable on take-off, and a further 9 events had no flight phase stated
of those that might have been detectable on take-off, 11 take-offs were continued and 15 were rejected (including 3 rejected take-offs for the same problem); 6 rejected take-offs were from below or slightly above 100 kt and there was no information available for the others.
a variety of aircraft types were affected with no clear correlation with any type or manufacturer
on several occasions, pitot/static system tests did not initially reveal obstructions, sometimes leading to further rejected take-offs when the blockages reappeared
one report stated that a wasp infestation had occurred in a 20-minute period after pitot probe covers were removed for flight
there was at least one reported event in every month, with most (72%) between December and April, and a further 15% in October or November.
other sensors including static ports, elevator feel pitot probes[63] and engine sensors were also affected several times
on 12 occasions, wasp nests were found on external surfaces such as control surfaces, actuators, pressure outlet valves, and doors.
Airbus operator reports
Airbus received reports of 0–4 in-service pitot probe blockage events causing unreliable airspeed on take-off each year from 2010–2019, mostly from insect activity and mostly from different airports. The number increased in 2020, with 55 reports from January 2020 to March 2021. Data on all of these occurrences is limited. Airbus reported that about one-third of occurrences through each period resulted in the take-off being continued.
Of the 55 recent reports of unreliable airspeed on take-off, 44 were due to blocked pitot probes, mostly due to insect activity after extended storage, although there were some involving aircraft that were on the ground for less than 2 hours. Most (36) unreliable airspeed events resulted in rejected take-offs, with the other 19 take-offs being continued.
A post-flight report, containing limited data about the flight, was available for 17 of the 19 continued take-off events. Airbus analysis of these records found that:
for 2 events the ISIS was the only instrument displaying unreliable airspeed
for 1 event, a speed flag appeared
for 1 event, an ECAM message and master caution (single chime) alert were triggered before 80 kt.
Aside from the occurrence event, there were 2 flights with reported blockages of multiple pitot probes from 2010–2019, and 5 from January 2020–April 2021. These led to 3 rejected take-offs (at 125 kt, 100 kt, and an unknown speed) and the other 4 take-offs being continued.
Airbus later reported that, from April to July 2021, a lower proportion (13%) of unreliable airspeed occurrences resulted in a continued take-off.
Airbus published case studies about airspeed anomalies on take-off in an article titled Unreliable Airspeed at Takeoff (Airbus 2021). The occurrence event was one case study. The other two were:
In an A330, the captain’s airspeed during take-off was low, displaying 55 kt at the time of the 100 kt speed call (when the flight crew detected the discrepancy), and 80 kt at rotation (133 kt). The speed flag was not displayed because the measured airspeed was above 30 kt and the difference to groundspeed was not sufficient to trigger the flag. The take-off was completed and the flight crew decided to return. The article stated:
If the airspeed was monitored even more closely by the flight crew during the takeoff roll, they may have identified the speed discrepancy sooner, allowing them to reject the takeoff and bring the aircraft safely to a stop.
In an A320, the captain’s airspeed read 45 kt with the aircraft at a standstill on the ground. During the take-off roll, the captain’s indicated airspeed increased slightly but fell below actual airspeed and read 58 kt at the 100 kt speed call, at which point the flight crew detected the problem and rejected the take-off. The article stated:
The Standard Operating Procedure requests monitoring of the PFD speed scale during the entire takeoff roll. Following this recommendation may have made the flight crew aware of the airspeed discrepancy earlier than the 100 kt callout and enabled them to reject the takeoff at lower speed.
Occurrences related to air data sensor malfunction
Air data malfunctions directly related to maintenance activities
Airbus had records of 3 occasions where aircraft took off with one pitot probe cover installed, involving various Airbus types with broadly similar warning systems and displays to the A330. They resulted in one rejected take-off from 95 kt, one continued take-off after the problem was detected at about 100 kt, and one continued take-off from an unknown speed. There were no previous recorded occurrences with more than one pitot probe cover installed.
The ATSB recorded 2 previous instances of high-capacity air transport aircraft departing an Australian airport with pitot probe covers left on from 1998–2018. Both were Fokker F28s with one pitot probe left on, resulting in rejected take-offs.
In 2021, a Boeing 787 that had flown from Melbourne, Victoria to Los Angeles, United States was found to have tape (with ‘remove before flight’ streamers) left over the engine static ports following previous maintenance. This occurrence is under investigation by the ATSB.[64] In 2012, an A330 turned back due to discrepancies between the airspeed indications that appeared after take-off.[65] Later analysis found that the PF’s (captain’s) airspeed was reading 20–30 kt too low and the standby airspeed was 30–50 kt too low. The investigation found debris in all three pitot systems that was from pitot probe covers that were damaged when probe heat had been applied with the covers still fitted at some point prior to the flight.
In 2008, the flight crew of an Airbus A320 lost control during a test flight while carrying out an improvised low-speed test at low altitude over the Mediterranean Sea near the French coast.[66] The investigation found that water had entered angle-of-attack sensors that had been incorrectly left uncovered during aircraft washing. The water froze, immobilising two of the three sensors and disabling the aircraft’s low speed protections. There were 7 fatalities.
In 1996, a Boeing 757 impacted water after take-off in darkness from Lima, Peru.[67] Just after take-off, the flight crew identified multiple problems with the air data system and received multiple contradictory alerts. The flight crew attempted an approach and landing at Lima, experiencing several stalls and altitude loss. The air traffic controller provided altitude information to the flight crew, which was incorrectly assumed to be valid but was actually erroneous as it was provided by the aircraft’s systems. Distracted by the contradictory warnings, the flight crew did not respond to the radar altimeter’s indications (which were not affected by air data) at low altitude and the aircraft impacted water. All 70 occupants were fatally injured. The investigation found that the aircraft’s static ports had been blocked by tape that was installed during a maintenance activity, and not removed afterwards. Relevant recommendations included pilot training for unreliable airspeed and more conspicuous covers for static ports.
Insect ingress
In June–July 2021, several aircraft had abnormal pitot/static system events in aircraft operating from or stored at London Heathrow Airport, United Kingdom, leading to two rejected takeoffs,[68] one flight returning after the aircraft displayed multiple fault messages shortly after push-back, and one aircraft that displayed a pitot probe heater fault in-flight without any other abnormal indications. One take-off involving an A320 was rejected at 104 kt after the captain (PF) observed less than 40 kt on the captain’s PFD and 70 kt (the actual airspeed) on the FO’s. Another A320 take-off was rejected at about 60 kt after both flight crew observed low airspeed indications (less than 30 kt) early in the take-off roll. The AAIB investigation identified the cause to be the nesting activity of certain species of wasps and bees within pitot probes. On inspection, three additional aircraft were found to have blocked pitot probes. Some insects and larvae were sampled and identified as Ancistrocerus parietum (a species of mud wasp) and Megachile pilidens (a species of solitary bee). Most of the aircraft had been in storage.
In 2020, the flight crew of an Airbus A321 taking off from Doncaster, United Kingdom, rejected the take-off at V1 (120 kt in this case) after no airspeed was seen on the captain’s display.[69] Insect larvae was found in the corresponding pitot probe. The aircraft had been stored for nearly 12 weeks with pitot probe covers fitted.
Airbus advised the ATSB that in 2011, an A320 took off with 3 different airspeeds displayed. Although data is limited, Airbus analysis indicated that the captain’s and ISIS airspeeds were both under-reading; the captain’s by about 8 kt initially and the ISIS by about 36 kt shortly after take-off. The FO’s airspeed may have also been erroneous. The NAV IAS DISCREPANCY message and master caution were presented during the take-off roll, indicating that a discrepancy of at least 25 kt was present for at least 10 s, although the time at which this triggered is not known. The flight crew turned back. All 3 pitot probes were found blocked by insects. The flight was the first after maintenance.
An operator reported several airspeed anomalies in its Airbus A330 fleet between June 2011 and February 2015 in airports in Hawaii and California, United States (Ecosure 2017). Insect debris consistent with wasp activity was detected in eight of the involved aircraft. Non-insect material in two others was initially believed to be associated with human construction activities but it was later suggested that these could be from preliminary nest building activity by wasps.
In 2009, a Boeing 757 took off from Accra, Ghana, with erroneous airspeed indications on the captain’s side.[70]The captain, who was pilot flying, detected the problem before the aircraft reached 80 kt (at which point a speed call was required in this aircraft type) and decided to continue the take-off while referencing the standby and first officer’s instruments. The flight crew and an engineer on board correctly diagnosed the failure of the left air data system and selected the captain’s instruments to the alternate system before engaging the first officer’s autopilot, believing that their actions had disconnected the erroneous air data from the flight management computers. In fact, the aircraft’s flight management computers continued using the erroneous data, and falsely sensed an overspeed condition which resulted in an automatic pitch‑up command. The flight crew disconnected the autopilot and returned to Accra. There were no reported injuries. A beetle or similar insect was later found in the left pitot system. The investigation concluded that ‘although the commander [captain] considered that conditions were suitable for resolving the problem when airborne, a low speed rejected take-off would have been more appropriate in these circumstances.’ The operator subsequently advised flight crews to reject a take-off if a similar airspeed problem is recognised below 80 kt.
In 1996, a Boeing 757 impacted water after take-off in darkness from Puerto Plata, Dominican Republic after a failure of the captain’s airspeed display (the FO’s and standby airspeed displays were correct).[71] When performing the required airspeed cross-check at 80 kt during the take-off roll the flight crew identified that the captain’s airspeed indicator was erroneous. The flight crew continued the take-off. During the climb, aircraft systems presented multiple warnings associated with excess speed. Although the aircraft was flying slowly, the flight crew thought that it was flying too fast and reduced thrust. The stick-shaker stall alert system, alerting the crew to the aircraft’s slow speed, activated. The captain increased thrust in response to the conflicting alerts. The left engine flamed out due to inadequate airflow to the left engine, while the right engine’s thrust increased, and control was lost. The aircraft impacted water and all 189 occupants were fatally injured. An investigation by the Dominican Junta Investigadora de Accidentes Aéreos (JIAA) found that the pitot probe feeding the pilot’s airspeed indicator was blocked by an insect nest. It highlighted the importance of recognising a speed indication malfunction during take-off and recommended, among other things:
training emphasis ‘on the importance of recognising a malfunctioning airspeed indicator during take-off
the use of blocked pitot probe scenarios in flight simulator training, and
inclusion of a ‘caution alert’ when erroneous airspeed is detected.
Water or ice ingress
There have been several occurrences, a very small number of which were fatal accidents, where in‑flight pitot probe icing was encountered in recent decades.
In 2009, an Airbus A330 stalled and collided into the sea at night while en route to France from Rio de Janeiro, Brazil.[72]The investigation found that in-flight pitot probe obstruction due to ice accumulation had led to discrepancies in the airspeed displays and multiple alerts.. The flight crew did not carry out the unreliable airspeed procedure. Following pitch-up control inputs made by the pilot flying, the aircraft entered a stall which the flight crew did not diagnose and control was not regained. There were 228 fatalities. The aircraft was not fitted with the BUSS.
A complete review of other in-flight pitot probe icing events was not undertaken by the ATSB. Other related occurrences (on take-off or associated with pitot probe drain blockages) include:
In 2018, an Antonov An-148 crashed shortly after take-off in icy instrument meteorological conditions from Moscow, Russia.[73] With three different airspeed indications, the flight crew lost control. There were 71 fatalities. Pitot probe heating had not been selected on, and the three pitot probes had become blocked with ice.
In 2015, the crew of an Airbus A320 received multiple alerts arising from erroneous airspeed measurements in all three systems at various times during the take-off and climb from Perth, Australia.[74] The flight crew incorrectly diagnosed the source of the problem (interpreting an airspeed problem as an angle-of-attack problem) and subsequently thought that a stall warning was spurious when in fact the warning was valid. The flight returned to Perth. The airspeed disagreement was due to the pitot probes being contaminated with foreign material that prevented water from draining..
In 1999, a McDonnell Douglas MD-11F freighter crashed on landing at Subic Bay, Philippines.[75] There were no fatalities. The Aircraft Accident Investigation Board (Philippines) found that drain holes in the captain’s pitot tube were likely blocked, leading to erroneous airspeed indications on the captain’s display. The investigation stated that the available flight crew indications (the display of an amber ‘IAS’ on the PFD and three alerts associated with other systems) did not directly lead the flight crew to commence the appropriate ‘Airspeed: Lost, Suspect or Erratic’ checklist. The NTSB also stated that the flight crew did not make use of the standby airspeed indication to determine the reliability of the other indications. The investigation report detailed other air data anomalies in related aircraft types.
Other debris
On 6 November 1996 a McDonnell Douglas MD-11 overran the runway during landing at Buenos Aires, Argentina.[76] The aircraft received minor damage and there were no injuries. No investigation report was available; the NTSB stated in the 1999 Subic Bay investigation report that:
…the crew landed long and fast as a result of erroneous airspeed indications. It was determined that these indications were caused by water in the pitot tubes as a result of blocked pitot tube head drain holes. Laboratory analysis of the debris blocking the drain holes revealed fiberglass shards, which may have entered the uncovered pitot tubes as a result of on-airplane radome repairs.
There were 2 identified previous instances of similar alerts and anomalies in the same operator’s other MD-11 aircraft that were also caused by blocked pitot probe drain holes, and 3 other instances likely due to air data computer malfunction or other reasons.
Aircraft returned to service after storage
There have been numerous reports of aircraft having air data problems after being returned to service after periods of storage during the COVID-19 pandemic from early 2020 onwards. For example:
On 12 June 2020 (revised 7 October 2020), IATA issued Guidance for Managing Aircraft Airworthiness for Operations During and Post Pandemic, with advice on the prevention of problems with air data systems during prolonged storage. IATA drew attention to concerns about contaminated air data systems on aircraft after a period of storage, stating that ‘unreliable airspeed and altitude indications are key contributing factors leading to [loss of control and controlled flight into terrain] accidents in the past’. It urged flight crews to include related elements in pre-flight threat and error management (TEM) briefings, such as cross-checking airspeed, the rejected take-off procedure, and memory items of unreliable airspeed and altitude indication procedures.
On 20 July 2020, the European Union Aviation Safety Agency (EASA) issued a publication titled Return to service of aircraft after storage: Guidelines in relation to the COVID-19 pandemic, indicating that there had been occurrences of ‘erroneous air data information including contaminated / blocked pitot-static systems’ following aircraft storage. The guidance was later updated with additional examples of hazards, mitigation strategies and other guidance.
On 5 August 2020, EASA issued safety information bulletin 2020‑14 Pitot‑Static Issues After Storage due to the COVID-19 Pandemic which stated:
EASA has noticed an alarming trend in the number of reports of unreliable speed and altitude indications during the first flight(s) following the aircraft leaving storage, caused by contaminated air data systems. This has led to a number of Rejected Take-Off (RTO) and In-Flight Turn Back (IFTB) events. Most of the reported events concerned the accumulation of foreign objects, such as insect nests, in the pitot static system. This contamination caused obstruction of pitot probe and static port orifices, in some cases on multiple systems, even when the covers were installed. The risk of such contamination was increased, if the aircraft storage/de-storage procedures were not completely or improperly applied at the beginning, during or at the end of the storage period.
A later revision recommended rejecting a take-off if an airspeed anomaly is detected, and stated:
Operators should also consider including the unreliable air data scenario into the operator’s post-Covid re-qualification simulator programme. The Operator’s policy on take-off briefings should be re-assessed to consider the issues highlighted in this SIB [Safety Information Bulletin].
On 3 June 2021, the Dutch Safety Board issued 21.0004423 Interim warning in response to two serious incidents involving commercial aircraft, related to return to service of aircraft following temporary storage, stating:
The Safety Board is currently investigating two occurrences involving commercial aircraft that encountered problems with their airspeed and altitude indications shortly after takeoff… In one of these occurrences, a cover had not been removed, while in the other a number of pressure lines had not been properly connected. In both cases, the pilots were presented with incorrect altitude and airspeed information as a consequence.
On 12 June 2021, the United Kingdom Civil Aviation Authority (CAA) issued safety notice SN‑2021/014 Pitot Blockage Events that stated:
The UK CAA and AAIB [Air Accidents Investigation Branch] have been advised of three separate events occurring at London Heathrow Airport between 9 June 2021 – 11 June 2021, whereby aircraft have been subject of pitot blockages that resulted in airspeed discrepancies and associated crew actions. The cause of these events are the subject of ICAO Annex 13 investigation, which the UK AAIB is undertaking, however initial feedback suggests a form of insect infestation may have contributed to these events.
The notice additionally stated:
Crews should be made aware of this potential issue, reminded of the importance of the speed checks during the take-off roll and the actions to be taken in the case of a discrepancy, as well as the appropriate unreliable speed indications for their aircraft type should they discover the issue once airborne.
Pitot probe covers were fitted to the aircraft during the three-hour turnaround, which is a strategy used by many airlines to prevent wasp infestation at Brisbane Airport, Queensland. There were numerous opportunities for their presence to be communicated to or identified by other people, but a range of individual errors and organisational problems interfered, and ultimately, the covers were not removed.
With covers fitted to all three pitot probes, the aircraft’s three air data systems were prevented from measuring airspeed. Airspeed is a critical flight parameter. It is particularly important to flight crew during take-off and initial climb, as it is the basis for their awareness of flight conditions such as the approach of aerodynamic stall and determination of critical decision points.
Wasp ingress almost always affects just one system, and larger aircraft typically have multiple airspeed data sources. Conversely, the non-removal of pitot probe covers potentially results in the loss of all airspeed data, which increases the potential for adverse consequences.
Aircraft of various types have commenced take-off with erroneous or absent airspeed on numerous occasions. Sometimes multiple indication systems were affected for a variety of reasons. Nearly all occurrences result in a successful rejected take-off or turn-back. A small number of flight crews had significant trouble correctly ascertaining the nature of the problem and determining the aircraft’s actual airspeed, or had such a high workload that other problems (such as low altitude) were overlooked, occasionally resulting in fatal accidents.
In this occurrence, both flight crew became aware of the problem at different points in the take-off, but did not communicate or coordinate well and make a clear decision to reject or continue while it was still safe to reject. As the aircraft continued to accelerate, the flight crew were left with no safe option other than to continue the take-off. After take-off, the flight crew regained effective coordination through the application of published procedures and, crucially, did not allow the problem-solving process to distract from keeping the aircraft within a safe flight envelope.
Having reached a safe altitude the flight crew completed the required troubleshooting actions, which activated an optional-fitment indication system called the back-up speed scale (BUSS). Coupled with information from air traffic control, this provided enough information for the pilots to maintain control of the aircraft and land safely.
In the following sections, this analysis discusses a wide range of factors associated with the occurrence, broadly divided into factors associated with:
management of the take-off and flight without airspeed information
the mud wasp hazard, use of pitot probe covers, and the aircraft being dispatched with pitot probe covers fitted
Malaysia Airlines’ management processes.
Take-off without airspeed information
Relevant concepts
A common and significant challenge for the human factors discipline is to explain why a person does not detect or correct a problem when it appears, particularly when the indications of a problem and the right course of action appear obvious in hindsight.
Figure 48 provides a simplified representation of the activities involved in recognising and recovering from a problem. Take-off is one of the highest workload phases of flight (Lee and Liu 2003), and abnormal events occurring at this time further increase workload (Orasanu 1994). In such situations, an individual’s cognitive capacity can be reduced by stress, slowing or even halting the processes involved in recovering from a problem.
Figure 48: Activities involved in recovering from a problem
Source: ATSB
Although each stage adds to the total recovery time, the more significant delays are usually the perception and assessment stages, and these delays are generally more to do with the focus of attention rather than the perception process.
During the take-off, red speed flags on both primary flight displays from 50 kt onwards unambiguously indicated that airspeed data was erroneous. This gave the flight crew about 12 seconds to detect the problem and respond before reaching the speed at which they should be ‘go-minded’ (100 kt), and a further 15 seconds before the aircraft passed the decision speed where they could no longer reject the take-off without significant risk of an accident.
In this context, the crew first had to identify the problem, either through detecting the absence of movement (or slow movement) on an airspeed tape, a discrepancy between the airspeed indications, observing the presence of a speed flag on a PFD (after 50 kt), or through one flight crewmember observing a cue and alerting the other. The nature of unreliable airspeed indications and flight crew guidance will be discussed in the following section.
Surprise occurs where there is a mismatch between new information and a person’s expectations (Landman and others 2017). It has been found that during an unexpected event, there is a delay in pilots’ response to the situation and there is also more variation in response times (Casner and others 2013). For example, when faced with an unexpected aerodynamic stall, pilots took almost 9 times longer on average to respond than when the situation was expected—as long as almost 20 seconds. It has been found participants reacted more slowly to reject a take-off when they were not expecting a significant failure (Stevens and others 2007).
Flight crew actions prior to reaching 100 kt
Flin and others (2008) state that decision errors can occur ‘when conditions change so insidiously that the operators do not update their situation assessments often enough.’ A crew would not immediately notice erroneous airspeed prior to 30 kt in the take-off, because the speed tape is not expected to move until this speed. The cue itself is very subtle: it is difficult to notice the absence of movement as well as judge the point at which the tape should move. Individuals are less likely to respond quickly to a gradually emerging situation (Landman and others 2017, Underwood and others 2013).
After 30 kt, the airspeed tape would normally begin to move and a yellow airspeed trend arrow would appear. Their absence in the period between 30 kt and 50 kt was not noticed by either flight crew member.
At 50 kt, a red speed flag would have appeared on both PFDs. The captain identified the presence of a speed problem as soon as it was clearly displayed, as indicated by the ‘speed’ statement 2 seconds after the speed flags appeared. The captain did not act on the information, and probably remained in the assessment stage, unsure of the right decision. Possible explanations for this might include:
surprise and/or stress due to the unexpected and extremely rare nature of the problem, which had not been encountered before (stress could be indicated by the captain’s increased breathing rate and reported time compression)
time taken to understand the full nature of the problem, possibly related to the captain’s relatively low experience on Airbus aircraft or the nature of the problem’s presentation (discussed in a later section)
miscalculation of the severity of the problem and not projecting it forward as a future threat, therefore not justifying a rejected take-off (what might be phrased as ‘not wanting to turn a small problem into a big problem’)
distraction from hearing an unrelated radio call very soon after noticing the problem (the flight crew need to pay attention to radio calls to identify potential conflicts).
In a 2022 article titled Training Pilots for Resilience, Airbus stated (2022):
When a flight crew is exposed to unexpected disruptions, they may experience a physiological reaction, known as the startle effect. This involuntary and uncontrollable reaction may be accompanied by a momentary loss of situational awareness resulting in a temporary deterioration in performance.
The captain’s ‘speed’ statement was relatively quiet and apparently did not gain the FO’s attention. Effective crews build shared situation models when threats arise. They assess and communicate the nature of the threat, the degree of risk, and time available (Orasanu 2010). Put simply, for a crew to be effective, both crewmembers need to have awareness of a situation, not just individually. Research has found that higher-performing crews talked more about cues that signalled the possibility of future problems, which set them up to monitor the situation closely and to establish contingency plans in case conditions deteriorated (Orasanu 1994).
Airbus have repeatedly emphasised the importance of flight crew monitoring of airspeed on take-off (Airbus 2007, Airbus 2021). The flight crew procedures require the pilot monitoring (PM) to monitor airspeed, and although there is no strict requirement for the pilot flying (PF) to do so, it is normal for them to check airspeed from time to time. The FO, who was PF, almost certainly did not perceive a problem (either by seeing a speed flag or hearing the captain’s ‘speed’ statement) until the 100 kt speed call when the crew are required to cross-check their airspeed indications.
Research has found variation in flight crew scan patterns during take-off (Harris and others 1986). Studies have also shown that there is significant variability in flight crew monitoring during take-off and that the PF spends most of the time looking out of the windscreen (Knabl and others 2018, Mumaw and others 2001). This was likely the case in the occurrence event, especially in the dark lighting conditions that prevailed.
The PF needs to focus outside the aircraft most of the time, and can only glance at the instruments, with a significant amount of potential information needing to be assimilated in that glance. There is also a task switching cost in terms of a slower response time and increased errors when changing focus and assimilating information, such as changing from ‘eyes outside’ to ‘eyes inside’ (Monsell 2003). Further, people are inherently poor at monitoring for infrequent events (CAA 2013).
Flight crew actions from 100 kt onwards
The 100 kt speed call was likely made on the basis of groundspeed, which is not a valid reference for that call and the captain did not advise the FO that groundspeed was used as the captain’s reference. The captain later did not recall making the call. Research has found that it can be difficult for people to recall events that occurred during a stressful period (Wolf 2014). The captain’s (and, later, FO’s) breathing rate was elevated, which can be another indication of stress (Veltman and Gaillard 1996).
Research by Orasanu and others (1998) of tactical decision errors made by pilots (as identified in accident investigation reports) found that about three-quarters of the errors were of the type that involved a continuation with the original plan despite cues that suggested changing the course of action. Common contributions to these errors were ambiguous dynamic conditions and goal conflicts. Orasanu and others (1998) stated:
Ambiguity and goal conflicts both imply that multiple courses of action should be entertained, first, because different readings of ambiguous cues might lead to different actions, and second, because different actions might be needed to satisfy competing goals.
In this case, the flight crew had to choose between two competing and risky options: continuing a take-off without any valid airspeed or rejecting a take-off when there was a realistic possibility that the aircraft could not be stopped before it reached the end of the runway. To add to the problem, the second option was becoming riskier with time.
Stress is one factor that effects situation assessment because reaching decisions requires projection and evaluation of the consequences of the various options (Orasanu and others 1998). Stress limits the decision maker’s ability to project the situation into the future and mentally simulate the consequences of a course of action. Orasanu and others (1998) continue by stating:
Reaching decisions [with multiple options] requires projection and evaluation of the consequences of the various options. If pilots are under stress, they may not do the required evaluations. Stress limits the decision maker's ability to project the situation into the future and mentally simulate the consequences of a course of action. …
…. Certain phases of flight induce higher levels of stress. namely those in which time is limited, workload is heavy, and there is little room for recovering from an error. These tend to be take-off and landing situations. Mistakes during these periods may have serious consequences.
Dealing with a serious and unfamiliar problem adds to this stress and interferes with the flight crew’s ability to understand, decide, and act. The flight crew’s stress and workload was indicated by their somewhat limited recall of events, the captain’s reported time compression, and later, possibly task-shedding (such as not changing frequency after take-off after being prompted).
Once aware of the problem, the FO likely went to the next step of the mental process, which was to assess the information. The captain’s 100 kt call gave the FO no indication of the existence of a problem. Until the FO performed the cross-check, the situation was normal in their mind and the FO would have been surprised to see a speed flag with no previous indication of a problem. Therefore, the FO had to assimilate the available information and (possibly) resolve the apparent contradiction between the 100 kt call and the presence of the speed flag on both displays.
The FO’s first response showed confusion (‘eh?’). The next statement might have been a suggestion to reject the take-off (as ‘[a]bort, uh?’), but the captain then said either ‘borders are red’ (possibly referring to the speed flag, which has red borders) or ‘both also don’t have’ (possibly referring to the absence of both pilots’ airspeed indications). The FO responded ‘ah’ and ‘oh no’ or ‘both no’. This exchange indicates that until about this point, the FO had not yet fully understood the problem and had not reached a decision. The FO’s increased breathing rate indicates their level of stress increased during this period.
The FO then prompted the captain for assessment or action (‘captain?’). The captain, likely still assessing the situation, did not immediately respond but then said ‘okay, check’ which did not make sense in that context, indicating continuing confusion.
Had the captain come to a decision to continue the take-off at any point, this should have been clearly commanded by calling ‘GO’ in accordance with the aircraft flight manuals. Only the captain had the authority to make such a decision; without this command, and with too little time to evaluate the captain’s responsiveness, the FO could only continue the take-off or suggest appropriate actions.
With more experience on the aircraft type, the FO had apparently arrived at a decision by this point, and said ‘go to ADR three’ (meaning to switch indicated air data to a third source). This is a step from the Unreliable speed indication procedure, which neither crewmember called for as required by the flight manual.
The FO, as PF, also did not first perform the required memory items of this procedure: pitch and thrust. The procedure required these actions to be taken if the ‘safe conduct of the flight is impacted’, and while the flight crew may have individually considered this not to be the case, they did not verbally confirm it with each other or challenge that assumption. There was no way for the flight crew to verify that the aircraft’s acceleration performance was adequate, which meant their situational awareness was not assured.
Pitching up on take-off too early slows the aircraft’s acceleration, so it is understandable why this step was not immediately accomplished. However, once it was clear the take-off would continue, the use of maximum available thrust would have enabled the aircraft to gain a safe speed and then climb to a safe altitude as quickly as possible. The FO may have also thought that a rejected take-off was still a viable option, and using maximum thrust or rotating would have effectively removed that option. In addition, the FO does not have control of the thrust levers after initially setting take-off thrust.
The FO’s next statement was indistinct on the recording. The operator interpreted it as ‘abort, abort’, which would be consistent with the FO’s recollection. If so, in the absence of specific terminology for the FO’s use in this circumstance, ‘abort, abort’ was an appropriate phrase to convey this intention. However, the indistinctness of the statement on the recording may also mean that it was not spoken clearly enough for the captain to understand. Also, it was spoken immediately after the suggestion to ‘go to ADR three’ so a suggestion to reject the take-off at this point would be unexpected. In any case, the captain did not respond.
Throughout this period, with no airspeed data available and only groundspeed and outside visual cues available, one or both of the flight crew were likely to be considering how close the aircraft was to the decision speed. As the aircraft accelerated, the flight crew had limited information to determine whether they had already passed, or were about to pass, this point. Harris and Khan (2003) found that once an aircraft approaches the decision speed, there is an increase in flight crew response time due to the increased difficulties of making a decision under time pressure. This may also be associated with a narrowing of perceptual scan, fixation on inappropriate solutions, and reduction of working memory capacity (Stokes, Kemper, and Kite 1997, referenced in Orasanu and Fischer 1997).
The flight crew’s process of perception, assessment, and decision-making was delayed, which took the crew past the period when the take-off could have been rejected with virtually no risk and resulting in a situation where the comparative risks of continuing or rejecting were uncertain.
Just 15 seconds after the 100 kt speed call, the aircraft passed the decision speed, and the flight crew could no longer reject the take-off without likely overrunning the end of the runway. Likely uncertain of the aircraft’s speed, the captain did not make the required V1 call even though groundspeed was available as an approximation. This may be due to ongoing confusion, and is also consistent with research that shows that people are likely to shed tasks when under a high workload (Wickens and others, 2013).
It is very likely that the FO decided that it was safer to rotate than to reject at about this time, and was able to commence the rotation at the correct time through judgement and experience (and possibly assisted by reference to groundspeed).
In summary, the flight crew’s inaction when faced with an unreliable airspeed indication on take-off can be explained by a range of factors. Surprise, uncertainty, time pressure, and ineffective communication probably led to stress and high cognitive workload, particularly after 100 kt. In turn, this led to a delayed, and ultimately absent, decision.
Most critically, the captain was aware of a problem but likely unsure how to manage the situation; the FO was not aware of a problem until the appropriate decision was much less clear. Furthering these issues, the two crewmembers made multiple remarks without clearly and assertively identifying the problem, proposing a solution, or responding to each other. This limited communication was coupled with and contributing to a limited capacity for each pilot to individually understand the problem, which delayed their response until the choice to reject the take-off was no longer available.
Management of the flight after take-off
Although by the time of lift-off both flight crew members recognised the existence of an airspeed indication problem, neither made the required ‘unreliable speed’ call and there was no coordinated action to apply the Unreliable speed indication procedure until about 3 minutes after take-off.
During the intervening period, the FO maintained normal pitch and thrust settings, instead of applying the 15° nose-up pitch attitude and take-off/go-around (TOGA) thrust memory items of the Unreliable speed indication procedure. In the absence of any airspeed indication and in alternate law with reduced flight envelope protection, it would have been prudent to apply these memory items to establish a safe speed and climb gradient as soon as possible. Maintaining a pitch attitude that was potentially lower than normal in the absence of airspeed indication also risked accelerating past the maximum flap and landing gear extension speeds.
Without either crew calling for the Unreliable speed indication procedure (which had troubleshooting steps including switching air data), the FO twice more asked for the air data to be switched to a third source, and one of the flight crew did so with the FO’s air data source at about the same time. It is not clear whether the other crewmember was aware of this action through non-verbal communication. While the action did not pose an immediate threat to safety, troubleshooting outside of established procedure can be hazardous, and doing so without the confirmation of both crew risks a crewmember losing awareness of the aircraft’s ongoing status and flight path.
Perhaps distracted by the erroneous airspeed problem, the flight crew did not carry out the After take-off/Climb procedure which is still required to be conducted in abnormal conditions to ensure a safe aircraft configuration. Although not having an effect in this case, this bypassed some important checks of aircraft configuration that could have led to other problems later in the flight.
The flight crew advised ATC of the problem and established a safe altitude before carrying out troubleshooting and applicable procedures. The flight crew’s workload was reduced by:
their request for a block level, granted by air traffic control, rather than a specific level
provision of groundspeed information and vectoring from air traffic control
following standard procedure and effective crew resource management principles.
Once activated, the Airbus back up speed scale (BUSS) gave the flight crew immediate indication of the aircraft’s safe speed limits. This almost certainly resulted in a significantly lower workload than they had during the climb and working from pitch-and-thrust tables. This and other occurrences, such as the 2009 A330 accident over the southern Atlantic Ocean, illustrate the safety value of the BUSS.
The reduction of workload greatly helped the flight crew in the ongoing management of the remainder of the flight. Apart from not establishing the correct pitch and thrust settings immediately after take-off, the flight crew managed airspeed and altitude within safe limits to a reasonable extent based on the limited data they had available. The aircraft did not approach a stall or descend too close to water or terrain at any point. Although the aircraft probably exceeded the maximum configuration speed on about two occasions, it was by a small amount for brief periods.
Air traffic controller response to urgency call
No reason could be established for the tower controller not hearing the PAN-PAN call. There had been enough time since the preceding telephone call for it to no longer be a significant distraction, particularly for an air traffic controller well-used to multitasking. There were no other known distractions or issues that could have interfered with the controller’s perception of the urgency call.
It is possible that, having just asked the aircraft to transfer to the departures frequency and received acknowledgement, the tower controller may have unintentionally disregarded the next transmission from that aircraft as being on another frequency or otherwise being unrelated to the tower controller’s duties, and later forgotten about it.
Take-off airspeed monitoring and decision-making
Introduction
Flight crew monitoring and rapid decision-making during take-off are critical. Flight crews need to detect a problem and arrive at the safest decision based on the information presented to them and their previous training. Unfortunately, there are sometimes situations when the correct course of action is not immediately obvious, and flight crews need to consider the risks of each option and choose between them. This is a significant challenge in unfamiliar, time-critical situations such as the loss of airspeed indications on take-off.
Air data problems can manifest in many different ways that can be hard to differentiate and diagnose quickly. The instrument indications may be obviously false or may appear to be normal but are actually false. Airspeed displays may differ but remain somewhat close in value, which can be particularly difficult to detect when they are rapidly changing. In these situations, crews can be unsure about the very existence of a problem. The process becomes even more difficult when considering the potential for multiple failures, such as when two sources agree: the third might be correct but could be untrusted. Airbus stated (2007):
…it should be emphasized that identifying an unreliable speed indication is not always obvious: no single rule can be given to conclusively identify all possible erroneous indications and the display of contradictory information may confuse the flight crew.
When presented with a clear indication that airspeed was unavailable, the occurrence flight crew still experienced uncertainty and did not actively decide on a response until the alternative (rejecting the take-off) was no longer available. The occurrence shows that, even when flight crews are faced with unambiguous displays, a range of human factors can interfere with expected behaviour and result in suboptimal actions. A greater proportion of crews will make errors when presented with information that needs to be evaluated.
This occurrence involved the concurrent failure of three air data probes due to a common cause. While this particular failure mode (multiple covered pitot probes) is extremely rare, failure of one or more airspeed systems on take-off occurs from time to time and is likely to be more difficult to identify quickly. Experience has shown that these failures occur in a variety of ways—with airspeed that reads too high or too low, and sometimes with multiple systems. Diagnosing an airspeed problem quickly enough to reject a take-off at low speed has proven challenging for many crews. The occurrence flight crew had not received training that involved unreliable airspeed on take-off.
Flight crews need to become aware of an airspeed issue as early as possible in the take-off. They then need to make the appropriate decision quickly depending on the aircraft’s proximity to the ‘decision speed’ (V1): the last point at which the crew can reject the take-off and still come to a stop before the end of the runway. Even before V1, however, the hazards of a rejected take-off are still present: ineffective or overheated brakes, burst tyres, and occasionally runway veer-offs have been encountered.
Rejecting a take-off becomes much more hazardous as the aircraft’s speed increases. The United States Federal Aviation Administration (1993) found that most accidents that occurred during a rejected take-off were from the very small proportion (2%) that were rejected above 120 kt. An earlier rejection is safer for two primary reasons: at the initial application of brakes the aircraft’s speed is lower, limiting most of the adverse effects, and it has travelled less distance along the runway. This is the basis of Airbus’ philosophy for flight crews to be ‘go-minded’ past 100 kt—a crucial point during the take-off.
The safest response to unreliable airspeed on take-off mainly depends on the aircraft’s speed at which the problem is detected. Airbus analysis of past occurrences suggests that unreliable airspeed indications should almost always be detectable before the aircraft has reached 100 kt. At these low speeds, immediate action is needed if the take-off is to be rejected. However, statistics indicate that some flight crews either undergo similar decision-making delays as the occurrence flight crew, or do not become aware of the problem until late in the take-off, when they are supposed to be ‘go-minded’. This places them in a difficult position where they have to make a quick decision while facing a potentially serious and unfamiliar problem.
Normally, both flight crew check their respective airspeed displays and verify that they are close to 100 kt, or by the time the PF checks, just past it. Although the captain had detected an airspeed issue earlier, this is when the flight crew truly began to assess the situation but they were then faced with a very limited amount of time in which to decide what to do. It is likely that this time pressure applied in other occurrences where flight crews continued the take-off, as well as other factors such as uncertainty over whether an airspeed problem actually exists.
In fact, with the 100 kt airspeed cross-check necessarily occurring in the high-speed regime, pilots need to make the decision more quickly and may be more inclined to continue if they do not detect unreliable airspeed until then. In an Airbus A330, the decision speed can be as low as about 120 kt, potentially requiring the flight crew to call, check, respond, decide and act in just a few seconds. Some other aircraft types have an airspeed cross-check at 80 kt.
Following an investigation involving a Boeing 737-800 with a faulty angle-of-attack sensor, where two take-offs were continued after the flight crew saw an airspeed discrepancy at the 80 kt speed check, the French Bureau d'Enquêtes et d'Analyses pour la Sécurité de l'Aviation Civile reported (BEA2018-0071.en):
The take-off is a dynamic phase during which the crew may not have the resources to identify all the possible consequences of a failure of the speed indicator. Given the importance of the speed indications to continue the flight, a doubt as to this parameter should incite the crew to envisage rejecting the take-off when this is still possible.
Following two low-speed rejected take-offs due to unreliable airspeed in 2021, the United Kingdom Air Accidents Investigation Branch (AAIB) noted (AAIB-2736):
The pilots of G-EUUO observed that, at the unusually low operating weights associated with low passenger numbers, the Airbus A320 SOP [standard operating procedures] 100 kt check can be very close to V1, leaving little time for a rejected takeoff decision if the speed anomaly is only detected at that point. The equivalent speed check on the Boeing 777 is made at 80 kt. The recorded data traces for the rejected takeoffs showed that both aircraft briefly continued to accelerate after their thrust levers were retarded. The investigation was made aware of a similar incident at Luton Airport where a lightweight Airbus A319’s takeoff was rejected at V1 (109 kt), but before the retardation devices overcame the aircraft’s residual acceleration, its airspeed peaked at 120 kt. While its speed exceeded V1 during the rejected takeoff, the aircraft’s relatively light weight meant that there was more than sufficient runway stop margin available.
This emphasises the importance of flight crews being able to detect the condition early in the take‑off and then quickly make an appropriate decision. Pilot awareness and decision-making are two of the key factors that control whether a flight crew continue or reject a take-off when faced with unreliable airspeed, and both were involved in the occurrence event. These factors will be discussed in the following sections, as well as analysis of the flight crew’s non-technical skills (NTS) training to evaluate whether this might have affected their performance.
Occurrence data
Before 2020, when unreliable airspeed occurrences apparently increased more than tenfold over the previous average (largely due to aircraft having been in storage), Airbus flight crews encountered unreliable airspeed on take-off at least about once a year. It appears that in most cases of serious unreliable airspeed occurrences (that is, other than slight discrepancies) where the take-off is continued, flight crews turn back, indicating that if they become aware of unreliable airspeed while still able to reject the take-off safely, most flight crews would do so in the absence of confounding factors. This suggests that a deliberate decision to continue would not be common, and probably mostly associated with relatively minor airspeed failures (such as slight discrepancies).
Overall, although unreliable airspeed is a potentially hazardous condition, historic occurrences suggest that pilots have a varying response to airspeed anomalies on take-off. In at least one case, an Airbus flight crew rejected a take-off at the decision speed when one display was incorrect. There were several occasions where flight crews in various aircraft types continued a take-off with one or more erroneous airspeed displays, either because the issue was not detected while it was still safe to reject the take-off, delayed flight crew response to an observed problem, or because the flight crew decided to continue.
A combination of these factors was involved in the occurrence event: the captain was aware of a problem initially, while the FO was not aware of a problem until the aircraft’s speed was past 100 kt. The fact that a decision to continue or reject was not made indicates the presence of factors that affected or delayed decision-making throughout the take-off, as well as with factors that affected the FO’s initial awareness.
The failure of a single airspeed source is significant enough for Airbus to recommend rejecting the take-off if identified at the time of the 100 kt cross-check (Airbus 2021) or before the decision speed (Airbus 2006). Occurrences involving multiple unreliable airspeed indications should generally be more readily detectable than single erroneous indications. Once the situation is detected, flight crews would be more likely to reject a take‑off because of the increased risk of flight with multiple failures. Therefore, it would be expected that these situations would most often result in a low-speed rejected take-off.
However, only 1 of 8 occurrences of multiple erroneous airspeeds on take-off has resulted in this outcome.[77] Five of these occurrences involving multiple unreliable airspeed indications were continued, including the occurrence flight, and a further two were rejected past 100 kt.
More broadly, Airbus records show that, of 55 occurrences involving single or multiple unreliable airspeed indications on take-off, 19 (35%) were continued. While there was no data available for 2 (4%) of these, the remainder comprised:
2 (4%) with erroneous airspeed on the integrated standby instrument system (ISIS)
8 (15%) with erroneous airspeed on one of the PFDs
7 (13%) with an audible alert and ECAM message that appeared at 80 kt.
The proportion of take-offs rejected in the high-speed regime (above 100 kt) is not known but these have occurred and add to the proportion of occurrences with undesirable outcomes. Separate data indicates that in the last decade, at least 6 unreliable airspeed indications were not detected until after 100 kt, and 2 of these were not detected until V1.[78] Flight crew responses were mixed, with half of each group rejecting the take-off and the others continuing.
This strongly indicates that in many cases either the erroneous indications were not clear enough to the flight crew or because their decision-making was not optimal. It further suggests an inconsistency in flight crew responses.
Following the two low-speed rejected take-offs due to unreliable airspeed, the AAIB reported (AAIB-2736):
As a precaution, the crews proactively took things a little slower, extended their briefings and placed extra focus on aircraft external checks and cockpit switch selections. They reported that this approach was in line with their company’s “defensive operations” policy which had been implemented as mitigation for reduced pilot recency.
On the other hand, the AAIB also stated:
…one pilot considered that reduced recency had caused them to initially question their fault diagnosis, prompting them to seek additional information before confirming the failure.
Unfortunately, the available occurrence records are not detailed enough to permit a review of the speeds at which flight crews become aware of a problem and evaluate the reasons for their actions. Further study may be beneficial.
Nevertheless, this limited occurrence data indicates that at least a third of erroneous airspeed occurrences result in an undesirable outcome (continued take-off with erroneous airspeed, or rejected take-off at high speed), and that the proportion worsens with the number of erroneous indications. The reasons are currently unclear, as airspeed monitoring—particularly on take-off—is a fundamental and extremely important pilot skill, but likely to involve delayed detection and/or decision-making.
Flight deck indications and flight crew guidance for unreliable airspeed on take-off
The current European Certification Specifications (CS) 25.1322 for transport category aircraft require a warning indication if ‘immediate corrective action is required’, and ‘timely attention-getting cues through at least two different senses by a combination of aural, visual, or tactile indications’ for all warning-level alerts.
This requirement does not apply retroactively and certification of the A330 preceded it. In many situations on take-off, indications of an airspeed problem are only presented visually. Although the condition is likely to require immediate corrective action (on take-off), and the speed flag is red (the colour associated with warning indications), there are no associated audible alerts and the display itself is static, limiting its capability to draw attention (the speed flag also only appears once groundspeed is above 50 kt and does not appear on the ISIS). Similar limitations exist for inconsistent airspeed alert messages, due to the relevant alerts being inhibited during take-off or requiring differences to exist for relatively long periods. It is important to get the crew’s attention when, and only when, an action is necessary to cope with a failure or to cope with a possible future failure (Brière and others 2001).
Recognition of auditory warnings is improved in comparison to visual warnings in situations where the pilot is required to visually attend to more than one thing a time, because the pilot may not be looking in the direction of a visual display (Stevens and others 2006). For this reason, auditory rather than visual warnings are often used to convey information in emergency situations (Doll and Folds, 1986). An auditory warning would have likely gained the PF’s attention in this occurrence, and probably also in other occurrences.
In addition to gaining a flight crew’s attention, alerts can help inform the flight crew of the severity of the situation. Flight crews ‘must be able to differentiate between situations that are detrimental to operational safety, and those that are not’ (Airbus 2014). Orasanu and others (1998) suggest that flight crews might ‘press on’ with an original plan in the face of cues that suggest a change would be warranted, mediated by an underestimation of the risk associated with the problem and a failure to evaluate the possible consequences of continuing or adopting a different course of action. They add that ‘the evidence must be unambiguous and of sufficient weight to prompt a change of plan.’
Decision types fall into two subgroups depending on whether a prescriptive rule exists that defines a situationally appropriate response; if not, the decision primarily relies on the pilot’s knowledge and experience (Orasanu and Fischer 1997). With regard to deciding whether to continue or reject a take-off based on predefined rules, Orasanu and Fischer state:
The crucial aspect of the decision process for rule-based decisions is accurate situation assessment. The major impediment is ambiguity. Such decisions are often made under high time pressure and risk; thus, the [aviation] industry has prescribed appropriate responses to match predictable high-risk conditions. Once the situation is recognized, a fast response may be required for safety.
In other words, there needs to be enough unambiguous information for the flight crew to identify the problem and apply the appropriate rule. Initially, the captain saw indications that might have been unambiguous in the sense that the nature of the problem (absent airspeed indications) was apparent, but the problem itself—not the indication—was ambiguous because there was no prescriptive rule for responding to it. At the time, the optimal response was not clear to the captain. While the captain probably had some appreciation of the importance of the situation when it arose, as indicated by an increased breathing rate, an auditory or otherwise more prominent warning may prompt a more automatic response to reject the take-off immediately.
The flight crew’s situation assessment difficulties continued once the FO became aware of the problem: by this time, the flight crew needed to jointly assess and decide on a problem with outcomes that were both potentially serious now that the aircraft was approaching V1. Any other flight crew who do not observe unreliable airspeed until the 100 kt cross-check would also be in this situation.
Orasanu and Fischer (1997) add:
‘Ill-structured’ problems entail ambiguity, either in the cues that signal the problem or in the available response options. Cues may be sufficiently vague or confusing that the crew cannot identify the problem (‘situational management’ decisions), or crews do not know what to do even if the problem is understood (‘creative problem solving’ required).
In its Safety First magazine, Airbus justifiably suggest rejecting a take-off even when there is a single airspeed indication failure, as long as the aircraft is below the decision speed. In 2021 correspondence with ATSB, Airbus advised that unreliable airspeed should not be a reason for rejecting a take-off above 100 kt. As guidance for responding to unreliable airspeed on take-off is not part of the formal documentation provided to operators, these views may not be universal.
According to the Airbus flight crew techniques manual, a rejected take-off should be seriously considered if any electronic centralised aircraft monitor (ECAM) warning or caution is activated in the low-speed regime (below 100 kt). This emphasis on ECAM warnings and cautions is reinforced by the unreliable airspeed guidance, which states that the air data systems ‘detect most of the failures’ affecting the airspeed indications and that these failures ‘trigger the associated ECAM alerts.’ Thus, a flight crew is, by design, less likely to seriously consider rejecting a take‑off unless presented with an ECAM alert, fire, loss of thrust, or other obvious danger signals.
In the absence of alerts that convey the urgency of a situation as well as its nature, it can take a flight crew several seconds to understand and react—possibly more time than they have, especially if a failure occurs close to or after the decision speed.
A330 flight crews are provided a list of conditions for which they would be expected to reject a take-off after reaching 100 kt:
At these speeds [above 100 kt], the Captain should be “go-minded” and very few situations should lead to the decision to reject the takeoff:
1. Fire warning, or severe damage
2. Sudden loss of engine thrust
3. Malfunctions or conditions that give unambiguous indications that the aircraft will not fly safely
4. Any red ECAM warning
5. Any amber ECAM caution of the ENG [engine] system or the F/CTL [flight control] system.
Although a pilot may not have these specific situations in mind during the take-off, they would likely have a reasonable understanding of the types of failure that should result in a rejected take-off. In addition, any warning received during the period of take-off from 80 kt indicated airspeed ‘must be considered as significant’. Training in rejected take-offs is likely to be predominantly associated with ECAM alerts and engine failures, which provide clear indications and prompts.
While the loss of airspeed indication is hazardous, the manner of its presentation is usually less prominent than other dangers like a fire warning or loss of engine thrust. There is often no ECAM alert or master warning/caution. There may be a discrepancy between multiple indications—an indication that may not be detected by flight crews until the speed check at 100 kt— or sometimes the appearance of a speed flag on the affected display. To a pilot, these may not be ‘unambiguous indications that the aircraft will not fly safely’, especially to those unaware of the manufacturer’s advice to reject the take-off if the crew are confident that the aircraft is below the decision speed.
The list of situations that should result in a rejected take-off did not address airspeed indication failures. There was also no instruction or guidance in the flight manuals on the type or number of unreliable airspeed indications for which a take-off should be rejected, or whether this decision should change if the crew is in doubt over the aircraft’s proximity to the decision speed.
Furthermore, the Unreliable speed indication memory items are not always applicable during take-off: if the airspeed is low enough to safely reject, crews should do so, and if in doubt, application of TOGA thrust is appropriate, but the application of 15° pitch-up too soon would only slow the aircraft’s acceleration.
If a flight crew is uncertain of the aircraft’s airspeed, it would probably be safer to assume the decision speed has been exceeded than to reject a take-off past that speed, but this is not a desirable situation.
In summary, the objective should be for flight crews to detect unreliable airspeed as early as possible in a take-off and to provide them with enough information (at the time and through training) to make an immediate decision in most circumstances. Relying on the 100 kt cross-check may not be sufficient, as it takes the aircraft into the high-speed regime where a rejected take-off is a more significant, and potentially risky, event. The current A330 flight deck indications of unreliable airspeed are not prominent enough to reliably gain a pilot’s immediate attention as well as adequately convey sufficient unambiguous information to allow for quick comprehension of the severity of the problem.
Further, flight crew training and guidance for unreliable airspeed on take-off may not equip them with sufficient knowledge to make a decision in the limited time they have available.
These concerns are not unique to the A330 or Airbus aircraft, and the lessons about flight crew guidance and unreliable airspeed indications are almost certainly relevant to a range of aircraft types. Accordingly, the ATSB encourages all manufacturers of larger air transport aeroplanes to consider what types of unreliable airspeed events can occur, how the information is presented to flight crews, and what responses are the safest in different phases of the take-off and in a range of potential situations. Ultimately there needs to be sufficient assurance that flight crews become aware of and understand how to appropriately respond to unreliable airspeed on take-off in a timely manner.
Flight crew non-technical skills training
The ATSB reviewed past assessments the flight crew had received in non‑technical skills (NTS), such as communication, leadership, assertiveness and receptiveness. Although both pilots required occasional briefings, this did not indicate a history of substandard NTS performance in either pilot.
The NTS grading methodology was also considered. Unlike some other operators, Malaysia Airlines graded flight crew proficiency in NTS separately to technical skills. This approach provides significant advantages over evaluating NTS only as markers for the performance of technical tasks. For example, it provides opportunities for more in‑depth evaluation and feedback of NTS.
However, the use of a 3-point scale for these NTS somewhat limited the operator’s capability to capture slight but important differences in NTS performance between sessions and between pilots. With limited granularity in grading scales, it can be difficult to detect whether an individual’s performance had improved or degraded over time. There is also no visible scope for improvement once a ‘satisfactory’ level is reached: pilots who receive limited feedback about their individual NTS strengths and weaknesses might be less likely to recognise and work on the areas of underperformance and may have less motivation to improve beyond a base level of competency. Furthermore, evaluators may not identify consistently marginal performance.
To address this, Holt and others (2001) suggest using a 4- or 5-point scale for NTS. Similarly, two of the most well-known marker systems are the University of Texas system developed by Robert Helmreich and colleagues (Flin and O’Connor 2001), which uses a 4-point scale, and the NOTECHS (non-technical skills) scheme (Joint Aviation Authorities 1997) using a 5-point scale. Baker and Dismukes (2002) propose enhancing rating accuracy by providing evaluators with NTS performance examples using a 4‑point scale (excellent, standard, debriefed, and repeat).
In flight training, it can be difficult to detect a change in performance or identify when performance is consistently acceptable but not to a high level of proficiency, especially when multiple trainers are involved. Organisations can use standardised NTS assessment guidelines to reduce subjectivity, helping trainers recognise behavioural markers consistently so that they can then address the problem. Doing so successfully requires a mature understanding of the standards by the trainers/assessors and crew, so this level of standardisation needs to be developed over time. If done too early, there can be too much inconsistency in the application of finely-graded standards, making comparison and tracking even less reliable.
Notwithstanding this minor limitation, the Malaysia Airlines method of grading NTS was probably as or more effective than the method used by the majority of other reviewed operators.
Airport operational information
The operator’s flight operations department used the airport operational information (AOI) published by Lido for an assessment of the hazards that existed at Brisbane Airport before services recommenced. The AOI was also used by pilots on an individual basis as airport reference guidance. However, there was no information about the mud wasp activity affecting pitot probes and the recommendation to use pitot probe covers in the AOI when referencing Brisbane Airport.
The absence of relevant hazard information could mean that operators generally might not know about and address important hazards at an organisational level. Additionally, as the use of pitot probe covers in airline operations is primarily a maintenance activity, pilots who are aware of this hazard are more likely to note the presence (or absence) of pitot probe covers, may request them to be fitted, and could be more prepared for the potential for airspeed problems on take-off.
Lido drew on information from the Aeronautical Information Publication (AIP) for inclusion in the AOI. Along with the wasp hazard, other safety-related information in the AIP was absent from the AOI. For example, the AIP stated that various kinds of large bird were active at Brisbane throughout the year but the AOI stated that bird activity was only during part of the year.[79] The Lido AOIs for other selected Australian airports had not reproduced a small number of minor safety-related items, including one military traffic hazard.
Internal Lido guidance for the development of AOI content unambiguously required caution notes for bird and military traffic hazards, and for ‘any kind of dangers officially referenced in source documents’ such as the mud wasp hazard.
The absences led the ATSB to review the Lido process for choosing what types of safety-related information was promulgated in AOI, and how that information was reviewed before publication. No obvious problems were identified with that process or the required expertise of the people involved, and no other reason for the identified absences was established.
However, the ATSB notes that the information contained in the AIP presents safety information that local subject matter experts consider to be important; any process with the potential to alter or omit such information before it is presented to pilots could increase risk.
Risk controls associated with the use of pitot probe covers
Introduction
Pitot probe covers are normally fitted to aircraft when parked overnight or for extended periods. Fitting covers during turnarounds is not common and requires the use of controls to ensure they are removed prior to departure.
During the planning for resumption of flights to Brisbane after a cessation of over 2 years, the operator planned to use pitot probe covers as a risk mitigation strategy for the mud wasp risk at Brisbane Airport. However, a complete strategy for their fitment and removal was not implemented. As a result:
there was no procedure or guidance for front-line personnel (the operator’s engineers and the support engineers) to use pitot probe covers at Brisbane Airport during turnarounds
flight crew and the operator’s engineers were not informed about the mud wasp hazard or the recommended use of pitot probe covers specific to Brisbane Airport
use of pitot probe covers at Brisbane was intermittent, so the operator’s aircraft were often exposed to the potential for pitot probe contamination from mud wasps during turnarounds.
Furthering these problems, engineering arrangements in Brisbane were somewhat unusual: the routine use of a travelling engineer for aircraft certification, who were required to board the same aircraft they were working on before departure. This working environment gave rise to the risk of miscommunication and miscoordination among ground crews, leading to some important tasks being overlooked or incomplete.
A 2009 ATSB report, Ground operations occurrences at Australian airports 1998 to 2008, stated that the relatively low ‘industry-wide attention on risk controls to improve safety in ground operations’ had led to little change in the frequency of adverse ground operations events in Australia over the previous few decades. The report stated:
The most common contributing factor to ground operations occurrences were individual actions. For occurrences between 1998 and 2008, these most frequently involved action errors, where a person deviated either from plans or standard operating procedures. Common examples were towbar connection procedures and pushback errors, like turning back too sharply with the tug and damaging the nose or landing gear of the aircraft. Less frequently, individual action errors were associated with a violation, information, or decision error.
A number of ground crew errors were involved in this occurrence, across a variety of categories. Certain themes underlie some of these errors—at times, some personnel exhibited a lack of diligence, attentiveness, communication, and ownership of important tasks.
However, personal factors were not sufficient to explain why the aircraft was allowed to depart with pitot probe covers fitted. Individual errors and undesirable personal factors are suppressed in a well-defined work environment where individual responsibilities are clear, when tasks do not change hands, and when the practical implications of front-line work have been thoroughly considered. The following sections explore how these errors were allowed to contribute to the occurrence by the environment in which they were made.
Use of pitot probe covers
Fitment of pitot probe covers prior to the flight
Engineering support staff at Brisbane Airport had become accustomed to fitting pitot probe covers to various airlines aircraft, following individual airline requirements, CASA advice, and probably airport advice to a point that it became normalised practice. In the absence of any information to the contrary, the support engineer believed that pitot probe covers were to be fitted to all aircraft during turn arounds in Brisbane, including Malaysia Airlines aircraft.
On the other hand, the Malaysia Airlines LAE knew none of this. Following the fitment of the pitot probe covers, the support engineer reportedly told the LAE that pitot probe covers had been fitted. At that time the LAE did not acknowledge what had been said or make an entry in the technical log as a risk control to ensure the pitot probe covers were removed before flight. The LAE did not later recall being informed of the pitot probe covers by the support engineer and likely did not hear or assimilate the information.
The use of closed-loop communication—seeking, receiving, and understanding an acknowledgement—is a way to ensure effective communication and has been found to reduce error (Foushee and Manos 1981). In this case, the support engineer did not receive or seek confirmation that the message about pitot probe covers was understood.
Furthermore, the support engineer was not permitted to enter the details of the fitment of pitot probe covers into the aircraft’s technical log and did not press the issue after seeing that the LAE did not do so. The support engineer may not have seen it as a sign that the LAE did not hear the support engineer’s statement.
As there was no technical log entry, there was no prompt for the LAE or flight crew to recall the presence or confirm the absence of pitot probe covers when the log was later checked.
The support engineer was needed for the removal of the pitot probe covers before dispatch, either to do so personally or escort the LAE for security purposes. However, it is unlikely that the support engineer thought about the practicalities of removal at the time the covers were fitted, or when deciding to work with another aircraft for a while. The support engineer likely forgot about the need to remove the covers.
The support engineer then left the aircraft to work on another aircraft. This made it less likely that the support engineer would recall the presence of pitot probe covers later (having moved onto other tasks) and removed any opportunity of seeing them during incidental activities around the aircraft. In effect, the support engineer tacitly passed responsibility for the covers onto the LAE, who had not accepted that responsibility.
Fitment of pitot probe covers on other occasions
In the absence of guidance from Malaysia Airlines or written procedures from AMSA, the use of pitot probe covers for the operator’s aircraft was inconsistent. Pitot probe covers were used for 3 out of 19 turnarounds prior to the occurrence for which technical logs were available (it is possible, though not highly likely, that pitot probe covers had been used on other occasions without a technical log entry being made).
Since AMSA engineers were not controlling or conducting all of the engineering activities, the use of pitot probe covers increased the likelihood of miscommunication or error because it split responsibility for the task between the AMSA engineers (who supplied and fitted pitot probe covers but could not make technical log entries) and the Malaysia Airlines engineers (who had limited awareness of the need for pitot probe covers at Brisbane).
Pre-flight walk-arounds
Introduction
There were effectively five walk-around checks required between the aircraft’s arrival and its dispatch, four of which did or should have taken place during the period in which the pitot probe covers were fitted. These were the:
engineering maintenance walk-around inspection
flight crew walk-around
engineering pre-departure walk-around inspection
dispatch walk-around.
The procedures specifically included checks of the pitot probes and should have presented multiple opportunities for the covers to be detected and removed, in addition to incidental opportunities during general ground activities. In each case, individual errors and violations prevented the detection and removal of the pitot probe covers.
Engineering maintenance walk-around inspection
While conducting the first part of the transit check the LAE saw that the pitot probe covers were fitted to the aircraft. According to the LAE, this was unexpected as they were not aware of any instances where pitot probe covers were required to be fitted during turn arounds and they had not been informed of any requirement to fit pitot probe covers in Brisbane. The LAE intended to ask the support engineer to remove them. However, the support engineer was not nearby at that time so the LAE decided to continue with the transit check tasks. Subsequently the LAE did not remember to request the removal of the pitot probe covers when the support engineer returned to the aircraft a few minutes later. Any reasons why the LAE did not remove them personally were not explored.
Prospective memory is the suspending or deferring of a task with the intention to return to it later or forming an intention to add a new task at a later time. A failure of prospective memory has occurred when a person does not return to complete the task as intended. Prospective memory failures often occur with tasks that are not habitually performed (Dismukes 2008). In this case, the LAE did not routinely use or need to remove pitot probe covers, and never used them during turnarounds.
Another reason why people forget to complete tasks as intended is the absence of reminder cues (Dismukes 2012, Reason 2016). There were no cues that may have prompted the LAE’s memory. The continuing presence of the pitot probe covers went unnoticed, likely because the LAE was working elsewhere or because the streamers were outside of the LAE’s immediate vision, the matter was not brought up in later discussions with the support engineer and flight crew, and there was no entry in the aircraft’s technical log that was required to be cleared when the LAE certified for the transit check.
Engineering pre-departure walk-around inspection
The pre-departure walk-around inspection (required as part of an engineer’s transit check) and dispatch walk-around (required to be conducted by the person conducting dispatch duties) have a similar purpose: to check the aircraft for any damage that may have occurred while on the ground, and to ensure that the aircraft is correctly configured for flight – for example, that doors and panels have been secured, any pins, blanks and covers have been removed, and that the aircraft is clear of equipment.
Although the engineers and ground handlers were both required to perform separate final walk-arounds, only one walk-around is required in cases when engineering and dispatch duties are conducted by the same engineer. That is, the general airworthiness functions of the check can be combined with the check of the aircraft’s readiness for flight. Accordingly, there is often only one ‘last’ opportunity to identify any problems with the aircraft before it departs, such as unlatched doors or the presence of pitot probe covers. In this case, the operator’s arrangements meant that both checks were required.
The LAE did not conduct a pre-departure walk-around inspection, which might have prompted a recall of the presence of pitot probe covers. The LAE had not conducted the required pre-departure walk-around inspection for the previous turnaround either, even though they were not travelling on that flight.
The LAE, not having been informed of how responsibilities were to be shared, assumed that the support engineer would conduct the pre-departure walk-around, without confirming that was the case. The LAE was not aware that the ground handling organisation was conducting dispatch coordination duties, so was not aware that the support engineer was not responsible for a pre-departure walk-around inspection and was not required to stay with the aircraft until dispatched. Without this knowledge it is likely that the LAE did not see a need to tell the support engineer to perform a pre-departure walk-around, reportedly assuming that it was part of the support engineer’s responsibilities. It is unclear whether the LAE was aware that the other AMSA engineer on the previous turnaround also did not perform a pre-departure walk-around.
Meanwhile, the support engineer’s understood function was only to assist the LAE as instructed, and to provide access to, and escort the LAE around the tarmac. The support engineer was free to leave once the LAE advised that there were no further tasks.
Therefore, both engineers had different understandings of their respective roles with regard to this check. They did not confirm their responsibilities or intentions with each other or challenge their individual assumptions.
They were placed in this position by engineering arrangements that were unusual by most standards but had become routine in Brisbane. On every second turnaround, the operator required an LAE to conduct a transit check and board the same aircraft for the return flight. Thus, the LAE was required to board the aircraft before the final check of the aircraft’s readiness for flight and could not check for security of the cargo and passenger doors. This meant that the transit check could only be completed in its entirety with the support engineer performing the last few steps, which probably contributed to the LAE’s assumption that the support engineer would conduct a final walk-around.
The LAE boarded the aircraft about 36 minutes before the aircraft was dispatched following the completion of aircraft refuelling, citing the need to board the aircraft before its international flight. While this reasoning is understandable, there was no compelling reason for the LAE not to perform a partial check of the aircraft’s readiness for flight during this period, omitting a small number of items like the cargo and passenger doors. This could also have been done alongside the captain during the flight crew walk-around.
Had the LAE conducted a final walk-around, they most likely would have seen the pitot probe covers again and removed them or had them removed, as the aircraft was close to being dispatched.
More generally, in the absence of any other agreements or guidance, AMSA engineers would no longer be directly responsible for the dispatch walk-around, and there was no explicit requirement for them remain with the aircraft until pushback. This indirectly led to the omission of the engineering pre-departure walk-around inspection, which engineers would normally combine with the dispatch walk-around, but now there was a situation where both engineers might not (and did not) realise that the engineering inspection was not done.
Flight crew pre-flight walk-around check
The brief amount of time the captain’s torch dwelled over the pitot probe, and the omission of other check items of the walk-around, are strongly indicative of reduced attention in general. During the walk-around, the captain briefly shone the torch on one of the aircraft’s left pitot probes, which had covers fitted at the time. The captain did not recall the presence of the pitot probe covers when interviewed after the occurrence, and likely overlooked them partly as a result of this reduced attention.
Research in visual attention found that people rarely cognitively perceive what they are looking at unless their attention is directed to it in a phenomenon sometimes known as ‘inattentional blindness’ (Mack 2003). The conduct of the captain’s walk-around reduced the likelihood that abnormalities would be noticed.
Another factor that is likely to be involved is expectation. Expectation has an influence on perception: people see what they expect to see (Hawkins 1987). The operator had not advised flight crews of the mud wasp risk or the use of pitot probe covers and, in part due to the absence of a warning in the Lido airport information, the captain was not aware of the mud wasp activity and requirements to fit pitot probe covers at Brisbane.
Expectation is influenced by how frequently a person had previously encountered an item (Wolfe and others 2013). The captain reported never seeing pitot probe covers during previous walk‑arounds and likely did not expect to see them on the aircraft in Brisbane.
Flight crew and engineer walk-arounds for other flights
While the need to board the aircraft may have distracted the LAE to some extent, the same LAE did not need to board the flight on the previous evening, yet had not conducted a final walk-around on that occasion either. The same is true of the previous LAE, who had worked the preceding two turnarounds. From the video evidence available, in total, both LAEs omitted the required engineering pre-departure walk-around inspection on all of the 4 turnarounds, including both occasions when they were not required to board the aircraft. Further, two of the transit checks overall were of a very short duration and did not inspect all key areas required.
Similarly, the captain’s walk-around was only partially completed, while one other pilot omitted the flight crew walk-around completely. Of the four flight crew walk-arounds that were required, only two were likely to have been completed in full to the standard required by procedure.
The operator’s use of the term ‘cursory’ to describe the required flight crew walk-around is not appropriate for a task of this level of importance. The Macquarie Dictionary defines ‘cursory’ as ‘going rapidly over something, without noticing details; hasty; superficial’. Although performing the task rapidly is not inherently problematic, it is very important for a flight crew to notice details and avoid being hasty or superficial. However, while the captain chose the same word in interview to describe the required walk-around, it is uncertain whether this choice of term affected the captain’s attitude towards this task.
While individual factors were likely involved, the high incidence of incomplete or absent walk-arounds from the operator’s engineer and flight crews may be indicative of a systemic, cultural issue, possibly that of a casual approach to these important tasks.
Walk-arounds need to be completed in full and with careful diligence. Each one needs to be conducted with the mindset that it may be the sole opportunity to detect damage or other irregularities and confirm the aircraft’s readiness for flight. The ATSB has investigated recent occurrences where serious damage was not detected despite multiple routine walk-around visual inspections by flight crew and engineers. These include tail damage to an ATR-72,[80] and engine nacelle damage to a Boeing 737.[81]
Dispatch coordinator walk-around
In Brisbane, Menzies did not typically perform dispatch duties or the associated dispatch walk-arounds, but ground handling staff received training and guidance appropriate to the duty. There were procedures that required the dispatch walk-around to be undertaken, specifically identifying pitot probes as an item to check. Accordingly, had a walk-around been done, the presence of the pitot probe covers was likely to have been identified.
The leading hand stated that they did not do a dispatch walk-around because they did not have headset duties for that aircraft, as that responsibility had been handed over to another ground handler who was called to assist in the final minutes before departure. The other ground handler who was called to assist with the dispatch stated that they believed the leading hand had already done a walk-around as the aircraft appeared to be ready for dispatch.
Regardless of whether the leading hand was qualified to perform the dispatch, the leading hand and dispatch coordinator were both aware of the need to conduct a dispatch walk-around. The leading hand, who would have known that it had not been done, did not do it personally or tell the dispatch coordinator that one was needed. Having remained in the area after handing over dispatch duties, it would have been readily apparent to the leading hand that the dispatch coordinator did not perform a walk-around. The dispatch coordinator, who held primary responsibility for the task, may have assumed that it had been done but did not check, and could have done it if there was any doubt. The omission of this walk-around was therefore probably the result of a combination of individual violations and poor communication.
Menzies stated that operator-specific training was delivered to line personnel in June 2018, and the occurrence leading hand thought that it was required to be able to conduct dispatch coordination of Malaysia Airlines aircraft. However, Menzies did not have records of this training being required or delivered, and neither of the occurrence Menzies staff recalled having received it.
The level of non-compliance for walk-arounds of Malaysia Airlines aircraft in July 2018 (2 absent and 2 partial walk-arounds out of 8) is indicative of a non-compliance rate that should be detectable through observation audits, particularly those that assess multiple elements of the activity as Menzies did. However, Menzies audits over two separate 9-month periods in 2018 and 2019 showed 100% compliance with assessed elements of the 544 required dispatch walk‑arounds, and a 99.2% compliance rate for the less safety-critical arrival walk-arounds (one non‑compliance out of 122).
It is unlikely that there were confounding factors related to the arrangements with Malaysia Airlines, as both relevant personnel were aware of the need to conduct walk-arounds when coordinating dispatch. Further, the requirement for arrival walk-arounds was not dependent on the operator but the conduct of arrival walk-arounds was similarly inconsistent.
While a high compliance rate is desirable, the assessed 100% compliance does not reflect actual compliance from the small sample assessed by the ATSB using video recordings. Such a mismatch between audited and actual compliance may indicate problems related to the manner in which the audits were conducted (for example, the auditing process being visible and inadvertently encouraging adherence) or non-compliance with the audit process itself (such as elements being marked as correctly completed when they were not observed).
Tool control
The undetected presence of a foreign object on an aircraft could potentially compromise flight safety or cause damage. For this reason, tools used for maintenance and ground handling of aircraft requires formal and informal controls to ensure they have been accounted for prior to flight. ATSB (2009) found that about 19% of foreign object damage (FOD) occurrences were from tools and equipment and:
The most common factor that contributed to FOD occurrences was individual actions relating to aircraft maintenance. These included replacing, repairing, and installing aircraft components, and the use and removal of tools and personal items from aircraft prior to the issue of a maintenance release or aircraft dispatch.
The primary function of tool control is to prevent tooling remaining on board (or fitted to) an aircraft prior to its departure. Its secondary function is to account for tooling as an asset. With the provision of a non-certifying engineer (AME) to assist Malaysia Airlines turnarounds, the relevant AMSA tool control requirements were not a reliable means to account for tooling (such as pitot probe covers) prior to aircraft dispatch. This was because the procedural checks were to be carried out when returning the tooling after the aircraft had departed and at the end of a shift, rather than prior to aircraft dispatch as licensed aircraft maintenance engineers (LAMEs) were required to do. This requirement was not relevant in this case, as the AME was in a non-certifying role. In addition, the existing controls were further degraded by the local practice whereby pitot probe covers, and other equipment were drawn from their storage location without being recorded.
Reliance on the technical log alone introduces practical considerations: either the LAME removes pitot probe covers sooner than strictly necessary, which would leave the probes vulnerable to insect contamination, or certifies for an aircraft with the covers still fitted with the intention to remove them later, which introduces the potential for error.
Gear pins and covers check
The Preliminary cockpit preparation procedure required flight crews to conduct a ‘pins and covers check’—that is, landing gear pins and pitot probe covers. When only this equipment is used for the aircraft, this check helps flight crews to ensure that the pins and covers would not be fitted at the time of departure.
However, Malaysia Airlines did not routinely carry pitot probe covers as part of the aircraft’s standard equipment, but retained the check for pitot probe covers. Because of this, flight crews would become accustomed to pitot probe covers being absent from the check, making the check ineffective for these items because others would have to be used. This was likely the case in this occurrence.
It was not possible to determine whether the captain physically checked for the presence of pitot probe covers in the flight deck compartment as required. Nevertheless, had they done so, they would have expected to find only landing gear pins because pitot probe covers were not routinely carried on the operator’s aircraft.
Procedural problems such as this can arise from conducting operations in a different way than originally intended, if there is insufficient consideration of how the change can affect the way procedures are carried out. The resulting inconsistencies can lead to an automatic prompt-and-response rather than actual verification that the check had occurred and affect flight crew perceptions of procedures in general.
Pitot probe cover characteristics
The pitot probe covers were fitted to the aircraft for most of the time that it was on the ground. Over much of this period, their presence would not necessarily be notable to people working in the area because they are not important at that time. However, in the short period leading up to pushback and taxi, ground crews begin to think in terms of the aircraft’s immediate readiness for flight, including whether the doors and panels are closed, whether ground equipment is still attached, and so on. If there is something preventing the aircraft’s readiness for flight, it needs to be resolved.
The main purpose of ‘remove before flight’ streamers is to create this awareness: if a person were to check for the presence of pitot probe covers or a landing gear pin, their attention is drawn to the required item by the checklist they are following, and a streamer simply helps them to find it. On the other hand, the streamers are used to draw attention at times when a person is not specifically looking for that item. In other words, the streamers exist to improve the likelihood of incidental—not purposeful—detection.
Therefore, while it is not surprising that the ground crews did not notice or act on the presence of the pitot probe covers during the majority of the turnaround, it is notable that several of them (all of whom would almost certainly be aware of the importance of a streamer marked ‘remove before flight’) apparently overlooked their presence in the immediate period before, during, and after pushback. For example, the leading hand was looking in that direction just before pushback, and the dispatch coordinator was looking in that direction when showing the flight crew the nose gear steering pin after the tug was disconnected.
While it is not clear whether the ground crews were paying much attention to the aircraft itself through this period, it is apparent that the pitot probe covers and streamers did not gain their attention, either from nearby (being well above normal eye height) or from a short distance (when they fill much less of an observer’s field of view).
The purpose of a ‘remove before flight’ streamer, attached to an item of ground support equipment such as a pitot probe cover, is to gain the attention of someone who is not primarily looking for the equipment.
A number of characteristics contribute to the conspicuity of streamers. Red streamers can provide effective contrast against a white fuselage in good light but may not be as attention-attracting in poor lighting such as night, especially when they are dirty. Reflective materials may be helpful at night.
Another factor is length. The streamers attached to the pitot probe covers provided by AMSA were about 60% the total length of lanyards and streamers attached to other covers approved by the aircraft manufacturer and used by Malaysia Airlines. Shorter streamers are less likely to draw a person’s attention when in their visual field even if they are not paying particular attention to that area.
A longer streamer, or one with a lanyard, is more likely to move if wind is present. In general, a human’s perceptual system is sensitive to motion, particularly in their peripheral vision (McKee and Nakayama 1984; Wickens and others 2013). However, it has been reported that the greater force on longer streamers in strong winds can occasionally drag the covers off. Operators need to balance the likelihood of this occurring against the need to ensure their removal before flight through the use of longer streamers.
Larger aircraft such as the A330 have pitot probes that are well above eye height and therefore often out of sight or in the peripheral vision of people working nearby. People are not effective at perceiving details in the peripheral vision (Proctor and Proctor 2012). With such aircraft, a longer streamer and/or lanyard would enter their field of vision more often, increasing the likelihood of being noticed during normal activities.
The limited conspicuity of the pitot probe covers used on the occurrence aircraft reduced the likelihood of incidental detection of the covers, which is important during turnarounds. Pitot probe covers are frequently used when aircraft undergo deeper maintenance or are parked or stored for an extended period, where their use is routine and there is ample opportunity to detect them once an aircraft is to be released to service. On the other hand, there are increased time pressures and fewer opportunities for their removal during turnarounds. However, there are incidental opportunities that arise for ground crews to notice pitot probe covers while doing unrelated tasks such as attaching a tug and pushing the aircraft back, and the likelihood of this incidental detection is increased with the use of larger or brighter streamers.
Operator port induction for Brisbane
Application of engineering functions in practice
A standard ground handling agreement for AMSA to perform all technical handling functions was completed on the day of the occurrence. However, the arrangements for Malaysia Airlines to perform and control the technical handling functions with assistance from AMSA continued in practice, so the terms of the agreement probably did not have any substantial effect on the night of the occurrence. The operator’s interim arrangement of having a travelling LAE assisted by a local engineer was probably associated with being unable to obtain the required approvals in a short period of time.
Although there were no settled agreements between the organisations, line personnel and their immediate managers did appear to have a clear understanding of their broad roles, including which people were responsible for engineering certification (the LAE) and dispatch coordination (Menzies staff).
However, the interim arrangement changed the way engineering functions were carried out compared with normal operations. In particular, the operator did not appear to recognise that the LAEs would be likely to feel higher time pressures than usual, due to the need to board the aircraft for flight, and could not in practice perform the engineering pre-departure walk-around inspection because the aircraft doors had to be closed and then checked from outside.
This demanded a higher level of improvisation, communication, and coordination than usual, during every turnaround, and contributed to a working environment in which errors were less likely to be caught.
Dispatch coordination
Although an agreement for Menzies to provide dispatch coordination had been drafted about 2 weeks before the resumption of flights, the operator only delivered a course to Menzies instructors for dispatch coordination a few hours before operations were to resume. This increased the risk of underqualified staff being rostered had there been important safety elements to convey.
Separately, although using ground handlers and not engineers to perform dispatch coordination should not inherently carry any additional risk, an engineer is more likely to identify things that could affect the safety of flight (such as the presence of pitot probe covers during pushback) and is more likely to remember any incomplete tasks when staying involved in the turnaround operation until the end. An engineer also has a deeper level of understanding about the requirements for safety of flight (including the importance of pitot probes) and is therefore more likely to identify less-obvious problems.
Finally, in this case, using an engineer for dispatch coordination would have been one way to overcome the problem of how the engineering pre-departure walk-around inspection could be done in practice. Task analysis activities can also help identify these types of problems. This involves breaking a task (such as managing a turnaround) into progressively smaller tasks and considering variables that may impact the completion of certain steps. For example, by considering each step that each person must complete during a turnaround with the arrangements in place at Brisbane, it may become clear that the LAE would not be able to finalise the transit check from on board the aircraft. The process can then be changed to prevent this situation from arising.
Continuation of operations without firm arrangements
The Malaysia Airlines investigation report stated that the ground service arrangements had substantially changed in the days before the resumption of Brisbane flights, but in terms of dispatch coordination this was not corroborated by other evidence such as the draft agreement for Menzies to perform dispatch coordination signed by the operator 2 weeks beforehand. Furthermore, had AMSA withdrawn from an agreement to conduct engineering certification, the short-term situation remained the same because regulatory approval was still pending.
Regardless of whether a late change actually did occur, other records indicate that some of the key activities required for the recommencement of Brisbane operations were conducted shortly before, and sometimes after, flights had resumed. Specifically:
a risk assessment had been performed less than 2 weeks previously, leaving little time to approve and implement mitigation strategies
long-term engineering arrangements had not been finalised, with an agreement with AMSA not yet being signed by either party (and possibly not yet drafted)
there was no regulatory approval for AMSA to perform aircraft certification (likely requiring Malaysia Airlines to make interim arrangements with a travelling engineer and local support engineer)
long-term ground handling arrangements had not been finalised, with two agreements being Menzies were drafted and signed by the operator (one on the same day as the first flight) but not finalised by Menzies
training had only been provided to Menzies trainers on the day that flights resumed, and there was uncertainty around whether that training was required to be—or actually—provided to Menzies front-line personnel.
In total, while line personnel might not generally be aware of the broader organisational picture, details about operational implementation of contractual agreements do filter through, and there was an unusually high level of vagueness how all turnaround tasks would be performed in practice.
When working in an established role in a consistent way, people develop personal practices and habits that generally reduce the incidence of error. When an unusual situation arises, as is common in the ramp environment, it is necessary to rely on the initiative, knowledge and skills of individuals. No process can address every potential situation. However, relying on individuals increases the risk of individual error, so relying heavily on individuals who are largely working outside defined procedure should not become the norm.
In this case the engineers and dispatch coordinators were required to perform their roles in a different way to how they were accustomed. For example, there was also overlap in specific services that were agreed with both providers; for example, the agreements with both providers included dispatch coordination. Although in practice there was no apparent uncertainty about this particular function, this type of inconsistency can sometimes translate to misunderstandings about roles and responsibilities among line personnel, particularly when arrangements change or the individuals are performing tasks to which they are not accustomed.
Although this problem is foreseeable, it can be easily overlooked. A broadly similar problem with communication and coordination resulted in an uncommanded aircraft movement during pushback in 2016, resulting in aircraft damage.[82]The use of specialised methods (such as task analysis) can help identify this kind of risk. Also, the ICAO Safety Management Manual suggested joint hazard-identification activities guidance on hazard identification when working with other organisations:
Organizations should also identify hazards related to their safety management interfaces. This should, where possible, be carried out as a joint exercise with the interfacing organizations. The hazard identification should consider the operational environment and the various organizational capabilities (people, processes, technologies) which could contribute to the safe delivery of the service or product’s availability, functionality or performance.
As an example, an aircraft turnaround involves many organizations and operational personnel all working in and around the aircraft. There are likely to be hazards related to the interfaces between operational personnel, their equipment and the coordination of the turnaround activity.
Airlines world-wide have an increasing reliance on external engineering and ground handling support services. Therefore, it is of vital importance that there are clear lines of communication, procedures, and standards in place between all parties involved to ensure that tasks are implemented and undertaken correctly. This necessitates thorough planning, initiated early, with check points along the way to ensure that the implementation is on track.
Limitations of the risk assessment
The risk assessment for the resumption of Brisbane operations had numerous problems that reduced its effectiveness. For example, where controls changed a risk category or posed other risks (for example, using pitot probe covers), these effects were not fully recorded or explored. The ICAO Safety Management Manual stated:
A determination of any unintended consequences, particularly the introduction of new hazards, should be made prior to the implementation of any safety risk controls.
The risk assessment had limited or absent categorisation of risk, which meant that compound risks—those where the hazard can have multiple effects—were not fully explored. This can result in misconception of the risk. For example, the use of pitot probe covers may present a risk to safety of flight (through being left on) and customer service (through delays) if their use is not well-managed. Treating one risk may result in the other being overlooked, depending on the chosen risk controls. By specifying each category of risk and treating them separately, the identified risk controls can then have adequate coverage of the potential undesired outcomes and aid the prioritisation and allocation of resources.
The assessment also obscured the distinction between existing and additional risk controls. That is, future activities were listed as existing controls, and prospective assurances from third parties, which do not necessarily translate to actual activities, were listed as though they had a direct effect on risk. Also, additional controls were sometimes rewordings of existing controls or stating how they were to be achieved, which does not have any additional effect on risk. Therefore, risk could not be reduced by the stated controls.
Furthermore, the risk assessment contained a number of errors, most notably that four of the residual risk entries were erroneously recorded as ‘low’ instead of ‘medium’ (possibly as the result of a data entry error). This, in part, allowed the operator’s review and assurance processes to be bypassed, as will be explained in Limitations of operator change and risk management processes, below. In essence, a mistake allowed it to bypass a means for detecting mistakes.
Overall, these problems with the risk assessment approach—the lack of outside involvement, absence of consideration of introduced risk, limited categorisation, incorrect use of controls, and errors—negated its value. The E&M and flight operations departments were probably not involved in the risk assessment, and did not perform or record a separate risk assessment. The absence of this specialist input increased the likelihood of certain risks being overlooked or underestimated.
Non-implementation of risk controls
Although the risk assessment for the recommencement of services into Brisbane was conducted less than two weeks before operations resumed, the risk assessment identified generally appropriate safety risks, including the mud wasp hazard, and the need for appropriate risk controls. Although this was late in the planning process, there was no evidence whether the limited time prevented implementation of the identified risk controls (as the operator had not previously used pitot probe covers at Brisbane, this was not just a matter of reactivating existing controls).
The Malaysia Airlines airport services (AS) department, which held overall responsibility for the planning and implementation of the resumed service to Brisbane, conducted the risk assessment without apparent involvement from other relevant departments. This probably limited the quality of the risk assessment, particularly regarding the identification of hazards and the evaluation of risk control practicality and effectiveness.
In particular, within the scope of the change management process, the flight operations department was not appraised of the assessment of the mud wasp risk or the proposed use of pitot probe covers. Therefore, subject matter experts therein had no prompt to manage the potential effects of the hazard or control on the safety of flight from a flight operations perspective.
The engineering and maintenance (E&M) department was reportedly informed of the need to implement certain risk controls, including a checklist for the installation and removal of the pitot probe covers during transit at Brisbane Airport. No such checklist or similar process was developed for reasons that could not be fully established.
Although the operator had high-level processes for tracking implementation of risk controls and other actions, the processes permitted some risks to be managed at a departmental level, which occurred in this case. The AS and E&M departments probably had informal risk management processes, and ultimately, it appears that individuals within those departments did not follow up on the identified actions. It is likely that, in the absence of formal action tracking, a combination of individual errors led to the required control not being implemented and the issue not being finalised.
In addition, the risk assessment was approved by the regional AS department head, which was one level below the required approval level required by the corporate safety management manual (CSMM). There was no evidence to evaluate whether this had an impact on the quality of the assessment.
Promulgation of safety information regarding the wasp hazard at Brisbane
It was reported that the Malaysia Airlines flight operations assessors planning for the resumption of Brisbane operations were not aware of the mud wasp hazard at Brisbane. This was due to the relevant information not being included in the airport operational information used by Malaysia Airlines. Additionally, there was no formal process to monitor relevant safety information from foreign regulators to ensure that it reached the appropriate people. Some flight operations staff had obtained the airworthiness bulletin about mud wasps at Brisbane, but this information did not reach the individuals responsible for assessing the port safety from a flight operations perspective.
As a result, the flight operations department did not perform a risk assessment for the hazard, so there were no Brisbane-specific flight operations risk controls in place such as measures to advise flight crews of the increased risk of erroneous airspeed (either due to mud wasp nesting or pitot probe covers remaining fitted) or of the use of pitot probe covers to provide an expectation for them during walk-arounds.
Separately, the operator’s airport services (AS) and engineering and maintenance (E&M) departments became aware of the mud wasp hazard at Brisbane through advice from the local service providers as part of a broader port assessment process. However, there was no strategy to control the fitment and removal of pitot probe covers, which increased both the risk of mud wasp infestation (since they were only sometimes fitted) and the risk of non-removal of pitot probe covers when they were used.
Had a strategy been in place, it is likely that the flight crews and engineers would have been informed about the use of pitot probe covers at Brisbane and been more likely to notice or remember their presence. It would have also been more likely to result in improved coordination about their use between Malaysia Airlines and AMSA engineers.
On a separate but related note, the agreements (once settled) between Malaysia Airlines and the two ground services providers did not explicitly state whether the available services would always, or only sometimes, be applied. Most relevantly, the agreements requiring the provision of pitot probe covers did not include information about when their fitment was expected: on every turnaround, if an aircraft is to be parked for a period of days, or some other condition. It is feasible that two organisations could pass different interpretations of the requirement onto line personnel, increasing the likelihood of miscoordination or miscommunication on the ground.
Limitations of operator change and risk management processes
Introduction
The operator had multiple pathways, including risk management processes and change management processes, for significant operational risks to be (a) brought to the attention of relevant departments and (b) to be managed and tracked at a higher level. According to these processes, risks that could not or should not be managed within one department were meant to be brought to the attention of senior managers at safety risk assessment team (SRAT) meetings. In principle these processes should be sufficient to manage risk.
However, the SRAT was not notified of the resumption of Brisbane operations. This was due, in part, to a combination of problems in the relevant processes, allowing the circumvention of broader risk and change management pathways that would normally involve the SRAT in the management of significant changes and risks. This meant the opportunity to strengthen the risk assessment through peer review and oversight was lost. There was no opportunity for stakeholders to learn of the risk and help manage it effectively, including the use of the SRAT’s formal risk management records.
Stakeholder involvement in change and risk management processes
First, the corporate safety management manual (CSMM) required significant changes to be notified to the SRAT, and the resumption of Brisbane operations after a 3-year cessation clearly fell under several of the applicable criteria. The reasons for the change not being tabled (even though preparations were underway) are unclear, although re‑establishing a route to an established international airport may not have been seen as a high-risk enterprise.
There was representation of various departments at the SRAT, as well as nominated accountable persons, increasing the likelihood that important changes and risks would be raised at that forum if the other processes had not done so. However, accountable representatives of the various departments were only intermittently present at the SRAT meetings held during the relevant period. In particular, the accountable person for the AS department (the department responsible for managing the change) was absent from all those meetings, which placed higher dependence on the alternate representatives. These representatives attended only 3 meetings and did not table the change at these meetings, or table the risks associated with the change at the next meeting after the risk assessment was done.
Given the involvement of other departments in the actual activity of planning the resumption of services to Brisbane, it is highly likely that there was wider awareness of the change across the SRAT, and yet the SRAT as a group did not proactively identify it as a change that needed its attention.
In addition, according to the operator’s processes, the SRAT would only become involved in the risk management process for higher-level risks. While this is a reasonable (and common) provision to limit the number of less-important risks that the SRAT had to manage, the risk management process did not require any level of review or stakeholder involvement to identify problems with a risk assessment, such as if the assessor does not identify all relevant risks, underestimates risks, overestimates the effectiveness of controls, or makes other errors in the assessment.
The ICAO Safety Management Manual states:
It is important to involve the “end users” and subject matter experts in determining appropriate safety risk controls. Ensuring the right people are involved will maximize the practicality of safety risk chosen mitigations.
In this case, subject matter experts and key stakeholders in associated disciplines (especially flight operations and engineering) were not involved in the process of assessing the safety risk and the identification of effective controls, and the wider group (with established processes) was not used for assurance and oversight of the implementation of risk controls. Management of safety risk could therefore, in some circumstances, be left to one person.
This meant that there was a likelihood of the change initiator having an incomplete picture of risk, and that identified controls could not be checked for validity and effectiveness by the people responsible for implementing them.
Potential for process misinterpretation and non-registration of risk controls
The second problem was related to the change and risk management processes both allowing an interpretation that permitted risks to be managed by the responsible department alone if the risks could be reduced to ‘low’ after applying risk controls. In this case, through the change management process, Malaysia Airlines identified seven risks that were rated as ‘medium’ initially, and then reduced to a ‘low’ residual risk through proposed risk controls. That assessment was flawed, as discussed previously, but this may also explain why the risks were not raised at the next SRAT after the risk assessment: the assessor may have thought it meant ‘low’ residual risks did not need further attention.
This may have been partly because the risk management process used a flowchart for the safety investigation process (Figure 49). This was specific to the safety reporting process, but it was used as the generic process for all other risk assessments. This required a substantial amount of interpretation by the user because several of its elements were only applicable to the safety reporting process and subsequent investigation.
Figure 49: Part of the operator’s safety risk management process, annotated
Source: Malaysia Airlines, annotated by the ATSB
From a safety investigation perspective, the ‘risk?’ decision point clearly referred to initial risk, because this part of the process would come before the investigation and identification of additional risk controls. However, from the perspective of a person applying the flowchart to risks identified by a change management process, the distinction between initial and residual risk is less clear. That is, the process did not clearly state whether the ‘risk?’ decision point should be based on initial or residual risk.
The flowchart had a decision point marked ‘Investigate?’ for risks assessed as ‘low’, which led to no further action if the assessor answered ‘no.’ This decision point was appropriate for the safety report investigation process but was not fully applicable to change-oriented risks. There was no guidance about how to make this decision, and a person could reasonably think that there was no need to ‘investigate’ if they felt they had the required knowledge at hand and was unaware of any errors in the assessment.
Separately, the change management process had a similar potential for misinterpretation (Figure 50). The intention of the flowchart appears to have been to:
prompt a risk assessment
prompt a mitigation plan and registration of controls if the initial risk was not acceptable
enable the implementation of a change if the initial (untreated) or residual (treated) risk was acceptable (the pathways leading to ‘Implement Change’).
Figure 50: Operator’s change management process flowchart, annotated
Source: Malaysia Airlines, annotated by the ATSB
However, the flowchart may have unintentionally allowed the implementation of change based only on the residual (treated) risk in the following manner. A person conducting the assessment was prompted to propose risk controls when using either of the available risk assessment forms (the change management form or the risk assessment record form) as part of the ‘Risk Assessment’ step. This assessment would produce both an initial risk and a residual risk. There was no guidance on which of these should be used for the ‘Risk Acceptable?’ decision, allowing ‘low’ residual risks to be accepted without review even if the initial risk was moderate or above as the process probably intended. In fact, the pathway shown in Figure 50 was applied during the assessment for the resumption of Brisbane flights, although it is unclear whether the above reasoning was used in this instance.
The risk controls identified during this process reduced the risk from a level requiring mitigation and ongoing monitoring to a level that did not, but did so only nominally. If following the illustrated pathways, the risk and change management flowcharts only required existing risk controls to be registered, not new controls. As a result, there was limited assurance that the assessed reduction in risk actually took place. If the risk controls were ineffective, not implemented, or introduced other risks—all of which occurred in this instance—then the actual risk could be higher than estimated.
Other limitations of the change management process
The resumption of Brisbane services was correctly treated as a change in accordance with the CSMM (with the exception that it was not notified to the SRAT). However, there were limited records of the planning and conduct of the change, indicating that a complete change management process may not have been followed.
Change management is an important element of a safety management system. The operator’s change management process and guidance overall was very limited and omitted many key elements of an effective process, including requirements to:
plan the change
identify stakeholders and assign responsibilities
document the change (such as through a change control register)
categorise the change (enabling tailoring of the process across minor and significant changes),
identify regulatory compliance requirements
produce and track actions, and
monitor and review the change after implementation.
The ICAO Safety Management Manual (primarily directed towards states rather than operators) first detailed such change management steps in the 4th edition, published in January 2018. Nevertheless, these principles had been well-established before then; for example, Hayes (2002) expanded on a wide range of change management topics, drawing on models and methods developed over the preceding decades. This more-detailed level of organisational change management has also been applied to aviation (Flouris and Yilmaz 2011).
Many key elements of established change management practices were omitted from the Malaysia Airlines planning and implementation of a major change (the reintroduction of Brisbane services). This may be due to the absence of details about change management in the CSMM, which hindered the operator’s ability to systematically validate the tolerability of risk, meet the strategic objective (namely, the successful implementation of change) and potentially affecting the safety objectives as well.
There were also problems with the defined process. The written description of the change process did not clarify how change management triggers were to be identified to the SRAT meetings, or who held the responsibility to do so.
Also, the provided change management form was essentially an alternative risk assessment form despite being used for a different purpose, and this may have led the assessor to conflate the two purposes to some degree. Furthering this problem, the labelling of the form as a change management form may lead to the risks not being entered into the appropriate risk registers as would be expected if the risk assessment form is referenced instead. These issues ultimately meant that the assessment had reduced value both as a change management exercise and as a risk management exercise.
ATSB investigation report findings focus on safety factors (that is, events and conditions that increase risk). Safety factors include ‘contributing factors’ and ‘other factors that increased risk’ (that is, factors that did not meet the definition of a contributing factor for this occurrence but were still considered important to include in the report for the purpose of increasing awareness and enhancing safety). In addition ‘other findings’ may be included to provide important information about topics other than safety factors.
Safety issues are highlighted in bold to emphasise their importance. A safety issue is a safety factor that (a) can reasonably be regarded as having the potential to adversely affect the safety of future operations, and (b) is a characteristic of an organisation or a system, rather than a characteristic of a specific individual, or characteristic of an operating environment at a specific point in time.
These findings should not be read as apportioning blame or liability to any particular organisation or individual.
From the evidence available, the following findings are made with respect to the airspeed indication failure on take-off involving Airbus A330, 9M MTK, at Brisbane Airport on 18 July 2018.
Contributing factors
In the absence of clear instruction or guidance, the Aircraft Maintenance Services Australia support engineer fitted pitot probe covers to the aircraft shortly after its arrival, as was done for some other airlines to mitigate the threat of wasp infestation. Later, the engineer left to perform tasks on another aircraft and did not return to the aircraft prior to its departure as intended.
Due to miscommunication or error, a technical log entry was not made following the fitment of pitot probe covers. As a result, when the technical log was reviewed prior to flight, the presence of pitot probe covers was not detected.
The Malaysia Airlines engineer saw the pitot probe covers fitted to the probes during the transit check, about 2 hours before departure, and intended to ask the support engineer to remove them. However, associated with the limitations of prospective memory, the operator’s engineer subsequently did not remember to do so.
The captain did not expect, or detect, the presence of the pitot probe covers during their pre-flight exterior inspection (walk-around). The captain did not include a number of the required check items, including the right side pitot probe, and looked at the left side pitot probe area briefly.
The Malaysia Airlines engineer did not perform a final walk-around inspection of the aircraft, including a check for pitot probe covers, as required by the transit check that the engineer had certified as complete. The engineer assumed that the walk-around would be completed by the support engineer and/or ground handlers.
The Menzies Aviation person assigned as dispatch coordinator for the aircraft handed over that duty to another person immediately before pushback, and neither person conducted the required dispatch walk-around. This was the last procedural opportunity to identify the presence of pitot probe covers before the flight.
The aircraft was released for flight with covers fitted to all three pitot probes, preventing the air data systems from measuring airspeed.
There was limited and ineffective communication between the captain and first officer in response to the speed flag on each of the primary flight displays (which appeared at about 50 kt groundspeed during the take-off). This significantly reduced their coordination and capacity to interpret the situation with the limited time available.
While independently trying to diagnose a rare and unfamiliar problem during take-off, the flight crew experienced high cognitive workload, time pressure, and stress. This reduced their capacity to effectively interpret the situation and make a decision early enough to safely reject the take-off.
The Airbus guidance provided in the flight crew techniques manual and other manuals for assisting A330 flight crews to decide whether to continue or reject a take-off did not discuss unreliable airspeed indication scenarios. (Safety issue)
In the Airbus A330, there was no auditory alert associated with nil or unreliable airspeed from two or more sources during take-off (a high workload, critical phase of flight). Comparatively, other critical failures provide both visual and auditory indications. (Safety issue)
Although suitable for use in most situations, the streamers attached to the pitot probe covers supplied and used for A330 operations by Aircraft Maintenance Services Australia provided limited conspicuity due to their overall length, position above eye height, and limited movement in wind. This reduced the likelihood of incidental detection of the covers, which is important during turnarounds. (Safety issue)
Some Aircraft Maintenance Services Australia (AMSA) engineers extended the use of pitot probe covers (to mitigate the threat of wasp infestation) to operators that did not explicitly require it, including Malaysia Airlines. This increased the likelihood of error associated with the use of pitot probe covers because AMSA engineers were not controlling the engineering activities and were not permitted to make technical log entries. (Safety issue)
Aircraft Maintenance Services Australia did not have a reliable method to account for tooling and equipment (such as pitot probe covers) prior to aircraft dispatch when providing non-certifying engineering support. (Safety issue)
Menzies Aviation staff did not consistently carry out the required arrival and pre-departure aircraft checks of Malaysia Airlines aircraft, and Menzies Aviation audit processes were not effective at evaluating compliance with these requirements. (Safety issue)
Malaysia Airlines flight crew and engineers did not fully complete the required aircraft inspections. (Safety issue)
Malaysia Airlines did not clearly specify the division of engineering responsibilities between Malaysia Airlines and Aircraft Maintenance Services Australia engineers at Brisbane, leading to ambiguity with regard to who should conduct the final walk-around portion of the transit check. This risk was increased by the operator commencing and continuing flights to Brisbane with interim ground handling and engineering arrangements that varied from usual industry practice. (Safety issue)
Malaysia Airlines did not develop and disseminate guidance and procedures about the use of pitot probe covers to flight crews and engineers, and there was limited awareness among those groups of the need for pitot probe covers at Brisbane Airport. (Safety issue)
The Malaysia Airlines risk assessment for the recommencement of operations into Brisbane had numerous errors and omissions that potentially reduced its effectiveness.
Although Malaysia Airlines identified the potential risk of pitot probe obstruction by wasps at Brisbane, and decided to address the risk with the use of pitot probe covers, it did not effectively communicate risks and required actions between departments and follow them through to completion.
Malaysia Airlines’ processes for the management of change did not follow recommended industry practices, and its risk and change management processes were not detailed and clear enough to assure:
the appropriate level of involvement of subject matter expertise and safety groups
that risk controls were implemented and monitored. (Safety issue)
Other factors that increased risk
The flight crew briefly attempted to conduct troubleshooting during a critical stage of flight without calling for and adhering to the pitch attitude and thrust setting memory items of the Unreliable speed indication procedure, and also omitted the After Take-off/Climb
For reasons that could not be determined, the tower controller did not respond to the initial PAN PAN call made by the flight crew after take-off.
The Lido airport operational information did not include the Australian Aeronautical Information Publication (AIP) advice to fit pitot probe covers at Brisbane Airport (related to significant mud wasp activity), as well as other safety related AIP information. (Safety issue)
Other findings
Once activated, the aircraft's back up speed scale (BUSS) was highly effective in reducing the flight crew's workload during approach and landing and provided critical flight information that would have otherwise been unavailable. The BUSS is available as an option on the Airbus A330 and other Airbus types.
After the initial climb, the flight crew managed the unreliable airspeed issue with effective communication and coordination.
The departures controller provided effective support to the flight crew from soon after take-off, including taking the initiative to provide groundspeed information.
Safety issues and actions
Central to the ATSB’s investigation of transport safety matters is the early identification of safety issues. The ATSB expects relevant organisations will address all safety issues an investigation identifies.
Depending on the level of risk of a safety issue, the extent of corrective action taken by the relevant organisation(s), or the desirability of directing a broad safety message to the aviation industry, the ATSB may issue a formal safety recommendation or safety advisory notice as part of the final report.
All of the directly involved parties were provided with a draft report and invited to provide submissions. As part of that process, each organisation was asked to communicate what safety actions, if any, they had carried out or were planning to carry out in relation to each safety issue relevant to their organisation.
Descriptions of each safety issue, and any associated safety recommendations, are detailed below. Click the link to read the full safety issue description, including the issue status and any safety action/s taken. Safety issues and actions are updated on this website when safety issue owners provide further information concerning the implementation of safety action.
Instruction and guidance for unreliable airspeed on take-off
Safety issue description: The Airbus guidance provided in the flight crew techniques manual and other manuals for helping A330 flight crews decide whether to continue or reject a take-off did not refer to unreliable airspeed indications.
Alerts associated with nil or unreliable airspeed during take-off
Safety issue description: In the Airbus A330, there was no auditory alert associated with nil or unreliable airspeed from two or more sources during take-off (a high workload, critical phase of flight). Comparatively, other critical failures provide both visual and auditory indications.
Safety issue description: Although suitable for use in most situations, the streamers attached to the pitot probe covers supplied and used for A330 operations by Aircraft Maintenance Services Australia provided limited conspicuity due to their overall length, position above eye height, and limited movement in wind. This reduced the likelihood of incidental detection of the covers, which is important during turnarounds.
Aircraft Maintenance Services Australia use of pitot covers
Safety issue description: Some Aircraft Maintenance Services Australia (AMSA) engineers extended the use of pitot probe covers (to mitigate the threat of wasp infestation) to operators that did not explicitly require it, including Malaysia Airlines. This increased the likelihood of error associated with the use of pitot probe covers was because AMSA engineers were not controlling or conducting all of the engineering activities and were not permitted to make technical log entries.
Aircraft Maintenance Services Australia tool control
Safety issue number: Aircraft Maintenance Services Australia did not have a reliable method to account for tooling and equipment (such as pitot probe covers) prior to aircraft dispatch when providing non-certifying engineering support.
Safety issue description: Menzies Aviation staff did not consistently carry out the required arrival and pre-departure aircraft checks of Malaysia Airlines aircraft, and Menzies Aviation audit processes were not effective at evaluating compliance with these requirements.
Safety issue description: Malaysia Airlines did not clearly specify the division of engineering responsibilities between Malaysia Airlines and AMSA engineers at Brisbane, leading to ambiguity with regard to who should conduct the final walk-around portion of the transit check.
Safety issue description: Malaysia Airlines did not develop and disseminate guidance and procedures about the use of pitot probe covers to flight crews and engineers, and there was limited awareness among those groups of the need for pitot probe covers at Brisbane Airport.
Safety issue description: Malaysia Airlines’ processes for the management of change did not follow recommended industry practices, and its risk and change management processes were not detailed and clear enough to assure:
the appropriate level of involvement of subject matter expertise and safety groups
that risk controls were implemented and monitored.
Safety issue description: The Lido airport operational information did not include the Australian Aeronautical Information Publication (AIP) advice to fit pitot probe covers at Brisbane Airport (related to significant mud wasp activity), as well as other safety AIP information.
Safety action not associated with an identified safety issue
Whether or not the ATSB identifies safety issues in the course of an investigation, relevant organisations may proactively initiate safety action in order to reduce their safety risk. The ATSB has been advised of the following proactive safety action in response to this occurrence.
Safety advisory notice to operators conducting flights to Brisbane Airport
On 30 August 2018, ATSB issued a safety advisory notice advising all operators that conduct flights to Brisbane Airport to consider the use of pitot probe covers and, if covers are used, ensure there are rigorous processes for confirming that covers are removed before flight.
On 6 July 2021, the Civil Aviation Safety Authority amended airworthiness bulletin AWB 02-052 Wasp Nest Infestation – Alert encouraging operators to ‘ensure all pitot / static and vent covers are removed prior to flight.’
Glossary
ADIRU
Air data inertial reference unit
ADR
Air data reference
AIP
Aeronautical Information Publication: a package of documents which provides all of the operational information necessary for the safe and efficient conduct of national (civil) and international air navigation throughout Australia and its States and Territories
ALERFA
Alert phase
ALT
Altitude
AME
Aircraft maintenance engineer (non-certifying)
AMSA
Aircraft Maintenance Services Australia
AOA
Angle of attack
AOI
Airport operational information
AS
Airport services
ATC
Air traffic control
AWB
Airworthiness bulletin
BEA
Bureau d'Enquêtes et d'Analyses pour la Sécurité de l'Aviation Civile
BUSS
Back up speed scale
CASA
Civil Aviation Safety Authority
CASR
Civil Aviation Safety Regulations
CCTV
Closed-circuit television
CSMM
Corporate safety management manual
CVR
Cockpit voice recorder
DAR
Digital aircraft recorder
E&M
Engineering and maintenance
E/WD
Engine and warning display
ECAM
Electronic centralised aircraft monitor: aircraft systems, displays aircraft system information, and specifies flight crew actions to be taken in the event of abnormal or emergency situations
EGT
Exhaust gas temperature: an engine status parameter
EPR
Engine pressure ratio: an engine status parameter
ERSA
En route supplement Australia: part of the Aeronautical Information Publication published by Airservices Australia, containing pictorial presentations of all licenced aerodromes and other information specific to aerodromes for planning a flight and for a pilot in flight.
FLEX
Flexible temperature: a thrust lever setting that provides a de-rated amount of thrust for take-off to reduce engine wear
FCOM
Flight crew operations manual
FCTL ALTN LAW
Flight control alternate law (ECAM message)
FCTM
Flight crew techniques manual
FDR
Flight data recorder
FL
Flight level: at altitudes above 10,000 ft in Australia, an aircraft’s altitude at standard air pressure is referred to as a flight level. FL 150 equates to 15,000 ft.
FO
First officer
FOD
Foreign object damage
GHA
Ground handling agreement
GSE
Ground support equipment
IAS
Indicated airspeed
IATA
International Air Transport Association
ICAO
International Civil Aviation Organization
ISIS
Integrated standby instrument system
LAE
Licensed aircraft engineer (equivalent term to licensed aircraft maintenance engineer or LAME)
LAME
Licensed aircraft maintenance engineer: a ground engineer approved to certify for maintenance within the scope of their licence
An internationally recognised radio call announcing an urgency condition, which concerns the safety of an aircraft or its occupants but where the flight crew does not require immediate assistance
PF
Pilot flying: the pilot who controls the aircraft and, in normal operations, navigates
PFD
Primary flight display
PFR
Post-flight report
PM
Pilot monitoring: the pilot who, in normal operations, carries out support duties, monitors the pilot flying’s actions and the aircraft’s flight path, and makes radio communications
QRH
Quick reference handbook
RTO
Rejected take-off
SAN
Safety advisory notice
SGHA
Standard ground handling agreement
SLA
Service level agreement
SPD
Speed
SRAT
Safety risk assessment team
SRS
Speed reference system
TOGA
Take-off / go-around: a thrust lever setting that applies maximum available thrust
V1
Decision speed: the maximum speed at which a rejected take-off can safely be initiated in the event of an emergency
VR
Rotation speed: the speed at which rotation should be initiated
Sources and submissions
Sources of information
The sources of information during the investigation included:
the flight crew, engineers, and ground handlers
Malaysia Airlines
Aircraft Maintenance Services Australia and Heston MRO
Menzies
Civil Aviation Safety Authority
Airservices Australia
Lido
Airbus
Brisbane Airport
aircraft recorded data.
References
Airbus (2006) ‘Pitot probes obstruction on ground’, Safety First, December, 11: 10–13.
Airbus (2007) ‘Unreliable speed’, Safety First, December, 5: 14–19.
Airbus (2014) ‘Control your speed… at take-off’, Safety First, July, 18: 6–17.
Airbus (2016) ‘Pitot probe performance covered on the ground’, Safety First, July, 22: 6–13.
Airbus (2019) ‘The adverse effects of unrealistic simulator scenarios’, Safety First, July, 28: 20–27.
Airbus (2020a) ‘Aircraft parking and storage’, Safety First, July, pp.1–8.
Airbus (2020b) ‘Preparing for a safe return to the skies’, Safety First, July, pp.1–9.
Airbus (2021) ‘Unreliable airspeed at takeoff’, Safety First, July, pp.1–10.
Airbus (2022) ‘Training pilots for resilience’, Safety First, January, pp.18–27.
Air Incidents Investigation Branch (AAIB) investigation report AAIB-2736, AAIB investigation to various Airbus and Boeing aircraft between 9 June and 19 July 2021, United Kingdom.
ATSB aviation research investigation AR-2009-042, Ground operations occurrences at Australian airports 1998 to 2008, Australia.
ATSB occurrence investigation AO-2011-102, VFR flight into dark night involving Aérospatiale, AS355F2 (Twin Squirrel) helicopter, VH-NTV, 145 km north of Marree, SA on 18 August 2011, Australia.
Baker DP and Dismukes RK (2002) ‘A framework for understanding crew performance assessment issues’, The International Journal of Aviation Psychology, 12(3), pp.205–222.
Boeing (2003) ‘Erroneous Flight Instrument Information’, Aero, July, pp.11–21.
Brière, D, Favre C and Traverse P (2001) ‘Electrical flight controls, from Airbus A320/330/340 to future military transport aircraft: a family of fault-tolerant systems’, in Spitzer, CR (ed) The Avionics Handbook, CRC Press, United States.
Bureau d'Enquêtes et d'Analyses pour la Sécurité de l'Aviation Civile (BEA) investigation report BEA2018-0071.en, Incidents to the Boeing 737-800 registered F-GZHO operated by Transavia France on 7 February 2018 at Norwich (United Kingdom) and 8 February 2018 at Paris-Orly, France.
CASA (Civil Aviation Safety Authority) (2017) Advisory Circular, Teaching and assessing non-technical skills for single-pilot operations, AC 61-08, January 2017, Australia.
Casner SM, Geven RW & Williams RT (2013) ‘The effectiveness of airline pilot training for abnormal events’, Human Factors: The Journal of the Human Factors and Ergonomics Society, 55(3): 477–485.
Civil Aviation Authority (CAA) (United Kingdom) (2013) Monitoring matters: guidance on the development of pilot monitoring skills, 2013/02, April 2013, United Kingdom.
Civil Aviation Authority (CAA) (United Kingdom) (2021) Safety Notice, Pitot Blockage Events, SN‑2021/014, June 2021, United Kingdom.
Dismukes RK (2012) ‘Prospective memory in workplace and everyday situations’, Current Directions in Psychological Science, 21(4): 215–220.
Doll TJ and Folds DJ (1986) ‘Auditory signals in military aircraft: ergonomic principles vs. practice’, Applied Ergonomics, 17(4): 257–264.
Ecosure 2017. Mud-Nesting Wasps and Aircraft Safety at Brisbane Airport – progress report. Presented to Brisbane Airport Corporation, 2017.
European Union Aviation Safety Agency (EASA) 2020. Guidelines, Return to service of aircraft after storage: Guidelines in relation to the COVID-19 pandemic, TE.GEN.00107-003, November 2020, Germany.
FAA (Federal Aviation Administration) (1993) Takeoff Safety Training Aid, PB93-780013, August 1993, United States.
Flight Safety Foundation (1999) ‘Erroneous Airspeed Indications Cited in Boeing 757 Control Loss’, Accident Prevention, October, pp. 1–8.
Flin R and Martin L (2001) ‘Behavioral markers for crew resource management: a review of current practice’ The International Journal of Aviation Psychology, 11(1): 95–118.
Flin R, O’Connor P and Crichton M (2008) Safety at the sharp end: a guide to non-technical skills, CRC Press, Florida US.
Flouris TG and Yilmaz AK (2011) Risk management and corporate sustainability in aviation, Ashgate, Aldershot UK.
Foushee HC and Manos KL (1981) ‘Information transfer within the cockpit: problems in intracockpit communications’, in Billings CE and Cheaney ES (eds) Information transfer problems in the aviation system, NASA Technical Paper 1875.
Harris RL, Glover BJ and Spady AA (1986) Pilot workload and eye tracking, NASA Technical Paper 2525.
Harris D and Khan H (2003) ‘Response time to reject a takeoff’, Human Factors and Aerospace Safety, 3(2): 165–175.
Hawkins FH (1987) Human factors in flight, Ashgate, Aldershot UK.
Hayes J (2014). The theory and practice of change management, 4th edition. Palgrave, United States.
Holt RW, Boehm-Davis DA and Beaubien JM (2001) ‘Evaluating resource management training’, Improving teamwork in organizations: Applications of resource management training, pp.165–188. CRC Press.
House AP, Ring JG and Shaw PP (2020a) ‘Inventive nesting behaviour in the keyhole wasp Pachodynerus nasidens Latreille (Hymenoptera: Vespidae) in Australia, and the risk to aviation safety’ PloS one, 15(11): 1–14.
House AP, Ring JG, Hill MJ and Shaw, PP (2020b) ‘Insects and aviation safety: the case of the keyhole wasp Pachodynerus nasidens (Hymenoptera: Vespidae) in Australia’, Transportation research interdisciplinary perspectives, 4: 1–14.
International Air Transport Association (IATA) (2020) Guidance for Managing Aircraft Airworthiness for Operations During and Post Pandemic. 2nd edition, IATA, Canada.
Knabl P, Cameron M, Dahlstrom N, Nolan P, Myers R and Da Cruz J (2018) Emirates/Seeing Machines A380 Eye tracking study 2018/2019 Internal report. Unpublished.
Landman, A, Groen, EL, van Paassen, MM, Bronkhorst, AW and Mulder M (2017) ‘The influence of surprise on upset recovery performance in airline pilots’, The International Journal of Aerospace Psychology, 27(1-2): 2–14.
Lee, YH & Liu, BS 2003, ‘Inflight workload assessment: Comparison of subjective and physiological measurements’, Aviation, Space, and Environmental Medicine, 74(10): 1078–1084.
Mack, A (2003) ‘Inattentional blindness: Looking without seeing’, Current Directions in Psychological Science, 12(5): 180–184.
McKee, SP and Nakayama, K (1984) ‘The detection of motion in the peripheral visual field’, Vision Research, 24(1): 25–32.
Mumaw, RJ, Sarter, NB and Wickens, CD (5-8 March 2001) ‘Analysis of pilots’ monitoring and performance on an automated flight deck’ [conference paper], 11th International Symposium on Aviation Psychology, Ohio, accessed 15 August 2019.
Orasanu, JM (1994) ‘Shared problem models and flight crew performance’ in Johnston, N, McDonald and Fuller, R (eds) Aviation Psychology in Practice, Ashgate, Aldershot.
Orasanu, J, Martin, L and Davison, J (29-31 May 1998) ‘Errors in aviation decision making: bad decisions or bad luck?’ [conference paper], Fourth Conference on Naturalistic Decision Making, Virginia, accessed 20 January 2021.
Orasanu JM (2010) ‘Flight crew decision-making’, in Kanki BG, Helmreich RL and Anca J (eds) Crew resource management, Elsevier, Amsterdam.
Proctor RW and Proctor JD (2012) ‘Sensation and perception’, in Salvendy G (eds) Handbook of human factors and ergonomics, John-Wiley and Sons, New Jersey.
Reason, J (2016) Managing the risks of organizational accidents, Routledge, United Kingdom.
Samn SW and Perelli LP (1982) ‘Estimating aircrew fatigue: a technique with application to airlift operations’ United States Air Force (USAF) School of Aerospace Medicine SAM-TR-82-21, United States.
Stevens, C, Perry, N, Wiggins, M and Howell, C (2006) Design and evaluation of auditory icons as informative warning signals, ATSB Transport Safety Report B2005/0120.
Stevens, SM, Goldsmith, TE, Johnson PJ and Moulton JB (2007) ‘Performance Differences on Rejected Takeoffs as a Function of Expectancy’, Proceedings of the Human Factors and Ergonomics Society Annual Meeting, 51(2): 80–84.
Underwood, G, Ngai, A and Underwood, J (2013) ‘Driving experience and situation awareness in hazard detection’, Safety Science, 56: 29–35.
Veltman, JA and Gaillard, AWK (1998) ‘Physiological workload reactions to increasing levels of task difficulty’, Ergonomics, 41(5): 656–669.
Wickens, CD, Hollands, JG, Banbury, S and Parasuraman, R (2013) Engineering psychology and human performance, 4th edn. Pearson, United States.
Wolf, OT (2014) ‘Stress and memory retrieval: mechanisms and consequences’, Current Opinion in Behavioral Sciences, 14: 40–46.
Wolfe, JM, Brunelli, DN, Rubinstein, J and Horowitz, TS (2013) ‘Prevalence effects in newly trained airport checkpoint screeners: trained observers miss rare targets, too’, Journal of vision, 13(3): 1–9.
Submissions
Under section 26 of the Transport Safety Investigation Act 2003, the ATSB may provide a draft report, on a confidential basis, to any person whom the ATSB considers appropriate. That section allows a person receiving a draft report to make submissions to the ATSB about the draft report.
A draft of this report was provided to the following directly involved parties:
Airbus
Airservices Australia
Bureau d'Enquêtes et d'Analyses pour la Sécurité de l'Aviation Civile (BEA)
Submissions were received from the following parties:
Airbus and BEA
Civil Aviation Safety Authority
Malaysia Airlines
The submissions were reviewed and, where considered appropriate, the text of the report was amended accordingly.
Appendices
Appendix A – Airworthiness bulletin AWB 02-052: Mud Wasp Infestation – Alert (Issue 6)
Appendix B - Personnel information
Captain
The captain held a Malaysian Air Transport Pilot (Aeroplane) Licence (ATPL), was certified in English proficiency at level 6 and held a valid Class 1 medical which contained limitations of ‘valid only as or with a co-pilot and shall wear corrective lenses. The captain held the appropriate qualifications to command the flight. Table C1 summarises the captain’s aeronautical experience.
Table C1: Summary of captain’s aeronautical experience
Total flying hours
14,411 hours
Total hours on the A330
555 hours
Total flying last 28 days
72.07 hours
Last proficiency check (simulator)
27 January 2018
Last line check (aircraft)
14 September 2017
The captain had worked for Malaysia Airlines since 1993 on Boeing 747 and 737 variants. In May 2017 the captain transferred from the 737-800 fleet to the Airbus A330 fleet. The operator’s A330 conversion course consisted of computer-based training, simulator training and line training in the aircraft.
A review of training records noted that training and check pilots commented that the captain’s abilities and performance during training were about average. A range of comments were noted on the captain’s command line training forms, generally not associated with any particular theme except that they showed that the captain may have had some difficulty with hand-flying using instrument raw data on the A330 only (likely to be associated with relative inexperience on this type). During the conversion training conducted in the simulator the A330 unreliable airspeed indication procedure was demonstrated to the captain.
The captain also completed the operator’s training programs in the following areas:
crew resource management training in March 2017
emergency procedures A330 conversion training in May 2017.
On 15 September 2017, the captain was cleared to line flying on the A330.
The occurrence flight was the first time the captain had operated to Brisbane Airport on an A330.
First officer
The first officer (FO) held a Malaysian ATPL, a current Class 1 medical certificate and held the appropriate qualifications to conduct the flight. Table C2 summarises the FO’s aeronautical experience.
Table C2: Summary of FO’s aeronautical experience
Total flying hours
6,544 hours
Total hours on the A330
4,582 hours
Total flying last 28 days
95.53 hours
Last proficiency check (simulator)
7 March 2018
Last line check (aircraft)
21 March 2018
A review of training records since 2016 indicated that the FO’s abilities and performance were consistently assessed to an above average standard.
Licensed aircraft engineer
The Malaysia Airlines licensed aircraft engineer (LAE) who certified for the aircraft on the night of the incident conducted an apprenticeship with the operator and attained an engineer licence in 2000, further attaining a type rating for the Airbus A330 in 2008. The LAE’s normal role was leading hand on a line maintenance shift at the operator’s main base in Kuala Lumpur, Malaysia.
When asked to self-rate fatigue using the Samn-Perreli scale (Samn and Perelli 1982), the LAE reported a rating of 4-5, indicating a level between ‘a little tired, less than fresh’ and ‘moderately tired, let down’. Accordingly, further information was obtained about the LAE’s 72-hour history.
The LAE took an 8-hour flight from Kuala Lumpur to Brisbane at 2030 on 16 July, having obtained ‘a few hours’ of sleep on the flight. Upon arriving in Brisbane, the LAE conducted a transit check on the aircraft. This aircraft had a hydraulic leak, which delayed its departure until about 0330. The LAE got to sleep about 0600, sleeping until about 1400 and having the rest of that day (17 July) off.
The LAE obtained about 10 hours of sleep the night before the occurrence, waking at 0600 on 18 July and spending the day at leisure before commencing travel to the airport at about 1700.
Based on this information, ATSB analysis, including the use of fatigue modelling software indicated that the LAE was not likely to have been experiencing a level of fatigue known to have a demonstrated effect on performance at the time of the occurrence.
Support engineer
The support engineer had about 18 years of experience in aircraft maintenance and joined AMSA in 2015. At AMSA the support engineer carried out line maintenance on customer aircraft as directed by AMSA licensed aircraft maintenance engineers.
There were no indications that the support engineer was experiencing fatigue at the time of the occurrence.
Leading hand
The leading hand had worked as a ground handler for about 6 years and was qualified to manage a team of ground handlers and certify for aircraft loading. The leading hand was also trained in receipt and dispatch in August 2017 through theoretical and practical training and assessment. That training covered several different aircraft types including the Airbus A330.
The leading hand started a ten-hour shift at 1500. They reported having a ‘pretty good’ level of alertness during the shift.
Dispatch coordinator
The dispatch coordinator had about 8 years of ground handling experience and was qualified to conduct leading hand duties, certify for loading aircraft and conduct dispatches. Training records showed the completion of dispatch coordination training, including both theoretical and practical training, in November 2016. That training appeared similar to that of the leading hand and covered several different aircraft types including the Airbus A330.
The dispatch coordinator started a ten-hour shift at 1500.They indicated that they ‘did not feel tired’ at the time of the occurrence, having just had 2 days off.
Appendix C - Recorded data
Overview
The ATSB recovered and downloaded data from the aircraft’s cockpit voice recorder (CVR) and flight data recorder (FDR) and obtained data from the aircraft’s digital aircraft recorder (DAR), used for routine monitoring by the operator. The post-flight report (PFR) was viewed and printed on the aircraft.
The data from the CVR and FDR contained all of the occurrence flight, while the DAR included all data up to 2348 and intermittent data after that time.[83]
Flight data recorder and digital aircraft recorder
Airspeed measurement
The FDR recorded computed airspeed (CAS) from air data inertial reference unit (ADIRU) 3 once per second, and additionally from any one of the three ADRs twice per second depending on flight crew selection and data validity:
if the air data switch is in NORM[84] or F/O ON 3,[85] and the data from ADIRU 1 is valid, the data from ADIRU 1 is recorded
if the air data switch is in NORM or F/O ON 3, and the data from ADIRU 1 is invalid, the data from ADIRU 2 is recorded
if the air data switch is in CAPT ON 3,[86] and the data from ADIRU 3 is valid, the data from ADIRU 3 is recorded
if the air data switch is in CAPT ON 3, and the data from ADIRU 3 is invalid, the data from ADIRU 2 is recorded
For each ADIRU, the airspeed data is considered valid when it is above 30 kts and there are no related fault conditions. Invalid data is indicated in the recording.
Throughout most of the flight, the recorded airspeed was invalid. There were some periods where airspeed data was valid (but incorrect), notably:
For a period starting at 2331:39, after the aircraft passed 140 kt groundspeed on take-off, the CAS was recorded increasing through 32 knots, indicating that ADIRU 1 or ADIRU 2 first sensed airspeed above 30 kt at this time.
At rotation, the FDR recorded 38 kt airspeed from ADIRU 1 or ADIRU 2 and the airspeed from ADIRU 3 had not yet reached 30 kt.
ADIRU 3 first sensed airspeed above 30 kt at 2331:54 (the ISIS would have stayed at or near the bottom of the speed scale throughout take-off). The maximum airspeed sensed by ADIRU 3 was 57 kt.
At 2338:29 the airspeed again reduced below 30 knots and was marked invalid. Over the following 10 minutes there were short intervals where the airspeed was recorded above the 30‑kt threshold.
The maximum airspeed recorded was 66 kt at 2337:13 when the aircraft was at about 11,000 ft with a groundspeed of 226 kt.
Overall, these recorded airspeeds were consistent with the pitot probes being covered and having partial airflow passing through the covers at times, resulting in erroneous low airspeeds being measured.
The DAR sampled CAS once per second and preliminary analysis shows broadly similar values as the FDR.
Airspeed displays
It is generally not possible to conclusively determine which of the primary flight displays (PFD) (captain, first officer (FO), or both) showed valid airspeed when the recorded data became valid (above 30 kt) on take-off from 2331:39. After the air data switch was selected to F/O ON 3 at 2332:11, the FDR would have recorded the data from ADIRU 1 if valid, or ADIRU 3 if ADIRU 1 was invalid. Since it recorded valid data but the FDR‑recorded data from ADIRU 3 remained invalid, this means that the data recorded reflected a valid airspeed shown on the captain’s PFD at this time and also reflected the captain’s PFD (that is, from ADIRU 1) until the switch position changed later in the flight. Further, there was no sudden change in this parameter when the switching was made, suggesting that it is more likely than not that it was also recording from ADIRU 1 just before the switch to F/O ON 3 at 2332:11.
After the switch to F/O ON 3, as the ISIS CAS was still invalid, the FO’s PFD would have displayed the red speed flag from that point even if the data from ADIRU 2 was valid. From this point until the switch was returned to NORM, the recorded PFD CAS would have therefore been the same as shown on the captain’s PFD (through ADIRU 1).
When airspeed is invalid or below 60 kt, the associated angle of attack (AOA) data is flagged invalid. All three ADIRUs flagged AOA as invalid throughout the take-off. Since AOA 2 was invalid, if ADIRU 1 and ADIRU 2 airspeeds had both been displayed at any point during the take-off, the airspeed on the FO’s PFD remained below 60 kt.
The first time AOA 2 became valid was at 2332:24, at which time the air data switch was in the F/O ON 3 position and the FDR recorded 38 kt airspeed. This means that, at this time, the recorded airspeed data would have been from ADIRU 1; the captain’s PFD was indicating about 38 kt and the FO’s PFD was indicating at least 60 kt.
AOA 1 first became valid at 2333:40. The recorded CAS parameter smoothly reached 60 kt at this time, indicating that the recording was from ADIRU 1 at this point. AOA 3 was invalid for the entire flight.
The aircraft’s flight control computers entered normal law from 2333:42 to 2333:45. At the time, recorded CAS was 62 kt, the integrated standby instrument system (ISIS) CAS was 37 kt, and both AOA 1 and AOA 2 were valid. This means that the airspeed data, though invalid, met the conditions for the aircraft’s flight control computers to reconfigure to normal law for this brief period, .
Potential for stall
An aircraft may stall if AOA, which is the vertical angle of the airstream relative to the aircraft, is too high. This can occur when a pilot attempts to maintain height or climb when airspeed is too low. Although the AOA sensor data was treated as invalid for most of the flight because each associated airspeed was mostly below 60 kt, the AOA sensors were functioning correctly, and the FDR recorded their measurements. The ATSB estimated the aircraft’s proximity to the stall warning angle throughout the flight based on available recorded data. The AOA measured throughout the flight was below the estimated stall warning angle and well below the actual stall angle, meaning that the aircraft did not approach a stall condition at any point throughout the flight.
Potential speed exceedances
The ATSB estimated airspeed throughout the flight using the groundspeed, heading, and the recorded winds aloft at around the time of the flight. The resulting speeds are indicative of potential exceedances of the aircraft’s maximum permissible speed with the current configuration (flaps and landing gear) throughout the flight.
The maximum flap extended speed may have been slightly exceeded twice:
for a period of about 2 minutes on climb (750–6,000 ft), by an average of about 8 kt up to a maximum 14 kt
for a period of about 80 seconds after levelling off, by an average of about 3 kt up to a maximum of 5 kt
Cockpit voice recorder
Overview
The CVR recorded three channels: the captain’s and FO’s microphones and an area microphone. The CVR recording was from about 1303:22 onwards.
Interpretation of flight crew utterances
The audio quality of the captain’s and area channels were generally satisfactory. The FO’s channel was somewhat distorted.
Three ATSB investigators separately evaluated the flight crew speech and then compared interpretations. In addition, the operator’s interpretation of the area microphone channel (with the assistance of the flight crew) was also considered. The operator allowed the flight crew to review the recording.
Where there was any significant doubt about an interpretation, the more likely interpretation was given preference while allowing for the possibility of other interpretations. The least distinct statements are listed in Table C8.
Table C8: Least distinct flight crew statements
Time
Speaker
ATSB interpretation
Operator interpretation
ATSB comments
2331:18
Captain
‘ah, speed, speed’.
‘speed’
Very faint on the area channel.
2331:31
FO
‘bort uh’, ‘both yes’ or ‘what uh’
‘abort?’ (sounded like ‘bort?’)
Sounded most like ‘bort.’
2331:32
Captain
‘borders are red’
‘both also don’t have’
Syllable count is most consistent with ‘borders are red.’ The operator’s interpretation was that the captain was responding to the FO’s question, thinking that the FO had said ‘both?’, as in ‘are both airspeed indications inoperative?’
2331:33
FO
‘oh no’ or ‘both no’
‘both no’
-
2331:37
FO
‘captain?’
‘capt..?’
-
2331:40
FO
‘go to ADR three’ then indistinct
‘put to ADR three… abort, abort’
FO’s channel and area channel sounded completely different on the indistinct part.
2331:40
Captain
‘okay, check’
‘ah check’
Difficult to hear on the area channel as it was at the same time as the FO’s statement.
Loudness of speech during take-off
The loudness of the flight crew utterances during the take-off from commencement of take-off roll to rotation were measured using Audacity software (version 3.0.2, build ff5003a) with the ‘contrast analysis’ tool.[87] This tool measures the difference between foreground (target) audio and background audio according to the WCAG 2 standard,[88] which is an accessibility standard for web content. Under this standard, a minimum 20 dB[89] loudness above background noise is required for the content to be considered acceptable.
The average loudness of the captain’s speech during this period was measured to be 25.8 dB above the background noise, and the FO’s was 27.8 dB. All statements by both pilots exceeded the 20 dB WCAG 2 standard except for the captain’s ‘speed’ utterance, which was 17.8 dB above the background noise.
Flight crew breathing rate during take-off
Respiratory (breathing) rate and intensity can be indicative of a level of individual stress. Typical respiratory rate for a healthy adult at rest is 15–18 breaths per minute.
The captain’s breathing was indistinct (indicating low intensity) until 2331:19, just after the ‘speed’ statement. Between that point and aircraft rotation, the captain’s breathing rate was at least 33 breaths per minute.
The FO’s breathing was indistinct until 2331:27, just before the 100 kt call, when a very faint breath was heard. The FO’s breathing increased in intensity from 2331:32 onwards, and until rotation the FO’s breathing rate was at least 26 breaths per minute.
Post-flight report
The PFR is a record of faults and messages detected by aircraft systems. Electronic centralised aircraft monitor (ECAM) messages, along with faults that are not presented to the flight crew are recorded in the PFR with the time that each fault or message first arose being recorded with 1‑minute precision. The order of messages and faults is not preserved when they fall within the same 1‑minute period.
The PFR was closed (that is, it ceased recording faults and messages) at 2336 due to logic intended to mark the end of a flight: when one of the ADIRUs provides a valid airspeed value above 80 kt for more than 1 s, and then none of the ADRs provided any valid airspeed above 80 kt for the next 150 s. These conditions were probably initially met at 2333, consistent with the brief presence of valid AOA data from ADIRU 2 at 2333 that indicated the associated pitot probe measuring airspeed above 60 kt at that time (that data was not directly recorded).
The PFR faults and messages, along with other effects, are listed in Table C9 with explanations based on ATSB and Airbus analysis.
Table C9: Effect of air data absence on aircraft systems
Time
Effects
Explanation
ECAM messages to the flight crew
2331
FLAG ON CAPT PFD: FD
FLAG ON CAPT PFD : SPD LIMIT
FLAG ON FO PFD: FD
FLAG ON FO PFD : SPD LIMIT
The flight director and speed limit indications on both PFDs became unavailable as a result of the absence of valid air data.
AUTO FLT A/THR OFF
Autothrust disconnected due to the absence of two valid air data systems. This resulted in a master caution and associated chime after take-off.
F/CTL ALTN LAW
The loss of valid air data led to the flight control system entering alternate law at 1500 ft radar altitude (the alert is inhibited before then). Full stall prevention was not available, replaced by a stall warning that used AOA data[90] routed through the inertial reference part of the ADIRUs.
2332
ENG 1 EPR MODE FAULT
ENG 2 EPR MODE FAULT
Engine pressure ratios were invalidated due to the absence of valid air data. As a result, the engines reverted to a degraded mode, where the thrust levers command N1 (compressor/turbine speed) rather than the engine pressure ratio.
Recorded fault messages (not displayed to the flight crew)
2331
ADIRU1+2+3 (1FP1+2+3) ADR
Each ADIRU flagged its associated AOA data invalid because the associated airspeed did not reach the minimum of 60 kts for AOA validity. The electronic flight control system rejects an ADIRU when it has invalid AOA data and the aircraft is airborne; this occurred for all 3 ADIRUs at lift-off, resulting in this fault.
2332
SENSE LINE: P2 TO EEC/EEC(E1-4000KS)
Engine pressure sensors, which were probably sensing valid data, were invalidated because they disagreed with the incorrect but matching pitot pressures provided by 2 of the ADIRUs.
2333
AUTO FLT REAC W/S DET FAULT
Reactive windshear detection fault was generated due to absence of valid angle of attack data.
2334
Intermittent EFCS
Maintenance messages associated with the receipt of invalid air data.
The objective of a safety investigation is to enhance transport safety. This is done through:
identifying safety issues and facilitating safety action to address those issues
providing information about occurrences and their associated safety factors to facilitate learning within the transport industry.
It is not a function of the ATSB to apportion blame or provide a means for determining liability. At the same time, an investigation report must include factual material of sufficient weight to support the analysis and findings. At all times the ATSB endeavours to balance the use of material that could imply adverse comment with the need to properly explain what happened, and why, in a fair and unbiased manner. The ATSB does not investigate for the purpose of taking administrative, regulatory or criminal action.
Terminology
An explanation of terminology used in ATSB investigation reports is available here. This includes terms such as occurrence, contributing factor, other factor that increased risk, and safety issue.
Publishing information
Released in accordance with section 25 of the Transport Safety Investigation Act 2003
Ownership of intellectual property rights in this publication
Unless otherwise noted, copyright (and any other intellectual property rights, if any) in this report publication is owned by the Commonwealth of Australia.
Creative Commons licence
With the exception of the Coat of Arms, ATSB logo, and photos and graphics in which a third party holds copyright, this publication is licensed under a Creative Commons Attribution 3.0 Australia licence.
Creative Commons Attribution 3.0 Australia Licence is a standard form licence agreement that allows you to copy, distribute, transmit and adapt this publication provided that you attribute the work.
The ATSB’s preference is that you attribute this publication (and any material sourced from it) using the following wording: Source: Australian Transport Safety Bureau
Copyright in material obtained from other agencies, private individuals or organisations, belongs to those agencies, individuals or organisations. Where you wish to use their material, you will need to contact them directly.
Preliminary report
Report release date: 30/08/2018
This preliminary report details factual information established in the investigation’s early evidence collection phase and has been prepared to provide timely information to the industry and public. Preliminary reports contain no analysis or findings, which will be detailed in the investigation’s final report. The information contained in this preliminary report is released in accordance with section 25 of the Transport Safety Investigation Act 2003.
Sequence of events
On 18 July 2018 Malaysia Airlines Airbus A330-300, registered 9M-MTK, was scheduled to operate on a regular public transport flight from Brisbane, Queensland to Kuala Lumpur, Malaysia. The scheduled departure time was 2320 Eastern Standard Time.[1]
The aircraft had landed at Brisbane Airport at 2011, after a flight from Kuala Lumpur. The captain, first officer and certifying maintenance engineer from the previous night’s flight, who had been resting at a Brisbane hotel, arrived at the airport to commence their duties for the 18 July outbound flight.
Soon after the aircraft had landed, covers were placed on the aircraft’s three pitot probes.[2] Subsequent inspections during the turnaround did not identify the presence of the pitot probe covers and they were not removed prior to the aircraft’s departure (Figure 1).
Figure 1: Aircraft about to be pushed back with pitot covers in place (two of three visible)
Source: Brisbane Airport Corporation. Image modified by ATSB.
The first officer was the pilot flying (PF) and the captain was the pilot monitoring (PM).[3] Prior to aircraft pushback, the captain and first officer calculated the aircraft’s ‘V’ (critical) speeds for the take-off.[4] For this flight, the decision speed V1 (the maximum speed at which a rejected take-off can be initiated in the event of an emergency) was 153 kt and the rotation speed VR (when rotation should be initiated) was 160 kt.
The operator’s standard operating procedures for take-off required the PM to announce when the airspeed reached 100 kt and for the PF to cross check this airspeed indication.
The wind was calm and there was no cloud. At 2324, the flight crew commenced taxi for a take-off on runway 01. Subsequent events included:
2331:05: The flight crew commenced the take-off roll.
2331:38: The cockpit voice recorder (CVR) recorded that the captain called ‘100 knots’. The the aircraft’s recorded groundspeed at this time was 100 kt.
2331:47: The first officer initiated rotation. The recorded groundspeed at this time was 165 kt.
The flight crew recalled that they detected an airspeed anomaly during the take-off roll, including red speed (SPD) flags on both primary flight displays (PFD).
The standard operating procedures stated that the captain held responsibility for the decision to reject the take-off or continue. It stated that rejecting a take-off between 100 kt and V1 was a serious matter, that a captain should be ‘go-minded’, and that very few situations should lead to the decision to reject the take-off. There was no indication on the CVR recording that the captain or the first officer discussed rejecting the take-off.
After take-off the flight crew carried out actions for unreliable airspeed indications and made a PAN call[5] to air traffic control (ATC), advising they had unreliable airspeed indications.
The flight crew continued to climb above 10,000 ft and manoeuvred the aircraft to the north-east of Brisbane Airport where they carried out several checklists, troubleshooting and preparation for an approach and landing on runway 01 (Figure 2).
Figure 2: Flight path of 9M-MTK during turn back
Source: Google Earth / ATSB.
In accordance with published procedures, the flight crew turned off the three air data reference systems (ADRs) at 1343. This activated the aircraft’s backup speed scale (BUSS) (Figure 3), which provided a colour-coded speed scale derived from angle of attack and other information, and altitude derived from GPS data.[6] The flight crew also obtained groundspeed information from ATC, and used the aircraft’s radar altimeter.
Figure 3: Example of the backup speed scale (BUSS), showing the colour-coded scale (left) that indicates derived speed, and a GPS altitude scale (right)
Source: Airbus
Normal landing gear extension could not be accomplished with all three ADRs off.[7] The flight crew performed a landing gear gravity extension before conducting an overweight[8] landing on runway 01 at 0033.
After landing the flight crew stopped the aircraft on the runway as nose wheel steering was unavailable following a landing gear gravity extension. The main landing gear doors, which remain open following a gravity extension, had minor damage where they contacted the runway surface. The aircraft was towed to the gate where the passengers and crew disembarked. There were no reported injuries during the flight.
A subsequent inspection identified that the pitot probe covers were still fitted to the aircraft’s three pitot probes after it landed.
Recorded data
The ATSB recovered and downloaded data from the aircraft’s CVR and flight data recorder (FDR), and obtained data from the aircraft’s digital ACMS[9] recorder (DAR), used for routine monitoring by the operator.
The data from the CVR and FDR contained all of the occurrence flight, while the DAR included all data up to 2348 and intermittent data after that time.[10] At the time of publication, the ATSB had not fully validated the data and analysis is ongoing.
The aircraft had four sources of airspeed information:
ADR1, processing data for the captain’s pitot probe on the left side of the airframe, and usually presented on the captain’s PFD.
ADR2, processing data from the first officer’s pitot probe on the right side of the airframe, and usually presented on the first officer’s PFD.
ADR3, processing data from the standby pitot probe on the left side of the airframe, and not presented unless the flight crew selects it to be displayed on one of the PFDs.
Integrated standby instrument system, processing data from the standby pitot probe, and presented on the integrated standby instrument system to the right of the captain’s instruments.
Airspeed was not recorded or displayed to the flight crew when it had a calculated value below 30 kt.
The FDR recorded airspeed from ADR3 once per second, and additionally from any one of the three ADRs twice per second depending on flight crew selection and data validity. Data from the FDR showed that ADR1 first sensed airspeed above 30 kt at 2331:39. At rotation, the FDR recorded 38 kt airspeed from ADR1 and the airspeed from ADR3 had not yet reached 30 kt. ADR3 first sensed airspeed above 30 kt at 2331:54.
The DAR sampled airspeed once per second and preliminary analysis shows broadly similar values as the FDR.
The maximum recorded airspeeds after take-off were 66 kt on the FDR and 57 kt on the DAR, prior to the ADRs being selected off when the data became invalid. These recorded airspeeds were consistent with the pitot probes being covered.
Preliminary analysis of the available groundspeed and angle of attack data indicated that the aircraft was flown within operational limits.
Further investigation is required to determine the airspeed indications and related warnings and cautions being displayed to the flight crew during the take-off roll.
Previous occurrences at Brisbane Airport
There have been multiple reports of insect activity disrupting aircraft systems at Brisbane Airport. These included blocked pitot probes, mainly from nests built by mud-dauber and other wasps, resulting in airspeed discrepancies and other effects.
A preliminary review of the ATSB database indicated that, from 2008 to 2018, there were at least 15 incidents involving high-capacity regular public transport aircraft departing from Brisbane Airport where one of the pitot probes had a partial or total blockage, at least four of which were identified as insect nests. These resulted in three rejected take-offs, four aircraft returning to Brisbane Airport after continuing the take-off and one aircraft that continued to its destination.
The ATSB investigated two rejected take-offs that involved A330 aircraft where one of the pitot probes had been blocked with wasp nests, one in 2006 and one in 2013.[11]
After the 2006 occurrence, the Brisbane Airport Corporation (BAC) commenced a monthly wasp eradication program, which was made weekly after the 2013 occurrence. BAC also undertook research to understand wasp behaviour and identify the pitot probe types at highest risk of contamination.
In May 2015, the Civil Aviation Safety Authority (CASA) issued Airworthiness Bulletin 02-052 ‘Wasp Nest Infestation – Alert’[12] to ‘urgently advise operators, maintainers and pilots of the dangers associated with undetected wasp infestation in aircraft, and the circumstances under which they can occur.’ It stated that wasps could build nests in aircraft that are stationary for more than 20 minutes with uncovered pitot probes.
From November 2015 onwards, the Airservices Australia produced publication En Route Supplement Australia (ERSA) entry for Brisbane Airport included a note that stated:
Significant mud wasp ACT WI AD VCY [activity within aerodrome vicinity] affecting pitot tubes [probes]. Pitot tube covers recommended.
Similarly, the Jeppesen aeronautical information publication Australia Airport Directory, used primarily by international pilots operating into Australia, also had the following in the Brisbane airport information section:
Significant mud wasp activity within apt [airport] vicinity affecting pilot tubes. Pitot tube covers recommended.
Some operators using Brisbane Airport use pitot probe covers for routine turnarounds.
Operator’s arrangements for ground handling at Brisbane Airport
Having previously ceased Brisbane operations in 2015, the aircraft operator recommenced flights to Brisbane on 6 June 2018. At the time of the occurrence arrangements had been made for the provision of services by a local ground handing provider and a local engineering support provider. On the day of the occurrence, aircraft turnaround duties were shared between:
a maintenance engineer from the operator who was rostered to return to Kuala Lumpur as a passenger on the departing aircraft
two non-certifying engineers from the engineering support provider
four ground handlers from the ground handling service provider.
The operator’s personnel and the ground handlers were both responsible for conducting pre-departure checks.
Use of pitot probe covers
The pitot probe covers were fitted on the aircraft’s three pitot probes by one of the engineering support personnel, as it was his understanding this was normal practice. He later reported that he advised the operator’s maintenance engineer that pitot probe covers were fitted during a brief exchange discussing turnaround tasks, but that the maintenance engineer did not directly respond. The maintenance engineer later reported that he did not recall hearing the advice, and he did not make an entry in the aircraft’s technical log to record that the covers had been fitted.
The presence of the pitot covers was not detected by the operator’s maintenance engineer or captain during separate external aircraft inspections. The operator’s maintenance engineer boarded the aircraft during turnaround, and the engineering support personnel left the bay to attend to other aircraft. The pitot covers were not detected by ground handlers during pushback.
The flight crew and operator’s maintenance engineer later reported that they would not routinely use pitot probe covers on a turnaround. They advised that the operator did not normally fly to airports where the use of pitot probe covers was standard. Security video recordings of the operator’s three previous turnarounds at Brisbane Airport showed that pitot probe covers were not used.
The pitot covers fitted to the aircraft were provided by the engineering support provider and were manufactured to fit Airbus aircraft types including the A330. They consisted of a tightly woven Kevlar sheath about 12 cm long, with a 30 cm streamer.
Examination of the three covers fitted to the aircraft following the occurrence found that they were partially burned by the heated pitot probes. They each had a hole burned through where the cover folded around the probe in the airstream. The streamers were damaged by contact with the aircraft skin during the flight (Figure 4 and Figure 5).
Figure 4: Pitot probe covers removed from 9M-MTK after the incident flight
Source: ATSB
Figure 5: Reconstruction of pitot probe covers on 9M-MTK, showing pitot cover damage and rub marks on aircraft skin from the streamer
Source: ATSB
Ongoing investigation
The ATSB has interviewed the flight and ground crews, and examined data from the aircraft’s FDR, CVR and DAR, as well as airport security video footage from before and after the flight.
The investigation will examine the:
procedures, arrangements and interactions between the operator’s maintenance engineers, flight crews, engineering support provider and ground handling service provider
procedures relating to ground and flight crew pre-flight checks, including walk-around procedures
training records for flight crew, engineers and ground handling personnel
warnings, cautions and other information displayed to the flight crew during the occurrence flight
ATC recordings
closed-circuit video recordings
FDR, CVR and DAR recordings.
The investigation will also interview the air traffic controllers who communicated with the flight crew during the flight.
Safety actions
Proactive safety action
Whether or not the ATSB identifies safety issues in the course of an investigation, relevant organisations may proactively initiate safety action in order to reduce their safety risk. The ATSB has been advised of the following proactive safety action in response to this occurrence.
The aircraft operator provided a notice to all of its engineers and flight crew, which highlighted the need for pitot covers to be fitted to aircraft at Brisbane Airport during turnarounds or when parked, as well as the required procedures for their fitment and removal.
The aircraft operator and engineering support provider clarified and formalised more detailed service level arrangements.
The engineering support provider improved its procedures for conducting turnarounds, including improved inspection, documentation, and tool control.
The ground handling service provider provided all employees with a ‘read and sign’ bulletin emphasising its arrival and departure inspection procedures.
Safety advisory notice to all international operators using Brisbane Airport
The Australian Transport Safety Bureau advises all operators that conduct flights to Brisbane Airport to consider the use of pitot probe covers and, if covers are used, ensure there are rigorous procedures for confirming that covers are removed before flight.
The information contained in this preliminary report is released in accordance with section 25 of the Transport Safety Investigation Act 2003 and is derived from the initial investigation of the occurrence. Readers are cautioned that new evidence will become available as the investigation progresses that will enhance the ATSB's understanding of the accident as outlined in this report. As such, no analysis or findings are included in this report.
Purpose of safety investigations
The objective of a safety investigation is to enhance transport safety. This is done through:
identifying safety issues and facilitating safety action to address those issues
providing information about occurrences and their associated safety factors to facilitate learning within the transport industry.
It is not a function of the ATSB to apportion blame or provide a means for determining liability. At the same time, an investigation report must include factual material of sufficient weight to support the analysis and findings. At all times the ATSB endeavours to balance the use of material that could imply adverse comment with the need to properly explain what happened, and why, in a fair and unbiased manner. The ATSB does not investigate for the purpose of taking administrative, regulatory or criminal action.
Terminology
An explanation of terminology used in ATSB investigation reports is available here. This includes terms such as occurrence, contributing factor, other factor that increased risk, and safety issue.
Publishing information
Released in accordance with section 25 of the Transport Safety Investigation Act 2003
Ownership of intellectual property rights in this publication
Unless otherwise noted, copyright (and any other intellectual property rights, if any) in this report publication is owned by the Commonwealth of Australia.
Creative Commons licence
With the exception of the Coat of Arms, ATSB logo, and photos and graphics in which a third party holds copyright, this publication is licensed under a Creative Commons Attribution 3.0 Australia licence.
Creative Commons Attribution 3.0 Australia Licence is a standard form licence agreement that allows you to copy, distribute, transmit and adapt this publication provided that you attribute the work.
The ATSB’s preference is that you attribute this publication (and any material sourced from it) using the following wording: Source: Australian Transport Safety Bureau
Copyright in material obtained from other agencies, private individuals or organisations, belongs to those agencies, individuals or organisations. Where you wish to use their material, you will need to contact them directly.
On 12 July 2018, the crew of a Boeing 737-8FE, registered VH-VUB was preparing for its flight from Sydney to Melbourne. During pre-flight preparation, the crew did not correctly configure air conditioning pack switches and did not identify the error following take-off. Consequently, the aircraft did not pressurise as expected and the Cabin Altitude warning presented as the aircraft passed 13,500 ft. The crew identified that the pack switches were OFF, reset them to AUTO and descended to 10,000 ft. After a short time, cabin pressurisation was under control and the crew continued the flight to Melbourne.
What the ATSB found
The ATSB found that the incorrect configuration of the pressurisation system resulted in the cabin altitude rising above 10,000 ft. Normal procedures and checklists, which were designed to ensure that the aircraft is correctly configured for flight, were not completed due to a number of factors, including training, distraction, high workload, low expectancy of error and supervision lapses.
What's been done as a result
The operator published a summary of the occurrence in an internal safety publication. They also issued a flight crew notification and conducted a roadshow to remind flight crew of the importance of standard operating procedures and checklist discipline. The operator is reviewing the checklist and is considering an additional check of packs/pressurisation during the climb. The operator has also introduced a flight operations safety assurance program, additional pressurisation event training and amended its training program to ensure continuity for trainee pilots.
Safety message
Flight crews are reminded that effective checklist management is essential for verifying that critical procedural items are undertaken and ensuring safe aircraft operation. Consequently, it is important to prioritise checklists appropriately and avoid conditions that may introduce potential errors or omissions. Flight crews are also reminded to use all available means for verifying correct system configuration and operation.
The occurrence
On 12 July 2018, a Boeing Company 737-8FE, VH-VUB, operated by Tiger Airways Australia (Tiger) was being prepared for its flight from Sydney, New South Wales to Melbourne, Victoria. For this flight, a trainee First Officer was the pilot flying (PF) and a training Captain was the pilot monitoring (PM).[1]
The pilots switched off both air conditioning packs in accordance with the standard operating procedure (SOP) for starting the engines. The before taxi procedure followed engine start and although it included selecting the air conditioning packs to AUTO, the air conditioning packs remained OFF.
The aircraft took off at about 1136 Eastern Standard Time (EST).[2] After flap retraction at approximately 1137, the crew completed the final component of the take-off procedure, followed by the after take-off checklist. At about the same time, air traffic control (ATC) issued several instructions to the crew. The take-off procedure and after take-off checklist both included a requirement to check the position of the air conditioning packs switches. However, during both the procedure and the checklist, the packs were not identified as being OFF.
At about 1142, while the aircraft was still climbing and passing 13,500 ft, the cabin altitude warning horn sounded. The First Officer identified that both air conditioning packs switches were in the OFF position. Both packs were then immediately switched to AUTO. The Captain took over control of the aircraft and selected altitude hold on the autopilot. The aircraft reached a maximum height of 14,900 ft (at about 1144), whereby the Captain disengaged the autopilot and commenced a descent to 10,000 ft. The warning ceased at about 1146. During this time, both pilots donned oxygen masks in accordance with the cabin altitude warning procedure.
Once level at 10,000 ft, the crew completed the remainder of the cabin altitude warning checklist. As the cabin pressure was now under control and operations were normal, the crew continued the flight to Melbourne.
The Captain had been operating at Tiger since 2012, having joined as a direct entry Captain on the Airbus A320. He had previous experience as an airline training captain on Fokker F50, Fokker F28 and Airbus A320, a role he subsequently undertook at Tiger. In 2016, he transitioned to the Boeing 737 as part of Tiger’s introduction of the aircraft. The Boeing 737 type rating was completed in October 2016. The Captain completed Tiger line training in January 2017 and commenced instructional duties on type in March 2017.
The Captain’s previous experience included Fokker F50, Fokker F28, Airbus A319/320, Boeing 767 and varied operations including charter and instructional flying. The Captain reported that he had a total 21,511 hours with 949 hours on the Boeing 737. Command time on the Boeing 737 was 946 hours.
The Captain’s last line check was in February 2018 with no major concerns noted.
First Officer
The First Officer was an experienced pilot having been a captain on other types including Boeing 777 and 767. His operational experience included charter, regional, domestic and international flying. Returning to Australia in 2015, he did not fly for two years prior to joining Tiger in 2017.
The First Officer completed the Boeing 737 type rating in June 2017. The Tiger operational conversion course was completed in September 2017. Line training commenced in March 2018 and the occurrence flight was his 12th line training event.
Tiger reported that the First Officer had a total of 18,300 hours of which 14,400 hours was in command of various types. Twenty-seven hours were on the Boeing 737.
The First Officer undertook five transition simulator sessions between 31 March 2018 and 7 April 2018. Actual flying training commenced 22 June 2018.
As part of line training, Tiger required the presence of a safety pilot. The safety pilot was to observe the overall operation of the aircraft and ensure that the training captain was aware of any divergence from standard operating procedure (SOP) and any potentially unsafe conditions. This First Officer required a minimum eight sectors to be flown with a safety pilot.
The First Officer had flown the required eight sectors, including two as pilot flying (PF). He had also demonstrated the additional requirements of being able to recall abnormal/emergency memory items and was deemed proficient in the procedure for crew incapacitation. The First Officer was cleared of the requirement for a safety pilot on 7 July 2018.
As the First Officer was yet to be checked to line, further supervision of the First Officer was reliant on the assigned training captain. A training captain was responsible as both the pilot in command and as the instructor and assessor of the trainee.
In the flights following removal of the safety pilot requirement, the First Officer’s training records indicated satisfactory performance. The First Officer had flown with the same Captain on three previous occasions (5, 9 and 11 July 2018) and there was no reason to consider a reintroduction of a safety pilot. There were no issues relating specifically to the before taxi procedures and his pre-flight preparation was recorded as consistently improving.
The Captain reported being satisfied with the First Officer’s performance and held a reasonable level of confidence in his progress potential on the Boeing 737.
Aircraft information
Pressurisation system
Cabin pressurisation is essential to providing a safe and comfortable environment for aircraft occupants flying at high altitude. In an unpressurised cabin at high altitude, aircraft occupants are exposed to the possibility of hypoxia,[3] which can lead to loss of consciousness and possible loss of life.
Cabin pressurisation utilises air bled from the engines, which is distributed throughout the cabin via two air conditioning packs. A cabin pressurisation controller modulates the cabin pressure via an outflow valve. The controller is normally set to AUTO and it operates independently of the air conditioning packs attempting to modulate cabin pressure regardless of the pack switch setting. Normal operation is for both packs switches to be in AUTO. If the packs are OFF, the outflow valve will drive closed to prevent the escape of cabin air. However, without bleed air via the air conditioning packs, there will be insufficient air to pressurise the aircraft.
The cabin pressurisation controller normally controls the cabin altitude rate of climb as well as the cabin altitude up to a cabin altitude (equivalent) of 8,000 ft at the maximum certified aircraft ceiling of 41,000 ft. The system has both an aural and visual warning for cabin altitude rising above 10,000 ft. Above 10,000 ft, flight crew are required to use supplementary oxygen. The system will also automatically deploy passenger oxygen masks once the cabin altitude rises above 14,000 ft.
The system has a number of other cautions to alert the crew to a malfunction, but there is no warning or caution to alert the flight crew if air conditioning packs are OFF.
Pressurisation system controls
Air conditioning, pressurisation controls and cabin pressure indications are located at the right-hand side of the forward overhead panel in the flight deck. The controls use toggle type switches with placards to indicate position. Analogue gauges indicate bleed air duct pressure, cabin altitude, cabin rate of climb and differential pressure.[4] Digital displays are used to set cruise altitude and destination landing altitude (required for control of cabin pressurisation).
Visibility and accessibility of the controls and cabin pressure indications is most convenient for the right-hand seat crew member (First Officer) as the panel is above their seat. The left-hand seat crew member (Captain) may have to move in order to adequately view them and avoid any parallax error[5]. Some placards indicating position are obscured by the switches when viewed from the left-hand seat. Figure 1 shows the view that the Captain may have had from the left-hand seat.
Figure 1: View of air conditioning packs switches from the Captain’s side
Source: Tiger Airways Australia, annotated by ATSB.
Figure 2: Close-up view of air conditioning pack switches
Source: Tiger Airways Australia, annotated by ATSB.
Aircraft serviceability
The aircraft did not have any technical issues related to the pressurisation system.
Recorded data
The ATSB retrieved data from both the flight data recorder (FDR) and the quick access recorder (QAR). Only the FDR required analysis, which identified:
Both engine bleed switches were ON from take-off (departure) until time of warning.
Both air conditioning packs were OFF from time of take-off (departure) until after warning presented.
The data does not record the highest cabin altitude reached. However, considering that the cabin oxygen masks did not deploy, it is unlikely to have exceeded 14,000 ft. There was nil evidence to suggest settings or events that could have affected the aircraft pressurisation, other than the air conditioning pack switches being OFF.
Operating procedures
The Tiger Boeing 737Flight crew operating manual (FCOM) contained the expanded normal procedures, which were divided according to the phase of flight with separate duties for each crew member. Since the procedures were conducted by memory, a normal checklist was used to verify that critical items within the procedures had been completed. The checklist contained the minimum items needed to operate the aeroplane safely.
Irrespective of who read or responded to each checklist item, both pilots were required to visually verify the switch associated with each item was in the required configuration or that a step had been done.
Pre-flight and engine start procedures
As part of the pre-flight procedure, the air conditioning packs were required to be switched to AUTO or HIGH. The cabin pressurisation panel was also configured at this stage with the cruise altitude and destination altitude set. The pressurisation mode selector is set to AUTO for normal operation. This formed part of the First Officer’s pre-flight procedure and was completed correctly.
In accordance with the engine start procedure, the First Officer turned OFF the air conditioning pack switches. This was the only component of the pressurisation system that requires turning OFF during engine start.
Before taxi procedure
The before taxi procedure was designed to ensure that the aircraft condition and flight deck configuration is correct prior to taxiing for the departure runway. The procedure commenced upon completion of engine start. During the procedure, the air conditioning pack switches were reset to AUTO, a task allocated to the First Officer as per the FCOM procedure (Appendix A, Figure A1). Upon completion of the procedure, the Captain was required to call for the before taxi checklist. The pack switches were not included in the before taxi checklist (Appendix B, Figure B1).
At about the same time as the commencement of the procedure, the Captain recalled that they discussed the method of confirming the ground crew had removed the steering bypass pin. The discussion was in reference to differences between the ground and flight manuals, and that the ground crew expect a certain procedure for confirmation that crew have acknowledged removal of the steering bypass pin. The crew did not recall any other possible distractions or disruptions to the before taxi procedure.
By take-off, the First Officer had not reset the pack switches to AUTO. The crew did not notice the incorrect configuration and packs switches remained OFF.
Take-off procedure
The take-off procedure (shown at Appendix A, Figure A2) included a step for the pilot monitoring (PM) to set or verify that engine bleeds and air conditioning packs were operating. The FCOM did not explain what set or verify meant, however, Tiger training pilots reported that this should be achieved by visually identifying that the switches were in the correct position and viewing the cabin altitude and differential gauges to ensure they were giving expected readings. Following completion of the procedure, the after take-off checklist (shown at Appendix B Figure B1) is required to be called. This checklist included confirmation steps for both the engine bleeds and air conditioning packs.
Appendix A, Figure A2 states that this final part of the procedure is to take place after flap retraction is complete, which in this case was about 1138.[6] At 1139, air traffic control (ATC) issued the aircraft several instructions, cancelling the SID, directing a turn to 150° and a climb to Flight Level 280 (FL280). At 1140, ATC cleared the aircraft to track direct to Wollongong.
Also during this timeframe, the Captain recalled that he rushed the after take-off checklist in order to discuss the mitigation of traffic threat associated with the noise abatement departure procedure (NADP) being flown, specifically with regard to the high rate of climb induced by the NADP and their initial altitude restriction of 5,000 ft.[7] The Captain recalled looking at the pack switches and the cabin altitude and differential gauges, but remembered the gauge readings being as expected and did not identify that the pack switches were OFF.
While the PM was required to read and respond to the checklist, both pilots were required to verify each item of the checklist. The First Officer (PF) explained that his workload in flying the aircraft during the busy departure prevented him from checking pressurisation, as would normally be his habit.
Climb procedure
The FCOM climb procedure did not include pressurisation checks. The last formal check was during the after take-off checklist. Boeing reported that following the after take-off checklist, their recommended checks did not include a formal check of pressurisation or aircraft warnings associated with incorrect configuration of the pressurisation system until the cabin altitude warning was triggered at 10,000 ft cabin altitude. If the cabin altitude warning was triggered, the crew were required to conduct the associated immediate action checklist to mitigate the safety risk.
Tiger training captains reported that informal periodic checks of the pressurisation are taught during operational conversion course and line training. Checks included visually identifying switch positions and expected gauge indications based on FCOM guidance for the differential pressure limits at various altitudes. In this case, the Captain specifically mentioned noting that the differential was where he expected it to be based on current situation and previous flights, explaining his habit up until then was to look early in climb for expected readings.
Related occurrences
The following occurrences involving Boeing 737s are recorded in the ATSB database.
ATSB Occurrence 200402855
While on climb, the crew noticed that the pressurisation system was not operating. The aircraft was descended and returned to Melbourne for a landing. The air conditioning packs had not been turned on after engine start.
ATSB Occurrence 200506419
As the aircraft climbed through FL130, the cabin altitude warning horn activated indicating that the cabin altitude was at 10,000 ft. The crew obtained clearance to descend to 9,000 ft. The crew then noticed that the pressurisation mode selector was in manual and selected it to auto. The flight continued normally.
ATSB Occurrence 201104003
During climb, the cabin depressurised, and the passenger oxygen masks deployed. The aircraft descended to 10,000 ft and returned to Sydney. Engineering investigation revealed the cause to be incorrect switching of the pressurisation system.
Other occurrences
There are several similar occurrences involving Boeing 737s overseas that departed with an incorrectly configured pressurisation system. In most cases, the error was detected following system warnings with the exception being the Helios Airways accident in 2005. Helios Airways flight HCY522, a Boeing 737-31S departed Larnaca, Cyprus for Prague, Czech Republic. Cabin pressurisation control was in the manual setting for departure and not identified by the crew through procedures or checklists. Whilst the crew heard the cabin altitude warning horn, they believed it to be the take-off configuration warning and commenced trouble shooting for that. Subsequently, the crew succumbed to hypoxia and the aircraft continued the flight on autopilot until it exhausted its fuel supply and crashed, killing all on board.
Whilst being similar in that an incorrect configuration was not identified through multiple procedures and checklists, the crew of Flight TT229 (this occurrence), like those of the other Australian occurrences documented above, did not confuse the cabin altitude warning, quickly identified the issue and corrected it without delay.
Incorrectly configured air conditioning packs (OFF instead of AUTO) resulted in the cabin altitude rising above 10,000 ft, triggering the cabin altitude warning. There were no technical or performance reasons for the packs to be OFF and once returned to the AUTO selection, the cabin pressurisation returned to normal. Flight data recorder data, supported by crew interviews, confirms that the packs switches being OFF was the only reason for the cabin altitude warning.
Procedure and checklist management
Before Taxi Procedure
The First Officer did not turn the packs to AUTO during the before taxi procedure. This was contrary to the FCOM procedure but there was no evidence to suggest other deviations took place. The Captain did not notice this error.
The First Officer had significant experience on other aircraft types and his training records at Tiger did not show that an error of this type had occurred previously. The lengthy break in flying roles and significant gaps in the training program may not have allowed the First Officer sufficient time to consolidate the procedures to an intuitive level that was resilient to error. Acquired skills decay over time and consistent rehearsal and application are essential for long-term retention. Despite this, the First Officer had demonstrated satisfactory performance thus far in his training, having been assessed as no longer requiring a safety pilot.
The Captain’s discussion of the ground disconnect requirements may have served as a distraction for the First Officer. The Captain could not recall exactly when this discussion occurred, but the procedure position was approximately the same time as the First Officer’s required actions to reconfigure the pack switches following engine start. Distraction can interrupt the procedural sequence. As the before taxi procedure was conducted from memory, pilots were required to remember at what point the interruption occurred in order to recommence the sequence. This may lead to further error if there is not a conscious recognition of that distraction and interruption.
The ATSB noted that the before taxi checklist did not include checks for the correct configuration of pack switches. However, the Boeing 737 has supplementary procedures for a no engine bleed or unpressurised take-off, which required the crew to reconfigure the air bleeds and packs after take-off. If this was missed or done incorrectly, then the after take-off checklist was designed to capture the error. According to Boeing, the after take-off checklist is also in place to catch a bleed/pack configuration error made during the before taxi procedure. Consequently, absence of this step in the before taxi checklist was not considered as being contributory.
The ATSB also considered whether the First Officer’s previous experience as a captain, and the recent experience of the crew having flown together contributed to a relaxed level of supervision by the Training Captain. The Captain and First Officer had flown together on three occasions in the previous week. The Captain was well aware of the First Officer’s flying experience and had been satisfied with his previous performance such that he had a reasonable level of confidence in First Officer. The Captain explained that the First Officer had got it right before and that he (Captain) may have relaxed his supervision of the First Officer thus contributing to him not identifying the error at this time. Although a highly experienced pilot, the First Officer was still a trainee on the Boeing 737 and as such, required vigilant supervision of a training captain. This is a crucial defence against error by a trainee pilot.
The combination of relative inexperience, disjointed training, distraction and lapses in supervision appear to have contributed to the omission of the pack switches step during the before taxi procedure.
After Take-off Checklist
The take-off is a high workload phase of flight and Sydney is known to be a busy airport to operate from. The procedures to ensure that the air conditioning packs were correctly configured placed significant reliance on the after take-off checklist to achieve this. The high workload experienced by the crew included the procedural actions required by the departure flown and the training being undertaken. This workload was increased by the operational discussions that took place which appeared to have distracted the crew from correctly completing the procedure and subsequent checklist.
Whilst the Captain reported that he did look at the gauges and switches, he is likely to have had a low level of expectancy of error with regard to the pack switches. His confidence in the First Officer’s performance during training and not knowing the First Officer to have made that same mistake before is likely to have caused him to not perceive the error, despite looking at the switches. This would have been exacerbated by rushing the checklist as he reported.
In this case, the pressurisation controller was correctly set and functioned normally by closing the outflow valve to prevent the escape of cabin air. This likely resulted in a natural lag in cabin altitude rising since the controller closed the outflow valve to prevent the escape of cabin air, but additional air via the air conditioning packs was not available to pressurise the aircraft. The Captain specifically mentioned that when he looked at the gauges, the cabin differential and altitude were as expected. Considering the timing of the check (early stage of climb) and the gauges reading as expected, this probably indicated to him that the pressurisation system was correctly operating and gave him no reason to believe that the pack switches were OFF.
The investigation also considered the effect of viewing the air conditioning and pressurisation panels from the left seat. In this case, the Captain may not have moved enough, or at all, to allow a complete view of all gauges and switches, especially given he described rushing the checklist. It is likely that his low expectation of error was reinforced by the cabin differential and altitude appearing to be as expected.
Workload management and disruption also affected the First Officer’s ability to accurately conduct the checklist while flying the aircraft, especially considering the operational discussion that took place during that time. The operational requirements of ATC are considered normal but in light of the induced additional workload due to discussion and distraction, the First Officer did not check pressurisation as would normally occur.
Findings
From the evidence available, the following findings are made with respect to the incorrect configuration of a Boeing Company 737-8FE, registered VH-VUB, that occurred near Sydney, New South Wales on 12 July 2018. These findings should not be read as apportioning blame or liability to any particular organisation or individual.
Contributing factors
The aircraft did not pressurise due to an incorrectly configured pressurisation system.
The incorrect configuration was the result of procedures and checklists not being managed appropriately.
Safety actions
Additional safety action
Whether or not the ATSB identifies safety issues in the course of an investigation, relevant organisations may proactively initiate safety action in order to reduce their safety risk. The ATSB has been advised of the following proactive safety action in response to this occurrence.
Action taken by Tiger Airways Australia
Tiger Airways Australia (Tiger) advised the ATSB of the following safety actions taken as a result of this occurrence:
Tiger issued a flight crew notification to flight crew highlighting the need to adhere strictly to standard operating procedure (SOP). The notification explained that on some occasions, the checklist was completed but there had not been conscious verification of the action taken. Tiger reminded flight crew that when conducting checklists, to be mindful to challenge—verify—respond and that verification is to be a very deliberate act undertaken by both the Pilot Flying and Pilot Monitoring.
A summary of Tiger’s internal investigation was included in a quarterly safety publication.
Tiger’s flight standards team is undertaking a review of the Boeing 737 checklist and if additional checks of the pressurisation system is required.
Tiger’s flight training team is undertaking a review of safety pilot requirements.
The Head of Flight Operations and Head of Safety and Security conducted a road show to present the importance of SOPs and checklist discipline.
Tiger introduced a flight operations safety assurance program to undertake flight deck observations to identify potential adverse trends in procedural compliance. Tiger advised only minor observations were noted.
Tiger established a program with Virgin Australia to conduct line training for Boeing 737 pilots in order to ensure crew have continuous training required to embed skills and knowledge.
Tiger have introduced additional pressurisation event training.
Sources and submissions
Sources of information
The sources of information during the investigation included:
Flight crew of VH-VUB
Flight data recorder from VH-VUB
Tiger Airways Australia (Tiger)
Boeing
Airservices Australia.
Submissions
Under Part 4, Division 2 (Investigation Reports), Section 26 of the Transport Safety Investigation Act 2003 (the Act), the Australian Transport Safety Bureau (ATSB) may provide a draft report, on a confidential basis, to any person whom the ATSB considers appropriate. Section 26 (1) (a) of the Act allows a person receiving a draft report to make submissions to the ATSB about the draft report.
A draft of this report was provided to the flight crew, Tiger Airways, Boeing, and the Civil Aviation Safety Authority.
Submissions were received from the flight crew, Tiger Airways and Boeing. The submissions were reviewed and where considered appropriate, the text of the report was amended accordingly.
Appendices
Appendix A – B737 FCOM Normal Procedures – Amplified Procedures
Figure A1: Before Taxi Procedure extract
Source: Tiger Airways 737 FCOM
Figure A2: Take-off Procedure extract
Source: Tiger Airways 737 FCOM
Appendix B – B737 Normal Checklist
Figure B1: Before Taxi and After Take-off Checklists
Source: Tiger Airways QRH
Appendix C – Recorded data from the incident flight 12 July 2018
Figure C1: Flight data – Cabin Altitude > 10,000 ft Warning
Source: ATSB
Figure C2: Flight data – Air conditioning pack switch position
Source: ATSB
Purpose of safety investigations
The objective of a safety investigation is to enhance transport safety. This is done through:
identifying safety issues and facilitating safety action to address those issues
providing information about occurrences and their associated safety factors to facilitate learning within the transport industry.
It is not a function of the ATSB to apportion blame or provide a means for determining liability. At the same time, an investigation report must include factual material of sufficient weight to support the analysis and findings. At all times the ATSB endeavours to balance the use of material that could imply adverse comment with the need to properly explain what happened, and why, in a fair and unbiased manner. The ATSB does not investigate for the purpose of taking administrative, regulatory or criminal action.
Terminology
An explanation of terminology used in ATSB investigation reports is available here. This includes terms such as occurrence, contributing factor, other factor that increased risk, and safety issue.
Publishing information
Released in accordance with section 25 of the Transport Safety Investigation Act 2003
Ownership of intellectual property rights in this publication
Unless otherwise noted, copyright (and any other intellectual property rights, if any) in this report publication is owned by the Commonwealth of Australia.
Creative Commons licence
With the exception of the Coat of Arms, ATSB logo, and photos and graphics in which a third party holds copyright, this publication is licensed under a Creative Commons Attribution 3.0 Australia licence.
Creative Commons Attribution 3.0 Australia Licence is a standard form licence agreement that allows you to copy, distribute, transmit and adapt this publication provided that you attribute the work.
The ATSB’s preference is that you attribute this publication (and any material sourced from it) using the following wording: Source: Australian Transport Safety Bureau
Copyright in material obtained from other agencies, private individuals or organisations, belongs to those agencies, individuals or organisations. Where you wish to use their material, you will need to contact them directly.
On 4 June, 2018, about 1152 PDT (Pacific Daylight Time), a GippsAero GA10, VH-XMH, was substantially damaged following a loss of control during spin testing and subsequent impact with terrain at Mojave, California.
The crew were assessing the aircraft’s spin characteristics with a belly-mounted cargo pod installed. An attempt to deploy the spin chute to aid the spin recovery failed, resulting in the crew electing to bail out. The two crew successfully exited the aircraft and deployed their parachutes whereupon they landed safely, but suffered minor injuries. The aircraft was operating under an Australian experimental certificate and a Federal Aviation Administration (FAA) special flight authorisation.
The NTSB have released the final report into this investigation.
Any enquires relating to the investigation should be directed to the NTSB: www.ntsb.gov
On the 26 June 2018, QantasLink was operating a De Havilland Aircraft of Canada DHC-8-400 aircraft, registered VH-LQD, on a scheduled passenger service from Mackay to Brisbane, Queensland. As the aircraft approached the top of descent, the right engine shut down uncommanded. The crew were unable to feather the propeller and it continued to rotate at low speed, in a coarse pitch condition. The crew actioned the ‘Non-Normal’ checklist and continued to Brisbane Airport where the aircraft landed safely.
What the ATSB found
The ATSB found that a bearing within the engine’s intercompressor case fractured, leading to an automated in-flight engine shutdown. Despite detailed technical examination, the reason the propeller did not feather could not be established. However, the operator identified that the one engine inoperative performance reduction between a counter‑weight coarsened propeller and a fully feathered propeller was only 0.5–0.9 per cent.
The ATSB also found that aircraft maintainers missed an opportunity to ground the aircraft when, on the day before the flight, metal debris was detected on the turbomachinery chip detector. It was identified that the procedures in the aircraft maintenance manual were confusing and ambiguous. This probably led to a misunderstanding by the personnel within the approved maintenance organisation and the continuing airworthiness maintenance organisation, which allowed the aircraft to be released to service.
The ATSB also found that the approved maintenance organisation personnel were not recording all the work performed during regular inspections. This meant that the maintenance information system was incomplete and an opportunity to identify the developing bearing degradation was missed.
What's been done as a result
As a result of this occurrence, QantasLink released a technical advisory bulletin to pilots advising of the incident and warning that the propeller may not always feather as practiced in the simulator.
They have also introduced a system to monitor metallic debris found on chip detectors. This will assist trend identification and ensure analysis results can be accessed quickly in the event of a reoccurrence of debris. Additionally, the organisation contracted to assist with engine monitoring now has a function, which allows monitoring and alerting of fault messages within recorded engine and flight data.
In addition, QantasLink have issued an airworthiness standing order to all certifiers within the approved maintenance organisation to introduce a single certification statement standard for all maintenance. They have also introduced a documentation check to be completed by supervisors after maintenance is completed. A recurrent course is also under development for all certifiers to ensure they remain current with all aircraft maintenance documentation recording requirements.
The engine manufacturer Pratt & Whitney Canada advised they have standardised the wording relating to debris analysis guidance in the next revision of the aircraft maintenance manual. The ATSB acknowledges the improvement this will make, but considers that there is still ambiguity and the potential for the confusion in the procedure.
As such, the ATSB has issued a recommendation to Pratt and Whitney Canada to improve the clarity of procedures within the chip detector debris analysis section of the aircraft maintenance manual.
Safety message
When performing safety‑critical tasks like aircraft maintenance, it is very important that procedures are clear and unambiguous in order to avoid misinterpretation and error such as those that occurred in this incident.
The occurrence also illustrates that the high reliability of modern aircraft maintenance depends on accurate record keeping of all performed tasks to both communicate what has been done and assist in trend identification.
The occurrence
What happened
On the 26 June 2018, a QantasLink De Havilland Aircraft of Canada (formerly Bombardier Inc.) DHC-8-402, registered VH-LQD (LQD), was operating a regular passenger service within Queensland from Brisbane to Mackay and returning to Brisbane. The flight crew consisted of two captains, one in the right seat who was training to get an approval to operate the aircraft from the right seat, and a training captain who was pilot in command.
When the flight crew arrived at LQD to begin their pre-flight preparations, they identified a number of maintenance requirements for the right engine related to ongoing inspections. These requirements were for advice-only to the flight crew. After completing their pre‑flight preparations, they flew from Brisbane to Mackay with no issues.
The return flight to Brisbane had four crewmembers and 74 passengers on board. For this flight, the training captain was the pilot monitoring (PM) and the trainee captain, acting as first officer, was the pilot flying (PF).[1]
At approximately 1749 Eastern Standard Time,[2] as the aircraft approached the top of descent at FL 250,[3] the aircraft yawed and there was a warning chime. The flight crew identified that the full authority digital engine control (FADEC) had shut down the right engine without warning. Due to their concern about the resultant windmilling propeller,[4] the crew actioned the engine shutdown procedure from memory rather than by using the quick reference handbook. As this did not result in the propeller feathering,[5] they selected the alternative feathering system. They observed the ‘feather pump running’ advisory light was illuminated, indicating that the alternative feather pump was working. The crew reported the propeller continued to turn at approximately 270 RPM and that the remainder of the checklist items were actioned.
The crew assessed the available landing options and decided that despite being slightly closer to the Sunshine Coast Airport, they would continue to Brisbane as they were prepared and had briefed for that approach. As expected, the aircraft could not maintain speed at FL 250 with one engine inoperative, so they slowed towards 190 kt. The PM contacted air traffic control (ATC) to advise them of the situation and requested a descent to FL 200, which was approved. They then made a PAN PAN[6] call and advised ATC that emergency services would be required on landing.
The PM contacted the cabin crew to advise them of the situation and requested that they prepare the cabin and passengers. A public announcement was then made to the passengers.
The propeller was still rotating at approximately 270–300 RPM, but as the aircraft descended and the airspeed increased, the propeller rotations increased to approximately 660 RPM. To reduce the RPM, the flight crew slowed the aircraft. During the descent, the batteries in the PF’s noise cancelling headset failed. It was reported that, as the batteries were being changed, the PF could hear what appeared to be grinding from the rotating propeller. Consequently, the PM contacted the company’s engineering section to ensure all appropriate actions had been completed.
About 45 km from the airport, the training captain took over flying the aircraft. As they descended through 5,000 ft, the aircraft exited cloud and the crew sighted the airport. They requested radar vectors for the Runway 19 instrument landing system, to ensure they were set up to conduct a stabilised approach. They then advised ATC that they expected to conduct a normal landing but as the propeller had not feathered, they could not guarantee missed approach performance and so would not conduct a missed approach.
At 1845, the aircraft landed and was stopped on the second high speed turnoff. This allowed the aviation rescue firefighting (ARFF) service to inspect the engine for excessive residual heat or oil leaks. Following advice from the ARFF that there were no observed engine issues, the aircraft was cleared to taxi to the bay.
The flying pilot observed that the only handling difference from an engine failure practiced in the simulator was that when the operating engine was selected to flight idle during the landing, the aircraft yawed significantly more than expected. He commented that it required almost full right rudder to maintain the aircraft on the centreline.
The aircraft was equipped with two Pratt & Whitney Canada PW150A engines, each driving a Dowty Propellers’ six-blade R408 propeller system. The affected engine, serial no. PCE-FA0815, was sent to a Pratt & Whitney Canada engine facility in Canada for inspection. Their examination identified that the uncommanded engine shutdown was the result of a No. 30 bearing fracture. Due to the extent of damage, it was not possible to establish the bearing fracture mechanism.
The No. 30 bearing is part of the tower shaft for the accessory gearbox that runs the main engine oil pump and fuel metering unit, among other systems.
Figure 1: No. 30 bearing broken cage pieces, damaged ball bearings and spalling on the inner and outer bearing races
Source: Pratt & Whitney Canada report received from the operator
The propeller pitch control unit, propeller overspeed governor, and auxiliary feather pump were sent to the relevant manufacturer for inspection. The auxiliary feather pump was not test run prior to being disassembled and inspected however, nothing was found during the inspections that contributed to the propeller not feathering.
The operator advised that while the propeller did not feather, and the reason for this could not be identified, the propeller did go to a safe coarse condition due to the counterweights in the propeller system, as it would if there was no oil in the propeller system. The manufacturer’s analysis showed that with one engine inoperative, the difference between a counterweight coarsened propeller and a fully feathered propeller was a 0.5–0.9 per cent decrease in aircraft performance.
Airworthiness and maintenance
The operator had a Civil Aviation Safety Authority-approved Civil Aviation Safety Regulation (CASR) Part 42 continuing airworthiness maintenance organisation (CAMO). The CAMO maintained the aircraft maintenance program, which included:
maintenance planning
the reliability program
recording of data in the maintenance information system.
The operator also had a CASR Part 145 approved maintenance organisation (AMO) to perform the required maintenance on the aircraft.
The CAMO planned the maintenance actions and issued work orders to the AMO. The work orders contained task cards that directed the AMO to conduct specific tasks. Personnel from the AMO were required to:
complete the task
record what work was completed
sign the task as complete
attach the task card to the work order.
The overarching work order was then signed as being complete and a summary recorded. Those records were then returned to the CAMO to assess the completed work and record the information in the maintenance information system. Information in the system was available to both CAMO and AMO personnel.
Engine monitoring systems
During the 12 months prior to the incident, the operator had been introducing a new engine monitoring system across their DHC-8 fleet—the flight-data acquisition, storage and transmission (FAST) system. This system provided automated transmission of flight and engine health data to an organisation contracted to provide technical support. An automated email was sent to selected people within the CAMO if a fault was generated within the critical (as specified by the engine manufacturer) health data.
At the time of the incident, the procedures for what data was emailed and how to use the data had not been implemented. Since this occurrence, the installation of the FAST system has been completed across the fleet. Procedures on how to deal with notifications generated by the FAST system have also been introduced.
The FAST system had been installed on LQD. The system was producing data, and emails relating to faults were being sent to selected people within the CAMO.
While the FAST system was being installed across the fleet, the operator conducted regular engine trend-monitoring inspections as per the approved maintenance program. This included a work order to conduct routine interrogation of the engine central diagnostic system (CDS) by personnel within the AMO every 50 hours. Each work order contained a task card instructing the AMO to check, investigate and clear CDS faults and to record the relevant faults. Relevant faults codes included those which occurred during normal operations:
resulting in the subsequent reset of a system in accordance with the De Havilland Supplemental Procedure Ground Reset Guide (SPGRG)
or maintenance activities and required a subsequent maintenance action to clear.
Maintenance actions prior to the uncommanded engine shutdown
On the 13, 18 April, and 27 May, personnel within the CAMO received automated emails from the contracted organisation notifying them of ‘Fault code 938 – Turbomachinery chip detector’ generated by the FAST system, for the right engine on LQD. No actions were taken in response to these emails, and as the procedures were not yet in place, no action was required.
On the 13 April, earlier on the day the CAMO received the first email relating to the fault, personnel working within the AMO signed a work order as complete, recorded that there were no defects and ticked the ‘Fault code(s)’ ‘No’ box on the task card. The fault, recorded in the email received by the CAMO, was most likely generated after this check was completed. This fault was probably cleared on the 18 April, when a separate powerplant message was cleared, and the fault generated again on a flight later the same day resulting in the second email being forwarded to the CAMO. An inspection on 20 April was also completed with no faults recorded and the ‘Fault code(s)’ ‘No’ box ticked.
During an inspection on 26 April, ‘Fault code 938 – Turbomachinery chip detector’ was detected on the CDS. On further inspection, ‘minor fuzz’ was detected on the turbomachinery chip detector. The AMO categorised the debris as ‘permitted’, which was described in the aircraft maintenance manual as a ‘small quantity of hair like filaments (fuzz) or powder provided there has been no prior history of debris (allowable or non-allowable) within the last 400 hours’.
After consulting the aircraft maintenance manual, the engine was returned to service. The debris was not analysed, and there was no requirement to do so. The fault was recorded in the technical log, and the fault code ‘No’ box was ticked on the task card and work order (Figure 2).
Figure 2: Example of two task cards from different maintenance inspections
The task card on the left references the task in the technical log and shows that the fault code ‘No’ box is ticked although a fault code was present. The task card on the right is the task on the 30 May 2018, where the fault code 938 had been received and cleared in the CDS and no information about the maintenance task had been recorded on the task card. These tasks were completed by different engineers. Source: Operator annotated by ATSB with identifying information redacted.
The AMO conducted nine more inspections of the CDS with no defects recorded and the fault code ‘No’ box ticked on each occasion. Different personnel within the AMO completed these inspections.
After the incident, the operator interrogated the CDS to investigate why the FAST system had recorded 938 fault codes, but no such fault codes were recorded during most of the 50 hourly routine tasks. The interrogation found that during the maintenance task on the 30 May, the ‘Fault code 938 – Turbomachinery chip detector’ had been cleared in the CDS. This indicated that when the maintainer interrogated the CDS, they identified fault code 938, and had cleared it.
The AMO could not provide evidence that further actions had been taken in relation to CDS ‘Fault code 938 – Turbomachinery chip detector’ although they stated that it was highly likely that the appropriate maintenance actions had taken place when the faults were cleared.
This omission in the recording of maintenance had not been detected by the AMO, as there was no requirement to ensure that the work completed was recorded in the paperwork correctly. It was also not detected within the CAMO, as personnel working within the technical records area have no way of knowing what unscheduled maintenance was completed unless it was written on a task card.
A review of tasks cards found a number on which the maintainer had listed the fault codes that had been detected and the work completed to clear those codes, but the fault code ’No’ box was ticked (see Figure 2). This was not detected during the assessment of the paperwork by the technical records area, as there was no requirement to check this specific area of the form. The AMO could not explain why the same error was made by different maintainers over a number of inspections.
There is a regulatory requirement that an operator ensure that all stages of maintenance are complete and recorded, with details of the maintenance conducted, before an aircraft is released to service. There is also a regulatory requirement that licenced aircraft maintenance engineers’ record all maintenance conducted within the continuing airworthiness records system before an aircraft is released to service.
Oil sampling trial
On 18 May, an oil sample was taken from the occurrence engine as part of a trial being conducted by the engine manufacturer. There were no requirements on the operator to collect the sample and no procedures on how quickly the sample was to be sent for analysis to the engine manufacturer’s facility. The sample was sent to the manufacturer’s facility on 25 June. The results, which indicated that the bearing and gear material were above the set threshold, were not received by the operator until 12 September.
Maintenance actions immediately prior to the uncommanded engine shutdown
Overnight on 25 June, the FAST system recorded three fault codes - ‘Fault code 938 – Turbomachinery chip detector’, ‘Fault code 915 - Main Oil Filter’ and ‘Fault Code 932 - Scavenge Oil Filter’. Due to the system’s set-up, personnel from the CAMO received an automated email from the contracted organisation notifying them of ‘Fault code 938 – Turbomachinery chip detector’. On receipt of this email, they raised an urgent technical service request (UTSR) which was sent to the AMO.
During scheduled maintenance on the evening of 25 June, personnel from the AMO also noted that the CDS had recorded ‘Fault code 938 – Turbomachinery chip detector’, ‘Fault code 915 - Main Oil Filter’ and ‘Fault Code 932 - Scavenge Oil Filter’. As a result, they conducted an inspection of the engine.
Personnel from the AMO found debris on the turbomachinery chip detector and the main oil filter and classified this as ‘Non-Permitted Category 3’ debris (dark irregular magnetic chips or small clusters of magnetic flakes or all other debris not defined elsewhere, Figure 3). This required that a sample of the debris be sent to a laboratory for analysis.
They then, in consultation with personnel from the CAMO, used a flow chart to determine whether to return the engine to service. This flow chart indicated that if the turbomachinery had a history of contamination within the previous 400 hours, they must ‘wait for the results of the previous lab report prior to continuing operation’. The personnel from the AMO and CAMO together decided not to include the previous permitted ‘minor fuzz’ found on the chip detector on the 26 April, which was within the previous 400 flight-hours, due to an assessment that it did not constitute an occurrence of debris. There was no record in the maintenance information system that ‘Fault Code 938 – Turbomachinery chip detector’ had been received and cleared on previous occasions, as this had not been recorded on the task cards.
The personnel from the AMO and CAMO discussed the steps in the flow chart procedure and assessed that with no history of debris, the engine could be returned to service with a 20 flight‑hour limitation. The debris was sent for laboratory analysis. The report with the results of the debris analysis, which showed the sample contained bearing material, was received by maintenance personnel while the aircraft was in cruise, 35 minutes before the engine shutdown.
The personnel from the AMO and CAMO did not consult with the engine manufacturer during this process as it was not a requirement when following the Aircraft Maintenance Manual.
Debris assessment
The aircraft maintenance manual PSM 1-84-2, covered the classification and required actions to be taken when debris was detected on the turbo machinery chip detector. As part of their investigation into the incident, the operator reviewed the relevant sections of the manual and found a number of ambiguities in terminology and required actions.
In the section to classify the debris found in the turbomachinery and reduction gearbox oil system (subtask 79-22-00-750-009 table 601, Figure 3), the debris classification table used the terms ‘permitted’ and ‘non-permitted’ to classify the debris. However, in the definitions, the terms were changed to ‘allowable’ or ‘non-allowable’. The next section interchangeably used the terms ‘debris’ and ‘contamination’, ‘bearing material’ and ‘material’.
Figure 3: Extract of task 79-22-00-750-009 table 601 giving criteria for classification of debris found in oil system
The table shows the debris type and definition.
Source: Aircraft manufacturer
In the classification system, category 3 debris was smaller than category 1 debris. Unlike category 2 debris, the category 3 debris definition did not consider if there was a history of debris within the previous 400 hours.
The aircraft maintenance manual directed the user to a flow chart that set out the steps to be taken when debris was detected on the turbomachinery chip detector and/or the main oil filter. Step 16 in the flow chart (Figure 4) asked if the turbomachinery had ‘a history of contamination within 400 hours?’. This step changed the term from ‘debris’ to ‘contamination’ and it also did not include the words ‘allowable’ or ‘non-allowable’.
Figure 4: Extracts of flow chart of decision-making map for debris on turbomachinery chip detector
Source: Aircraft manufacturer
If the answer to step 16 was ‘yes’ then the flow chart directed the user to step 29 (Figure 5). This asked if a laboratory report was available for the previous event of contamination and if the answer was ‘no’, directed the user to go to step 30. Step 30 stated ‘wait for the results of the previous lab report prior to continuing operation’.
Figure 5: Extracts of flow chart of decision-making map for debris on turbomachinery chip detector
Source: Aircraft manufacturer
The operator found that the personnel from the ‘AMO and CAMO were then faced with a situation whereby the guidance required them to wait for the results of a debris analysis that had not taken place’. This step also directed the user to Note 6 (Figure 6) which directed the user to obtain an analysis of the ‘last’ sample. The operator noted that the use of the word ‘last’ here was open to interpretation, as this could be interpreted as ‘last’ being the previous debris or ‘last’ being the latest debris. It also did not specify that the debris could be ‘allowable’ or ‘non-allowable’, as specified in other sections of the manual.
Figure 6: Extract from aircraft maintenance manual Note 6
Source: Aircraft manufacturer
To assess the clarity of the procedure, the operator conducted an informal survey of other maintenance staff using this documentation. They found that the maintenance staff came to different conclusions as to the action to be taken.
Engine manufacturer’s comments
The engine manufacturer considered that the in-flight shutdown of the turbomachinery was a preventable occurrence. They classified the debris identified on 25 June as ‘Non-permitted Category 2’ (Any quantity of hair like filament (fuzz) or powder if the module has a history of generating debris (allowable or non-allowable) within the previous 400 hours). They advised that the ‘minor fuzz’ detected on the 26 April should have been classified as ‘previous history’ for the purpose of considering the debris identified on 25 June. This would have required the aircraft to be grounded until the results from the analysis of the debris was received.
The engine manufacturer also advised that worldwide, this was the third fracture of the No. 30 bearing since May 2013, when the entire fleet had incorporated service bulletin SB35216. There have been over 10 million hours flown worldwide since the service bulletin was incorporated. In all three events, it was impossible to detect what had led to the bearing fracture, but two of the three events had resulted in uncommanded inflight engine shutdowns.
Safety analysis
Introduction
During cruise flight, a bearing fracture within the intercompressor case resulted in an automated shutdown of the right engine. Due to the extent of the damage, and consistent with previous similar occurrences, it was not possible to establish the bearing fracture mechanism.
After the uncommanded engine shutdown, the propeller did not feather as expected, instead going into a design coarse position. This decreased the aircraft’s one engine inoperative performance by up to 0.9 per cent from that expected had the propeller feathered. Detailed technical inspection was unable to identify the reason why the propeller did not feather.
This analysis will discuss the indications of the deterioration of the bearing and the maintenance actions in the months and days preceding the uncommanded engine shutdown. It also examines the maintenance procedure used to determine whether the aircraft should be grounded pending the analysis of the debris found on the turbomachinery chip detector.
Maintenance action
During a number of regular inspections leading up to the detection of what maintenance personnel considered to be category 3 chip detector debris, different maintainers from the operator’s approved maintenance organisation (AMO) had identified ‘Fault Code 938 – Turbomachinery Chip Detector’. For reasons that could not be determined, and contrary to the required procedure, these faults were cleared without recording the fault and maintenance actions in the task card. The associated fault code ‘No’ box was also ticked on each occasion.
There was no process, nor was there a requirement within the AMO, to ensure that the completed maintenance related to fault codes were correctly recorded in the maintenance documentation. Additionally, there was no way or means for personnel within the continuing air maintenance organisation (CAMO) to detect when unscheduled maintenance was completed but not documented. They also did not have a procedure to ensure that when there were faults recorded on the task card, that the fault code ‘Yes’ box was ticked.
As a result, the opportunity to identify the developing debris trend associated with the gearbox bearing deterioration was missed.
On the evening of 25 June, ‘Fault Code 938 – Turbomachinery Chip Detector’ fault was detected, and debris found on the turbomachinery chip detector and the main oil filter. The debris was classified as ‘Non-permitted Category 3’ debris. In consultation, personnel from the CAMO and the AMO decided that the previous instance of debris (26 April) did not constitute a history of debris.
Based on that assessment, they used the information provided in the aircraft maintenance manual to release the engine to service with a 20 flight-hour limitation while a sample of the debris was sent for analysis.
The engine manufacturer’s intent was that the prior ‘fuzz’ should have been considered a history of debris. This would have required the debris detected on the 25 June to be analysed and the results reviewed, before the aircraft was released to service. Had that occurred, the uncommanded engine shutdown would probably have been avoided.
Procedural confusion
The aircraft maintenance manual procedures for assessing chip detector debris were written in a way that could cause confusion and error. For example, in describing the classification of the debris, the ‘Non‑permitted Category 3’ description did not mention a previous history of debris. This allowed the user to read the classification description in isolation and, as in this case, disregard the previous instance of ‘permitted’ debris. This was not the manufacturer’s intended interpretation.
Additionally, some of the required maintenance steps relied on the results of debris analysis but it was not always clear what debris was being referred to—current or previous. Terminology was also interchanged without explanation.
These aspects of the assessment flowchart most likely influenced the maintenance personnel’s decision to discount the previous history and release the engine to service with a 20 flight-hour limitation, while they waited for the results of the debris detected on the 25 June to be analysed.
Findings
ATSB investigation report findings focus on safety factors (that is, events and conditions that increase risk). Safety factors include ‘contributing factors’ and ‘other factors that increased risk’ (that is, factors that did not meet the definition of a contributing factor for this occurrence but were still considered important to include in the report for the purpose of increasing awareness and enhancing safety). In addition ‘other findings’ may be included to provide important information about topics other than safety factors.
Safety issues are highlighted in bold to emphasise their importance. A safety issue is a safety factor that (a) can reasonably be regarded as having the potential to adversely affect the safety of future operations, and (b) is a characteristic of an organisation or a system, rather than a characteristic of a specific individual, or characteristic of an operating environment at a specific point in time.
These findings should not be read as apportioning blame or liability to any particular organisation or individual.
From the evidence available, the following findings are made with respect to the uncommanded engine shutdown involving a De Havilland DHC-8, registered VH-LQD, near Brisbane, Queensland, on 26 June 2018.
Contributing factors
During cruise, a bearing in the intercompressor case fractured, leading to an automated in‑flight engine shutdown.
Following detection of category 3 debris on the chip detector and the oil filter, the maintenance personnel discussed a previous detection of debris but incorrectly concluded that it did not need to be considered. This resulted in the aircraft being released to service, and the uncommanded engine shutdown, within the 20 flight-hour limitation.
The procedures in the aircraft maintenance manual relating to chip detector debris analysis were written in a way that could cause confusion and error. This probably influenced the actions of the maintenance personnel to release the aircraft to service with a deteriorating bearing. [Safety issue]
Other safety factors
Multiple maintenance personnel did not record 'Fault code 938 - turbomachinery chip detector' as required when conducting 50 hourly inspections.
There were no processes within the aircraft maintenance organisation or QantasLink to ensure that maintenance tasks associated with fault codes were correctly documented.
Other findings
After the uncommanded engine shutdown, the propeller did not feather. Instead, it moved to a safe coarse position, which resulted in a decrease in the aircraft’s one engine inoperative performance of 0.5‑0.9 per cent compared to a feathered propeller.
Safety issues and actions
Central to the ATSB’s investigation of transport safety matters is the early identification of safety issues. The ATSB expects relevant organisations will address all safety issues an investigation identifies.
Depending on the level of risk of a safety issue, the extent of corrective action taken by the relevant organisation(s), or the desirability of directing a broad safety message to the aviation industry, the ATSB may issue a formal safety recommendation or safety advisory notice as part of the final report.
All of the directly involved parties were provided with a draft report and invited to provide submissions. As part of that process, each organisation was asked to communicate what safety actions, if any, they had carried out or were planning to carry out in relation to each safety issue relevant to their organisation.
Descriptions of each safety issue, and any associated safety recommendations, are detailed below. Click the link to read the full safety issue description, including the issue status and any safety action/s taken. Safety issues and actions are updated on this website when safety issue owners provide further information concerning the implementation of safety action.
Safety issue description: The procedures in the aircraft maintenance manual relating to chip detector debris analysis were written in a way that could cause confusion and error. This probably influenced the actions of the maintenance personnel to release the aircraft to service with a deteriorating bearing.
Safety recommendation description: The Australian Transport Safety Bureau recommends that Pratt & Whitney Canada takes safety action to improve the clarity of procedures within the chip detector debris analysis section of the aircraft maintenance manual.
Safety action not associated with an identified safety issue
Whether or not the ATSB identifies safety issues in the course of an investigation, relevant organisations may proactively initiate safety action in order to reduce their safety risk. The ATSB has been advised of the following proactive safety action in response to this occurrence.
Safety action by QantasLink
QantasLink now proactively requires all debris detected during inspections of engines and turbomachinery chip-detectors to be sent for analysis. The results of this analysis is stored and can be referenced, should further faults be detected, without having to wait for analysis.
QantasLink’s AMO introduced a ‘supervisor documentation quality check’ and issued a maintenance standing order. Shift supervisors are now required to conduct final checks of all aircraft maintenance and check packages for correct completion, certification and coordination in accordance with the:
AMO Internal Procedures Manual
Continuing Airworthiness Maintenance Organisation’s Approved Maintenance Program
certification practices and procedures and the Civil Aviation Safety Regulations.
Following these checks, all necessary maintenance records and data are to be sent to the CAMO technical records department.
While the CAMO ‘Documents & Procedures’ course is delivered to new AMO employees, a recurrent course has not previously been available. A recurrent ‘Docs & Procs’ online course is now under development. This course is intended to ensure all certifiers remain current with all aircraft maintenance documentation recording requirements.
Implementation of the FAST system has now been completed on all QantasLink Dash-8 aircraft. This system allows monitoring of faults, including accessing the date and time the faults were triggered via the contracted organisation’s systems portal. For selected fault codes, as recommended by Pratt & Whitney Canada (P&WC), an automated alert email is also provided to selected staff by the contracted organisation. A ‘work instruction’ detailing the process to react to FAST system generated alerts, has been published (AWI-TS10). This ‘work instruction’ is based around P&WC Service Information Letter PWC150-045 along with other P&WC data.
Sources and submissions
Sources of information
The sources of information during the investigation included:
interviews with the flight crew
QantasLink
De Havilland Aircraft of Canada
Pratt & Whitney Canada
the Transportation Safety Board of Canada.
Submissions
Under Part 4, Division 2 (Investigation Reports), Section 26 of the Transport Safety Investigation Act 2003 (the Act), the ATSB may provide a draft report, on a confidential basis, to any person whom the ATSB considers appropriate. Section 26 (1) (a) of the Act allows a person receiving a draft report to make submissions to the ATSB about the draft report.
A draft of this report was provided to the flight crew, QantasLink, Pratt & Whitney Canada, De Havilland Aircraft of Canada, the Transportation Safety Board of Canada, Transport Canada and the Civil Aviation Safety Authority.
Submissions were received from the flight crew, QantasLink, De Havilland Aircraft of Canada, Pratt & Whitney Canada and Transport Canada. The submissions were reviewed and where considered appropriate, the text of the draft report was amended accordingly. Australian Transport Safety Bureau
The ATSB is an independent Commonwealth Government statutory agency. The ATSB is governed by a Commission and is entirely separate from transport regulators, policy makers and service providers. The ATSB’s function is to improve safety and public confidence in the aviation, marine and rail modes of transport through excellence in: independent investigation of transport accidents and other safety occurrences; safety data recording, analysis and research; fostering safety awareness, knowledge and action.
The ATSB is responsible for investigating accidents and other transport safety matters involving civil aviation, marine and rail operations in Australia that fall within the ATSB’s jurisdiction, as well as participating in overseas investigations involving Australian registered aircraft and ships. A primary concern is the safety of commercial transport, with particular regard to operations involving the travelling public.
The ATSB performs its functions in accordance with the provisions of the Transport Safety Investigation Act 2003 and Regulations and, where applicable, relevant international agreements.
Developing safety action
Central to the ATSB’s investigation of transport safety matters is the early identification of safety issues in the transport environment. The ATSB prefers to encourage the relevant organisation(s) to initiate proactive safety action that addresses safety issues. Nevertheless, the ATSB may use its power to make a formal safety recommendation either during or at the end of an investigation, depending on the level of risk associated with a safety issue and the extent of corrective action undertaken by the relevant organisation.
When safety recommendations are issued, they focus on clearly describing the safety issue of concern, rather than providing instructions or opinions on a preferred method of corrective action. As with equivalent overseas organisations, the ATSB has no power to enforce the implementation of its recommendations. It is a matter for the body to which an ATSB recommendation is directed to assess the costs and benefits of any particular means of addressing a safety issue.
When the ATSB issues a safety recommendation to a person, organisation or agency, they must provide a written response within 90 days. That response must indicate whether they accept the recommendation, any reasons for not accepting part or all of the recommendation, and details of any proposed safety action to give effect to the recommendation.
The ATSB can also issue safety advisory notices suggesting that an organisation or an industry sector consider a safety issue and take action where it believes it appropriate. There is no requirement for a formal response to an advisory notice, although the ATSB will publish any response it receives.
Purpose of safety investigations
The objective of a safety investigation is to enhance transport safety. This is done through:
identifying safety issues and facilitating safety action to address those issues
providing information about occurrences and their associated safety factors to facilitate learning within the transport industry.
It is not a function of the ATSB to apportion blame or provide a means for determining liability. At the same time, an investigation report must include factual material of sufficient weight to support the analysis and findings. At all times the ATSB endeavours to balance the use of material that could imply adverse comment with the need to properly explain what happened, and why, in a fair and unbiased manner. The ATSB does not investigate for the purpose of taking administrative, regulatory or criminal action.
Terminology
An explanation of terminology used in ATSB investigation reports is available here. This includes terms such as occurrence, contributing factor, other factor that increased risk, and safety issue.
Publishing information
Released in accordance with section 25 of the Transport Safety Investigation Act 2003
Ownership of intellectual property rights in this publication
Unless otherwise noted, copyright (and any other intellectual property rights, if any) in this report publication is owned by the Commonwealth of Australia.
Creative Commons licence
With the exception of the Coat of Arms, ATSB logo, and photos and graphics in which a third party holds copyright, this publication is licensed under a Creative Commons Attribution 3.0 Australia licence.
Creative Commons Attribution 3.0 Australia Licence is a standard form licence agreement that allows you to copy, distribute, transmit and adapt this publication provided that you attribute the work.
The ATSB’s preference is that you attribute this publication (and any material sourced from it) using the following wording: Source: Australian Transport Safety Bureau
Copyright in material obtained from other agencies, private individuals or organisations, belongs to those agencies, individuals or organisations. Where you wish to use their material, you will need to contact them directly.
Occurrence summary
Investigation number
AO-2018-049
Occurrence date
26/06/2018
Location
Near Brisbane Airport
State
Queensland
Report release date
16/09/2020
Report status
Final
Investigation level
Defined
Investigation type
Occurrence Investigation
Investigation status
Completed
Mode of transport
Aviation
Aviation occurrence category
Engine failure or malfunction
Occurrence class
Incident
Highest injury level
None
Aircraft details
Manufacturer
De Havilland Canada/De Havilland Aircraft of Canada
At about 1728 Central Standard Time,[1] on 3 July 2018, a Cessna 172RG aircraft, registered VH‑LCZ, commenced circuit operations at Parafield Airport, South Australia (SA) with the pilot as the sole occupant. The flight commenced in day conditions and transitioned to operation under the night VFR[2] after last light, which occurred at 1743.
There were no identified aircraft defects and it was fully refuelled immediately prior to the flight. The pilot reported that he had conducted a post‑refuel drain and that there was nothing abnormal in any of the fuel samples.
At about 1748, the pilot performed a touch and go landing, and departed the runway for the sixth, and intended final, circuit. The pilot recalled that the engine ‘coughed’ once as the aircraft accelerated along the runway. He noted no other abnormalities and continued the take-off normally. About 10 minutes later, the pilot received air traffic control (ATC) clearance to land. He turned the aircraft onto final at an altitude of about 500 ft approximately 1,500 m from the runway threshold, and configured it for landing (full flap and landing gear extended).
On descent through 450 ft, the pilot observed the propeller speed reduce from 1,800 to 1,300 rpm. He selected the carburettor heat, increased the throttle and changed the position of the fuel selector from BOTH to LEFT. The pilot reported that, with the exception of this troubleshooting, he did not apply carburettor heat during any of the previous circuits. The engine did not respond to the pilot’s carburettor nor fuel selection inputs and the propeller speed remained constant at 1,300 rpm. The pilot then deselected the carburettor heat and moved the fuel selector back to its original position. A short time later, he assessed that the aircraft did not have sufficient altitude to reach the runway and that a forced landing would be necessary.
At about 1758, the pilot declared a PAN[3] and informed ATC that he was unable to make the runway. The pilot recalled that he had sighted an unlit area ahead, which he assumed to be an open space. He turned the aircraft towards that area and pitched the nose down to achieve the airspeed associated with the maximum glide distance. The pilot reported that, as the aircraft approached the open space, he heard the fuselage hitting treetops. Seconds later, the aircraft stopped abruptly as the nose wheel struck a power line and it then collided with the ground (Figure 1).
After the collision, the pilot attempted to switch off the master switch but was unable to do so due to distortion of the instrument panels. He then swiftly exited the aircraft through the co-pilot’s side window and moved away from the wreckage. Emergency services attended the scene shortly after. The pilot sustained minor injuries and the aircraft was substantially damaged.
Figure 1: Aircraft wreckage (note power line fouling the nose wheel)
Source: South Australia Police
Carburettor icing
Induction icing, often referred to as carburettor icing, is the accumulation of ice within the induction system of an engine fitted with a carburettor. This ice forms as the decreasing air pressure and introduction of fuel reduces the temperature within the system. The temperature may reduce sufficiently for moisture within the air to freeze and accumulate. This build-up of ice restricts airflow to the engine, leading to a reduction in engine performance and possible engine failure. Environmental conditions influence the likelihood of carburettor ice forming.
Weather observations recorded by the Bureau of Meteorology at Parafield Airport indicated a temperature of 12.2° C and a dew point[4] of -0.6° C at the time of the accident. Figure 2 (see annotation in yellow) shows that these meteorological conditions presented a risk of moderate icing when using cruise power and serious icing when using descent power. At the time of the power loss, the engine was operating at descent power.
Figure 2: Carburettor icing probability
Source: CASA, annotated by the ATSB
The Cessna 172RG pilot operating handbook (POH) provided the following guidance for carburettor icing:
before landing, switch carburettor heat to ON to prevent ice formation
in the event of a rough engine running or loss of power:
An unexplained drop in manifold pressure and eventual engine roughness may result from the formation of carburettor ice. To clear the ice, apply full throttle and pull the carburettor heat knob out until the engine runs smoothly; then remove carburettor heat and re-adjust the throttle.
Safety analysis
A post-accident examination of the engine was not conducted and therefore the possibility that a mechanical defect contributed to the accident could not be ruled out. However, the ATSB assessed the evidence with respect to some common known causes for an engine power loss. The evidence indicated that fuel contamination, fuel exhaustion and aircraft maintenance issues were unlikely.
Contrary to the guidance in the POH, the pilot reported that he did not apply carburettor heat while descending to the runway during any of the circuits. This combined with weather conditions conducive to severe carburettor icing at descent power made it likely that the power loss was due to the accumulation of carburettor ice.
The POH listed carburettor icing as a cause of the engine running rough or losing power. The actions listed in the POH to clear carburettor ice, however, do not clear ice immediately as it takes some time for the heat to take effect. The pilot first observed a reduction in propeller speed just after the turn onto final. Although he responded by applying carburettor heat, the short time between troubleshooting the engine power loss and conducting the forced landing meant there was probably insufficient time to clear enough ice for the engine to recover.
The pilot completed the turn onto final at an altitude of about 500 ft approximately 1,500 m from the runway threshold, which is within the normal profile for a powered approach. After troubleshooting the engine issues, the aircraft had already descended to about 450 ft. The POH indicated that, in ideal conditions, a maximum glide distance of about 1,500 m could be achieved from an altitude of 500 ft. However, a turn onto the final approach at that position is unlikely to permit an aircraft configured for landing to glide to the runway in the event of a power loss.
Consideration of a flight profile that balances the requirement for a stable approach while increasing the likelihood of being able to reach the runway in the event of a power loss is particularly important when flying in night VFR conditions. Selection of a suitable unprepared landing site is more difficult at night due to reduced visual discrimination. In this instance, the selected large unlit area was assumed to be clear but obstructions, such as the power lines, were not discernible.
Following the partial engine failure, the pilot resisted the temptation to lift the nose of the aircraft in an attempt to stretch the glide to the runway. That decision, to follow his training and pitch the nose of the aircraft down to establish the optimum glide speed, enabled him to maintain control of the aircraft. That action likely prevented a low altitude stall and uncontrolled collision with terrain.
Findings
These findings should not be read as apportioning blame or liability to any particular organisation or individual.
On final approach, the engine of VH-LCZ failed, likely due to carburettor icing.
The engine failed at a position during the final approach that did not permit the aircraft to glide to the runway and afforded limited alternative landing area options.
While descending during the forced landing at night, the aircraft struck a power line and then collided with terrain, resulting in minor injury to the pilot and substantial damage to the aircraft.
Safety message
Engine failure during single-engine aircraft operations is by far the most serious night time emergency. The Civil Aviation Safety Authority (CASA) advisory circular, Night VFR Rating, provides useful recommendations for minimising risk during night visual flight rules (VFR) operations, including:
planning to fly at a higher altitude will increase the options available
planning the descent onto the base leg so that the aircraft is positioned to start the turn onto final at about 600 ft to 700 ft above ground level.
The routine application of carburettor heat during the period between the base turn point and late in the final approach will significantly reduce the potential for an ice-related power loss. More information regarding carburettor icing can be found in the ATSB report, The ongoing danger of carburettor icing.
While a successful landing was not achieved in this instance, the pilot's actions after realising he would not reach the runway closely followed the guidance in the Federal Aviation Authority pilot’s handbook (Airplane Flying Handbook). Flying in a controlled manner, wings level and at the recommended glide speed has a better survivability outcome than when control of the aircraft is lost. The pilot’s actions in maintaining control of the aircraft maximised the likelihood of a successful forced landing.
About this report
Decisions regarding whether to conduct an investigation, and the scope of an investigation, are based on many factors, including the level of safety benefit likely to be obtained from an investigation. For this occurrence, a limited-scope, fact-gathering investigation was conducted in order to produce a short summary report, and allow for greater industry awareness of potential safety issues and possible safety actions.
Publishing information
Released in accordance with section 25 of the Transport Safety Investigation Act 2003
Ownership of intellectual property rights in this publication
Unless otherwise noted, copyright (and any other intellectual property rights, if any) in this report publication is owned by the Commonwealth of Australia.
Creative Commons licence
With the exception of the Coat of Arms, ATSB logo, and photos and graphics in which a third party holds copyright, this publication is licensed under a Creative Commons Attribution 3.0 Australia licence.
Creative Commons Attribution 3.0 Australia Licence is a standard form licence agreement that allows you to copy, distribute, transmit and adapt this publication provided that you attribute the work.
The ATSB’s preference is that you attribute this publication (and any material sourced from it) using the following wording: Source: Australian Transport Safety Bureau
Copyright in material obtained from other agencies, private individuals or organisations, belongs to those agencies, individuals or organisations. Where you wish to use their material, you will need to contact them directly.


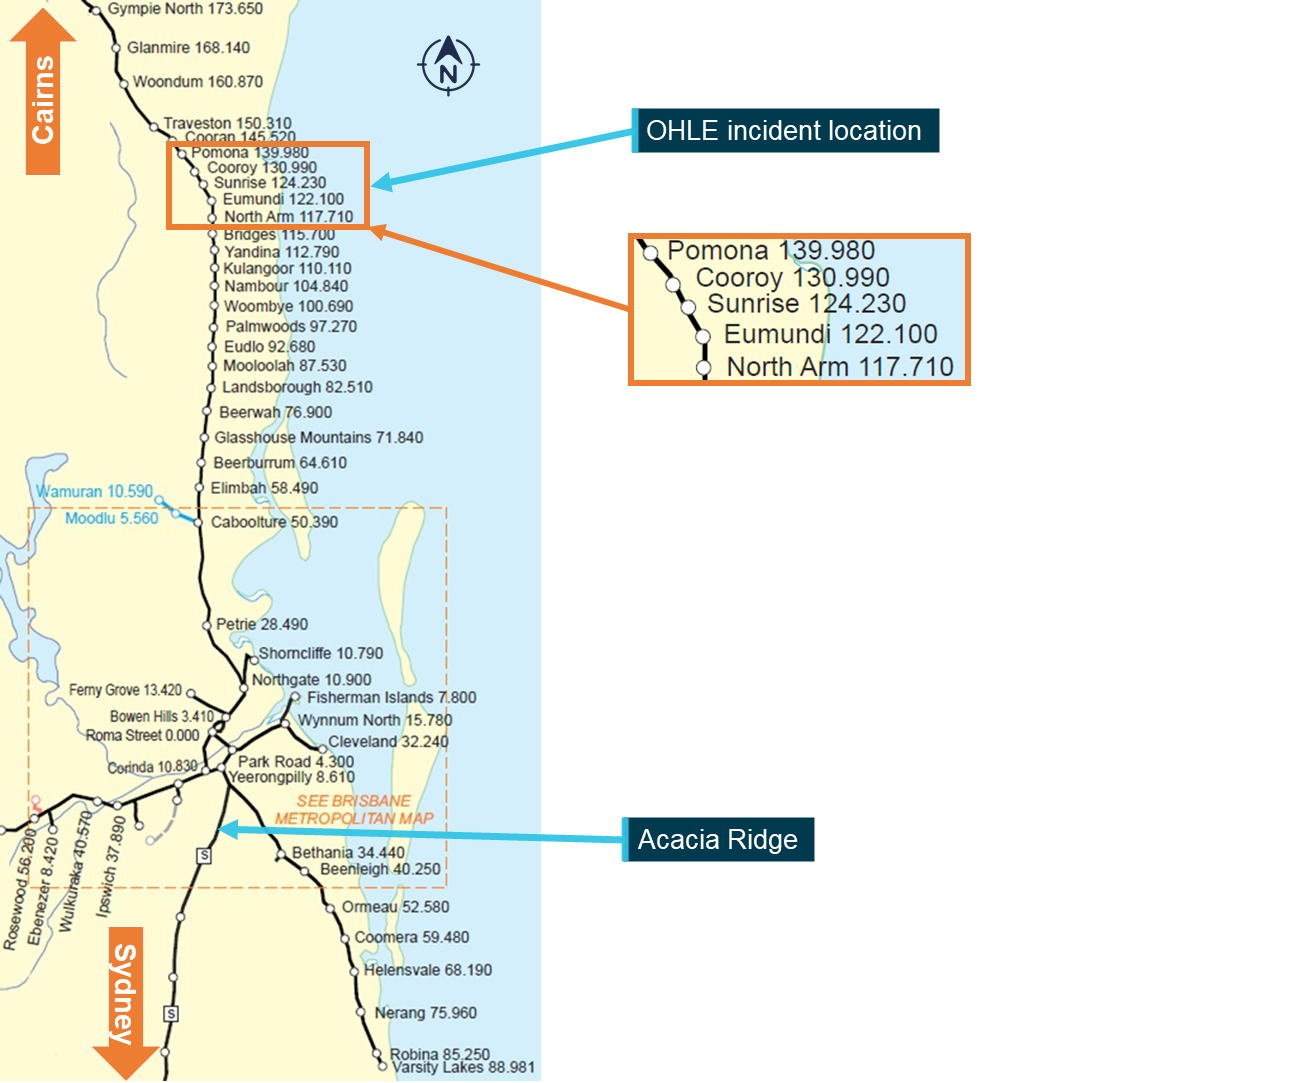
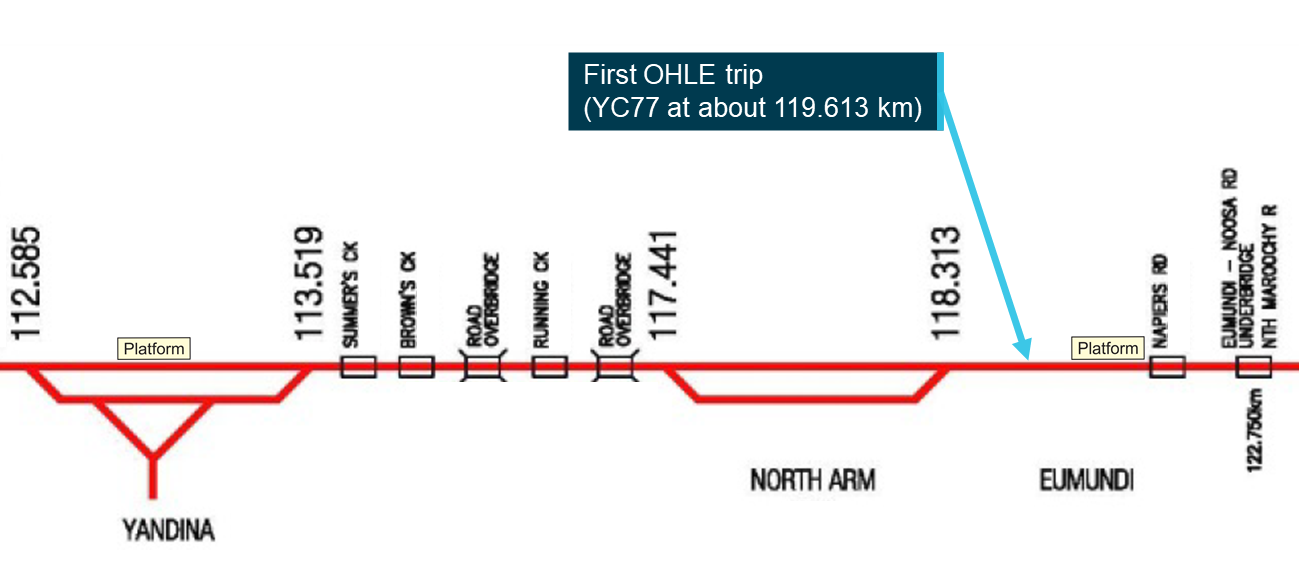
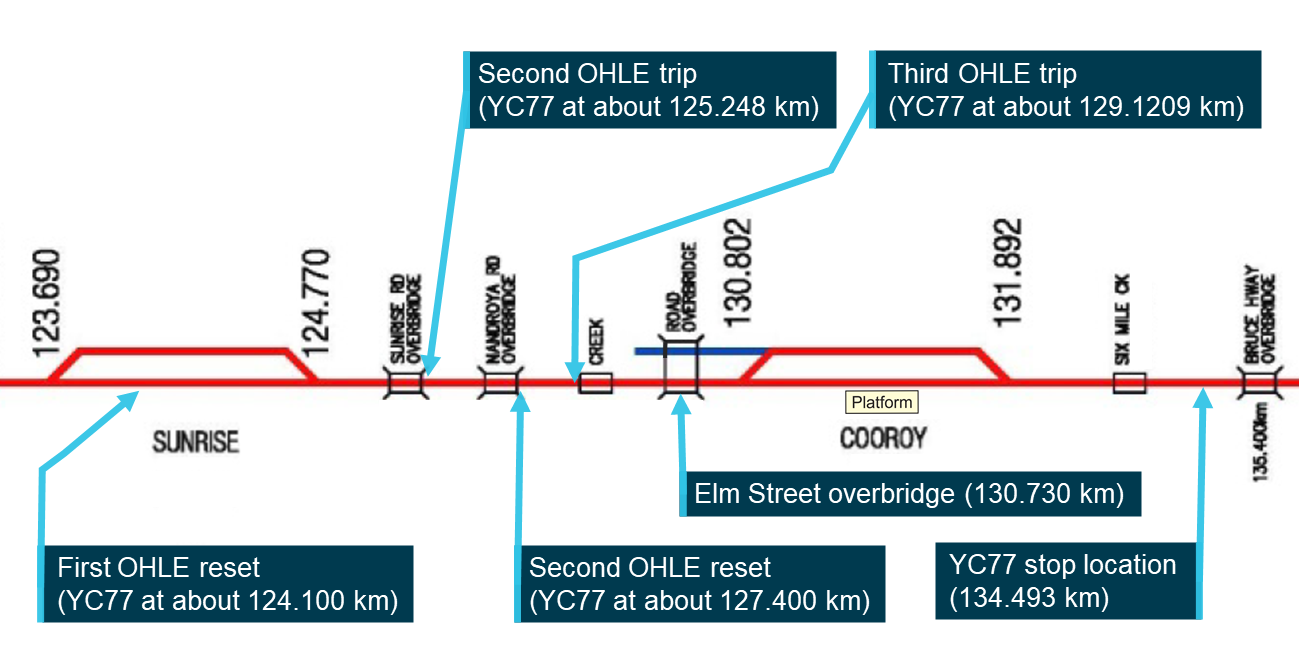
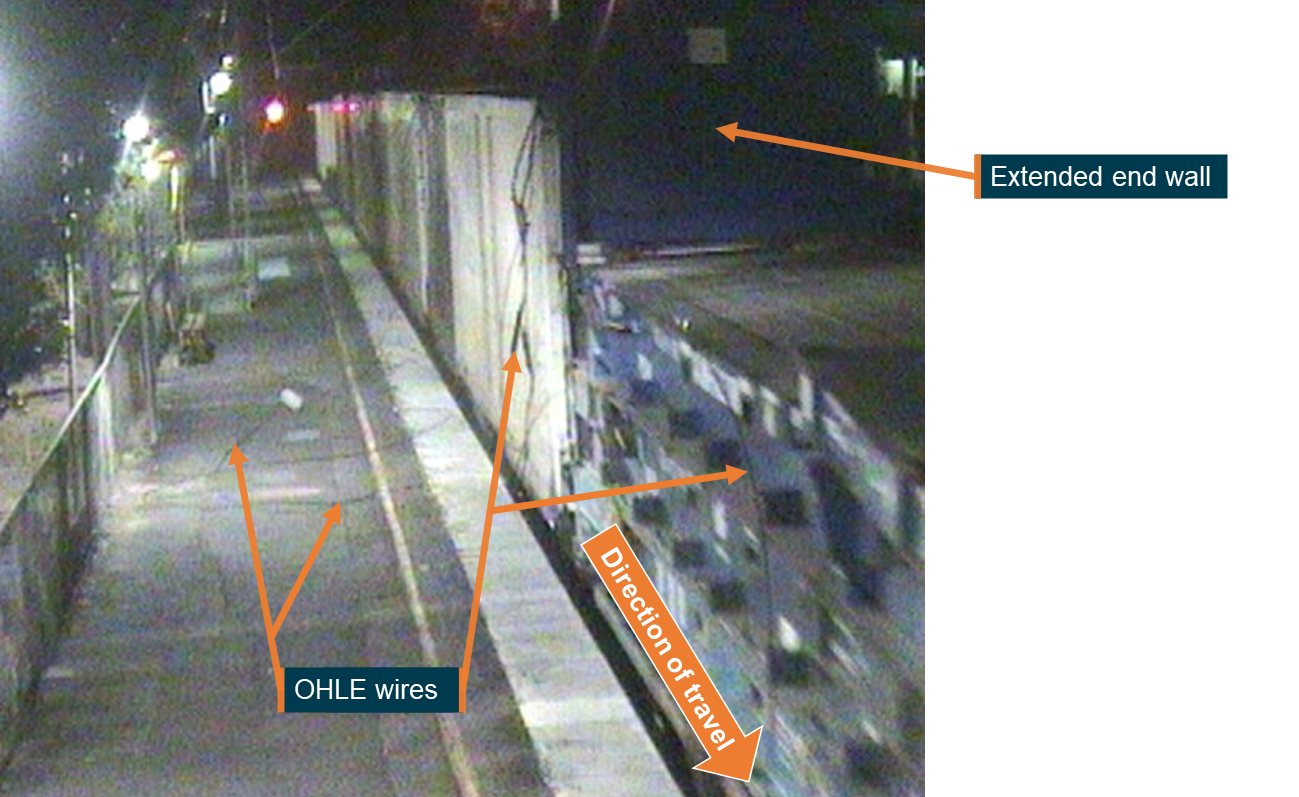
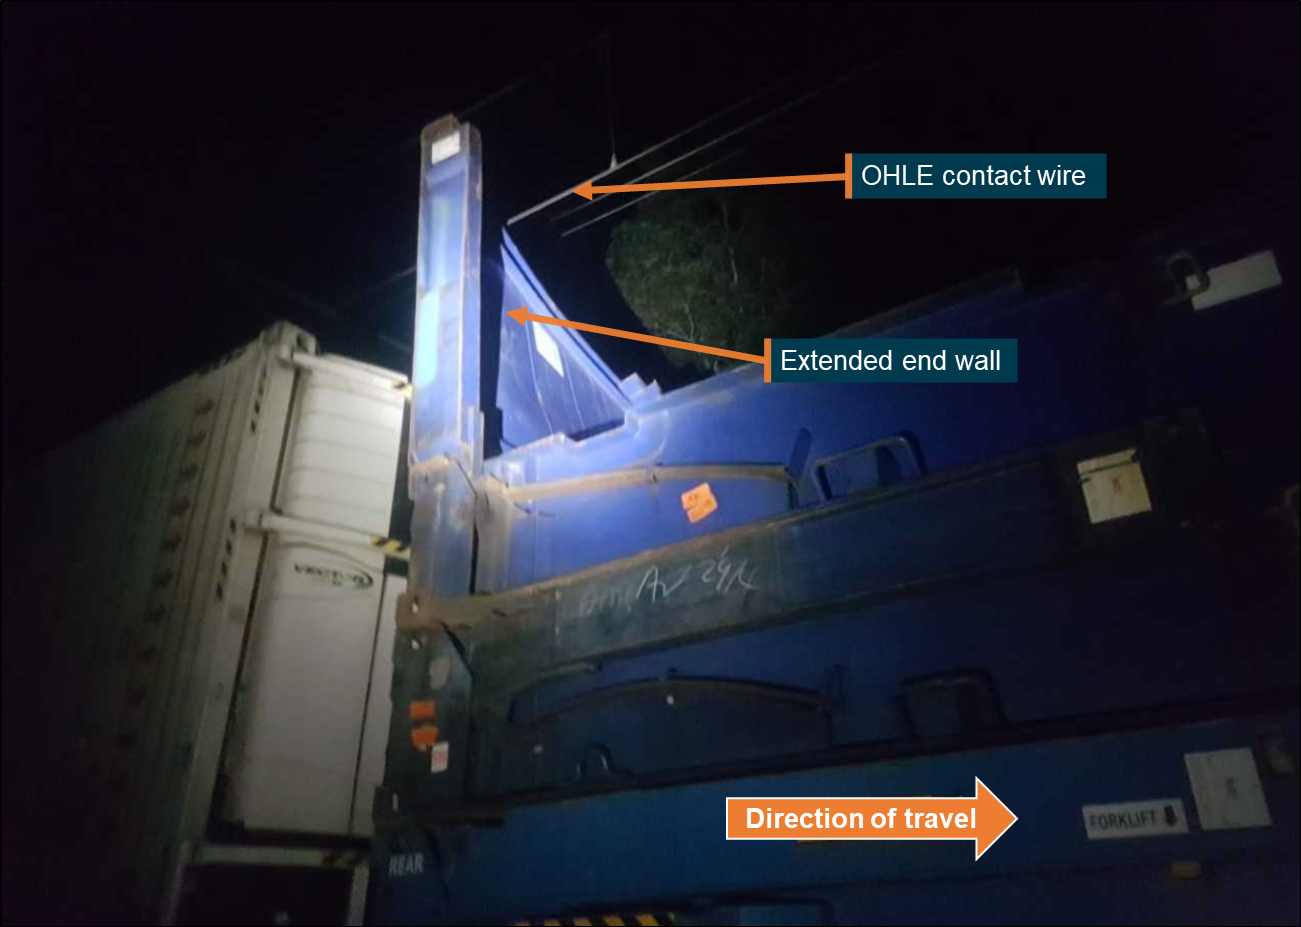
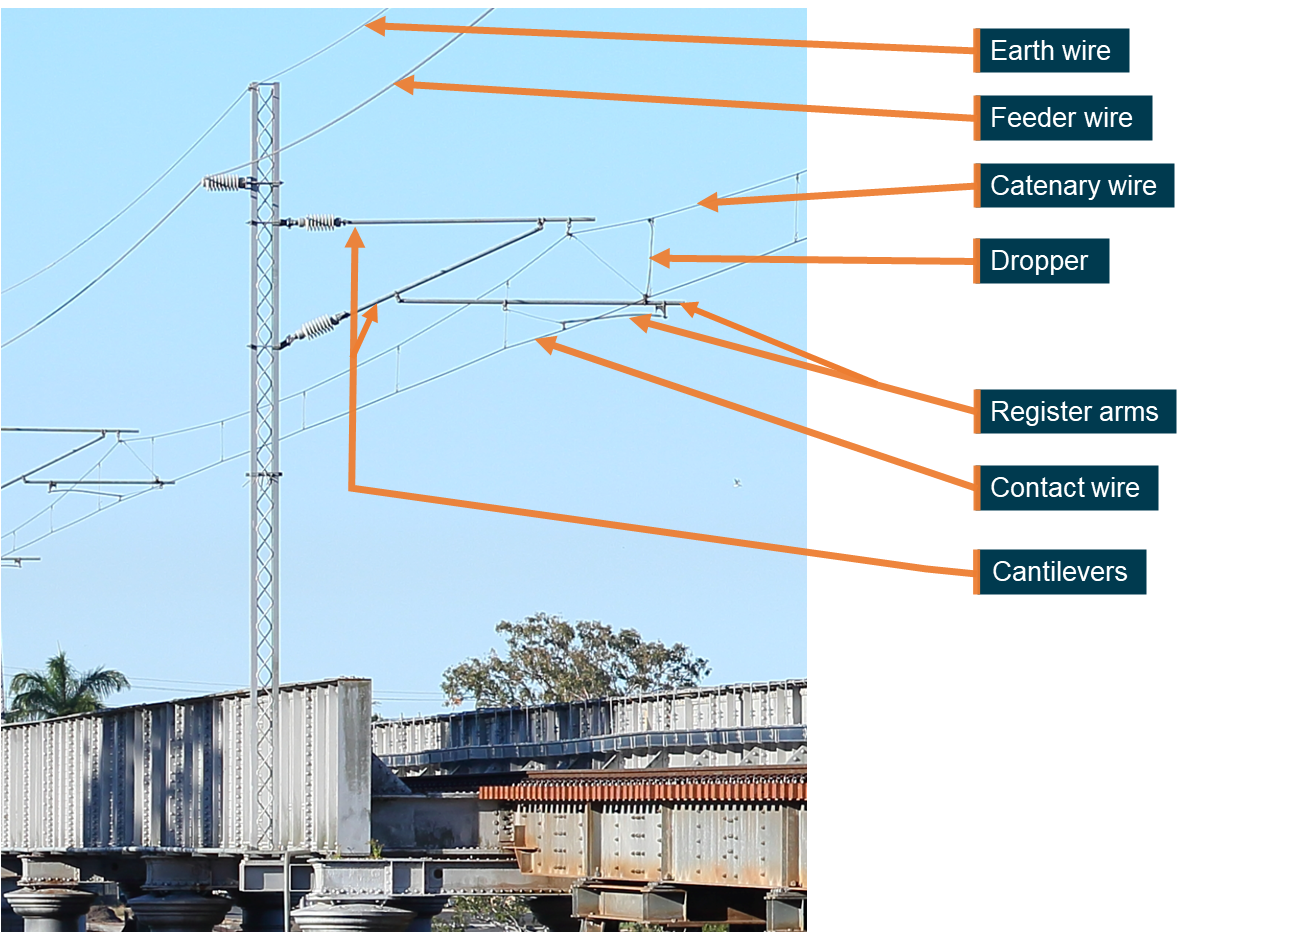
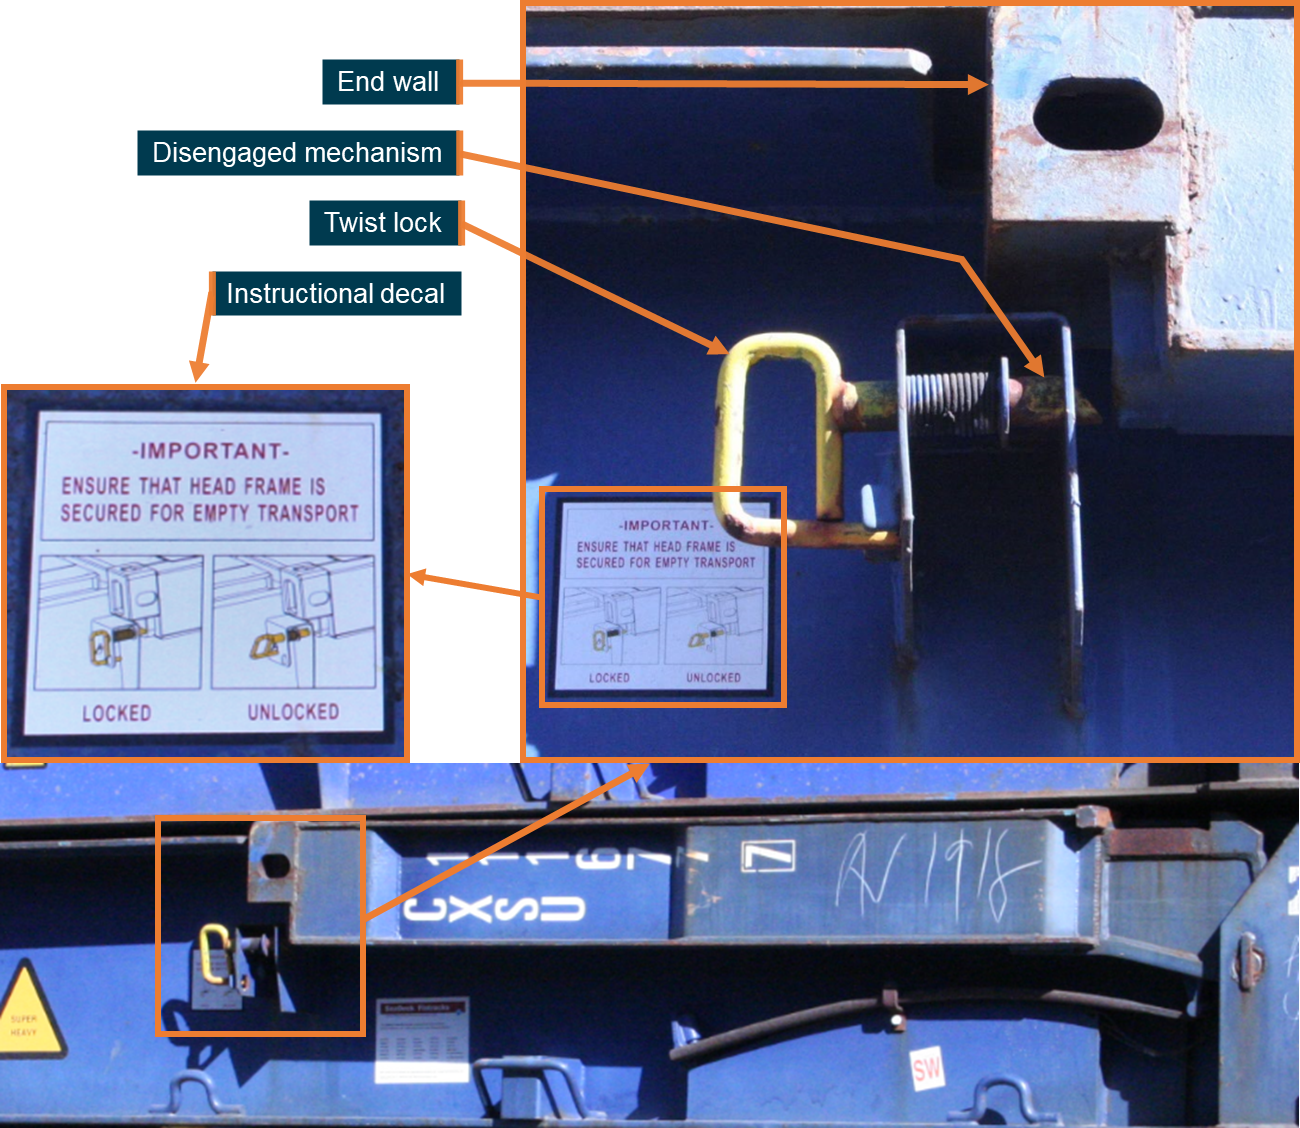
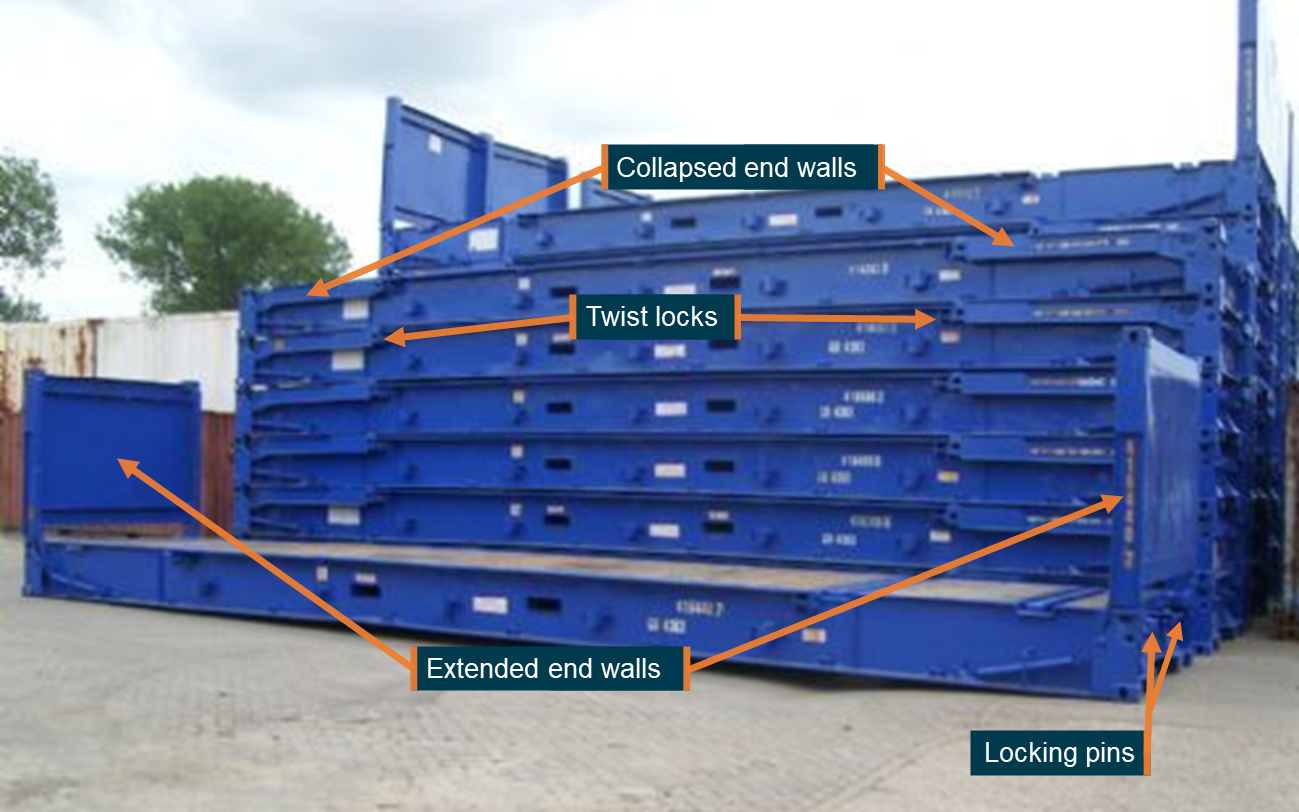
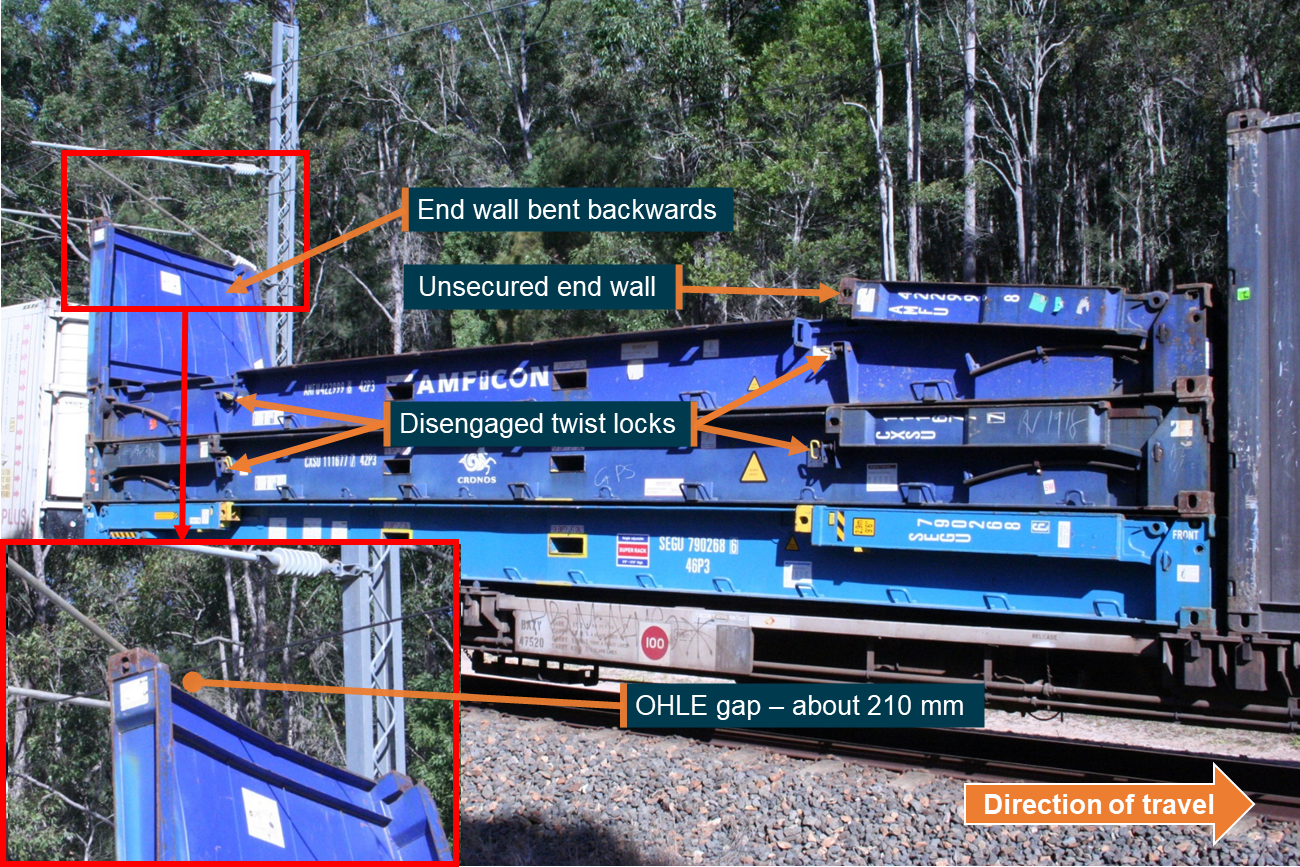
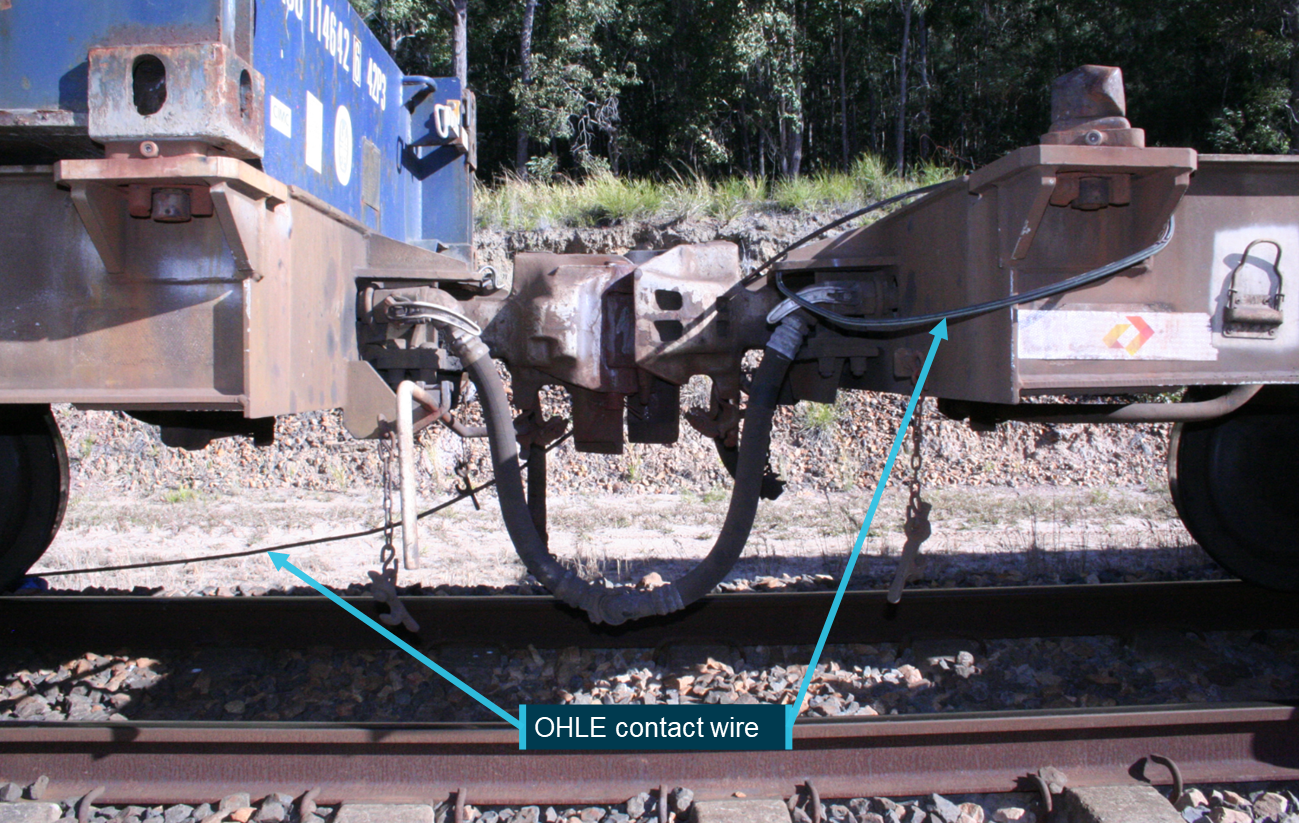
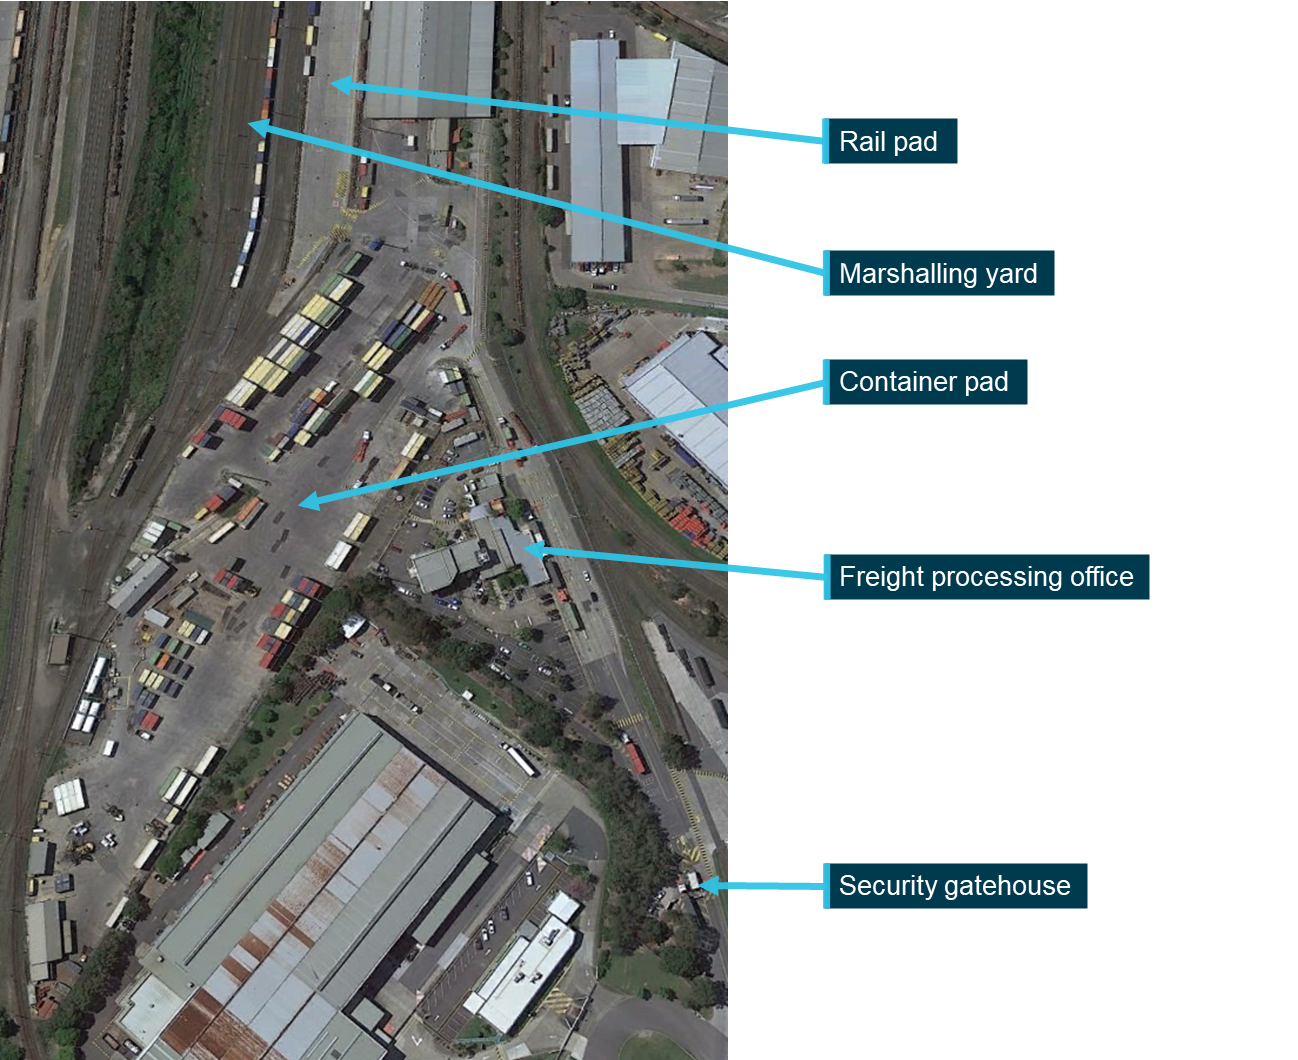
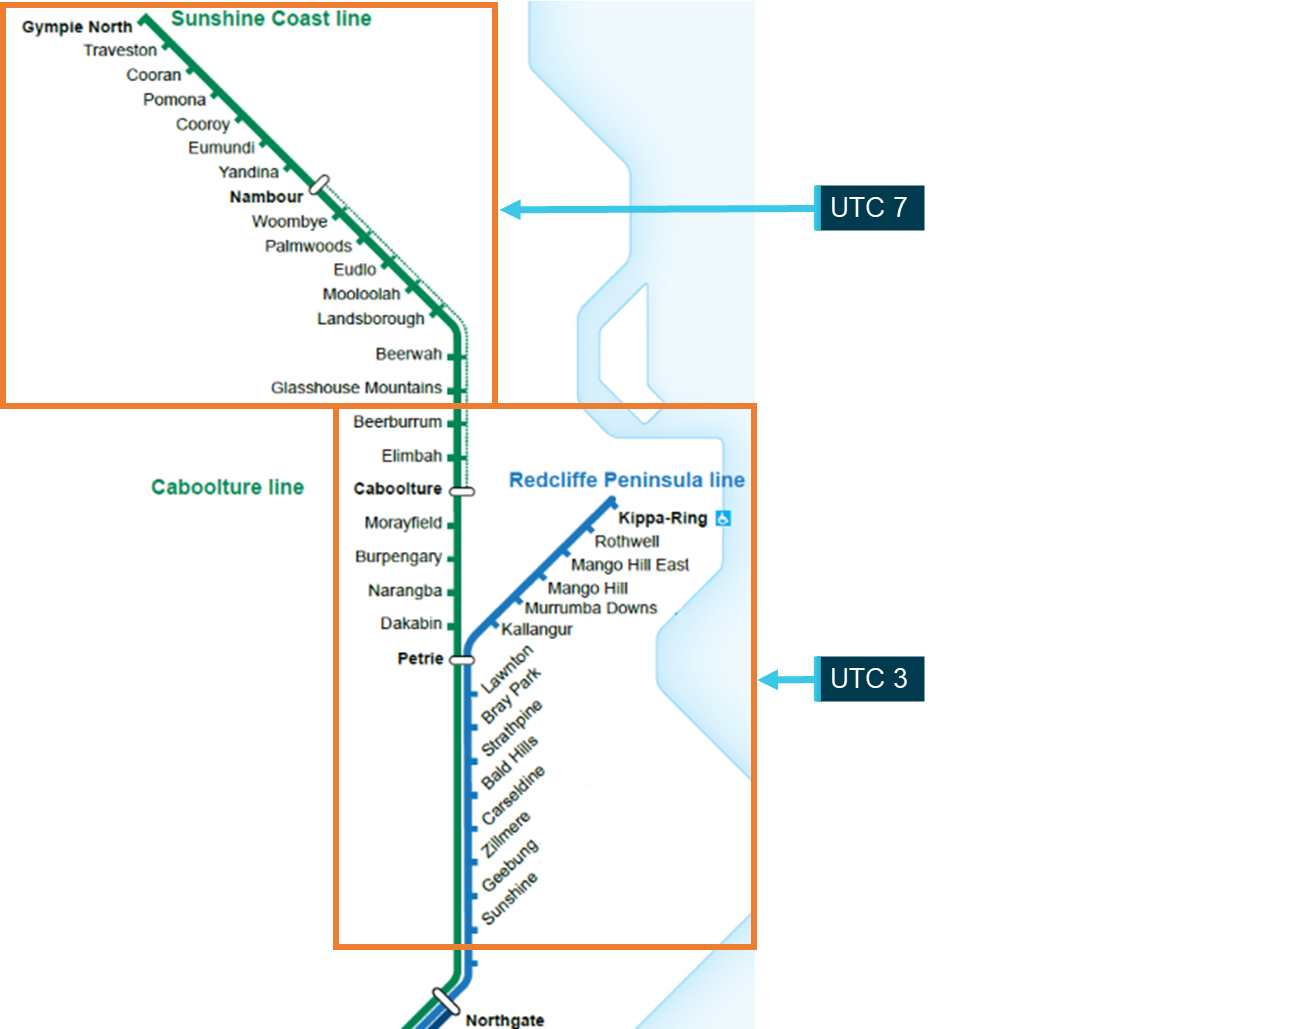
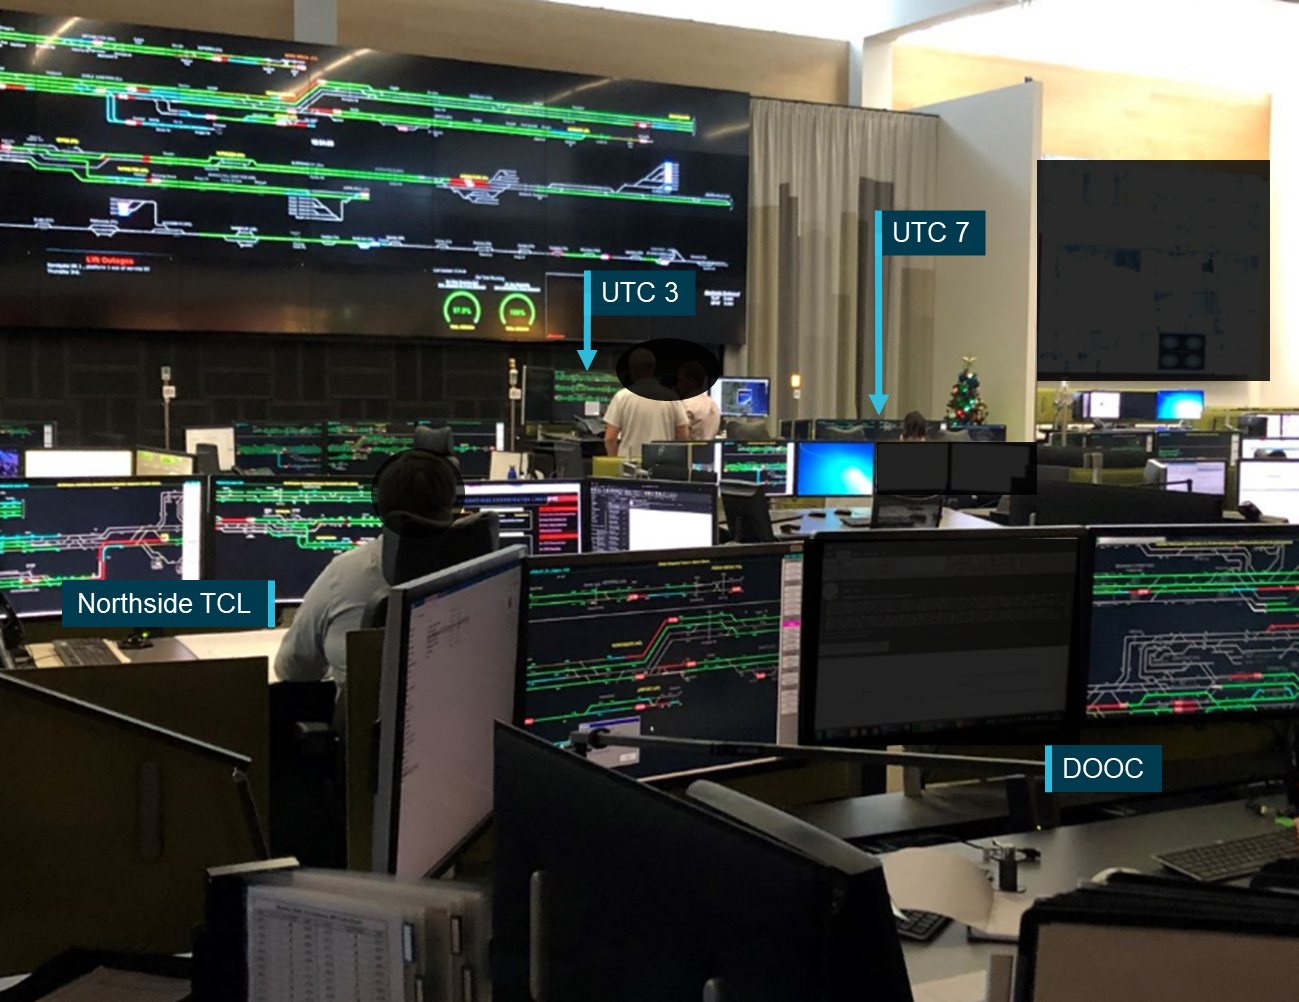
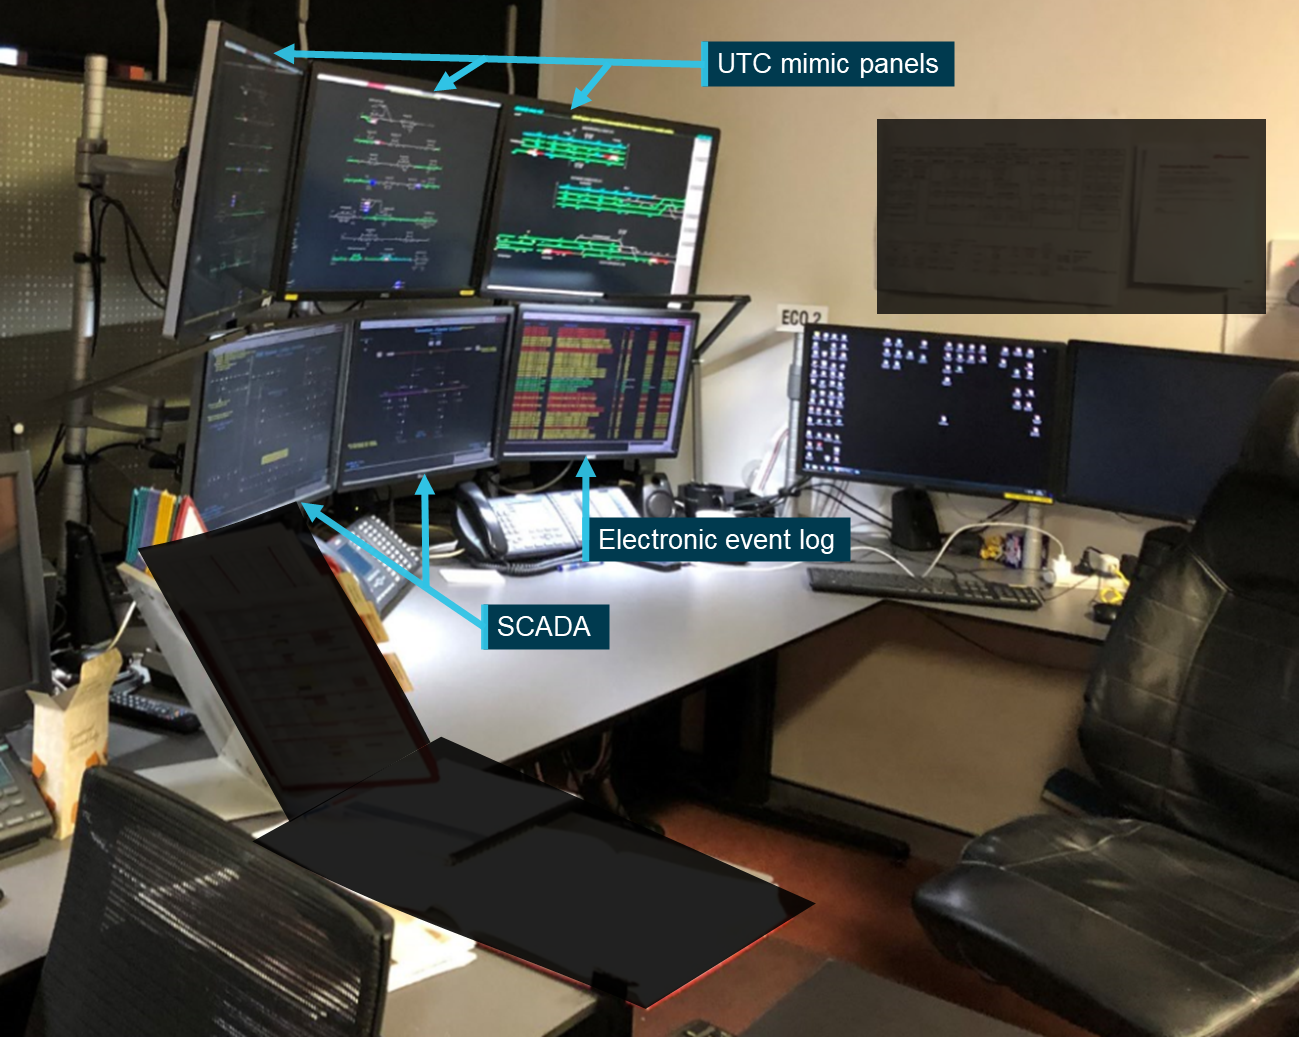
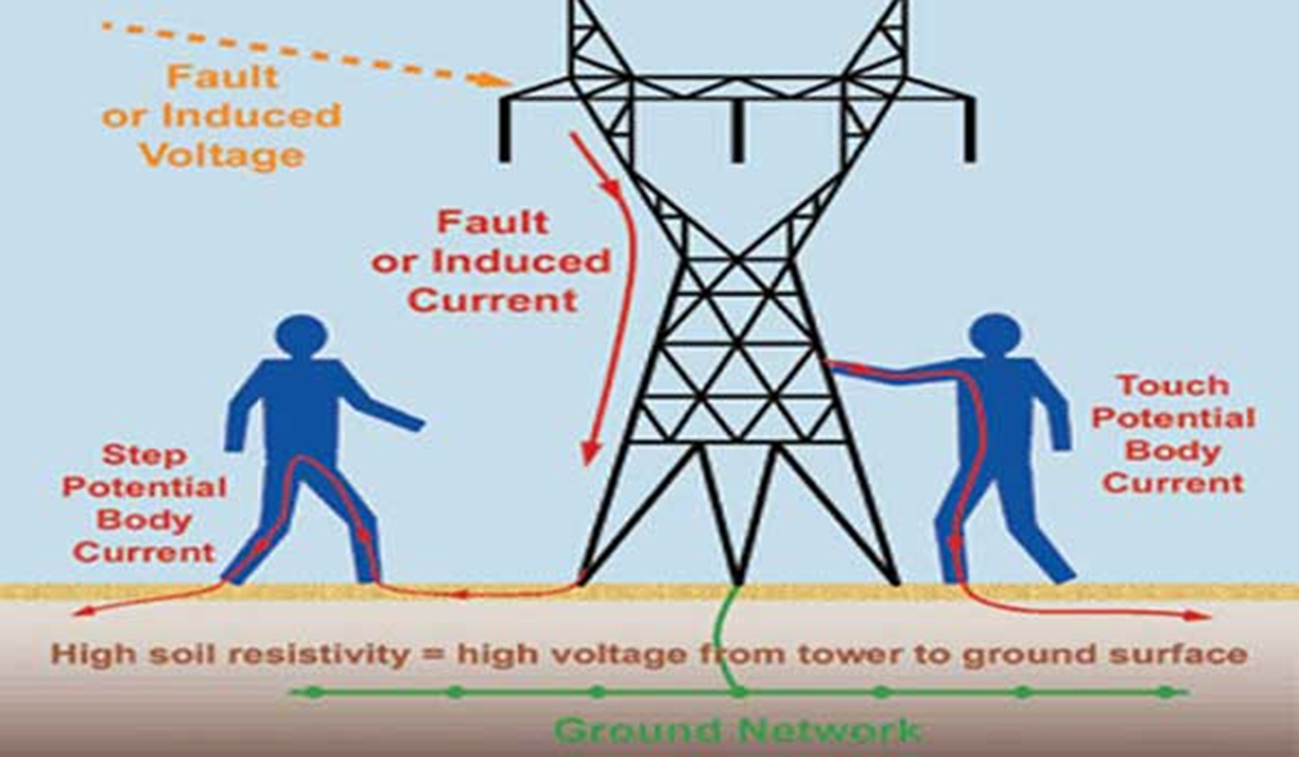

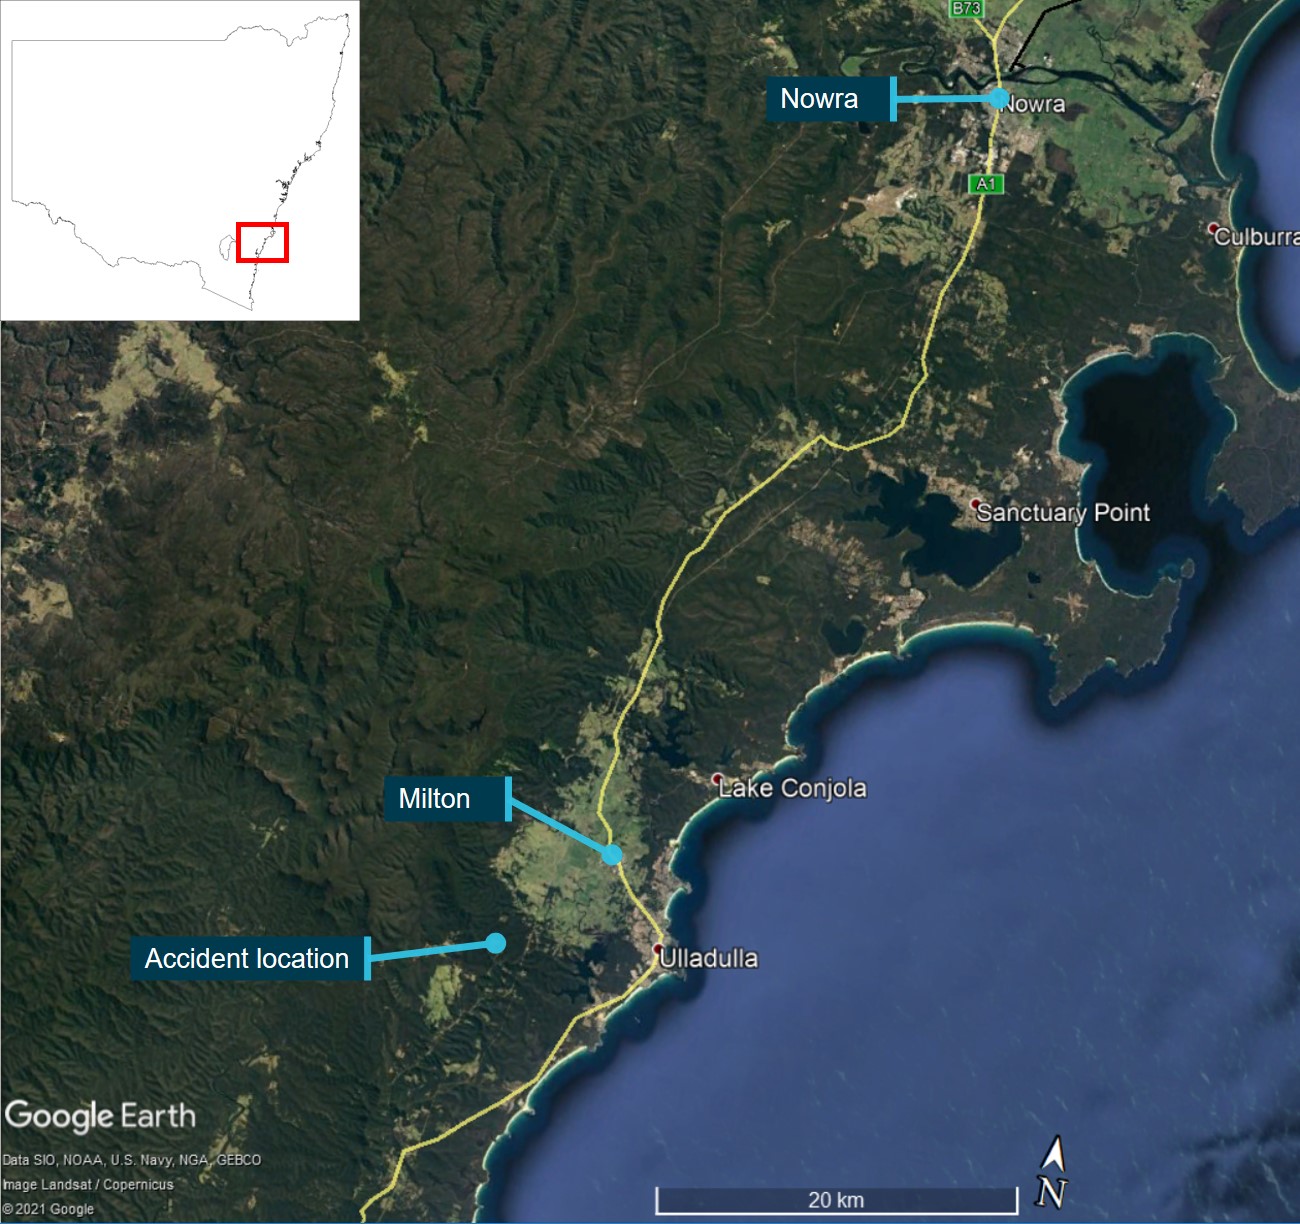
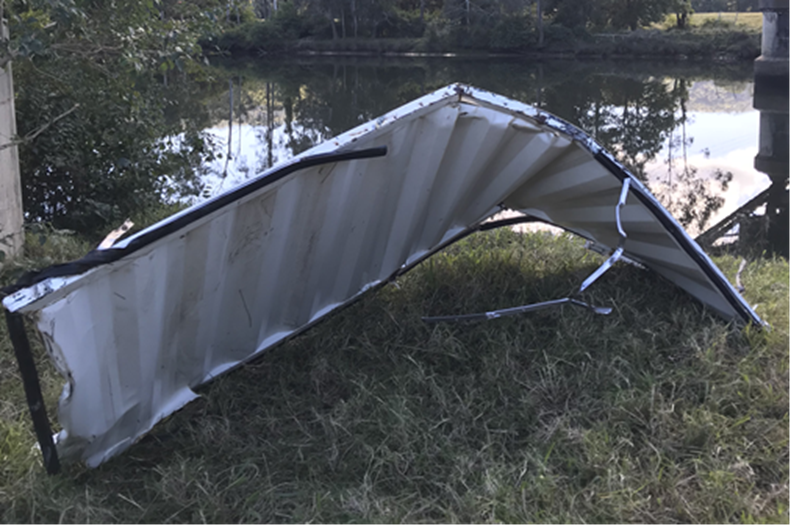
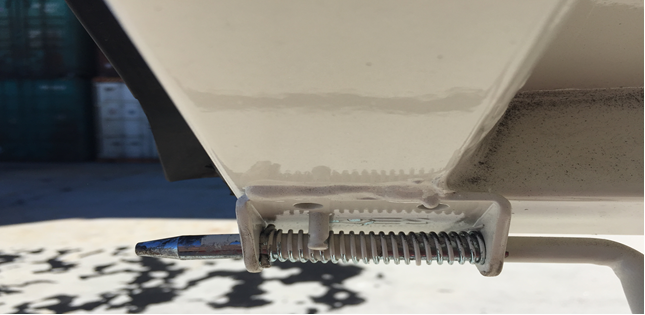
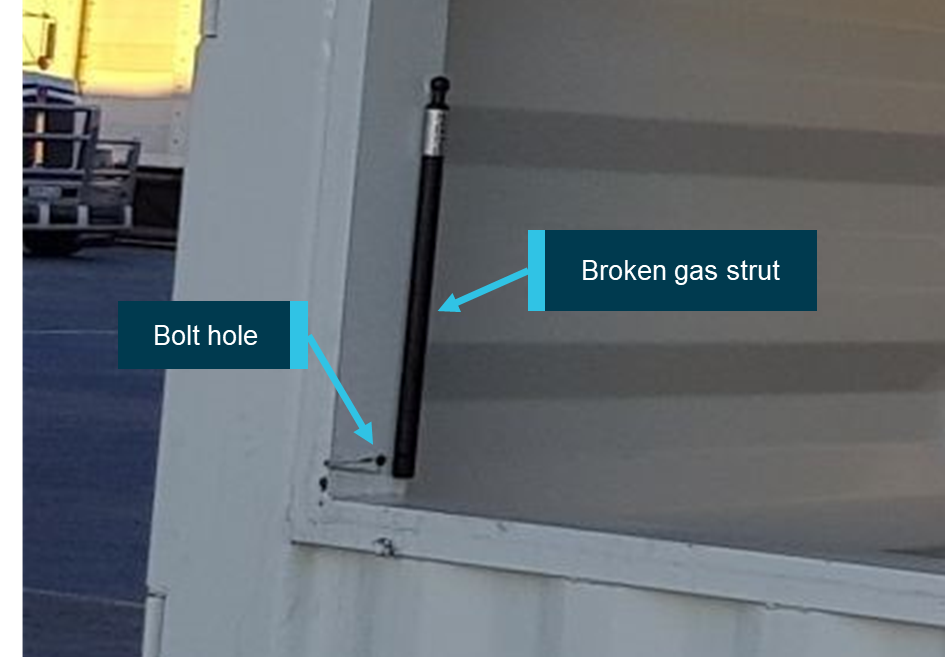
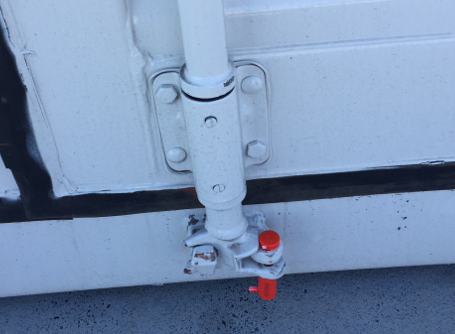


![Dispatch walk-around (Menzies) Partial, with torch. (about 00:03:30) Yes, with torch. (00:02:45) Yes, (twice) with torch. 00:03:21 the first time, 00:03:55 the second time. No [1] This turnaround was extended due to an aircraft repair being carried out. [2] The Malaysia Airlines engineers were responsible for certification for these checks but could delegate parts of the check (other than certification) to an AMSA engineer. One engineer handled the 12 and 14 July turnarounds, and another handled the 16 and](/sites/default/files/media/5780840/figure-45-timeline-of-key-events-for-the-malaysia-airlines-resumption-of-brisbane-services.jpg)