On 13 September 2017, the crew of a Boeing 737, registered VH-VUE and operated by Virgin Australia, were flying a scheduled passenger flight from Melbourne, Victoria to Adelaide, South Australia. Shortly before top of descent, air traffic control instructed the crew to perform a high-speed descent. The crew commenced descent with the first officer as pilot flying and the autopilot engaged, and intended to target a descent speed of 320 kt, which was higher than the normal descent speed of 280 kt.
During the descent, the first officer attempted to manage airspeed fluctuations by using changes in the autopilot modes and reductions in the target airspeed. As the aircraft descended through around 17,000 ft, the tailwind affecting VUE decreased suddenly and significantly. The reduction in tailwind caused the indicated airspeed to increase and approach the maximum operating speed limit of 340 kt.
The captain responded to the sudden increase in airspeed by abruptly pulling back on the control column, causing the autopilot to disconnect. The resulting control forces caused sudden changes to the aircraft’s pitch attitude and vertical acceleration. Two cabin crew who had been standing in the rear galley were injured, with one sustaining serious injuries.
What the ATSB found
The ATSB found that a sudden reduction in tailwind caused the airspeed to increase towards the maximum operating speed. The safety implications associated with this event related to the captain’s sudden control inputs to prevent an overspeed, and the consequent effects of vertical acceleration on the aircraft and its occupants. Although there was a resulting one knot overspeed from the sudden speed increase, it was not by an amount that required any structural inspections to ensure the ongoing airworthiness of the aircraft, according to the guidance provided by the aircraft manufacturer.
Even though the autopilot was operating correctly, when the aircraft was approaching and exceeding the maximum operating speed, the captain’s perception was that the autopilot was not controlling the aircraft and that urgent intervention was necessary. However, the captain did not follow the normal procedure for taking over control of pilot flying duties. The large pitch control inputs made by the captain were probably influenced by the captain’s perception of urgency.
The ATSB also found that the captain was highly concerned about avoiding an overspeed. This was partly because of a perception that Virgin Australia were also concerned about overspeed and wanted to avoid overspeed events, and partly because of a perception that minor overspeeds had significant implications for the safety of the aircraft. These factors contributed to how the captain responded to the sudden increase in airspeed towards the maximum operating speed.
The crew identified the risk of overspeed earlier in the descent, but did not discuss how they would manage that risk. This reduced the pilots’ ability to effectively respond to the overspeed situation, and probably contributed to the rapid, reflexive nature of the captain’s control inputs.
What's been done as a result
Virgin Australia have updated the training and information provided to pilots about overspeed and overspeed recovery. The intent of these actions was to reinforce the correct overspeed recovery technique, and to provide a greater opportunity for pilots to understand the negative safety implications of manual inputs to correct a minor overspeed. These actions have included an animation showing pilots mishandled and correct overspeed recoveries, and an update to manuals which explains that the 737 has been flight tested at speeds above VMO.
Virgin Australia have also changed procedures for ground handling staff when responding to requests from emergency services.
Safety message
During this accident, the pilots accepted and targeted an air traffic control instruction to conduct a high-speed descent. Due to increased kinetic energy and reduced margins to placard speed limits, high-speed descents involve a higher level of risk, including increased risk of harm due to abrupt control input. Pilots are entitled to decline air traffic control instructions where they do not perceive they can safely comply.
This accident highlights the challenges pilots face when responding to sudden or unexpected situations. There will often be a reduction in safety when pilots perceive a situation is urgent and when they make decisions rapidly and reflexively. In these situations, pilots may not be able to effectively process information or make good decisions.
Wherever possible, pilots should take the opportunity provided in an earlier stage in flight to identify risks and take steps to reduce the likelihood of a critical situation developing. Potential threat identification and planning for their management should also involve considering, as a multi-person crew, what the implications of a perceived risk might be, and how to respond if the threat does develop. By taking steps in an earlier stage in flight, pilots can improve their ability to respond effectively to threats. The Federal Aviation Administration Aeronautical Decision Making material provides pilots with accessible guidance on these concepts.
The occurrence
On the afternoon of 13 September 2017, the crew of a Boeing 737-800 aircraft, registration VH‑VUE (VUE) and operated by Virgin Australia (VA), were operating a scheduled passenger service from Melbourne, Victoria to Adelaide, South Australia. The scheduled departure time for this flight was 1605 CST.[1]
The flight crew comprised the captain and the first officer (FO), and these pilots had flown VUE together on the preceding flight. The cabin crew comprised the cabin supervisor (CS) and three other cabin crew. There were 151 passengers on-board.
In preparation for the flight to Adelaide, the flight crew reviewed various information relating to the en route and destination weather conditions. The captain briefed the CS, advising the expected flight time was 65 minutes and that the forecast weather was the same as local conditions in Melbourne, which the CS perceived as cloudy.
For the flight to Adelaide, the FO was pilot flying (PF) and the captain was pilot monitoring (PM).[2] At 1610, VUE departed from Melbourne and climbed to flight level (FL) 360.[3] The departure, climb and cruise were uneventful.
Crew instructed to perform high-speed descent
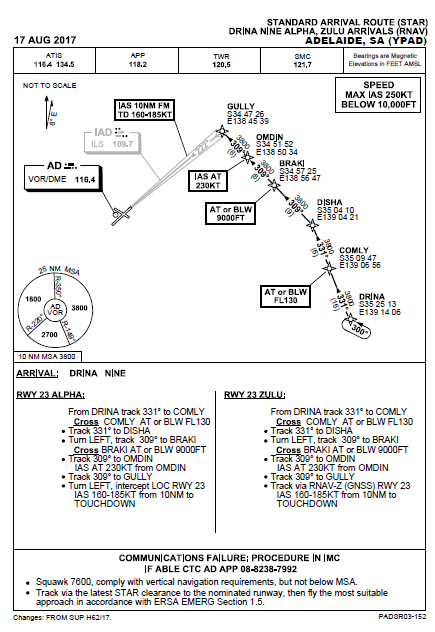
At about 1642, the aircraft was south-east of Adelaide, maintaining FL 360 and approaching top of descent. Air traffic control (ATC) issued the crew clearance to conduct a DRINA NINE ALPHA standard instrument arrival route[4] (STAR) for an approach to runway 23, and when ready descend to FL 250. This STAR provided tracking information including a series of waypoints, altitude and speed restrictions, positioning the aircraft to the north-east of Adelaide to commence an approach to runway 23.
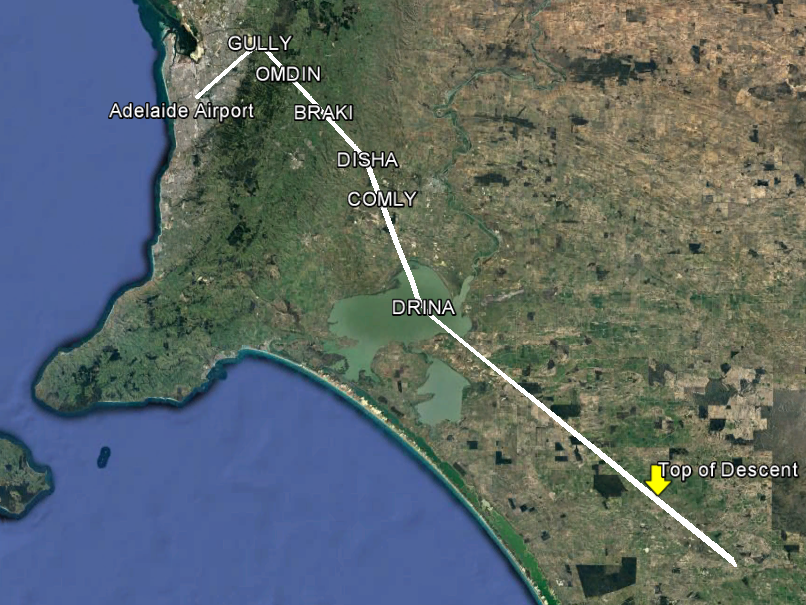
Figure 1 shows the flight path of VUE, with the DRINA NINE ALPHA STAR waypoints overlaid. The original STAR procedure is provided in Appendix A – DRINA NINE ALPHA STAR. This procedure required inbound aircraft track to the DRINA waypoint, then to pass overhead COMLY at or below 13,000 ft.
A few minutes after issuing the STAR, when VUE was 136 NM (252 km) south-east from Adelaide and 93 NM (172 km) from the DRINA waypoint, ATC cancelled all speed restrictions and instructed the crew to maintain maximum speed on descent, which the pilots understood as an instruction to make a high-speed descent. The FO said to the captain that they would ‘see how (the aircraft would) go’ with an airspeed of 320 kt, but that this might be too fast. The captain responded by saying ‘she’ll be right, don’t overspeed’.
Figure 1: Flight path of VH-VUE with DRINA NINE ALPHA STAR waypoints overlaid
Source: Google Earth, with aircraft track and Airservices Australia waypoint information overlaid by ATSB
Descent into Adelaide
Prior to commencing the descent, the crew set up the aircraft’s flight management system (FMS) based on the ATC clearance, and then commenced the approach briefing. The crew programmed a selected airspeed of 310 kt into the FMS.
At about 1652 the captain briefed the CS for the descent, advising that the aircraft would commence its descent to Adelaide in around 30 seconds, and that the expected arrival time was 15 minutes earlier than planned.
Soon after VUE began descending, airspeed started to increase. The FO made a number of changes to the autopilot mode and settings in order to prevent airspeed from increasing too much (see Recorded information). However, airspeed continued to increase. The crew remarked that the changes to the autopilot mode and settings did not help much, with the FO saying that the autopilot ‘doesn’t (manage airspeed) very well…it just doesn’t like to hold her steady’. The captain reminded the FO ‘don’t overspeed’.
Recorded data indicates the crew began increasing the selected airspeed on the mode control panel (MCP) incrementally during the early stages of the descent when approaching the start of the STAR. (Figure 11 in Appendix B – Flight data recorder data shows changes to the selected airspeed, actual airspeed, autopilot modes and other recorded parameters during the descent.)
At about 1654, when VUE was descending through FL 335, the flight crew made the ‘cabin crew prepare for landing’ announcement. Shortly after, the flight crew continued the approach briefing, including briefly reviewing threats (see Other flight crew procedures), then performed the descent checklist.
The crew selected the briefed descent airspeed of 320 kt at about 1656, when the aircraft was descending through FL 250, and the aircraft reached that speed soon after. VUE remained at 320 kt for the following few minutes.
About two minutes later, the aircraft was approaching waypoint DRINA descending through FL 220, when the FO saw the tops of stratocumulus cloud, which the FO thought were about at FL 150.
The FO suggested that it may be appropriate to activate the fasten seat belt sign. The captain responded that the conditions at the time were good, and the FO agreed with that assessment. The captain asked the FO if there were any reports or concerns of turbulence. The FO responded that there had been no reports and was not worried. The fasten seat belt sign remained off.
According to information provided in ATSB interviews after the accident, the captain also wanted to leave enough time for the cabin crew to complete their duties. The FO thought the clouds beneath VUE might be associated with turbulence later in the descent, but at that time the FO was comfortable with the seatbelts sign remaining off for ‘a bit longer’.
At around this time, the FO reduced the selected airspeed to 310 kt. Soon after, VUE commenced the turn towards COMLY.
Captain intervention
At about 1659, VUE was 15 NM (28 km) from COMLY and descending through FL 170. Airspeed reduced by around 10 kt to the selected 310 kt.
Airspeed then started to increase, first gradually, then more rapidly. The flight crew observed the indicated airspeed approaching VMO (maximum operating speed), and the FO observed the airspeed trend indicator[5] move past the lower band of the red bars on the primary flight display airspeed indicator. Both pilots expressed statements of concern and alarm.
The captain called ‘pull-up’ while also making two abrupt nose-up inputs on the left (captain-side) control column. The first was 49 lb (about 22 kg), which caused the autopilot to disconnect. The captain abruptly released the controls and then made a second control input of 28 lb (about 13 kg) about 4 seconds later.
The FO heard the autopilot disconnect audible alert and saw the captain pulling on the control column and acknowledged that the captain had control of the aircraft.
About 8 seconds after the captain’s initial nose-up input and autopilot disconnect, the captain prompted the FO to resume duties as pilot flying, and a normal transfer of control was performed. The flight crew perceived they had encountered severe atmospheric turbulence. Shortly after the FO resumed pilot flying duties, the captain said ‘better put the belts on’, to which the FO responded ‘check’.
The FO continued to fly the aircraft for around 30 seconds before re-engaging the autopilot. During this period, the FO made several nose-down inputs, peaking at 32 lb (about 15 kg) 10 seconds after the initial nose-up input. Shortly after the autopilot was re-engaged, cabin crew contacted the flight crew and reported that the cabin was not secure, and that one of the cabin crew members at the rear of the aircraft had broken their leg.
With the captain communicating with the cabin crew, the FO (who was pilot flying) notified ATC that VUE would not meet the height requirement for COMLY due to encountering turbulence. ATC advised the crew that they could cancel all height requirements and reduce their speed.
Around 90 seconds later, ATC contacted the crew of VUE to confirm their report of severe turbulence. The captain responded in the affirmative and added that the turbulence was associated with some cloud.
Events in the cabin
The cabin crew recalled that the flight had been smooth during the cruise and initial descent, with no turbulence experienced. At the time the flight crew made the ‘cabin crew prepare for landing’ announcement, the in-flight food and drink service had been completed and rubbish collected. Following this announcement, the cabin crew completed duties including securing the cabin for landing. The cabin crew then returned to the forward and rear of the aircraft, with the two cabin crew members in the rear of the aircraft standing in the galley eating a meal.
Cabin crew members recalled an abrupt upset in the cabin, which they perceived as sudden and without warning. One of the cabin crew members in the rear galley was thrown up towards the ceiling, then fell to the floor. The cabin crew member felt their leg snap on landing and was unable to move from the floor.
The sudden changes in pitch attitude also injured the other crew member in the rear of the aircraft. This crew member struck their jaw on the galley bench and had other minor injuries to their body and face.
The CS reported to the ATSB that they experienced muscular skeletal injuries from the accident and had sought out chiropractic care.
After the aircraft had stabilised, the cabin crew member who suffered a leg injury was given oxygen using a portable on-board cylinder.
At about 1704, the CS confirmed with the flight crew the requirement for an ambulance and that the injured cabin crew member was unable to move to a seat for landing and would stay on the galley floor.
The CS then made positional changes among the cabin crew, moving the uninjured cabin crew member from the forward cabin to the rear, and the cabin crew member who sustained minor head injuries to the front. The CS also briefed able-bodied passengers in the last seating row about what the cabin crew might request, to assist with disembarkation if the situation escalated or in case of another emergency. The cabin crew members took their assigned seats for landing.
Coordination and response at Adelaide Airport
At about 1702, the captain contacted VA ground personnel in Adelaide and notified them that a cabin crew member had been injured during turbulence and requested an ambulance on arrival.
The flight crew then notified ATC about the injured cabin crew member and requested Aviation Rescue Firefighting (ARFF) personnel to meet VUE at the arrival gate to provide first aid until the ambulance arrived.
Around the same time, VA personnel notified the SA Ambulance Service (SAAS) of the injury on-board VUE, and that an ambulance was required at the emergency gate at Adelaide Airport, to go airside.[6]
At about 1709, ATC notified ARFF about the accident, and a crew were dispatched around two minutes later. An ARFF officer also contacted SAAS, to confirm an ambulance was en route. During this phone call, the ARFF officer directed the ambulance to the arrival gate via the upstairs sections of the main terminal.
VUE arrived at its bay at around 1719. ARFF personnel had pre-positioned at the bay and entered the cabin via the rear stairs soon after the aircraft arrived. A VA ground supervisor also came into the cabin to assist with the situation. The SAAS patient treatment record indicated the ambulance crew arrived at the Adelaide Airport terminal entrance at 1719, and proceeded to the arrival gate, commencing treatment at 1725.
There was extensive discussion between the ARFF, the SAAS and the VA ground supervisor about how to remove the injured cabin crew member from the aircraft. With a badly broken leg, the injured cabin crew member was not able to walk or to sit in a wheelchair, and the ambulance stretcher did not fit down the aircraft aisle. The emergency services personnel suggested using a scissor lift or catering truck appliance and asked the ground supervisor to assist with this. The ground supervisor advised that no scissor lift was available and declined the use of the catering truck.
After considerably more deliberation, the injured cabin crew member suggested that the ambulance officers conduct the extraction from the aircraft using a slide sheet. Emergency services personnel used the slide sheet to drag the injured cabin crew member along the aisle to the front of the aircraft, then placed the injured cabin crew member on a stretcher. SAAS records showed the ambulance departed the airport at 1845.
The captain joined Virgin Australia (VA) as a Boeing 737 (737) first officer in 2003 and received command upgrade in 2012. The captain had a total flying experience of around 18,000 hours, including over 4,000 hours as captain and almost 6,000 hours as a first officer in the 737.
The captain reported being rested before starting work on the day of the accident. The captain woke at around 0530 for a 0930 sign on, had completed two short sectors prior to the accident flight and had one short sector scheduled afterwards. On the second sector, the captain had flown into Melbourne with the accident flight first officer (FO).[7]
The FO joined VA as a Boeing 777 second officer in 2010, and qualified as a 737 FO in 2012. The FO had a total experience of around 8,500 hours, including around 3,500 hours in the 737.
The FO reported having a normal sleep on the night before the accident and was feeling alert at the top of descent into Adelaide. The FO recalled waking at 0500 on the day of the accident and leaving for work at 0645 for a 0830 sign on. The accident flight was the FO’s third of four scheduled short sectors that day.
Cabin crew information
The cabin supervisor (CS) joined VA in 2003 and became cabin supervisor in 2004. The CS was also involved in training other cabin crew, including instructing cabin crew non-technical skills.
The cabin crew member who sustained serious leg injuries had worked as a cabin crew member since 2002 and joined VA in 2005. The cabin crew member also had qualifications as an enrolled nurse, and was a first aid instructor at VA.
The cabin crew member who sustained minor head and facial injuries had only recently joined VA, and the accident occurred on this cabin crew member’s first day after paired ‘buddy’ training.
Aircraft information
VH-VUE was a Boeing 737-800. There were no indications that any mechanical issues with the aircraft were contributory to the accident. After the accident, maintenance personnel conducted a severe turbulence inspection which did not identify any damage or faults.
Airspeed indications
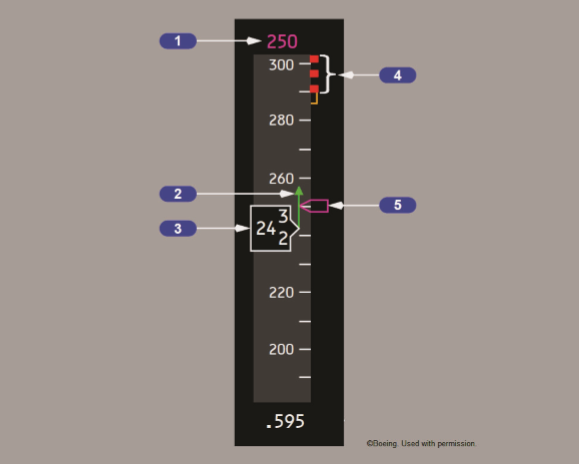
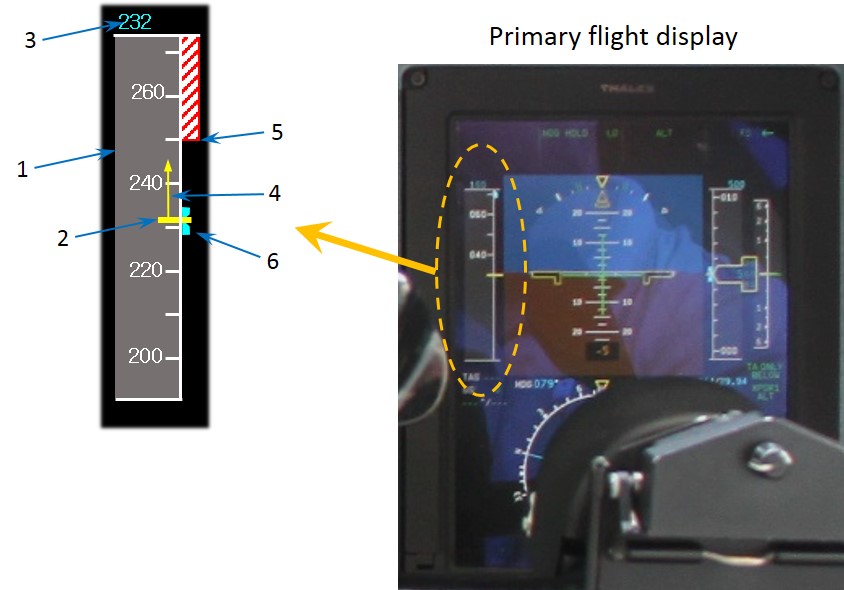
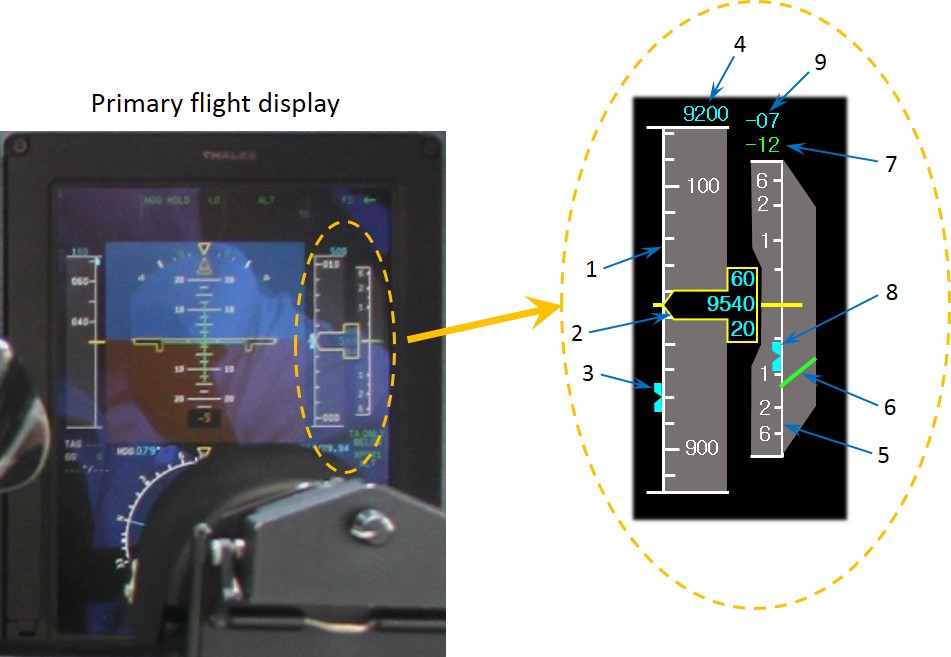
Figure 2 illustrates how airspeed indications are displayed to the crew on the 737 primary flight display.
Figure 2: Airspeed indications on the 737 primary flight display
Source: Boeing 737 Flight Crew Operating Manual (FCOM). Copyright Boeing.
Item 1 and Item 5: Selected airspeed. The magenta numbers (Item 1) and speed bug (Item 5) display the targeted airspeed, set by the pilots. In the example shown, this is 250 kt.
Item 2: Speed trend vector. The green arrow displays the predicted airspeed in 10 seconds time. This prediction is derived from the air data inertial reference system and is based on the current airspeed and acceleration. In the example shown, the green arrow predicts the airspeed increasing to about 258 kt.
Item 3: Current airspeed. The white value displays the current calibrated airspeed. The value shown is between 242 and 243 kt.
Item 4: Maximum operating speed. The lower of the red bars indicates the maximum speed as limited by lowest of the landing gear placard speed, flap placard speed, or VMO/MMO.
Prior to the autopilot disconnect, the flight crew observed the current indicated airspeed increase to near VMO. The FO also observed the speed trend vector increase to within the lower band of the red bars, indicating that if not slowed the airspeed would exceed VMO within the next 10 seconds. According to the captain’s interview with the ATSB, the captain did not specifically look at the speed trend vector prior to pulling back on the control column in response to the sudden speed increase.
Autopilot modes and airspeed management
Airspeed is the result of the balance between thrust and drag, both of which can be controlled by the automatic flight system (AFS) or the flight crew. The 737 AFS consists of the automatic flight director system (AFDS) and the autothrottle and can operate in multiple vertical and lateral navigation modes. When engaged, the vertical navigation modes control the vertical path and speed by adjusting engine thrust (through the autothrottle) and pitch attitude (through the AFDS). The vertical navigation modes seek to maintain waypoint altitude and speed crossing restrictions programmed into the flight management system in the vertical navigation path mode, or values input to the vertical speed and altitude controls on the mode control panel (MCP).
When the autothrottle is engaged in a mode to control airspeed, the airspeed is adjusted by increasing or decreasing the engine thrust. Alternatively, when the AFDS is in a mode that controls airspeed, airspeed is adjusted by changing the pitch attitude to increase or decrease the drag. To increase the airspeed, the pitch is reduced (nose down), and to decrease the airspeed the pitch is increased (nose up). Depending on the mode engaged, the AFS alters the pitch or thrust commands to attain and/or maintain either the airspeed selected in the flight management system or on the MCP.
Sudden changes in the magnitude of head/tailwind can have the effect of changing the airspeed. For example, a decrease in a tailwind can result in an effective increase in airspeed, all other factors being equal. In order to maintain the target airspeed, the AFS will either pitch the nose of the aircraft up or down, or increase/decrease thrust (depending on the selected mode).
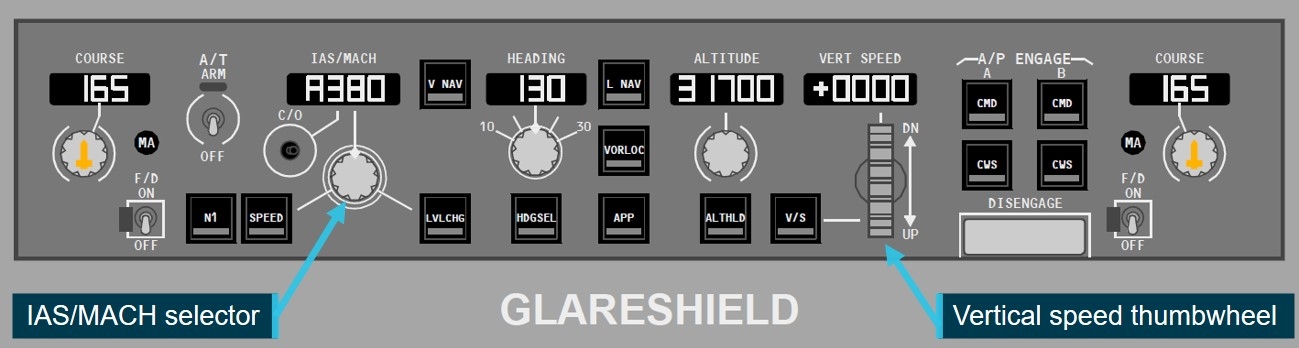
Figure 3 shows the 737 MCP. Located on the glareshield panel, pilots use the MCP to select autopilot modes, and change autopilot target values such as airspeed and vertical speed. For example, pilots can use the IAS/MACH selector to change the MCP selected airspeed or use the vertical speed thumbwheel to change the target vertical speed.
Figure 3: 737 mode control panel
Source: Boeing 737 FCOM. Annotated and cropped by ATSB. Copyright Boeing.
For most of the descent into Adelaide, the pilots engaged the AFS in level change mode. In this mode, the autothrottle engages in the RETARD then ARM modes, meaning the autothrottle reduces the thrust setting to idle, and the pilots have manual thrust control using the thrust levers. The AFDS engages the speed mode, which means the AFDS commands adjustments to pitch attitude to maintain the speed set in the MCP IAS/MACH selector. The AFS system will not accept a selected airspeed greater than VMO.
The FO, who was pilot flying (PF), also intermittently selected the vertical speed mode. In this mode, the AFDS commands pitch attitude adjustments to hold the target vertical speed entered using the MCP vertical speed thumbwheel. The autothrottle is engaged in speed mode to hold the selected airspeed. In descent, engine thrust will be at idle, meaning the autothrottle cannot reduce thrust to target a reduced airspeed.
The AFS mode reversion provides automatic controls which provide additional protections when the AFDS or autothrottle alone are insufficient to prevent exceeding a placard limit speed. In the case of VMO, if the autothrottle is engaged in speed mode and the thrust levers are at idle, the engine thrust cannot be reduced further to prevent a speed increase. If the AFDS is in vertical speed mode, the AFS mode will automatically change to level change mode to provide speed control using pitch attitude changes.
Although different AFS modes automatically maintain the selected airspeed and prevent VMO overspeed, the AFS is not capable of preventing temporary exceedances in certain circumstances. Where the aircraft encounters sudden environmental changes, such as severe windshear, this may exceed the performance capability of the AFS. This may result in temporary overspeed, particularly when the aircraft is operating close to VMO or other limit speeds.
Control options for disconnecting the autopilot
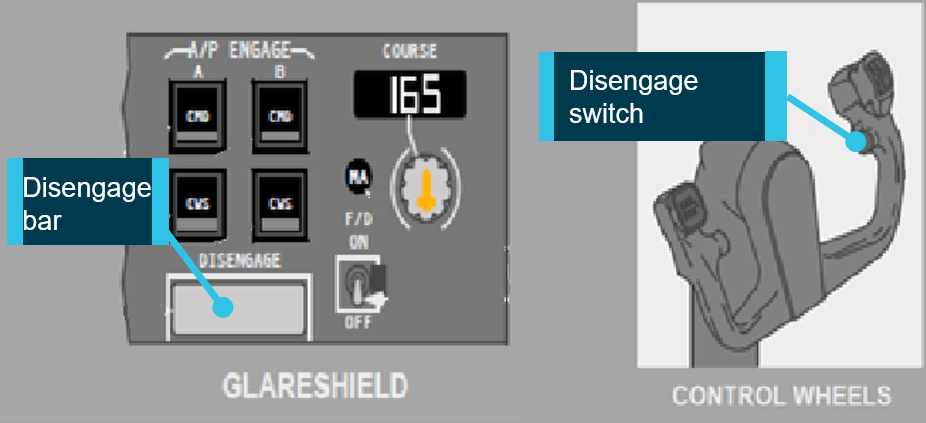
Figure 4 shows the 737 autopilot disengage controls. The autopilot is typically disengaged by pressing the autopilot disengage button on either control wheel. A ‘disengage’ bar is also available on the MCP, which can be pulled down to disengage the autopilot. The position and design of these controls is such that they are accessible from the position of either pilot, and are simple to operate.
Figure 4: 737 Autopilot disengage controls
Source: Boeing 737 FCOM, Cropped and annotated by ATSB. Copyright Boeing.
The autopilot will also disengage if the pilot applies sufficient force to ‘breakout’ or ‘pull through’ the flight controls. After the autopilot has been disconnected, the pilot has full manual control of the aircraft’s pitch and roll attitude. An audible autopilot disconnect alert tone is produced whenever the autopilot is disconnected.
For this event, the captain pulled back on the flight controls, and did not report using either the disengage bar or switch. This action resulted in the autopilot disconnecting due to the breakout function.
Speed brakes
Pilots can extend the 737 speed brakes to increase drag, using the speed brake lever. The Boeing 737 Flight Crew Training Manual (FCTM) provided procedures for using the speed brakes in-flight. These procedures said that ‘the speedbrake may be used to correct the descent profile if arriving too high or too fast’. These procedures also noted that using speed brakes enabled the aircraft to decelerate up to 50 per cent more quickly.
For this event, the pilots did not use speed brakes to reduce airspeed prior to the overspeed or during the recovery.
Atmospheric conditions
Crew perceptions of weather conditions
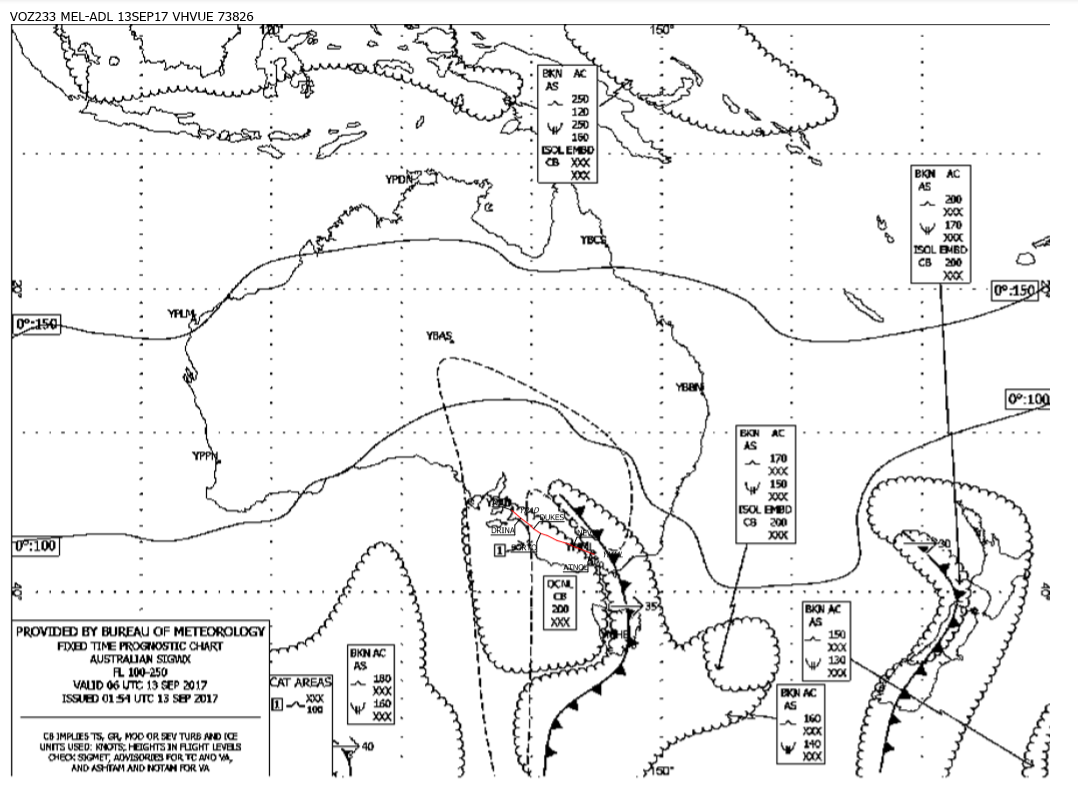
In preparation for the flight, the pilots reviewed information about the forecast meteorological conditions. The information provided to the pilots included the significant weather charts for Australia for Flight Level (FL) 100-250 and FL 250-650, as well as the trend forecast, meteorological aerodrome report and aerodrome forecast for Adelaide. Other documents included the VA operational flight plan for the flight to Adelaide.
The significant weather charts (shown in Appendix C – Significant weather chart) forecast an area of moderate clear air turbulence from FL 100 to FL 250, which covered the planned route from around 95 NM (175 km) east of Adelaide. The aerodrome forecast for Adelaide was for westerly winds of 20 kt with gusts up to 30 kt, together with intermittent periods of reduced visibility in rain showers and small hail, and broken cloud at 2,500 ft.
The operational flight plan included a dispatcher note to the crew stating that the flight had been planned at FL 360 as this level had been reported ‘smooth’ by previous crews.
The captain reported considering that the overall weather conditions were mostly fine, although noting there was a chance of clear air turbulence en route. The FO identified that conditions may include gusty winds, and noted the forecast included small hail.
The crew reported that the actual conditions for the majority of the descent were smooth. At interview, the FO said that VUE was not in cloud at any time. At the time of the overspeed and sudden changes in pitch attitude, the FO recalled that that VUE was passing through thin wispy cloud.
The captain reported being surprised by the overspeed and perceived turbulence, because there had not been any returns on the weather radar, and that VUE was flying in light cirriform type cloud. The captain recalled the crew had not received any reports of turbulence from ATC or other aircraft. The captain’s initial notification of the accident to the ATSB stated that the overspeed and perceived turbulence occurred when VUE was in cirrus type cloud tops.
At 1645, a pilot of an aircraft departing Adelaide reported to the Adelaide approach controller that they had encountered light and occasionally moderate turbulence between FL 140 to 170. The crew on board VUE were not aware of this report.
Atmospheric data recorded by aircraft
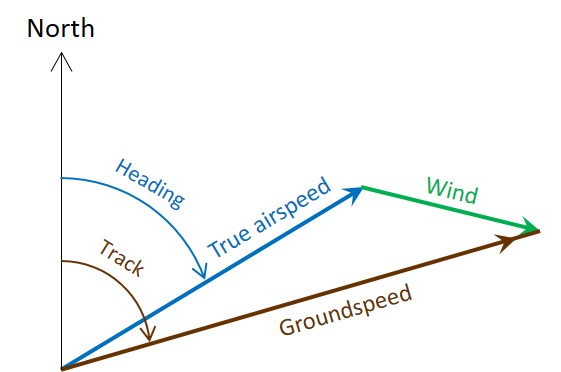
The ATSB derived estimates of the instantaneous local wind speeds during the descent using the airspeed, groundspeed, track and heading information recorded by the flight data recorder (FDR).
The path that the aircraft travels over the ground is a combination its speed and direction through the air and the movement of the air through which it is travelling. As such, the local wind vector (speed and direction) is derived as the difference between the true airspeed and the groundspeed vectors, as shown in Figure 5.
Figure 5: Calculation of local wind vector (green) using the true airspeed (blue) and groundspeed (brown) vectors.
Source: ATSB
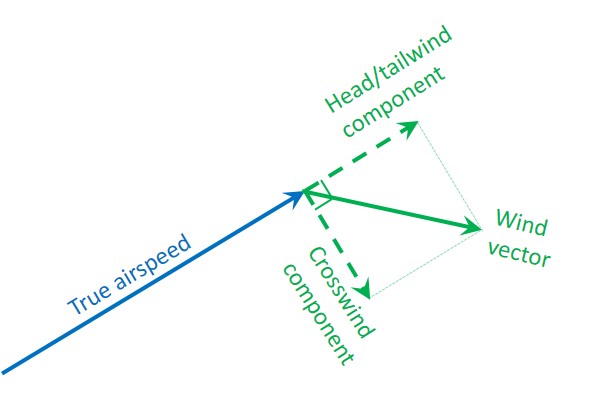
The wind vector may be illustrated as two components when referenced to the true airspeed. The component of the wind vector parallel to the true airspeed is the head/tailwind component, and the perpendicular component is the crosswind (Figure 6). The wind vector represents the direction that the wind is coming from, so with reference to the aircraft, a positive parallel component is a tailwind.
Figure 6: Wind components. The component of the wind that is parallel to the true airspeed is the head/tailwind and the perpendicular component is the crosswind.
Source: ATSB
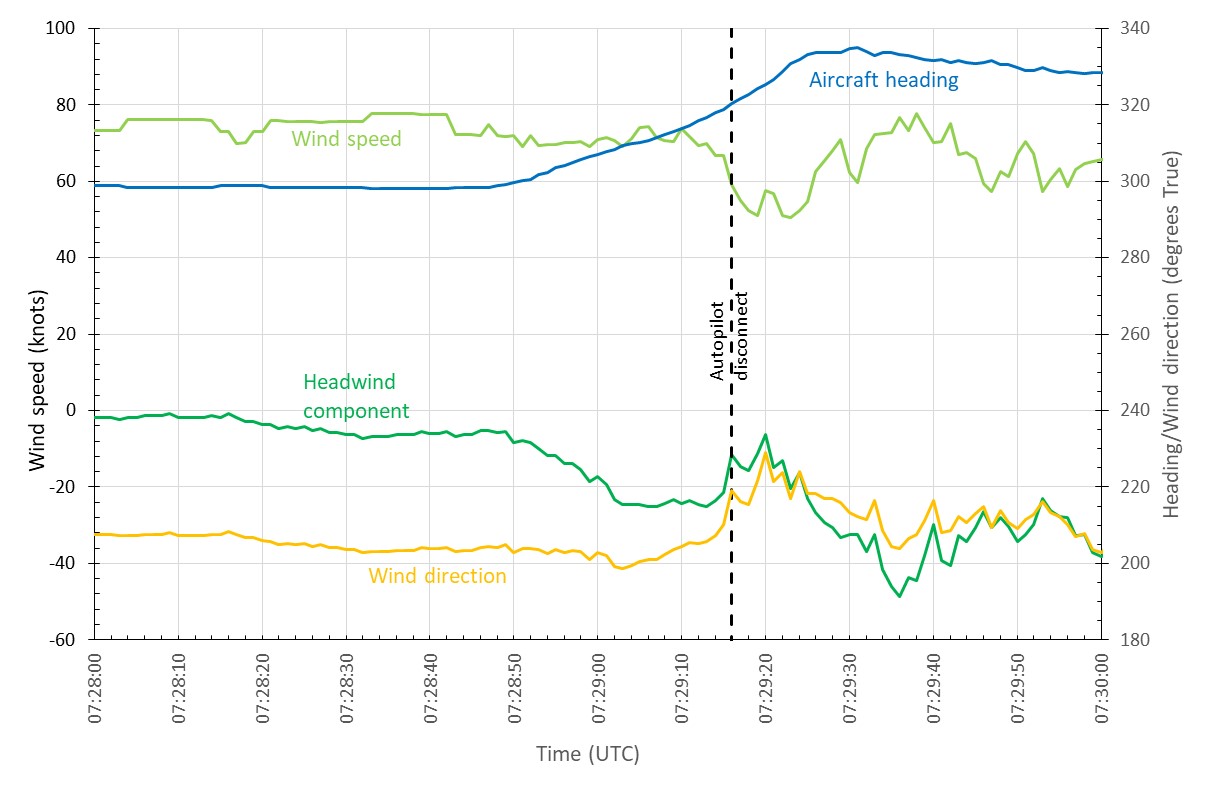
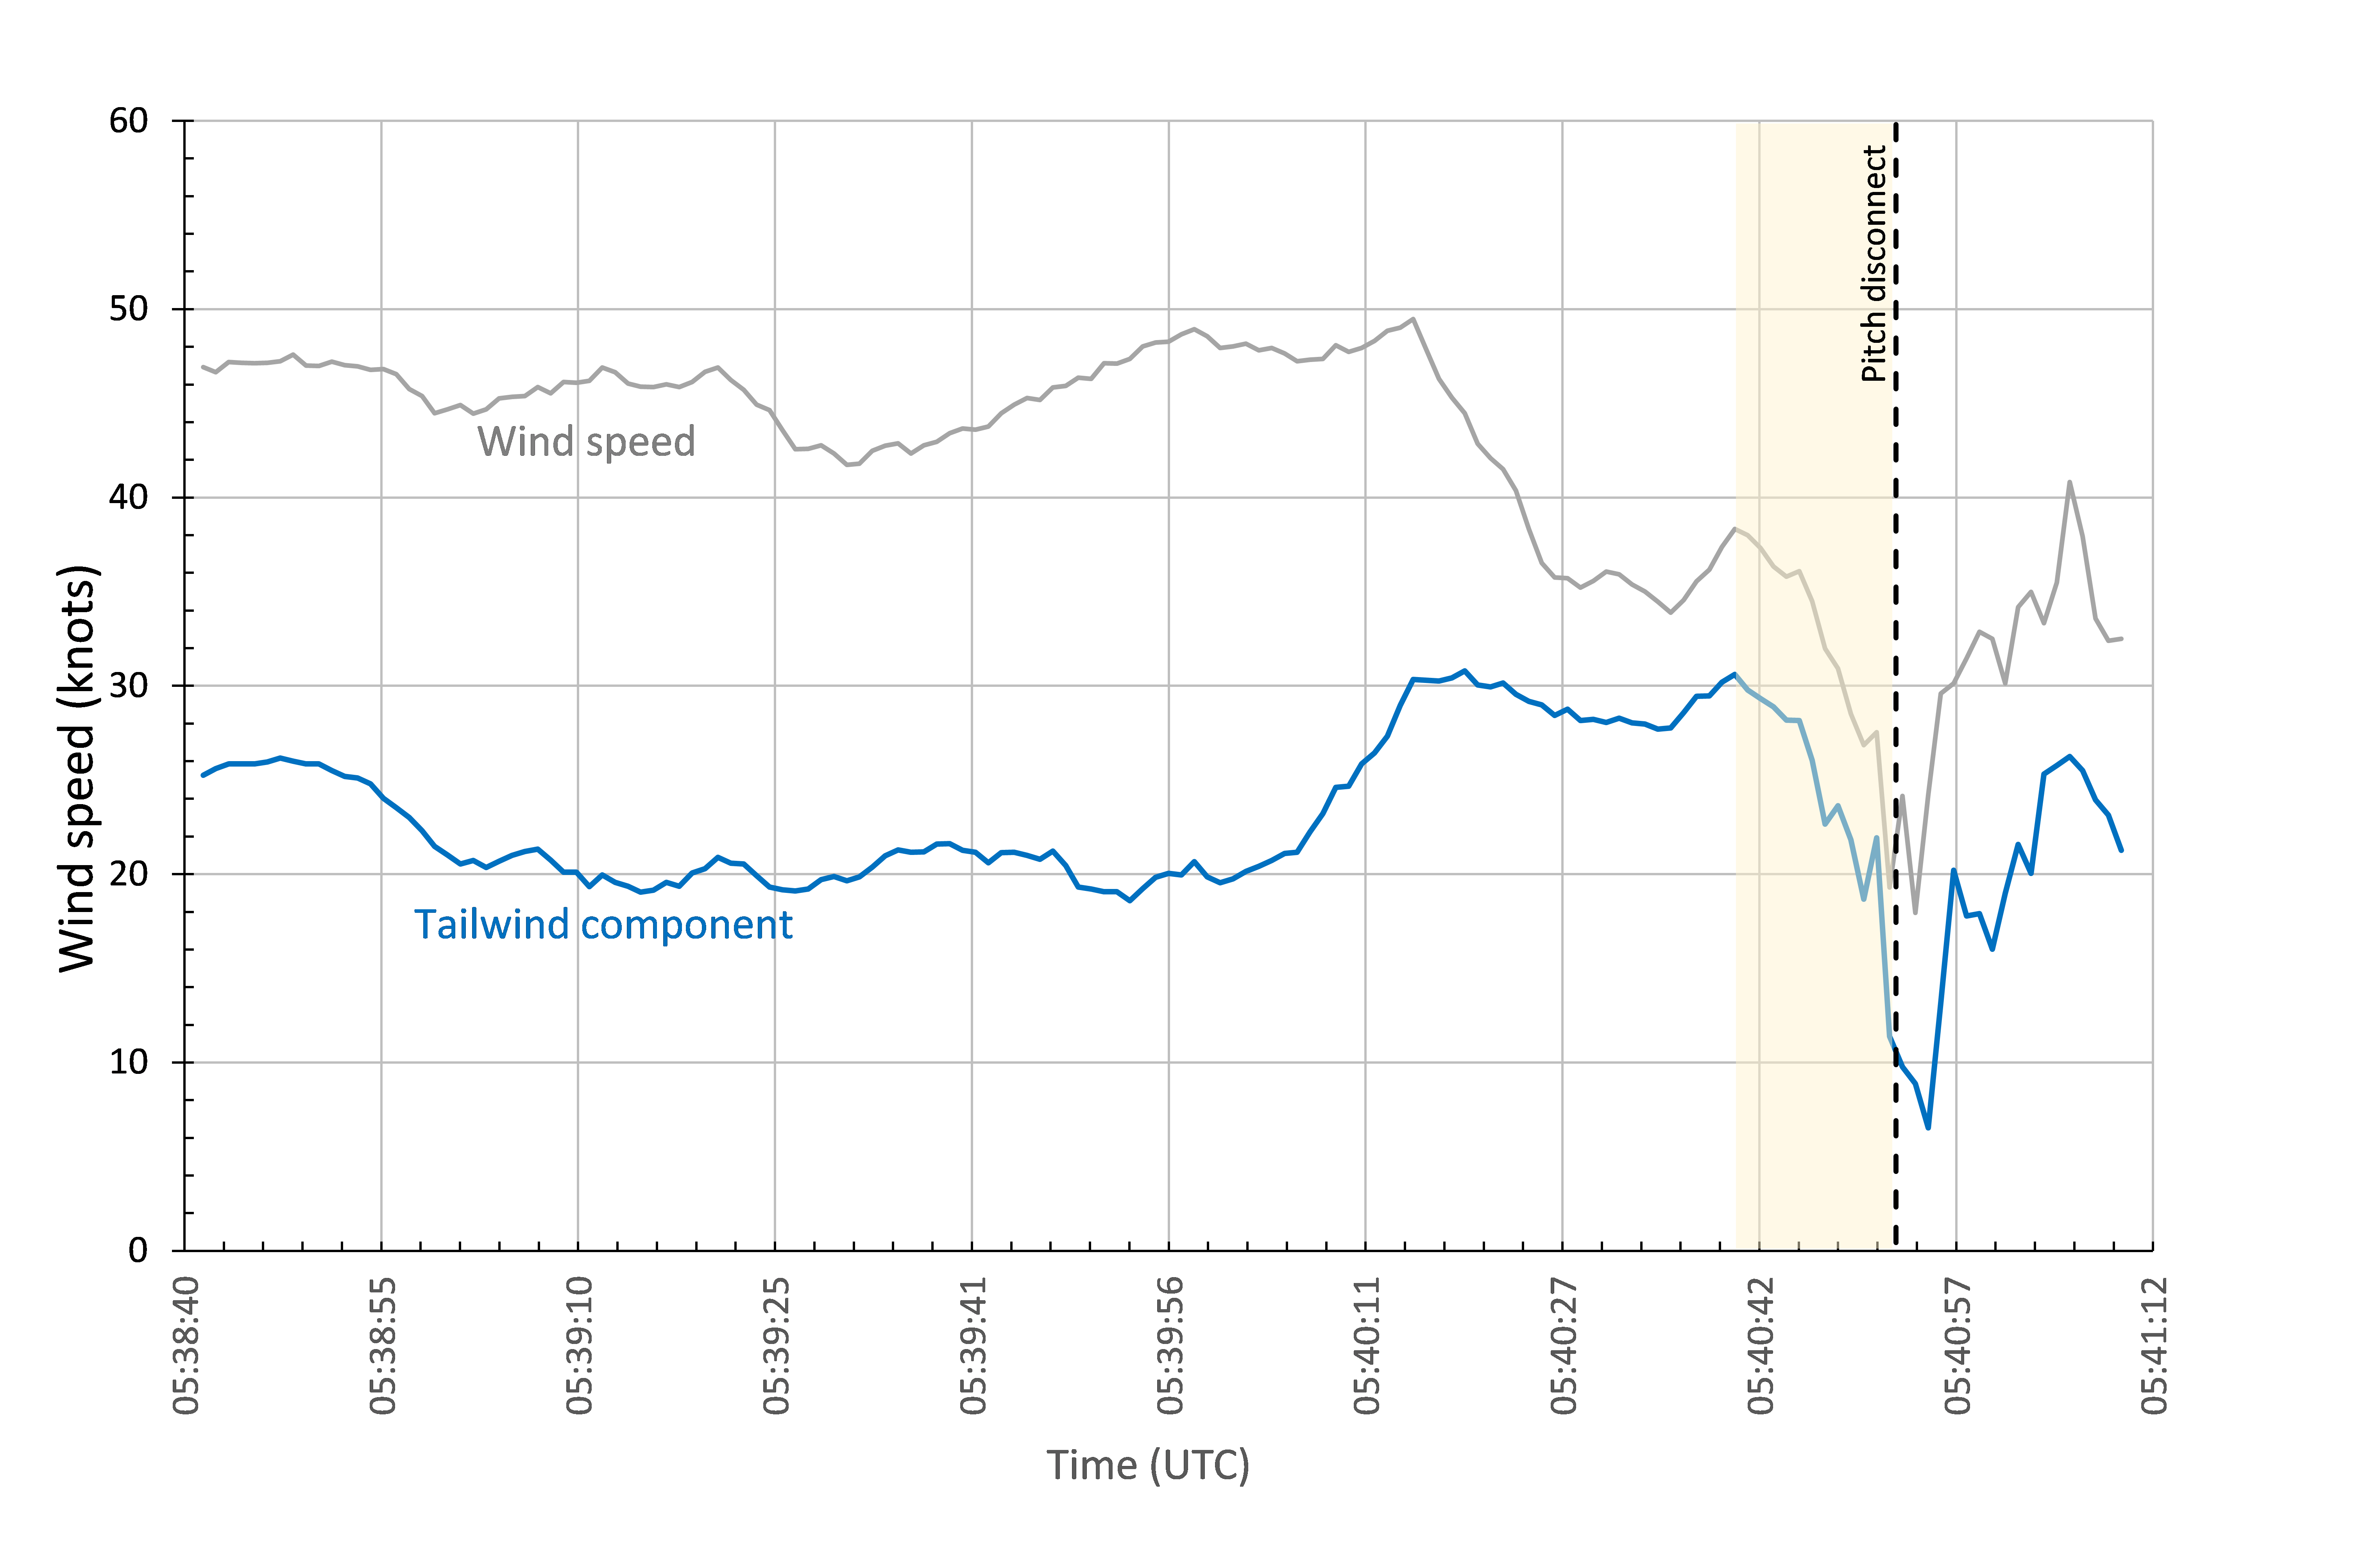
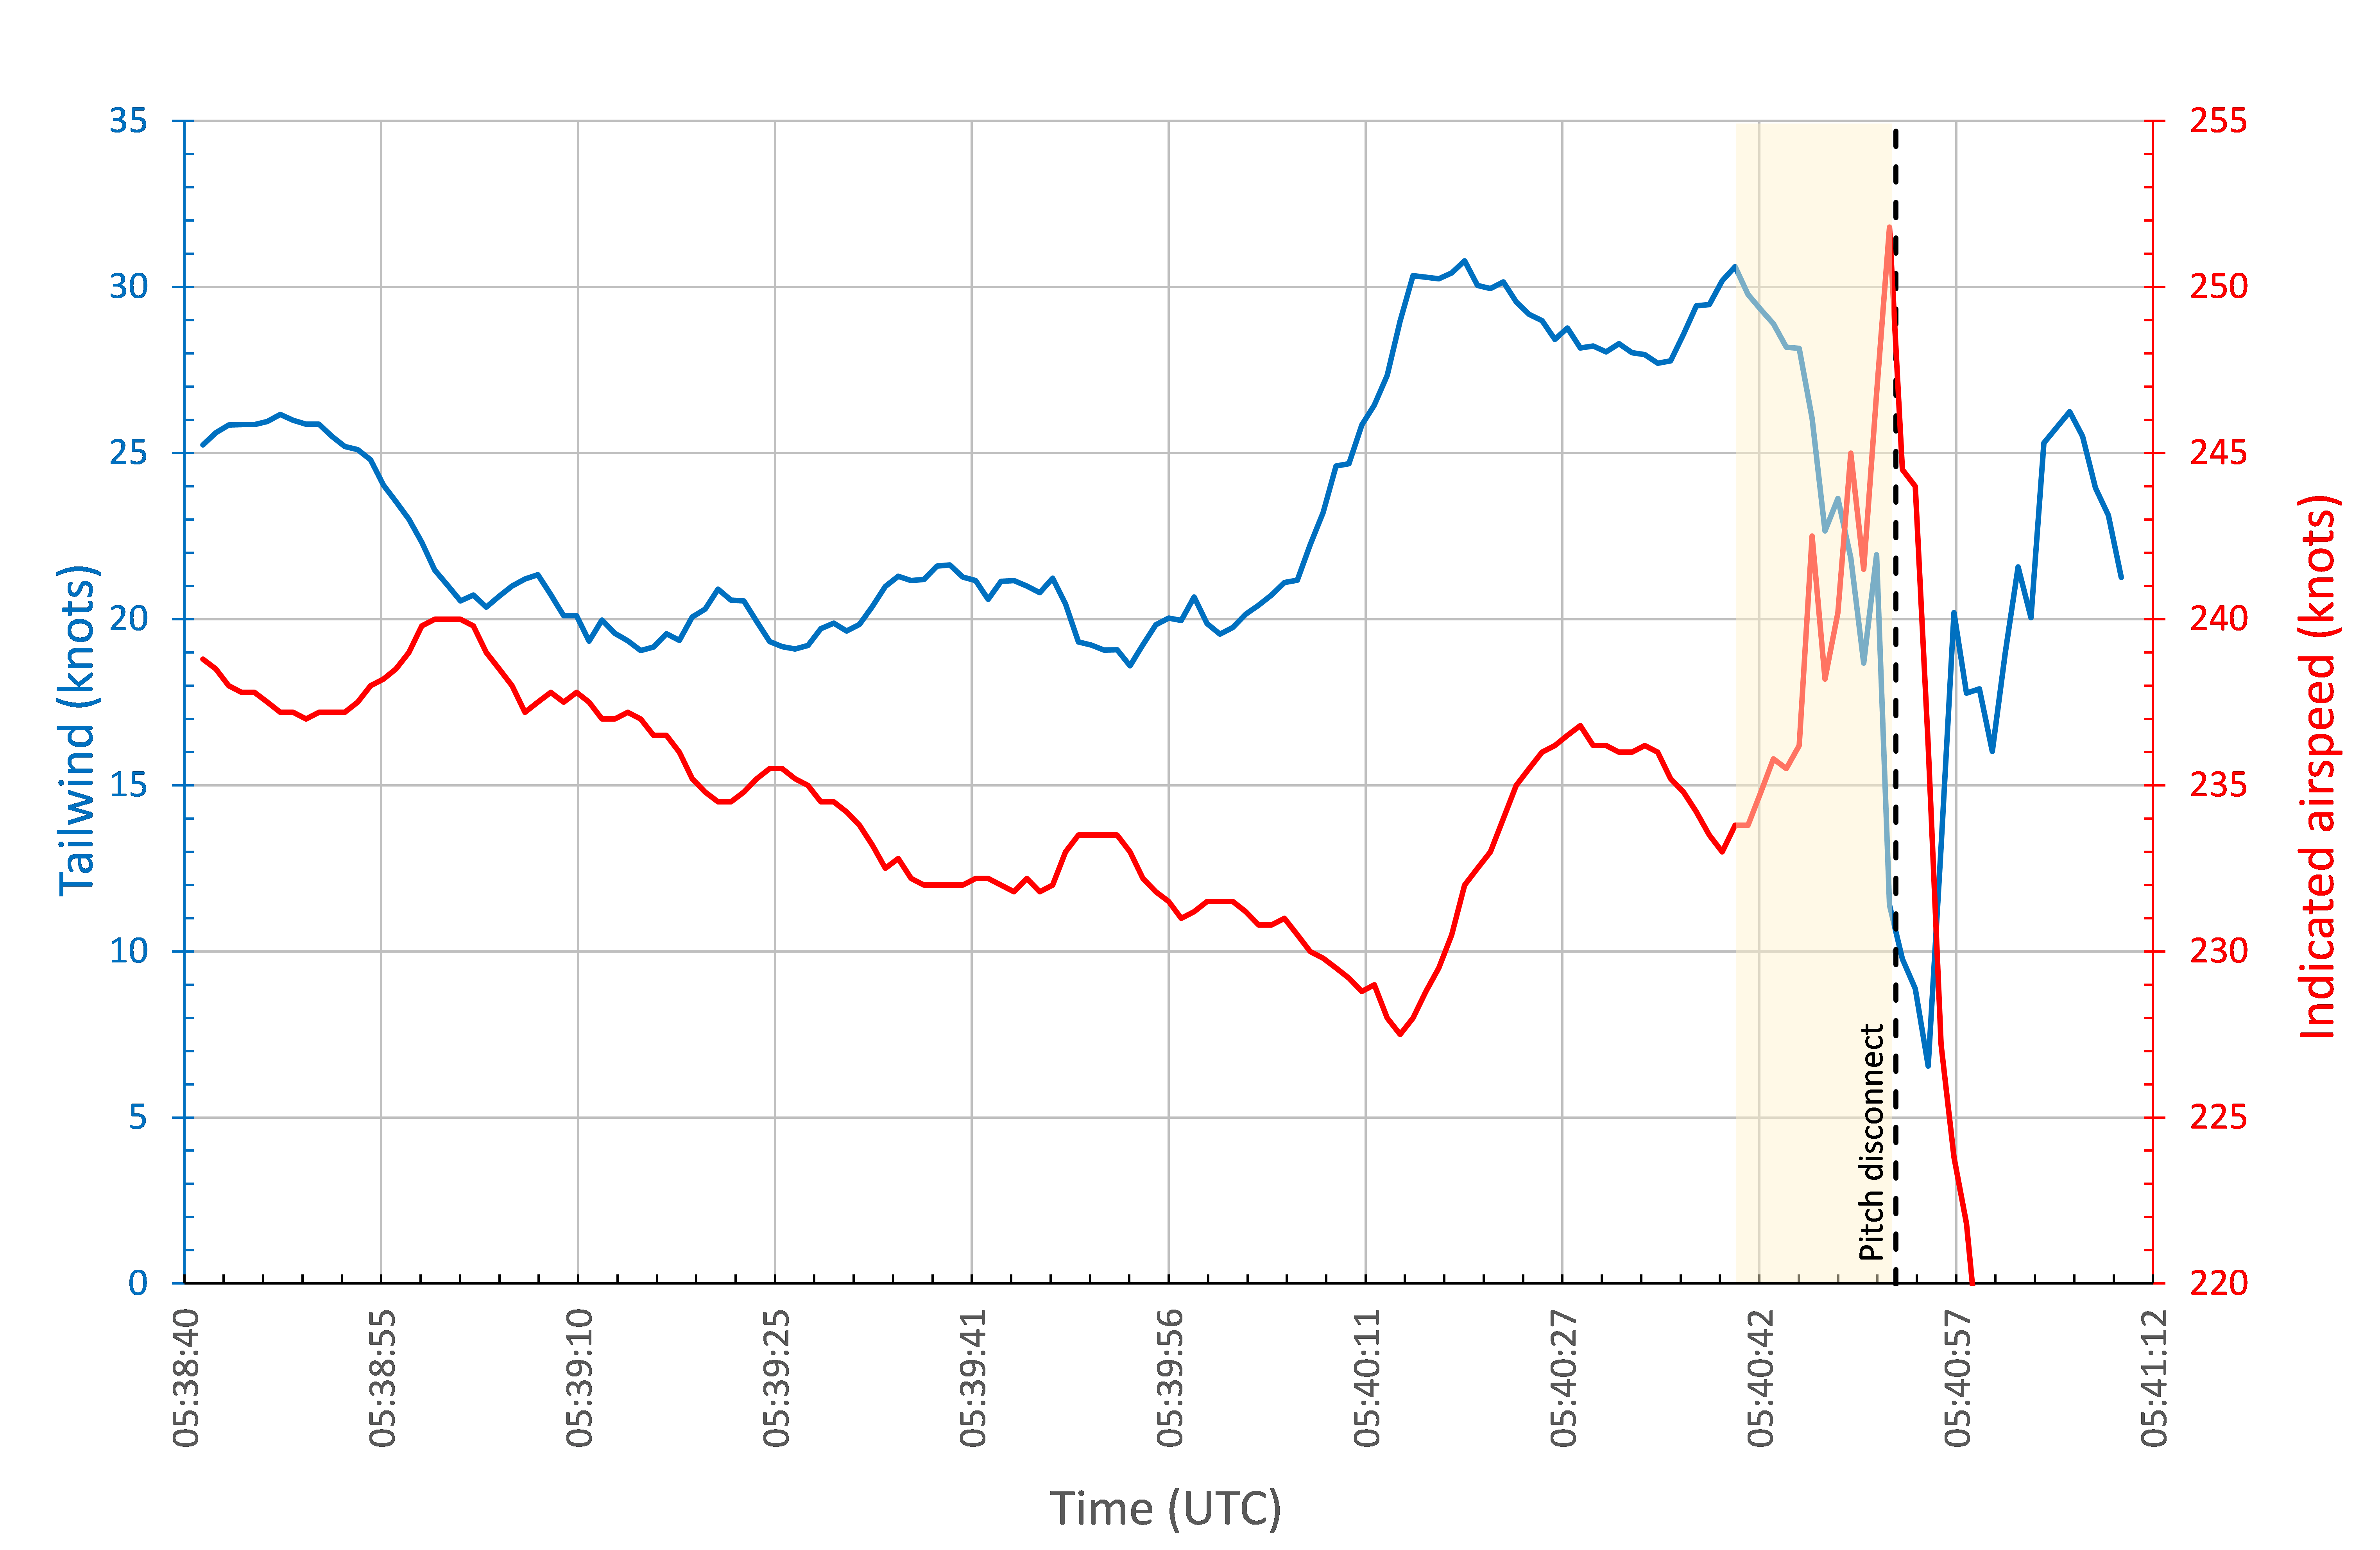
Figure 7 shows the variation in the calculated wind vector and headwind components around the time of the autopilot disconnect. During that period, the wind component changed from almost no headwind component to a tailwind of about 25 kt, where it stabilised for about 10 seconds. Immediately before the overspeed, tailwind dropped by about 13 kt in around 2 seconds. This appears to have been due to a combination of a decrease in the wind strength and a change in the direction of the wind.
Figure 7: Plot of the calculated wind (light green), wind direction (yellow), headwind component (dark green), and aircraft heading (blue) during a two minute period around the autopilot disconnect.
Source: ATSB
Estimating wind information from FDR data is complex, and the reliability and validity of information recorded by aircraft sensors may be influenced by factors such as the sensor location and the sampling rate. Aircraft are also operating in a complex three-dimensional environment, where the aircraft body angles may not be aligned with the aerodynamic flight path vectors (for example, the vector directions may be effected by angle of attack and sideslip angles).[8] The ATSB analysis was based on a simplified two-dimensional model of the aircraft environment.
While the ATSB’s analysis is appropriate for the purpose of estimating relative changes in the wind, analysis conducted by the manufacturer provided further certainty on the estimated wind changes. The manufacturer conducted a kinematic consistency analysis, which they describe as being ‘used to correct inherent inconsistencies often present in recorded data from different sensors because of the presence of instrumentation biases due to misalignment in inertial measurements, contamination of pressure and altitude measurements due to flow separation, and sample rate differences.’
The manufacturer’s kinematic consistency analysis also found that there was a sudden decrease in the tailwind component shortly before the airspeed rapidly increased towards VMO. This change in tailwind component was of a similar magnitude to that calculated in the ATSB’s analysis.
Recorded information
Personnel from VA secured a copy of the quick access recorder (QAR) data for analysis and provided a copy of that data to the ATSB. The FDR and cockpit voice recorder (CVR) were also removed and sent to the ATSB laboratory in Canberra for analysis. The following describes the recorded sequence, changes to the aircraft autopilot modes and key flight data parameters during the descent into Adelaide:
The flight crew commenced the descent with the autopilot engaged. Shortly after commencing the descent, the FO selected the level change AFS mode. There was a gradual increase in airspeed from around 1653:30, when VUE was descending through FL 340.
At 1654:10, the FO briefly changed the AFDS command mode to vertical speed, with a setting of -650 ft/min, winding back to -450 ft/min. This was consistent with the pilots controlling the aircraft speed by reducing the descent rate. A few seconds later, the level change mode was re-engaged.
The computed airspeed reached the selected target airspeed (320 kt) about 1656:30, as VUE was passing through FL250. For the next few minutes, airspeed was stable at around 320 kt.
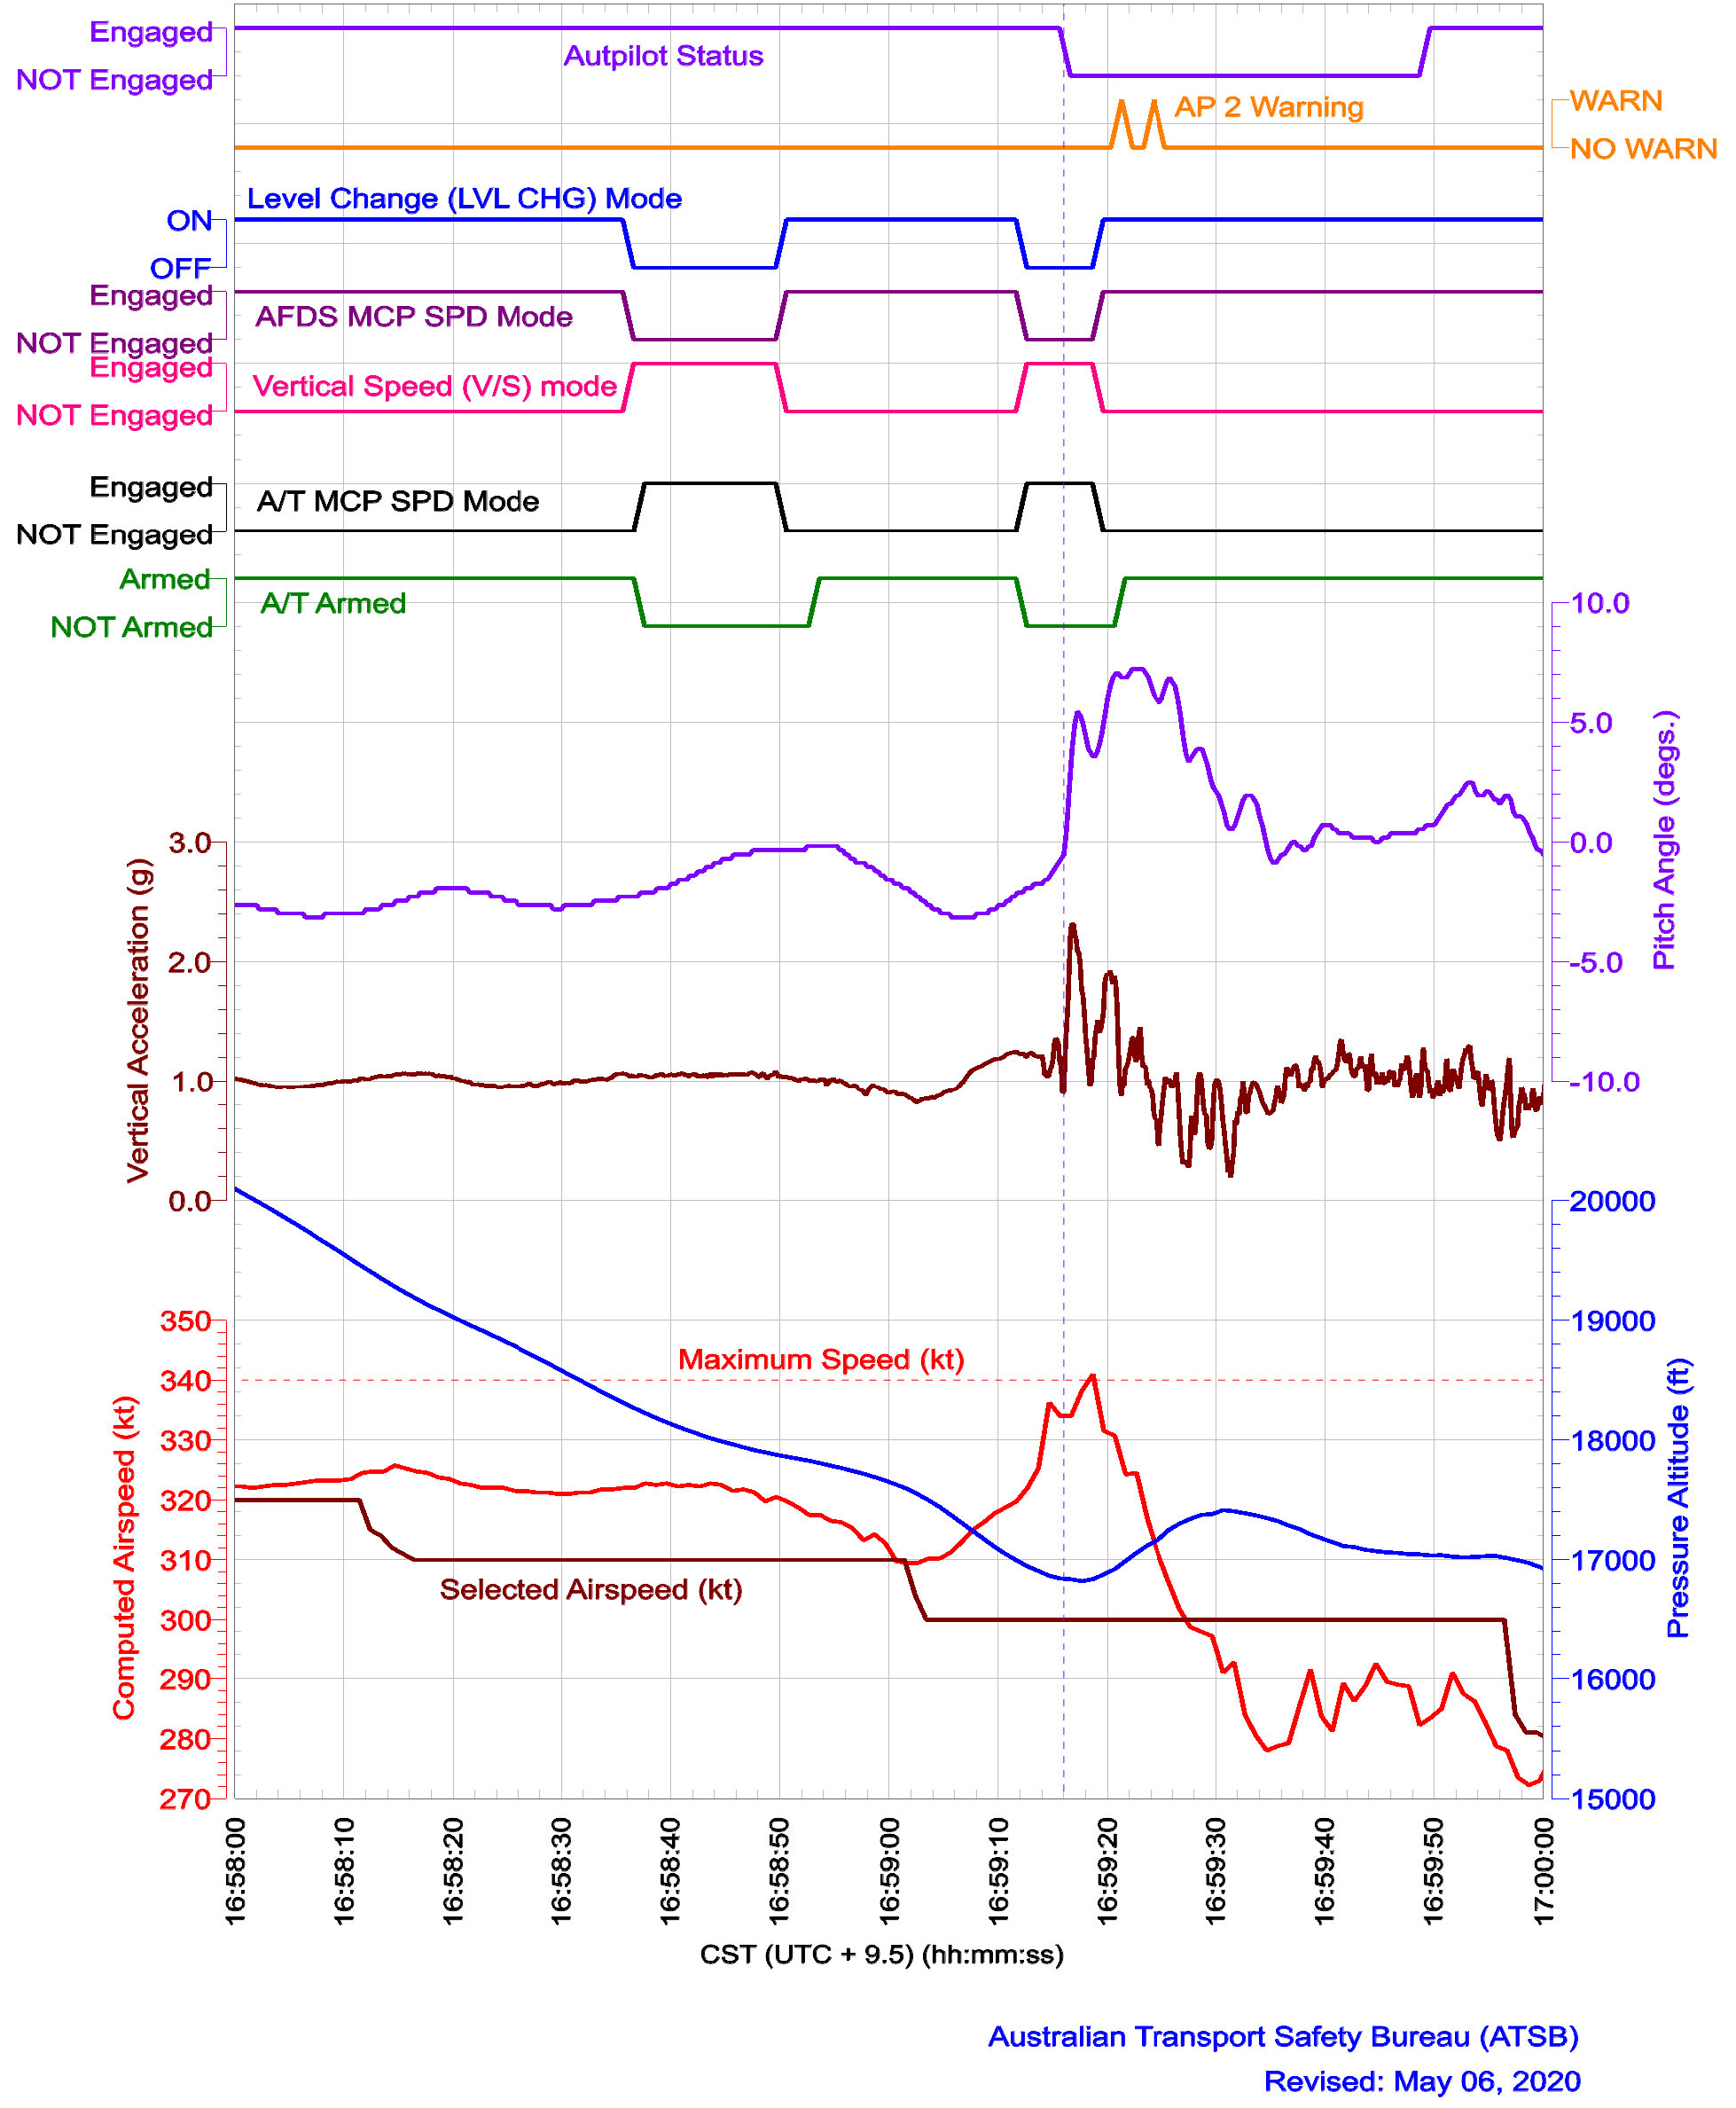
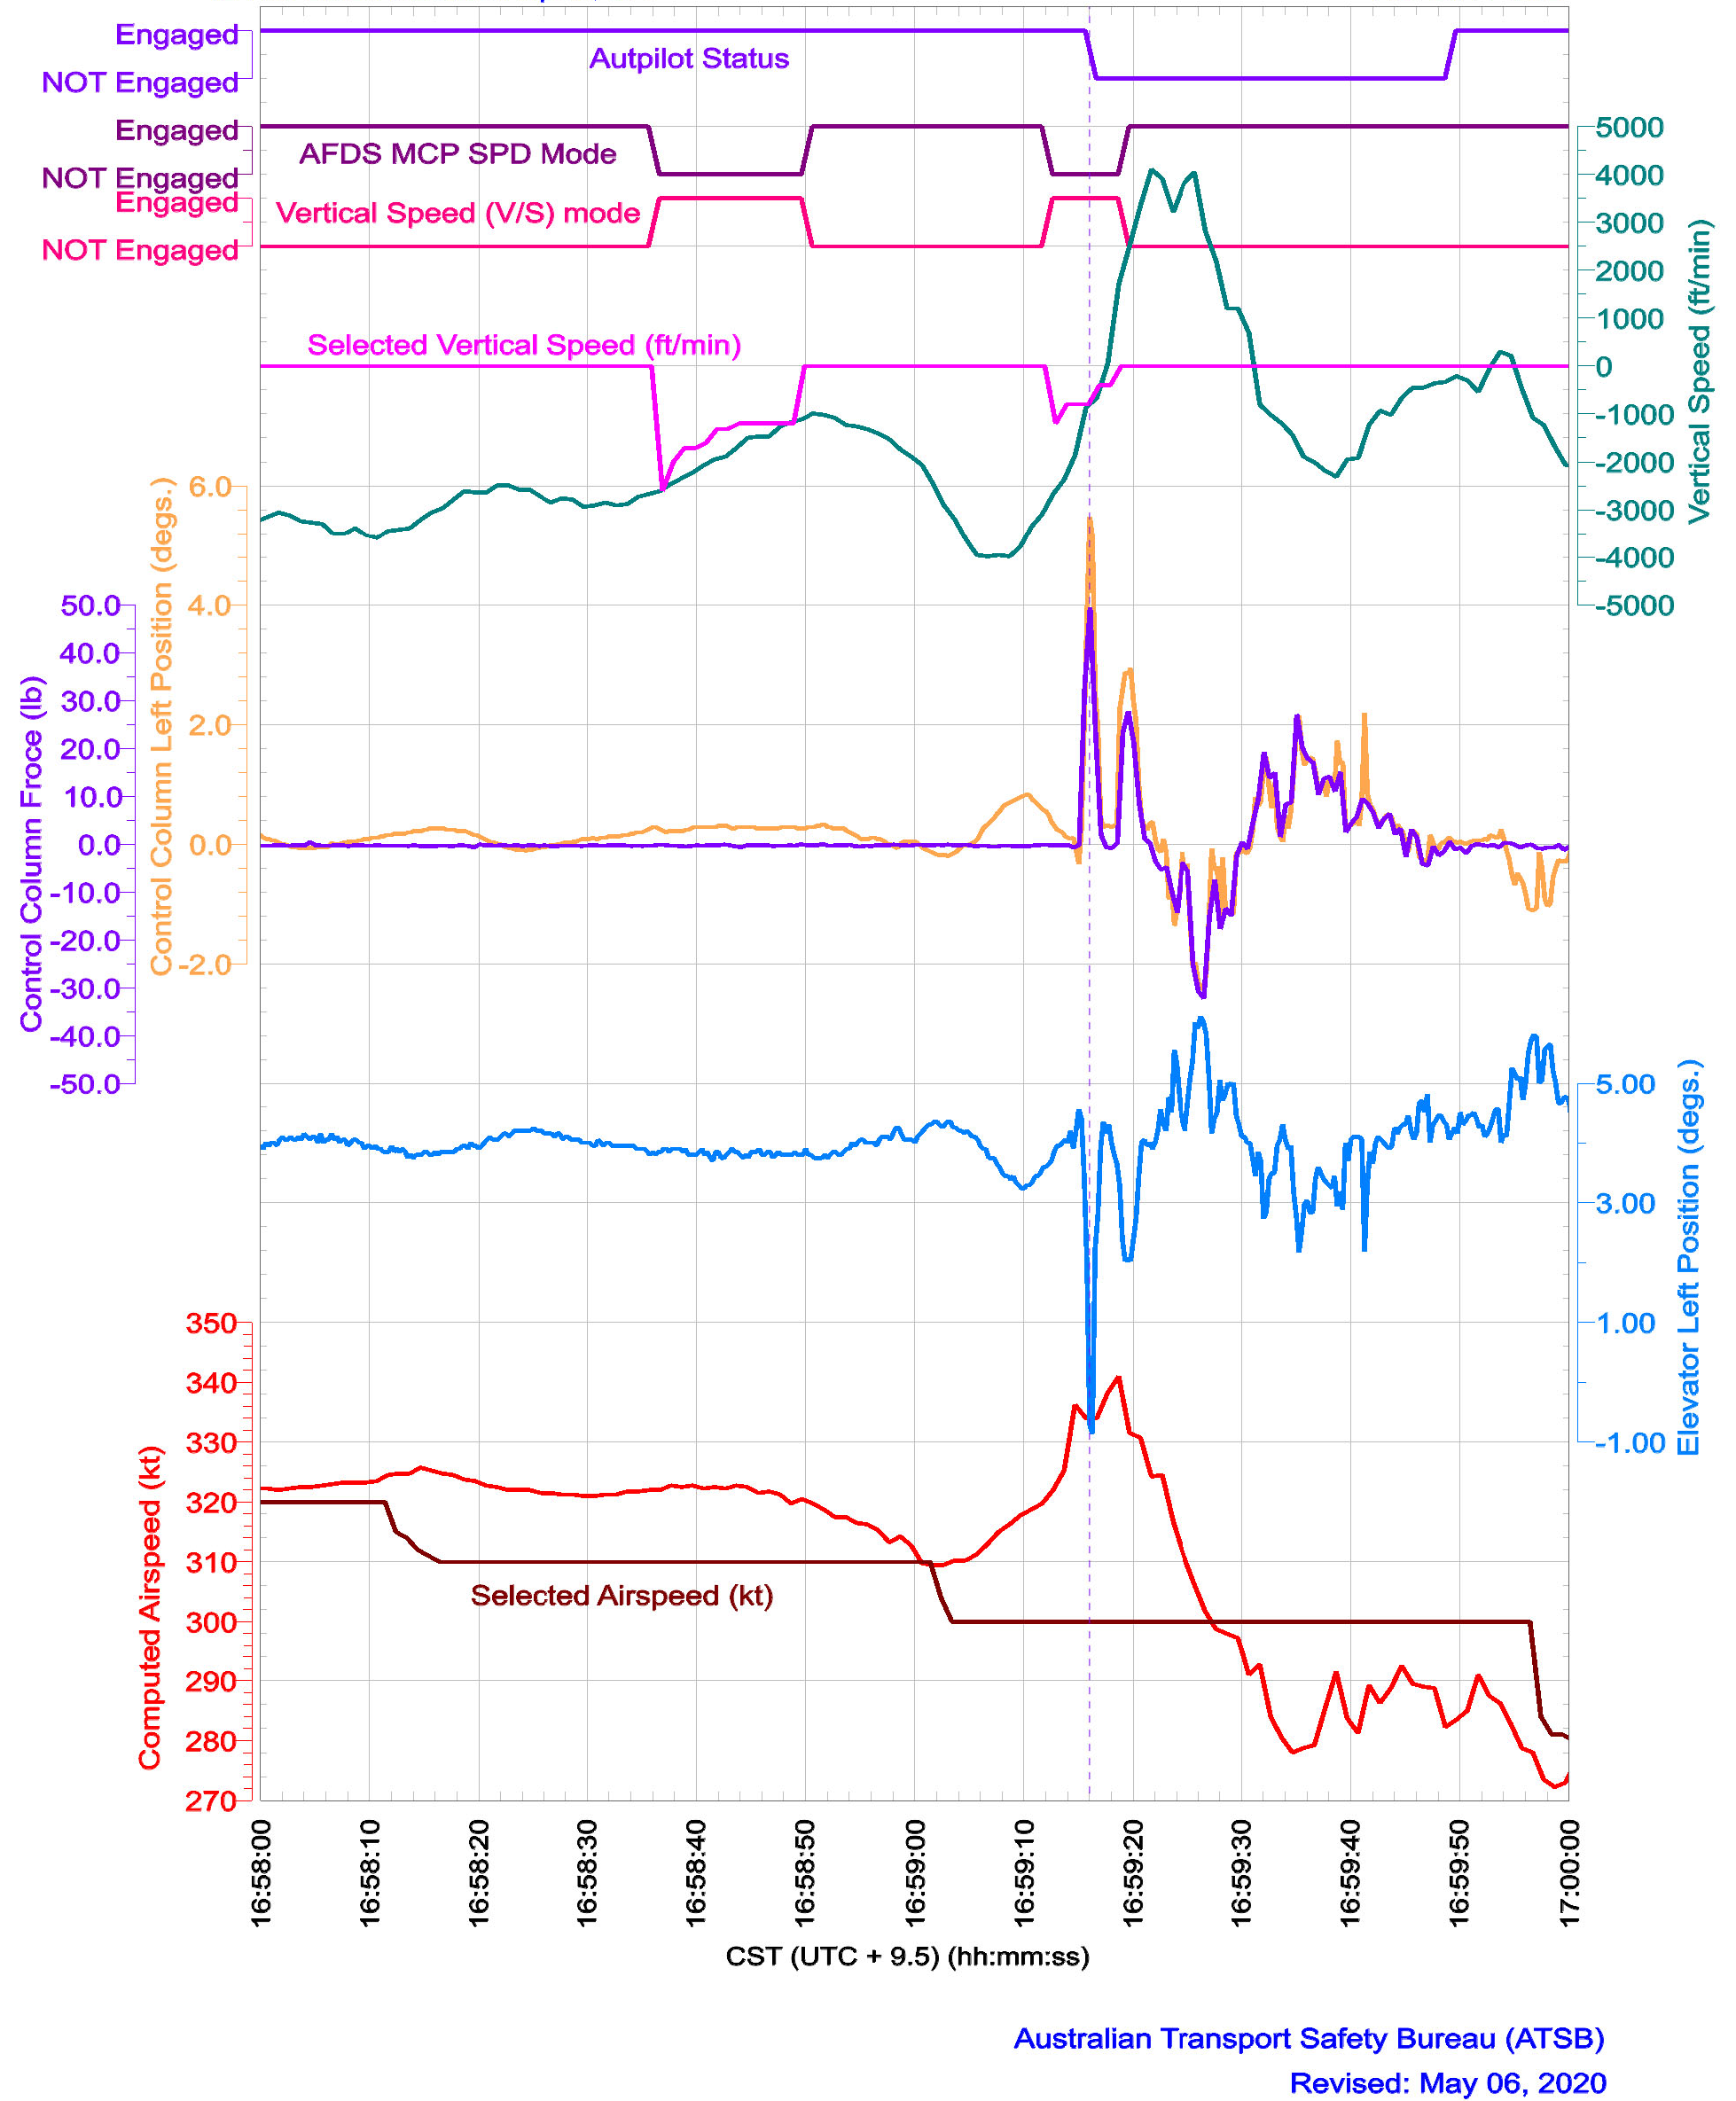
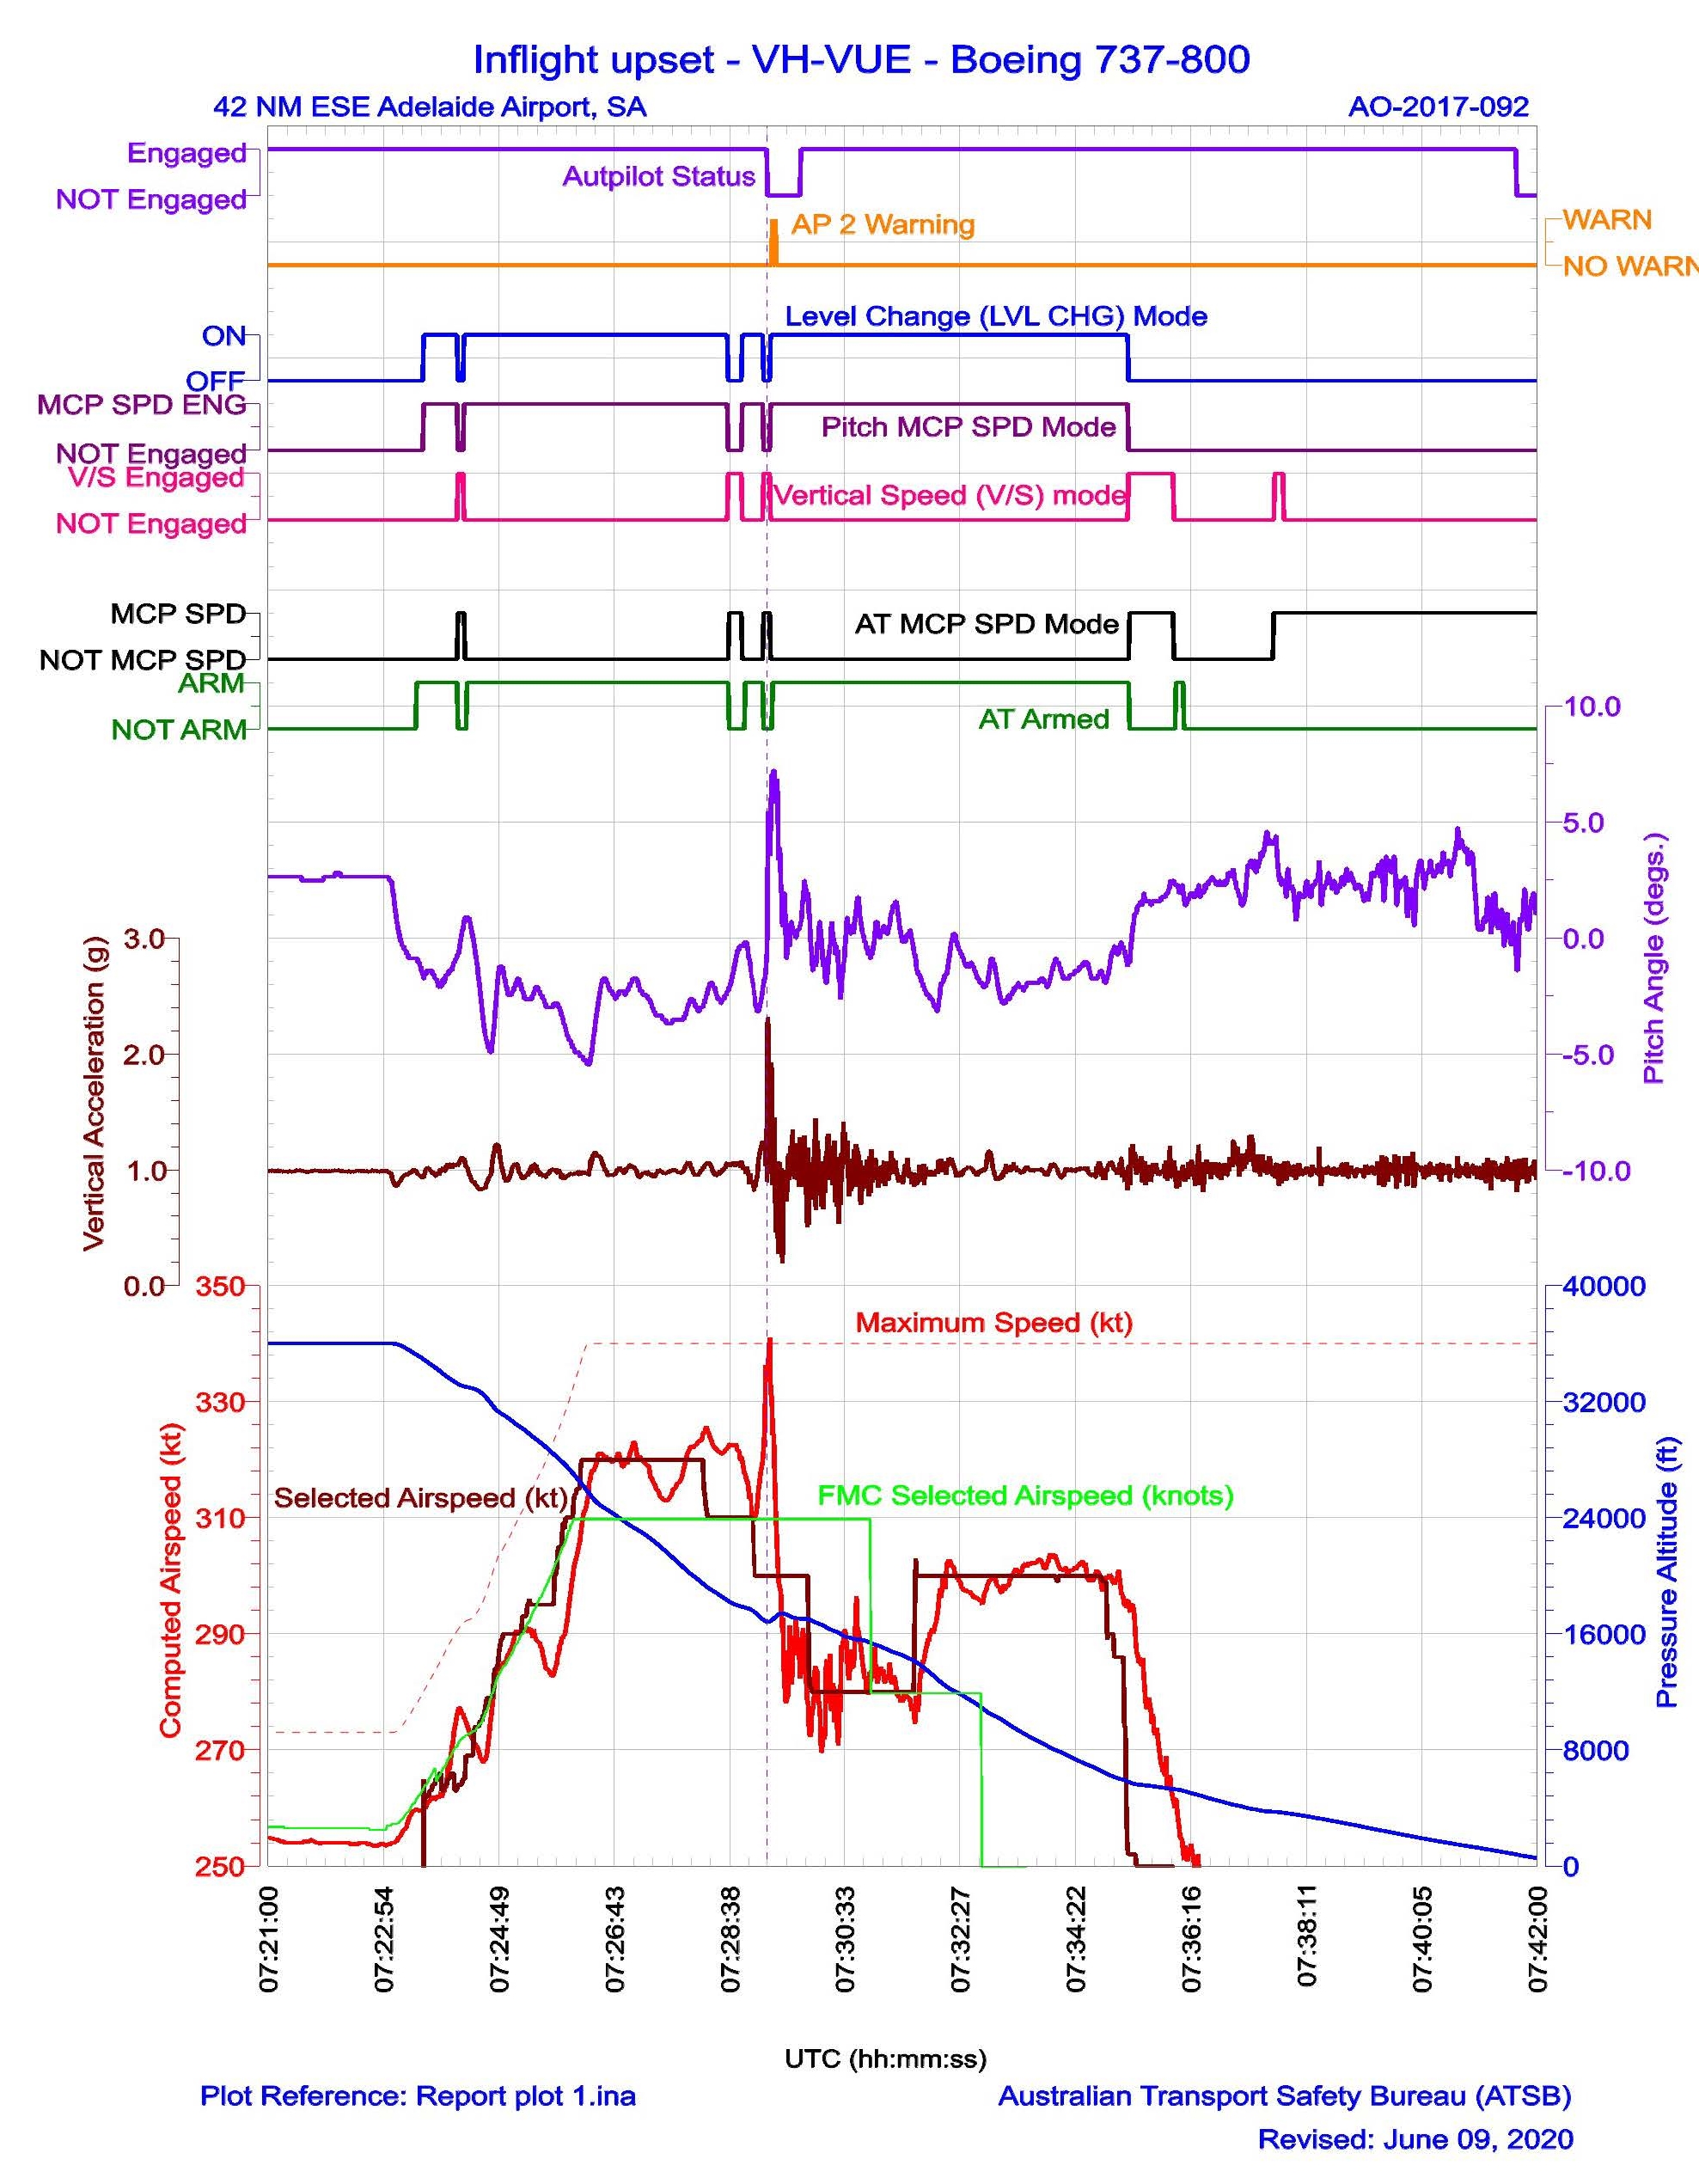
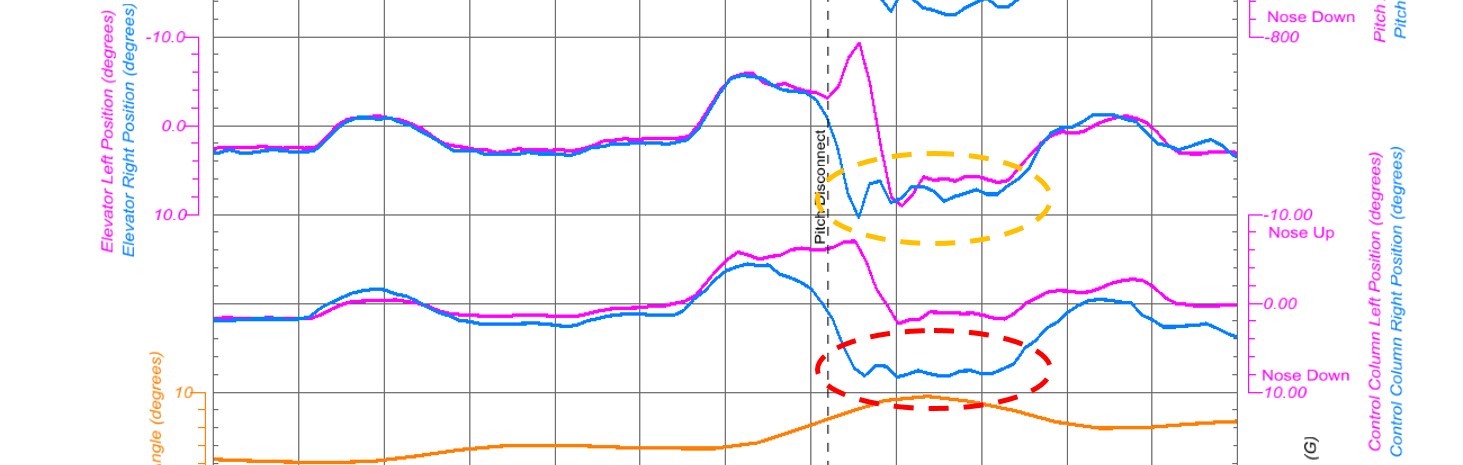
Figure 8 shows the changes to the autopilot modes and airspeed from 1658:00, when VUE was descending through around FL 200. Figure 9 shows changes to the flight controls and the aircraft vertical acceleration during that period.
At 1658:18 the FO reduced the target airspeed to 310 kt. While the AFDS responded accordingly by adjusting the pitch angle, airspeed remained at about 320 kt.
The FO selected the vertical speed mode again at 1658:38, with a vertical speed of -2,600 ft/min. The AFDS responded by adjusting the pitch angle to meet the new selected vertical speed. The FO then gradually wound back the selected vertical speed to -1,200 ft/min. The aircraft achieved the selected vertical speed, but airspeed remained at around 320 kt. At 1658:52, the FO re-engaged the level change mode.
At about the same time, the autopilot commanded a turn towards the COMLY waypoint, as part of the STAR. The tailwind started to increase from around 20 kt to 38 kt, which contributed to the computed airspeed decreasing towards the target airspeed (310 kt). As the computed airspeed approached the selected airspeed, the autopilot decreased the pitch attitude.
At 1659:05, the FO then selected the target airspeed to 300 kt. However, airspeed began to increase, from about 310 kt to 320 kt.
The AFS and both pilots responded to the increase in airspeed. At 1659:10, the AFDS reduced the nose-down pitch angle. At about the same time, the FO engaged the vertical speed mode, quickly winding the selected vertical speed back from -1,200 ft/min to -400ft/min.
At 1659:14, as the aircraft was descending through around 17,000 ft, the tailwind component quickly reduced from 23 to 12 kt and the wind direction changed (as described in Atmospheric data recorded by aircraft above). The airspeed quickly increased towards VMO (340 kt).
At 1659:16 (vertical purple dotted line in Figure 8 and Figure 9), the captain suddenly pulled back on the control column, with a maximum 49 lb backwards control force. This caused the autopilot to disconnect and resulted in a large increase in the aircraft pitch attitude.
The captain suddenly released the controls after the autopilot disconnect, then pulled back on the controls again a few seconds later. The vertical acceleration rapidly increased to 2.3 g, before rapidly decreasing to 0.9 g. This was immediately followed by another rapid increase to 1.95 g, consistent with the second nose-up control input made by the captain.
At 1659:19, the airspeed peaked at 341 kt, before declining quickly to around 280 kt.
Figure 8: Recorded data parameters including autopilot modes, pitch angle and vertical acceleration
Source: ATSB
Figure 9: Recorded data parameters including control column force
Source: ATSB
Windshear and autopilot performance
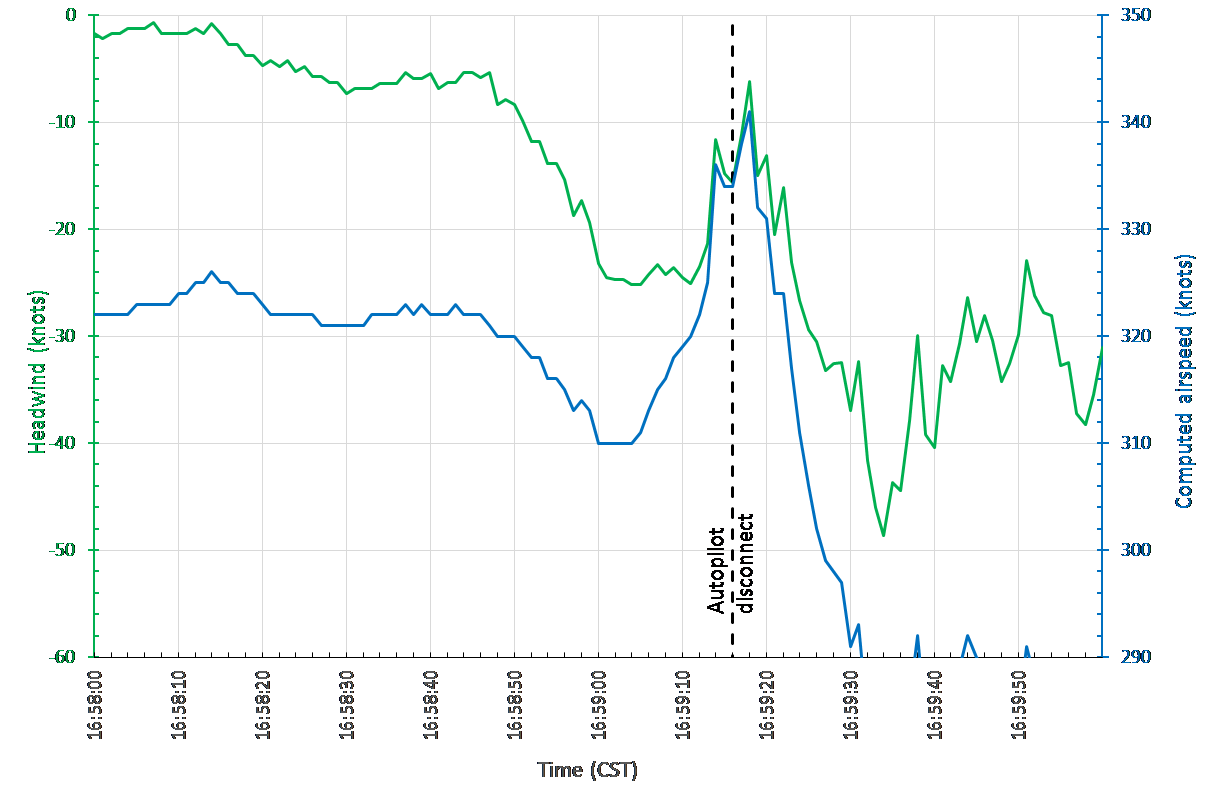
The ATSB considered the influence of wind changes on the changes to VUE’s airspeed during the descent. Figure 10 shows the changes in computed airspeed and headwind immediately before and after the overspeed and autopilot disconnect. This analysis indicates that there was a 10 kt speed increase between 1659:06 and 1659:13 that did not appear to be due to change in the headwind component. However, between 1659:14 and 1659:16 (when the autopilot disconnected), the rapid increase in the computed airspeed was consistent with a 12-14 knot change in the headwind component. The second rise in computed airspeed about 2 seconds later was also consistent with another change in the headwind component. This is consistent with a windshear encounter during the descent into Adelaide.
Figure 10: Comparison of the calculated headwind changes (green) and the computed airspeed (blue) in the two minute period around the autopilot disconnect.
Note on graph vertical axes: the left (wind component) and right (airspeed) are on the same relative scale (that is, a 10 knot change in the wind is the same as a 10 knot change in the airspeed). The computed airspeed scale is shifted to provide comparison.
Source: ATSB
When the FO engaged the vertical speed mode to respond to the speed increase, this automatically changed the autothrottle mode from ARM to MCP SPD. Because the thrust was already at idle, there was no capability for the autothrottle system to reduce the airspeed by reducing the thrust. Thus, when the AFS mode was changed, the AFS did not have an effective control over the airspeed, aside from mode reversion to level change mode.
The FCOM states that mode reversion occurs slightly before the aircraft reaches VMO, but does not define the exact point of reversion. In this case, because the pull-through of the control column disengaged the autopilot, this prevented the mode reversion system from engaging. It is unknown to what extent the aircraft would have exceeded VMO had AFDS continued to manage airspeed and the captain not intervened in this way.
The vertical speed selected by the FO was less than the current vertical speed, which would normally be expected to reduce the airspeed. However, the change in the headwind component was probably too rapid for this to be effective. In this instance, it may have been more effective to have left the AFS in level change mode, where the AFDS could provide management of the airspeed.
Handover and takeover procedures
Duties within the cockpit are normally allocated such that only one pilot, the pilot flying (PF), is responsible for manipulating the flight controls and providing input to the AFS. This delineation of responsibilities is important, for maintaining certainty of who is controlling an aircraft.
VA manuals described the procedures for handover and takeover of flying duties. The procedures stated that handover must always be done in a ‘positive manner’ using standard phraseology.[9]
The captain noted that the intervention procedures normally included notifying the PF, and waiting for the PF to relinquish control. The captain identified not saying anything prior to pulling back on the control column, and described this as a reflex action. The captain implied that the decision to take control was rapid, and that a quick action was required given what they perceived to be the state of the aircraft.
The FO reported noticing that the captain had control when the autopilot disconnect audible alert was heard and the captain was observed making control inputs. The FO reported relinquishing control and immediately assumed the role of pilot monitoring (PM). The CVR recorded the autopilot disconnect tone, followed shortly by the FO saying ‘you got it’ then ‘you have control’. Shortly after, the captain said to the FO ‘you go, no you’re right’, and the FO responded ‘I have control’.
Safety systems for overspeeds
Safety implications of VMO overspeed
The United States’ Federal Aviation Regulations (FAR) 25.1505 - Maximum operating limit speed defined VMO as ‘a speed that may not be deliberately exceeded in any regime of flight (climb, cruise, or descent’. These regulations state that VMO/MMO must be sufficiently below the design dive speed of the aircraft, to make it highly improbable that the latter speeds will be inadvertently exceeded in operations.[10] Other regulations provide further guidance on the calculation of the margins between VMO/MMO and these other limit speeds.
The FCTM described the concept of VMO and the causes of VMO overspeed:
VMO/MMO is the airplane maximum certified operating speed and should not be exceeded intentionally. However, crews can occasionally experience an inadvertent overspeed. Airplanes have been flight tested beyond VMO/MMO to ensure smooth pilot inputs will return the airplane safely to the normal flight envelope…Although autothrottle logic provides for more aggressive control of speed as the airplane approaches VMO or MMO, there are some conditions that are beyond the capability of the autothrottle system to prevent short term overspeeds
In a section related to procedures for rapid descent, the FCTM stated:
When descending at speeds near VMO / MMO with the autopilot engaged, short-term airspeed increases above VMO / MMO may occur. These are most often due to wind and temperature changes. These short-term increases are acceptable for this manoeuvre and the autopilot should adjust the pitch to correct the airspeed to below VMO / MMO.
The FCTM said that any time VMO is exceeded, the maximum airspeed should be noted in the flight log. A VA Flight Crew Information Bulletin (FCIB) issued on 4 October 2016 similarly noted that pilots should make maintenance log entries and safety reports for any overspeeds.
The 737 maintenance manual required a structural examination of the aircraft if a VMO exceedance was greater than 20 kt (that is, where airspeed exceeded 359 kt). There were no maintenance actions required for VMO overspeeds less than 20 kt.
VA management of overspeed and flight crew understanding of overspeed implications
VA utilise a flight data analysis program (FDAP) to systematically analyse the flight data generated in each flight, in order to make comparisons between actual operations and company procedures, and to identify non-normal occurrences. VA’s internal investigation into the accident involving VUE noted that during the period 2014 to 2016 there was a tendency for pilots who exceeded VMO to be made subject to operational clearance (SOC). The VA investigation report identified that these overspeed events were often unavoidable. Pilots declared SOC must cease flying duties until given formal notification that the SOC restriction was been removed. Pilots declared SOC typically underwent remedial training and re-assessment prior to resuming flying duties.
The VA internal investigation noted that in early 2017 (before the accident), VA management of minor exceedances shifted, which VA described as a shift in risk tolerance. After this change, the usual response involved reviewing recorded data from the flight, and no further action would typically be pursued if that review identified the crew action had been in line with procedures. After the accident involving VUE, VA provided education to pilots about the FDAP and the management of safety events during 2018 and 2019 (see Safety issues and actions).
The FO stated that it was ‘not a nice feeling’ when an aircraft exceeded VMO. However, the FO also reported intending to let the aircraft overspeed prior to the captain’s intervention. The FO believed that if they had exceeded VMO, the aircraft would be recovered to normal flight, and would require an engineering inspection and safety report.
During company interviews following the accident, the captain reported being mindful that a VMO exceedance would flag in the FDAP. During interview with the ATSB, the captain reported perceiving it was very important to prevent the aircraft from exceeding VMO, and that there was a recent significant focus within VA relating to avoiding overspeeds, which included extensive simulator and classroom training over a period of around 12 months, focussing on the correct use of the overspeed procedures described in the FCTM. The captain described being wary of avoiding overspeed if possible, because it was not good for the aircraft, and because the company did not want any overspeeds.
The captain also stated that VA pilots were generally wary about overspeeds. Although both pilots perceived that 320 kt was the standard or usual target speed for high-speed descent, the captain related that some company pilots would only target 300 kt during descent to avoid exceeding VMO. The captain reported hearing informal rumours prior to the accident that having an overspeed would result in ‘the company wanting to have words with you’. The captain said that their preference for avoiding overspeed was probably influenced by the company’s preference to have less overspeed events.
Information the captain provided at interview indicated a limited awareness of the relationship between VMO and the other aircraft limit speeds. The captain indicated not being aware that overspeeds less than 359 kt did not require maintenance inspection, and did not cause any other delay or significant consequence. When the captain saw the airspeed increasing towards VMO, the captain thought this meant the autopilot was not controlling the aircraft.
Speed management and overspeed recovery
There were no specific procedures for the management of high-speed descents. As such, there were no procedures that described the target speeds pilots should adopt during high-speed descents, or how pilots should use autopilot modes or speed brakes to manage speed in these situations.
Other VA and Boeing procedures described the methods pilots should use to manage speed around VMO, including recovering from overspeed. The 737 FCTM provided procedures for avoiding and recovering from overspeed, including in the descent stage of flight. In the section titled ‘Overspeed’ the FCTM stated that:
If autothrottle corrections are not satisfactory, deploy partial speed brakes slowly until a noticeable reduction in airspeed is achieved…
When encountering an inadvertent overspeed condition, crews should leave the autopilot engaged unless it is apparent that the autopilot is not correcting the overspeed. However, if manual inputs are required, disengage the autopilot. Be aware that disengaging the autopilot to avoid or reduce the severity of an inadvertent overspeed may result in an abrupt pitch change.
During climb or descent, if VNAV or LVL CHG pitch control is not correcting the overspeed satisfactorily, switching to the V/S mode temporarily may be helpful in controlling speed. In the V/S mode, the selected vertical speed can be adjusted slightly to increase the pitch attitude to help correct the overspeed. As soon as the speed is below VMO/MMO, VNAV or LVL CHG may be re-selected.
VA sent company pilots a Flight Safety Notice in 2014, titled Exceedance of VMO/MMO and Assigned Altitude. Although this notice primarily related to overspeed associated with entry to Jetstreams on climb on in cruise, it highlighted that
VMO/MMO is the maximum operating speed and should not be exceeded intentionally, however small excursions of a short-term or transient in nature are within the design envelope of a jet transport aircraft. That is, there is minimal operational impact. Notwithstanding this, anytime VMO/MMO is exceeded the maximum speed and time above
VMO/MMO should be noted. VMO/MMO exceedance poses less risk generally than an excursion beyond a cleared altitude or Flight Level. A VMO/MMO exceedance is preferable to an altitude bust, or large abrupt control inputs.
Any VMO/MMO exceedance must be entered in the Maintenance log and a safety report must be submitted.
The Flight Safety Notice also highlighted relevant sections of the FCOM and FCTM.
In 2016, VA sent company pilots two FCIBs titled ‘Managing VMO Exceedances and Wind Gradients near Jet Streams’ and ‘Assigned Altitude Overshoot and Overspeed Exceedances’. These bulletins provided further information about the risk of overspeed and how they should be avoided and managed, including:
A number of VA crew had pulled back on the control column in an attempt to avoid overspeed. This had led to autopilot disconnection, large abrupt control inputs and significant g forces.
The focus ‘needs to be on a preventative strategy and recovery technique’.
High-speed descents need to be managed carefully, and this may include early descent at reduced speed to avoid potential overspeed.
Level change or vertical navigation speed are the recommended modes for high-speed descents in conditions with steep wind gradients or turbulence.
‘It is preferable to accept a temporary overspeed (provided it is not excessive or sustained) rather than…large abrupt control inputs at high altitude’.
The recovery technique for overspeeds is to ‘leave the autopilot engaged unless it is apparent that the autopilot is not correcting the overspeed. Be aware that disengaging the autopilot to avoid or reduce the severity of inadvertent overspeed may result in an abrupt pitch change and high ‘g’.’
On descent, crews should command reduced airspeed and use temporary vertical speed mode selections to recover from overspeed.
Both the captain and the FO had passed simulator training sessions focusing on overspeeds, with the most recent session for each pilot occurring in 2014. The simulator scenario involved an overspeed during the cruise stage of flight, and pilots were evaluated based on their application of the procedures described in the FCTM.
The pilots recalled VA training and procedures for managing and recovering from overspeed. The captain recalled that VA training on overspeed recovery included using the vertical speed autopilot mode, and the speed brake. The captain also recalled that one VA training document stated that a small overspeed was better than an abrupt recovery. However, the captain noted that there was ambiguity in what was a small overspeed that could be allowed, as opposed to a larger overspeed, which was problematic. That is, the captain identified that the procedures did not define what a ‘small’ overspeed was.
The FO recalled pilots were taught to use the level change and vertical speed AFS modes and speed brake to recover from overspeed, and that if the aircraft was going to overspeed, to let it overspeed. The FO reported believing they would have applied the speed brake to recover from the overspeed situation, had the captain not intervened.
Control sensitivity at high-speeds
As a general principal, aircraft control systems are more sensitive in high energy states such as high-speed, high-altitude flight. This means that control inputs have larger effect when the aircraft is at higher speed. The FCTM noted the potential for over-control due to increased control sensitivity at high-speed, stating:
There have been reports of passenger injuries due to over-controlling the airplane during high altitude, high airspeed flight when overriding the control column with the autopilot engaged or after disengaging the autopilot with the disconnect switch.
Pilots should understand that, in general, the airplane is significantly more sensitive in pitch response (load factor) to column movement at cruise than it is at lower speeds associated with take-off and landing.
The captain reported not expecting to pull back very forcefully when taking manual control of the aircraft. However, reflecting on the development of the accident, the captain considered that their control inputs may have exacerbated what they perceived as the turbulence experienced by the aircraft.
Summary of overspeed safety systems
The ATSB considered the safety systems used by VA to reduce the risk of overspeed and unsafe interventions during overspeed events. Although no procedures specifically related to managing airspeed during high-speed descents, other procedures described the methods for managing airspeed around VMO. Both pilots understood the procedures for managing airspeed on descent, and the FO reported planning to apply the speed brake prior to the captain’s intervention.
Within the safety system, there were controls that sought to reduce the likelihood of pilots unnecessarily taking manual control to prevent overspeed. The documentation suite instructed pilots that the autopilot should be left engaged. During post-accident interviews with the ATSB, both pilots exhibited a good understanding of those procedures.
The defences associated with preventing unsafe pilot interventions during overspeed were thus mainly procedural controls. This is understandable, as pilots should have the ability to take manual control of the aircraft if they perceive the need to do so. The defences within the safety system were associated with supporting effective decisions about intervening.
Pilots’ understanding of aircraft capabilities and limitations is informed by documentation and training. In this case, the documentation provided by VA and Boeing did provide a reasonable indication that minor overspeeds were not problematic. The FCTM advised that pilots sometimes inadvertently encounter overspeed during operations near VMO, and this message was reinforced in the FCIB. The FCTM also contained emergency rapid descent procedures in which VMO was intentionally targeted, and therefore it would be a reasonable inference that minor exceedance of VMO would not risk the safety of the aircraft.
However, the documentation provided by VA and Boeing did not clearly express the tolerances of the 737 to minor overspeeds. VA documentation said that flight crews should document their airspeed any time airspeed exceeded VMO, even though a maintenance inspection was required only for exceedances above 359 kt. In this regard, the documentation provided to pilots could be interpreted as any exceedance of the VMO limit of 340 kt had safety implications.
Although the captain had concerns about an overspeed, this was probably not due to any systemic deficiencies in the documentation, or the training provided to flight crews. It is likely that all pilots, to some extent, have an aversion to exceeding defined limitations. The captain’s concerns about exceeding VMO were probably a reflection of this. Additional context about tolerances beyond VMO in documentation and training may reduce pilots’ concerns about minor overspeeds.
ATC speed control procedures
Air traffic control (ATC) instructions to arriving aircraft can include speed control. Speed control instructions may be based on considerations such as aircraft operational requirements and requirements for managing inbound aircraft traffic. The Airservices Australia Manual of Air Traffic Services (MATS) stated that when applying speed control, ATC should (among other responsibilities):
advise the pilot of future intentions; advise the pilot to resume normal speed as soon as the application of speed control is no longer necessary; and make speed adjustments judiciously in advance of the point at which the new speed is required, depending on the aircraft type and amount of adjustment involved.
MATS identified a speed guidance for Virgin 737 aircraft of 280 kt at 30 NM from an aerodrome. This documentation also identified that the maximum descent speed for these aircraft was 340 kt.
In November 2017 (after the accident), Airservices Australia published a revised MATS, which specifically advised controllers to ‘avoid cancelling published speed restrictions for arriving aircraft, except when necessary for traffic management or aircraft operational requirements’. Changes also included that controllers should not use the phrases ‘NO ATC SPEED RESTRICTIONS’ or ‘NO SPEED RESTRICTIONS’ when issuing speed control instructions to aircraft on a standard instrument arrival route. MATS was later revised to show a maximum descent speed of 320 kt for Virgin 737s.
VA advised that they had asked Airservices to review and change the MATS speed table to align the maximum descent speeds for the B737 for all operators. VA also advised the ATSB that they had asked Airservices to review the terminology ATC were using for issuing speeds on descent, to ensure that standard phraseology was being used.
Airservices advised the ATSB that there had been no internal reviews or investigations associated with this accident.
Acceptance of high-speed descent clearance
As a general principle, the captain of an aircraft has responsibility for ensuring the operational control of an aircraft, which includes accepting air traffic control requests for high-speed descent. The captain reported having no hesitation to deny an ATC request to conduct a high-speed descent, if the captain felt that was necessary.
The captain also reported not being able to recall if ATC instructed the aircraft to ‘make maximum speed’, or if the clearance was to target 320 kt. The FO recalled that ATC had issued the crew with a clearance for a high-speed descent but did not recall any details of the wording of that clearance. The implication, therefore, is that the pilots perceived the instruction issued by ATC as a clearance to conduct a high-speed descent; both pilots recalled that 320 kt was selected as a target speed in response to this clearance.
The ATSB did not find that the wording of the high-speed descent instruction by ATC had any influence on the target speed set by the pilots, or how the pilots managed their speed during the descent.
Other flight crew procedures
The descent procedures applicable to the crew of VUE were described in the 737 Flight Crew Operations Manual (FCOM). These procedures specified the requirement for crews to conduct an ‘approach briefing’ prior to the top of descent. The VA Operating Policies and ProceduresManual stated that flight crews should conduct a review of threats as part of the arrival briefing, which is equivalent to the approach briefing.
The procedures for the threat and error management review stated that the purpose was to review potential threats and determine the best management strategy. The procedure identified possible threats, including significant weather, and noted that the identified list of threats was not exhaustive. The procedures did not identify overspeed as a possible threat.
During the descent into Adelaide, the flight crew briefly conducted a review of threats. The FO noted the potential threats of turbulence and exceedances. The crew did not observe any indications suggesting turbulence. However, when the FO mentioned the threat of exceedances, the captain made a strong informal interjection saying ‘Don’t exceed anything…’ The crew did not discuss these threats any further, nor did they discuss a management strategy.
Cabin crew briefings
VA procedures required the flight crew to brief the cabin crew at different stages of the flight, including pre-flight and at the top of descent. The procedures stated that the pre-flight briefing should include information about the en route weather, any special considerations, and any deviation from normal conditions. Similarly, the top of descent briefing was required to include information about the possibility of turbulence, adverse weather, likelihood of the seatbelt sign being activated early, and ‘other anticipated special considerations for descent, approach and arrival’.
The captain briefed the CS pre-flight, and before top of descent into Adelaide. Neither briefing mentioned the forecast clear air turbulence, nor was the possibility of turbulence otherwise indicated. The top of descent briefing did not mention the planned high-speed descent.
The cabin supervisor (CS) reported that their prior experience was that captains usually advised the cabin crew about planned high-speed descents. The CS perceived this was best practice as it allowed the cabin crew to have awareness of the changed descent conditions.
The ATSB also spoke to a senior pilot from VA about cabin crew briefings for high-speed descents. That pilot reported that it was not typical for captains to brief cabin crew about a planned high-speed descent, and explained that in many cases, ATC issue clearance for high-speed descent after the top of descent. The procedures did not include a requirement to include planned high-speed descent in cabin crew briefings.
The ATSB does not draw an inference from the absence of information about the high-speed descent from the top of descent briefing. However, as expanded on in Unsecured cabin crew, cabin crew are reliant on the pilots for information about the descent conditions, and in this instance the cabin crew had no opportunity to modify their procedures during the descent.
Cabin crew procedures
Normal cabin preparation for landing
VA cabin crew procedures stated that the flight crew would make the ‘cabin crew prepare for landing’ announcement 10 minutes before the crew were required to be seated for landing, and that this would be at about 20,000 ft or higher for 737 aircraft. Cabin crew were then required to:
cease all service involving carts
secure their area of responsibility, including cabin and galley areas.
Toilets could still be used at this time.
The procedures required the PM to activate the fasten seat belt sign at transition level[11] or 10,000 ft, whichever occurred first. After the PM had switched on the fasten seat belt sign, the procedures were for the cabin crew leader to then make the ‘seat belt sign for landing’ announcement. Cabin crew were then required to:
check their area of responsibility and ensure passenger seat belts are fastened, toilets are locked, and personal electronic devices are away.
return to their seat within one minute and be secured for landing including using a shoulder harness.
Prior to the sudden changes in pitch attitude, the ‘cabin crew prepare for landing’ announcement had been made, and the cabin crew had performed the duties required following that. The flight crew had not turned on the fasten seat belt sign, and there was no requirement for the cabin crew to be seated. The sudden pitch changes occurred about 7 minutes after the flight crew made the ‘cabin crew prepare for landing’ announcement.
The ATSB also sought to identify when the seatbelt sign was activated after the overspeed and sudden pitch changes. At interview, the captain reported believing the seatbelt sign was activated immediately after the sudden pitch changes. However, both the CS and the injured cabin crew member said that they observed the seatbelt sign remain off throughout the descent. The FO reported not being able to recall whether the seatbelt light was turned on immediately after the sudden pitch changes or later in the descent.
The illumination of seatbelt sign was not a parameter recorded on either the FDR or the QAR. However, when the seatbelt sign is turned on or off, a distinct audible tone is produced. The prescribed standards for Airborne Passenger Address Amplifiers are for the activation of the seatbelt sign to be associated with a single 494 Hz low tone (equivalent to musical note B). Other signals are associated with a high tone (587 Hz), and combinations of high and low tones.
The ATSB review of the CVR identified a single low tone, consistent with the activation of the seatbelt sign, at 1659:30. This was after the sudden pitch changes, and consistent with the pilots expressing the intent to turn the seatbelt sign on.
Cabin preparation in turbulent conditions
The VA Aircrew Emergency Procedures Manual described procedures for situations when pilots expected turbulence based on information from sources such as the Bureau of Meteorology, weather radar, ATC and reports from other aircraft. If the flight crew judged that turbulence was likely, they were required to inform the cabin crew during the briefings or another suitable time. The pilots were required to activate the fasten seat belt signs no later than one minute prior to the anticipated turbulence.
When turbulence was expected, the procedures instructed cabin crew to prioritise personal safety, and to not risk personal injury by continuing service. During actual turbulence, the procedures said cabin crew should secure themselves by sitting down or holding on to seat backs, evacuation handles or grab handles, where possible.
Because the descent conditions were smooth, and the captain did not perceive there was a risk of turbulence, the pilots did not turn on the fasten seat belt signs.
Stowage of oxygen bottles
The VA Aircrew Emergency Procedures Manual stated that on-board oxygen bottles could be used for a first aid situation. During landing, the procedures said that the oxygen bottles should be secured under a seat. These procedures also specified ‘precautions’ about the use of oxygen bottles, including ‘do not drop or bump oxygen bottle’.
The cabin crew related that their training had emphasised the importance of properly stowing portable oxygen bottles during approach and landing. However, they were unable to comply with the procedures on this occasion, because the injured cabin crew member was not able to move into a seated position. The injured cabin crew member reported maintaining a firm grip on the oxygen bottle during the approach and landing.
The ATSB sought information from the aircraft manufacturer in relation to securing oxygen bottles during landing. The manufacturer subsequently provided the following guidance:
If the condition does not allow proper stowage, the oxygen bottles have shoulder straps that can provide some level of containment.
For a condition where a cabin crew member could not be seated for landing, the crew member should position themselves against structure forward of their position for support in any deceleration condition associated with landing.
The operator can evaluate their own configuration and determine the best course of action for the situation encountered in the occurrence.
Cabin crew incapacitation
The VA Cabin Crew Policy and Procedures Manual described procedures for managing cabin crew member incapacitation. Cabin crew were required to administer first aid, advise the CS and flight crew as soon as possible and place the crew member in a non-exit row passenger seat. The procedure was to then liaise with the captain on positional changes and alternate procedures for landing and reassign cabin duties based on the captain’s instructions. The procedures also included instructions for a single cabin crew member to operate two exit doors in these situations. The CS recalled VA cabin crew emergency procedures training was based on a single incapacitation. The CS said that scenario-based training for multiple incapacitation would have assisted the CS’ response to the accident.
Following the overspeed and cabin injuries, the CS advised the flight crew that the injured crew member was unable to move into an aircraft seat, and that the remaining crew would be repositioned to monitor the rear doors and the injured cabin crew member. The flight crew considered this information during the approach and landing, with the captain saying to the FO ‘Try to make it as smooth as possible. Try not to hit on the brakes too hard. I think (the injured cabin crew member) may still be on the floor’.
Management of injured persons at Adelaide Airport
Adelaide Airport Aerodrome Emergency Plan
The Adelaide Airport Aerodrome Emergency Plan (AEP) provided guidelines to co-ordinate response to and recovery from emergencies at the airport. The medical emergency procedures included that the SA Ambulance Service (SAAS) was the control agency. This means that SAAS were responsible for the overall direction of the activities associated with the response, including tasking and co-ordinating other agencies.
For medical emergencies, the AEP included procedures for notifying airport management, SAAS and Aviation Rescue Firefighting (ARFF). The AEP stated that ‘the plan is based on the assumption that each agency with a statutory responsibility has in place appropriate supporting procedures which deals with that agency’s response in accordance with this plan’.
Adelaide Airport also had procedures and plans related to co-ordinating ambulance access airside. In these procedures, airlines and the SAAS were to notify Adelaide Airport. An airport operations officer could then arrange for an escort from the airport emergency gate to the airside location.
Adelaide Airport advised that there were no entries made in their operations logs in relation to the accident, with the implication being that Adelaide Airport emergency operations personnel had not been alerted to the situation. Adelaide Airport personnel were not requested to arrange for airside ambulance access to VUE.
Relevant VA procedures and context
The VA Guest Services Procedures Manual contained procedures for medical emergencies ‘In Flight or Aircraft Not Parked at Terminal’. These included procedures for the flight crew to contact the medical information provider Medlink, so that Medlink could support the assessment and treatment of the affected persons. During this occurrence, the flight crew determined that it was appropriate to prioritise the descent and landing, so Medlink was not contacted at any stage.
The manual also included procedures for co-ordinating disembarkation, which were that:
The AMCO (Airport movement coordinator)/Airport Manager/attending medical personnel, in consultation with the pilot-in-command, will decide the method of disembarkation and which door the guests are to disembark from that will allow the medical team to, where required, gain immediate access to the person requiring medical assistance.
For this occurrence, the flight crew were not involved in consultation with the medical personnel about the extraction of the injured cabin crew. The captain perceived that with emergency services personnel, cabin crew and the ground operations supervisor in the rear cabin, there was not enough room for him, and also that the attending personnel were managing the situation.
VA advised the ATSB that in the event of a medical emergency response, once the ARFF personnel arrived on scene, VA personnel were no longer involved in the decision making around extraction of injured persons.
The ARFF officers asked the VA ground operations supervisor about access to a scissor lift or a catering truck. The ground operation supervisor identified that there was no scissor lift available and told the ARFF approval was not given for the use of the catering truck. In interview, the ground operations supervisor related that their concerns about using the catering truck included:
The catering truck was not VA equipment and was operated by a contractor.
The use of the catering truck was not part of VA ground handling procedures.
The ground operations supervisor had never heard of the catering truck being used for the purpose of removing an injured person from an aircraft.
The ground operations supervisor perceived that there was a significant fall from height risk. The normal operation of the catering truck involved the use of harnesses. The ground handling supervisor also said that from its ‘lowered’ position, there is around 1.5 m from the catering truck platform to the ground.
The ground operations supervisor perceived that working from heights risks were a main safety focus for VA ground operations. The ground operations supervisor had concerns about what would happen if the injured cabin crew member fell during a lift onto a catering truck, from the perspective of the injured cabin crew being seriously injured and also in terms of repercussions for the ground operations supervisor. The ground operations supervisor recalled a previous incident where someone was injured falling from an aircraft, which added to the concern about the fall from heights risk.
The ground operations supervisor also related that, at around the time the request to use the catering truck was made, the ambulance officers were on-board the aircraft. The ground operations supervisor perceived that the ambulance officers had control of the situation and the injured cabin crew member was in a stable condition. Also perceiving that the emergency services personnel were working towards a plan for the extraction from the aircraft, the ground operations supervisor did not consider it was necessary to explore further the option of arranging the catering truck.
Airport Rescue and Fire Fighting procedures
During an emergency response, ARFF provided first aid to injured persons until ambulance personnel arrive. Once the ambulance personnel are on-site, ARFF procedures were to hand over treatment and management of any casualties.
The ARFF personnel reported they had previously used scissor lift and catering truck appliances in similar situations, and perceived that this would be appropriate for removing the injured cabin crew member. However, this option was not given further consideration after the VA ground services manager denied the request.
ARFF reported that their officers did not assist with the removal of the injured cabin crew member. The ARFF officers handed over treatment and management of the injured cabin crew member to the SAAS and followed the direction of SAAS thereafter.
Previous occurrences
The ATSB reviewed recent accidents involving cabin crew injuries resulting from manual flight control inputs to prevent overspeed during descent. The following four examples were identified which show themes in the development and consequences in these accidents. This is not an exhaustive set of all similar accidents in the time period.
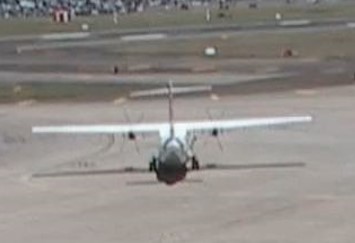
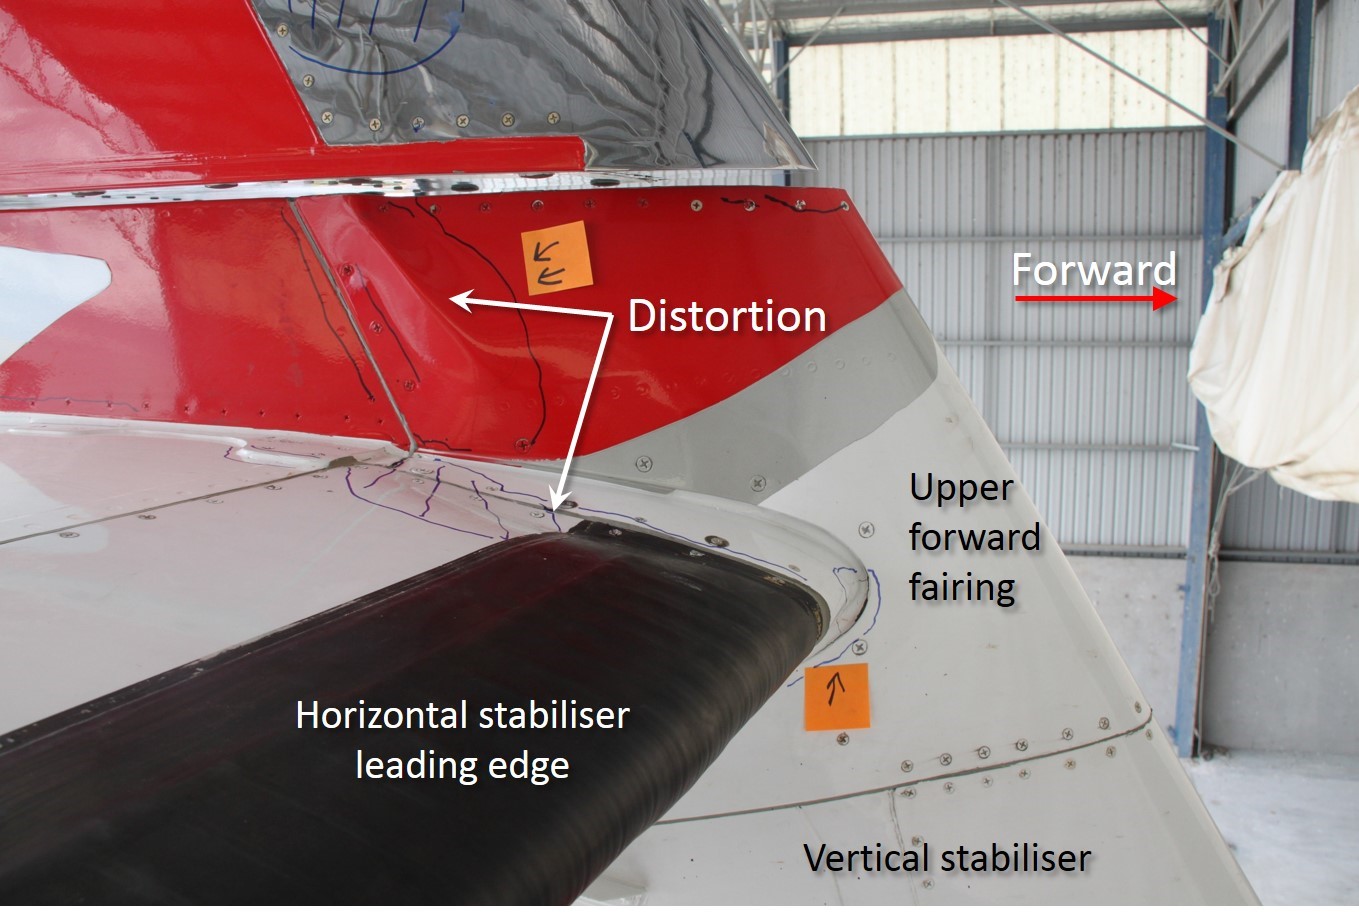
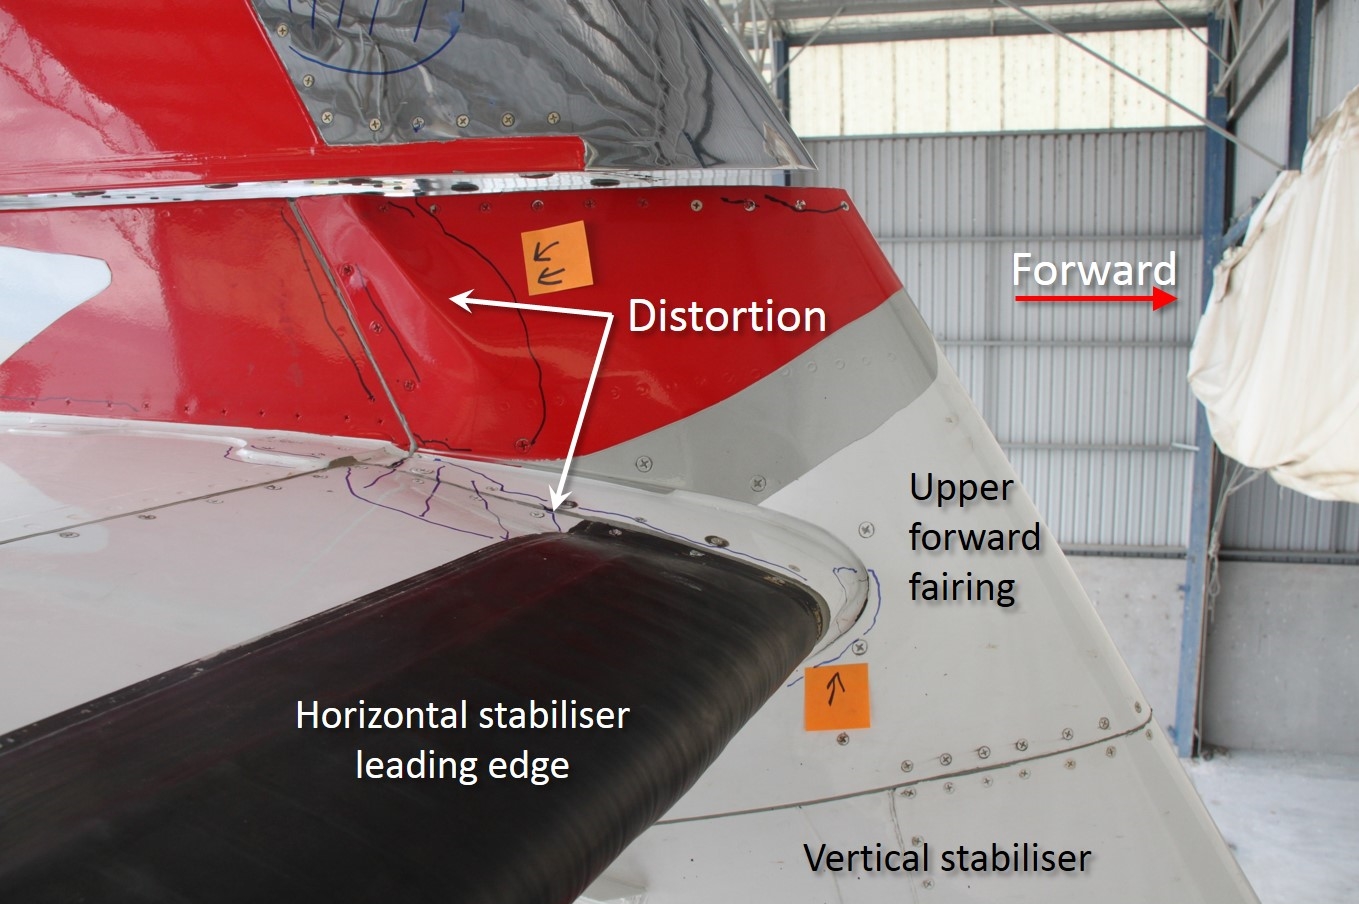
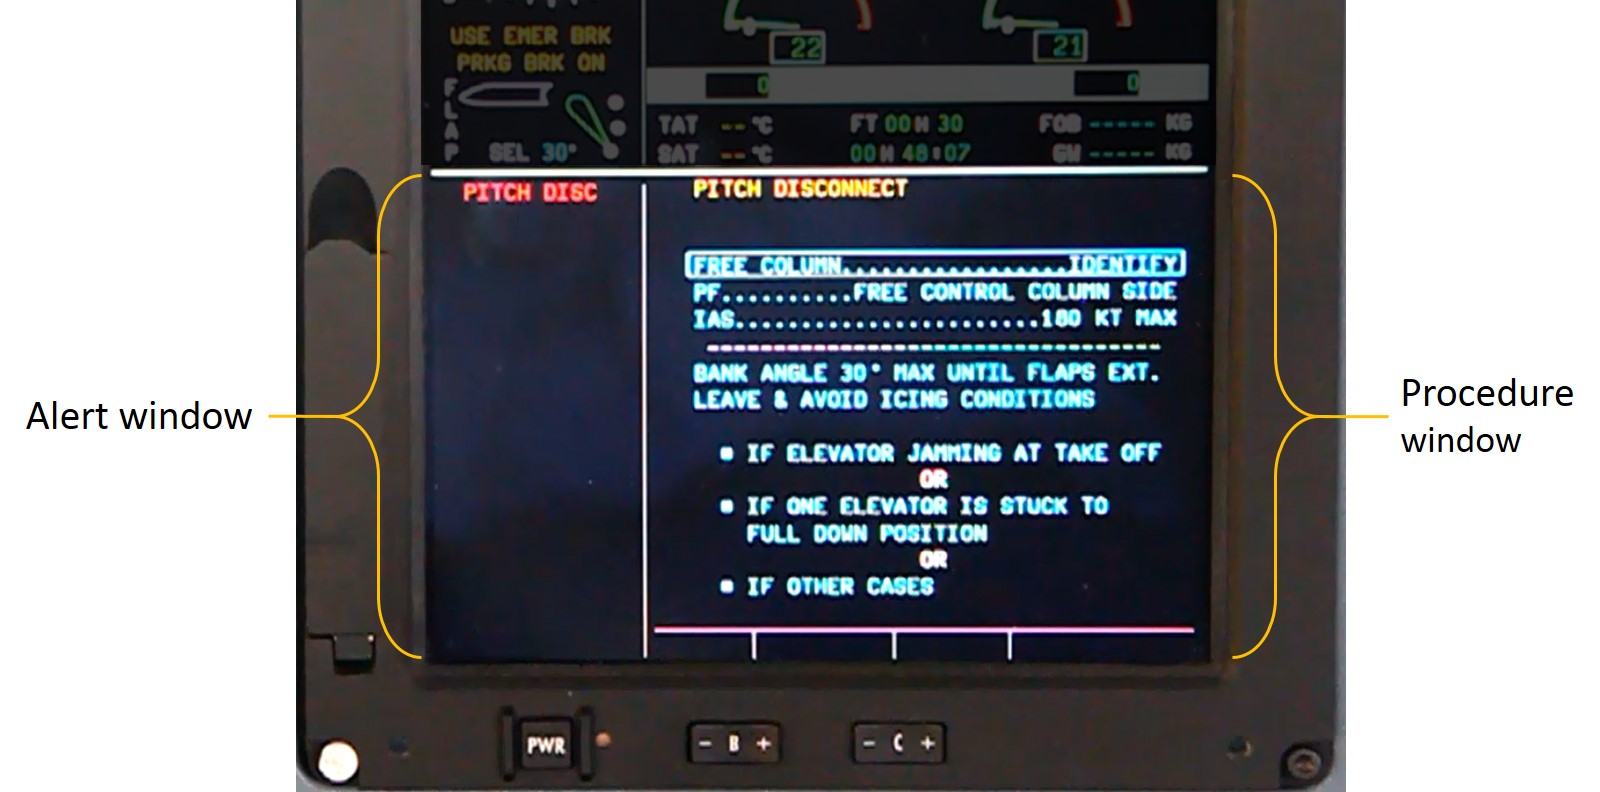
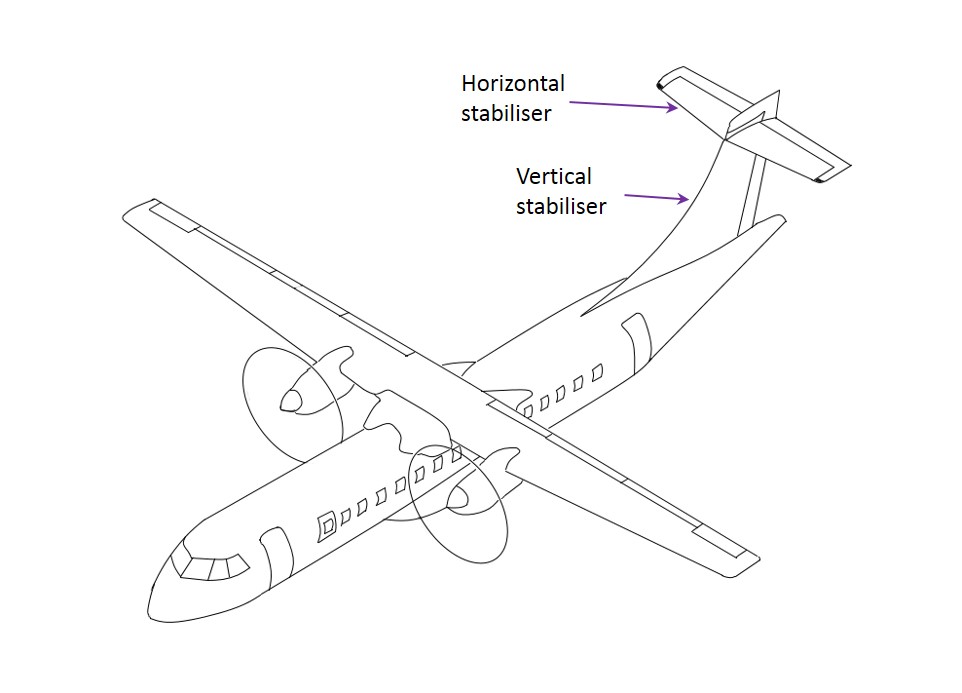
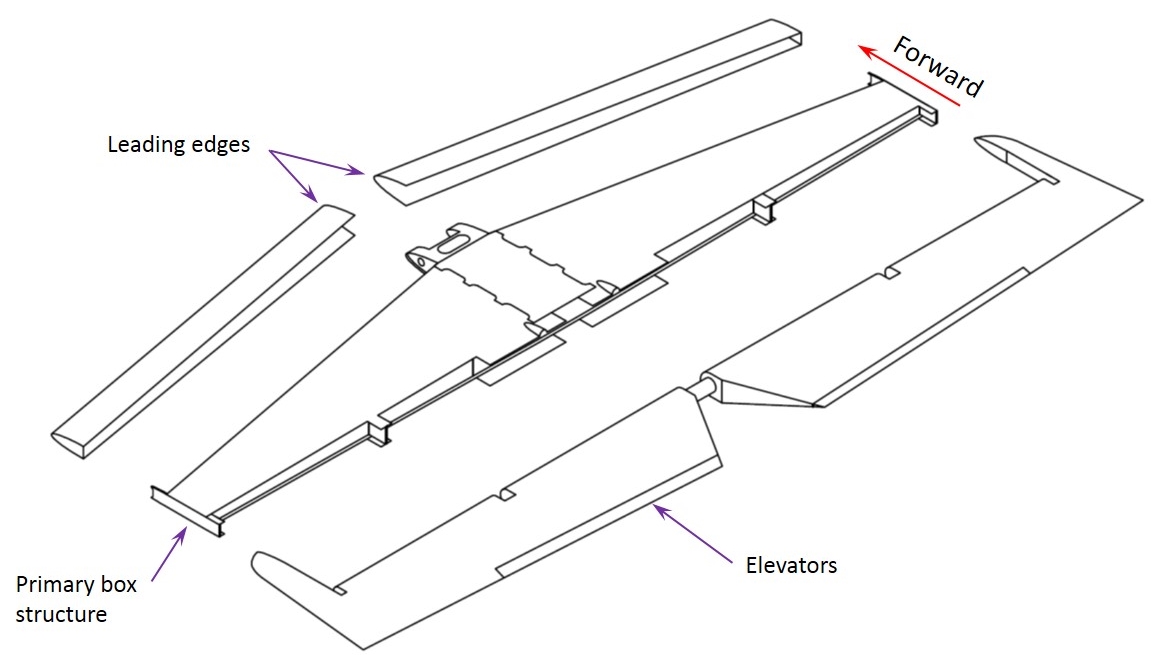
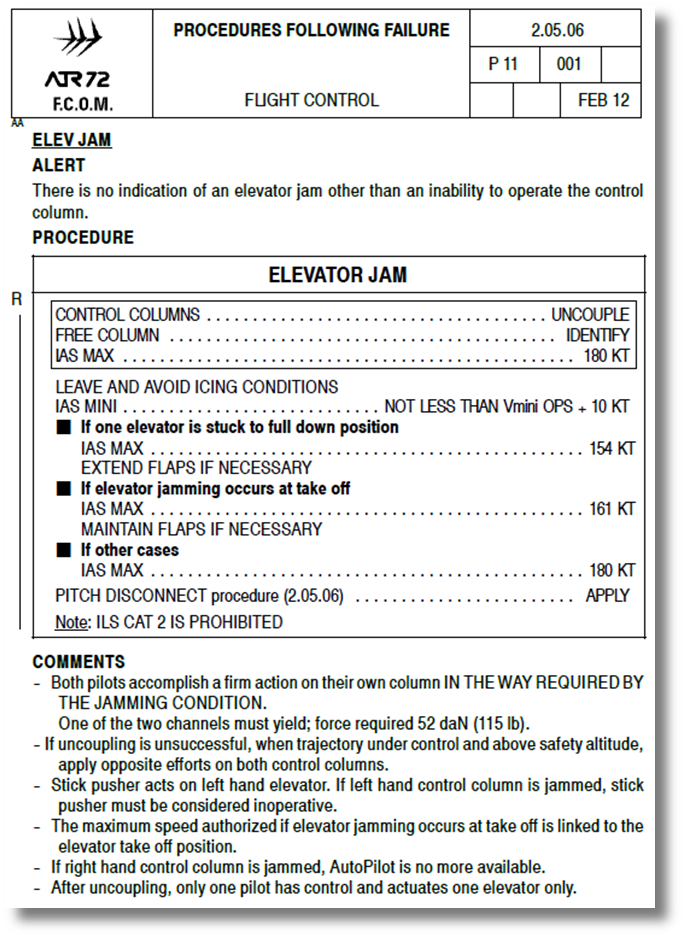
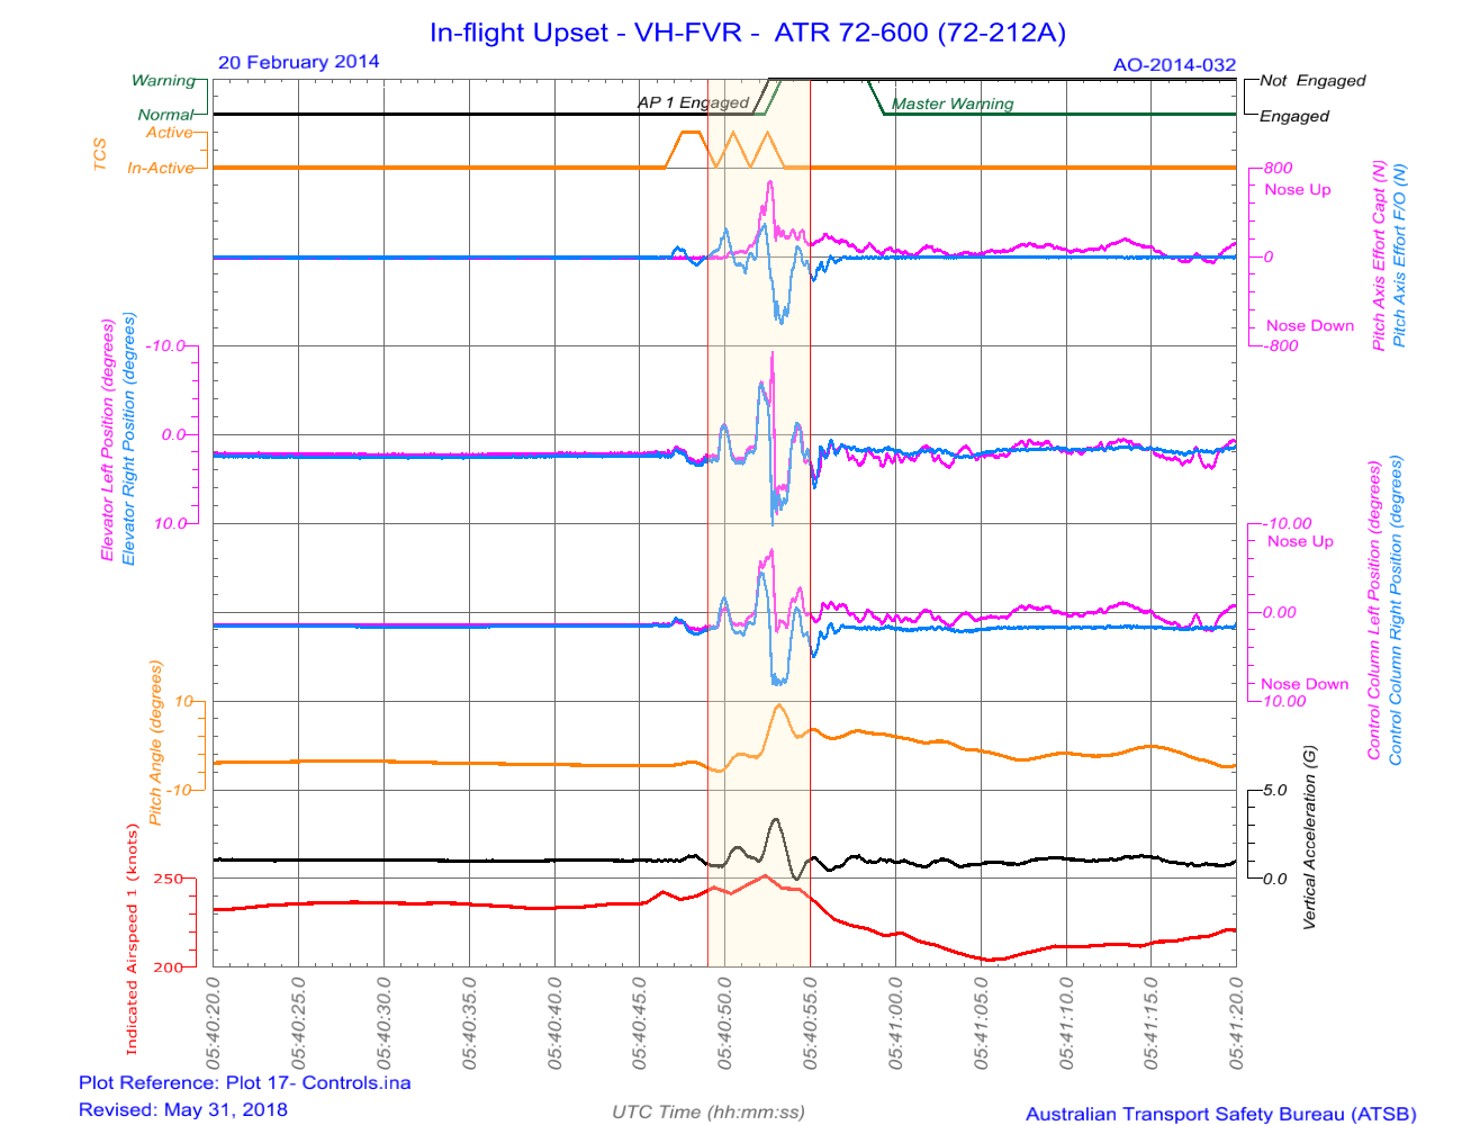
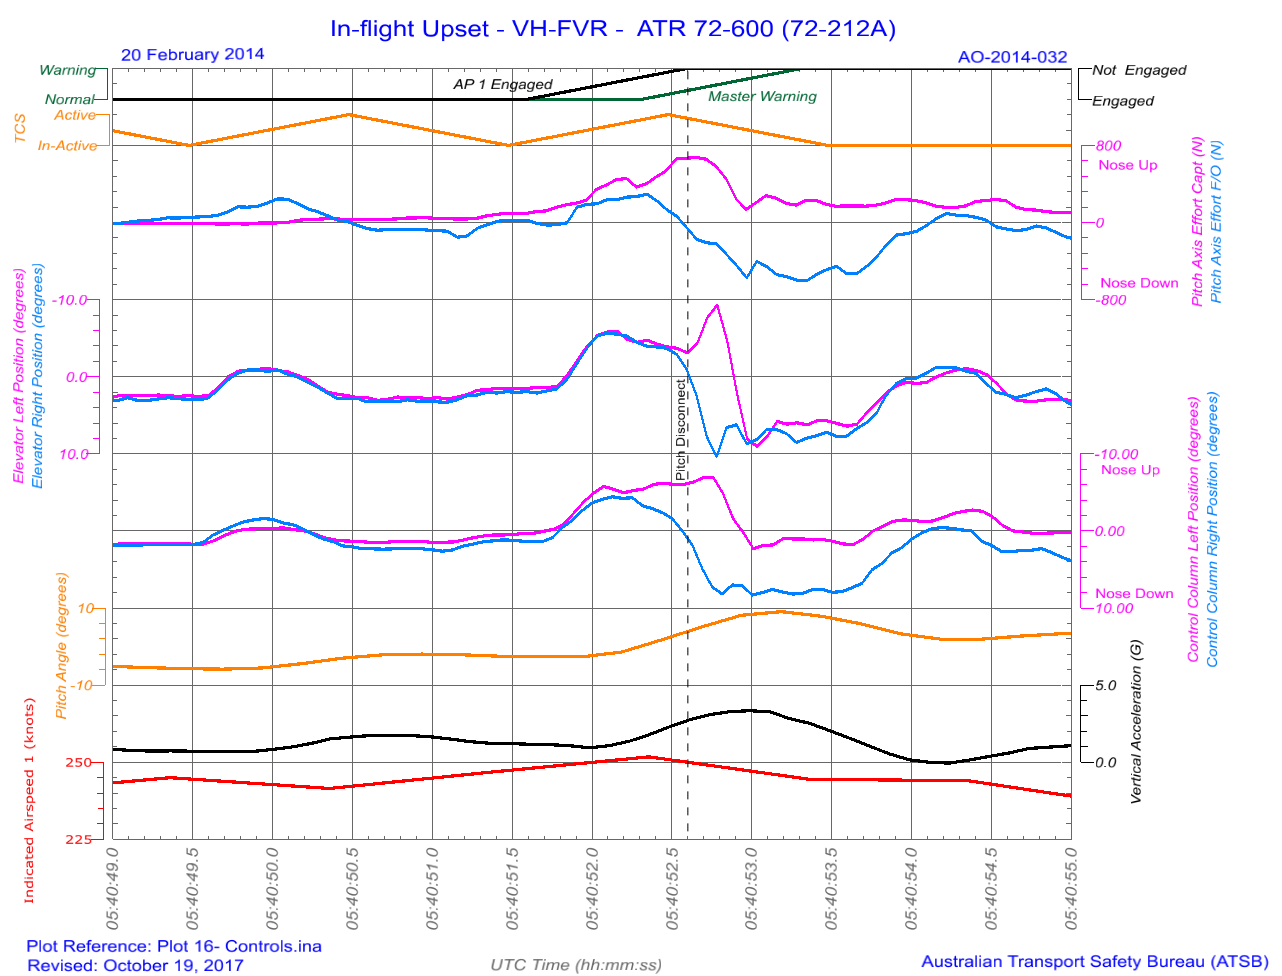
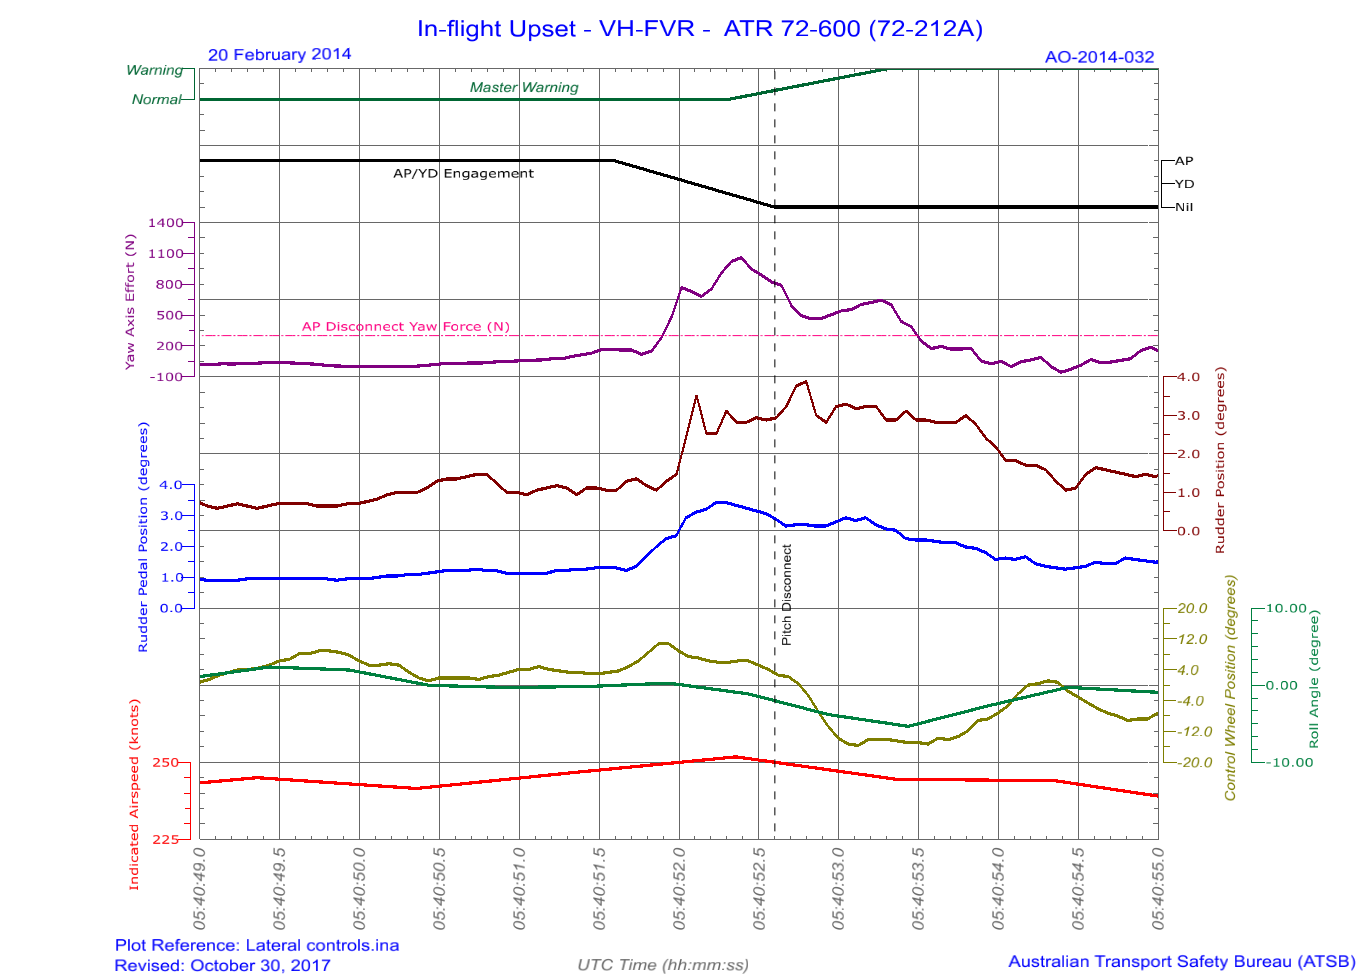
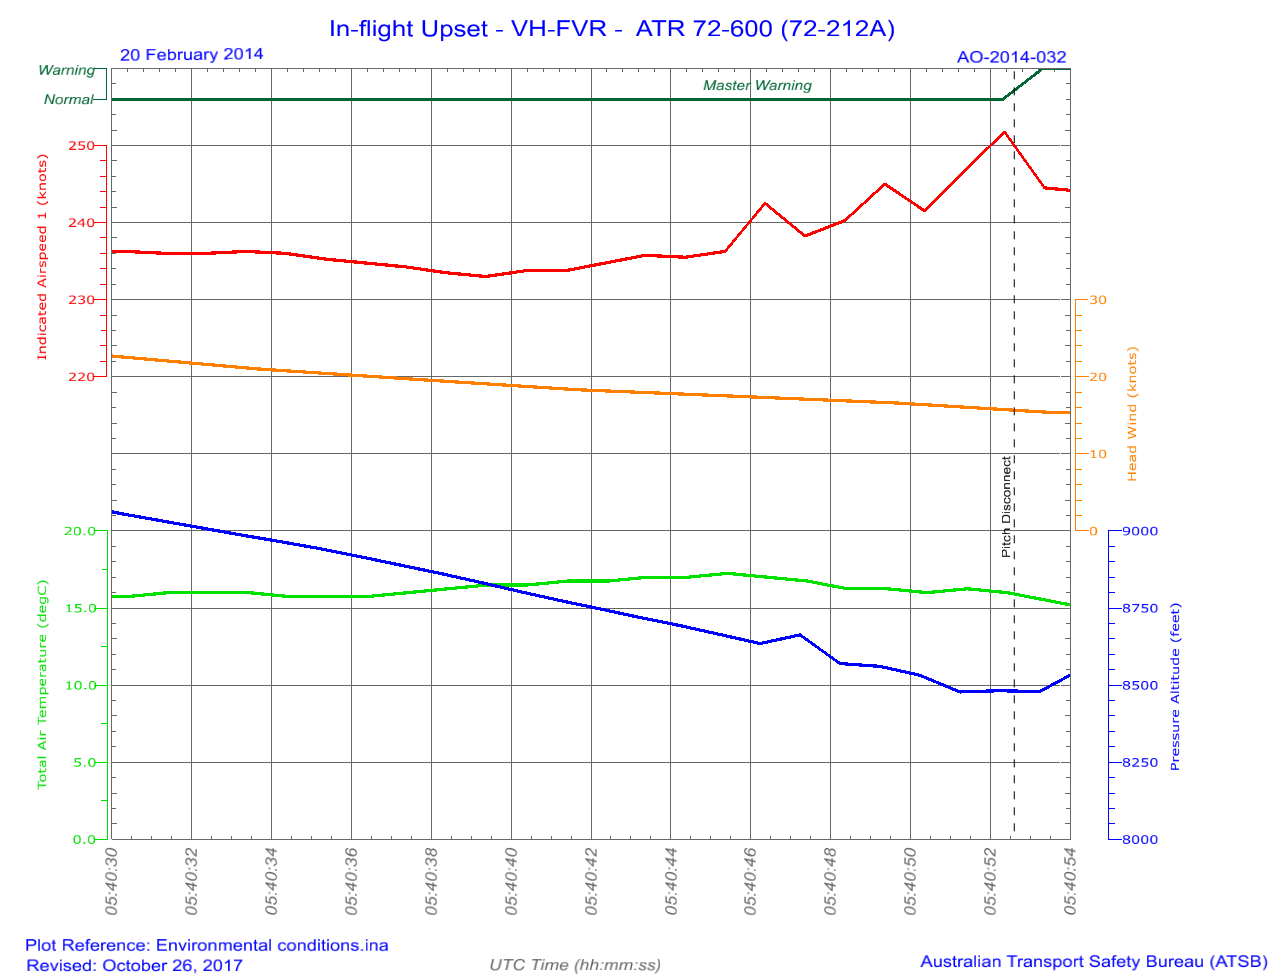
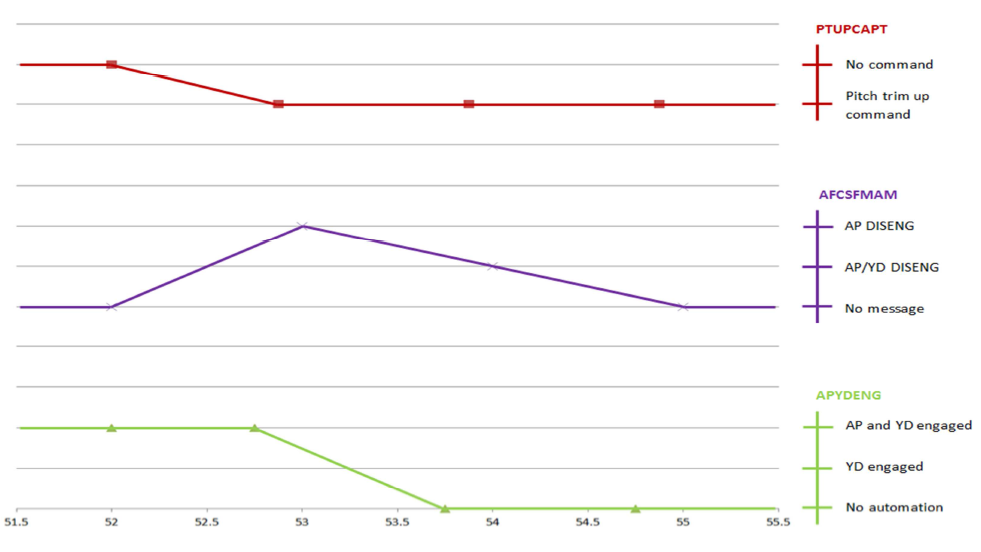
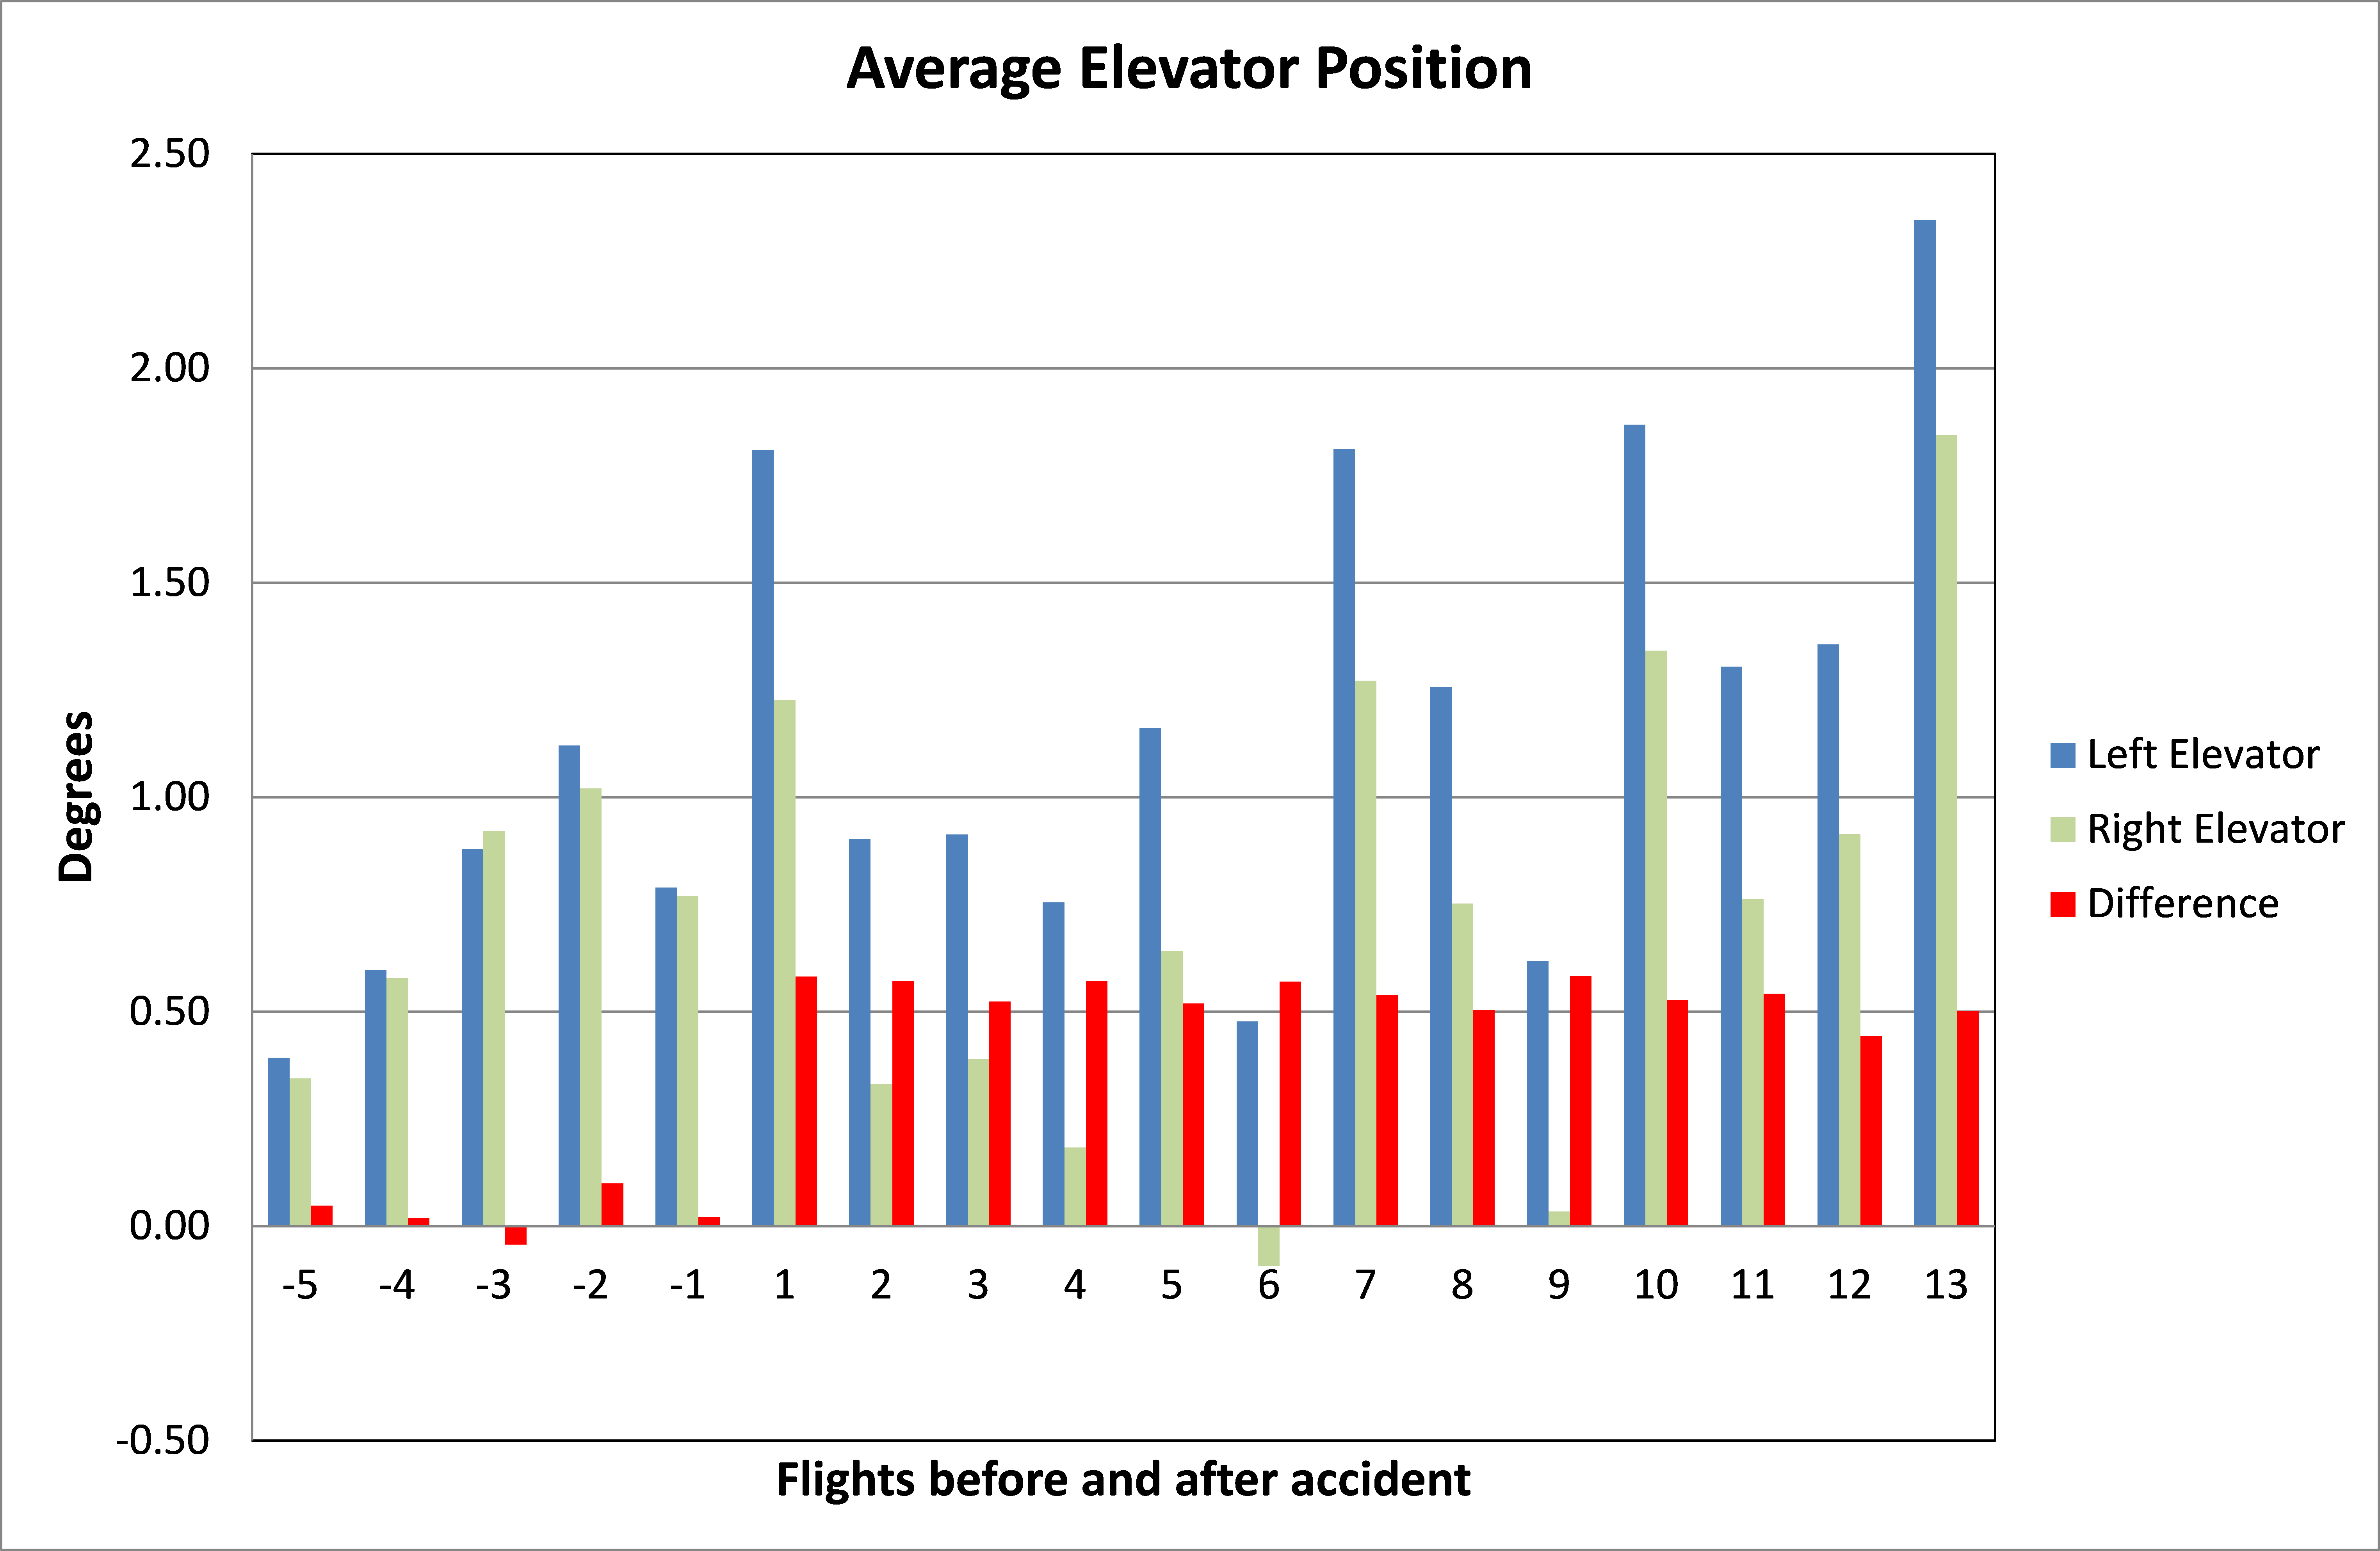
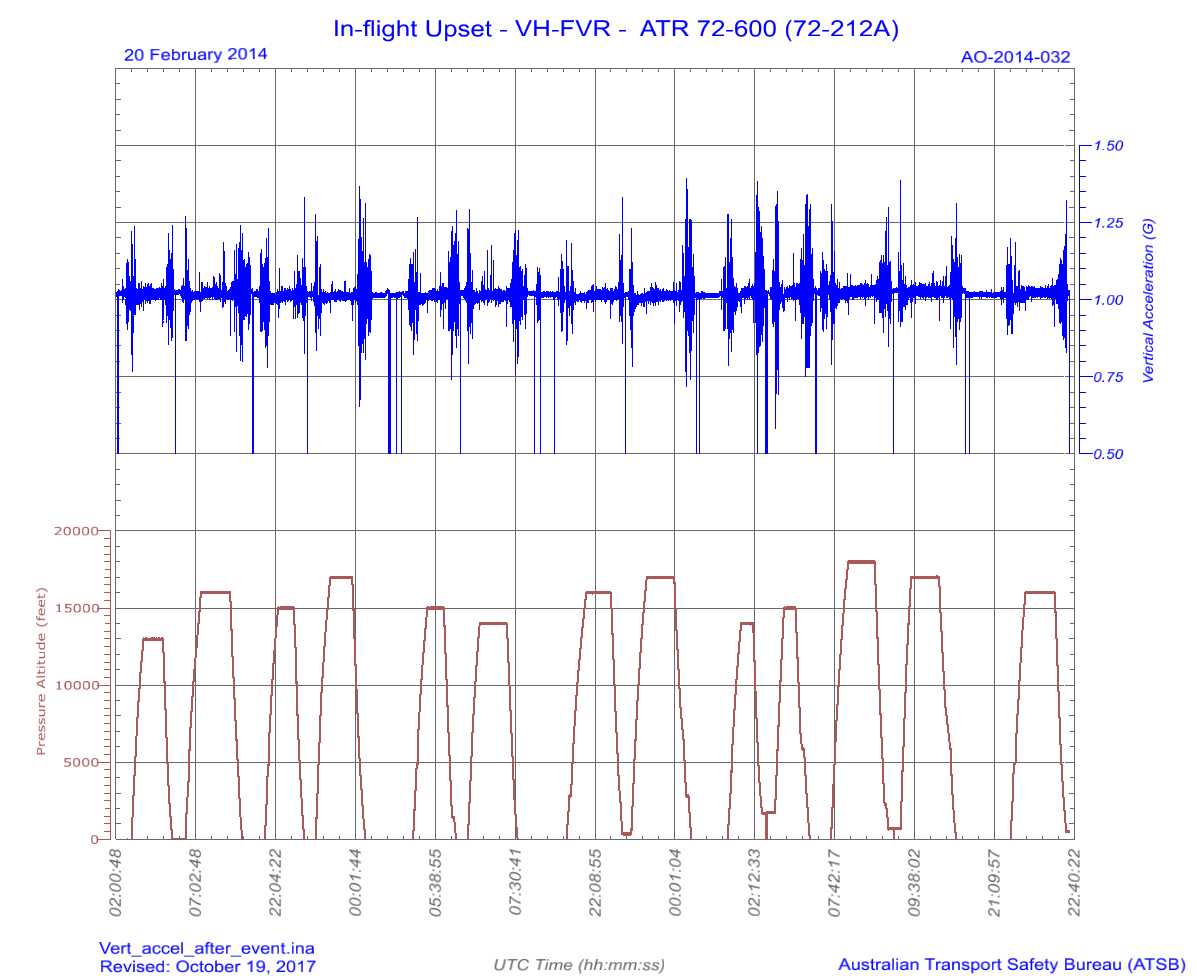
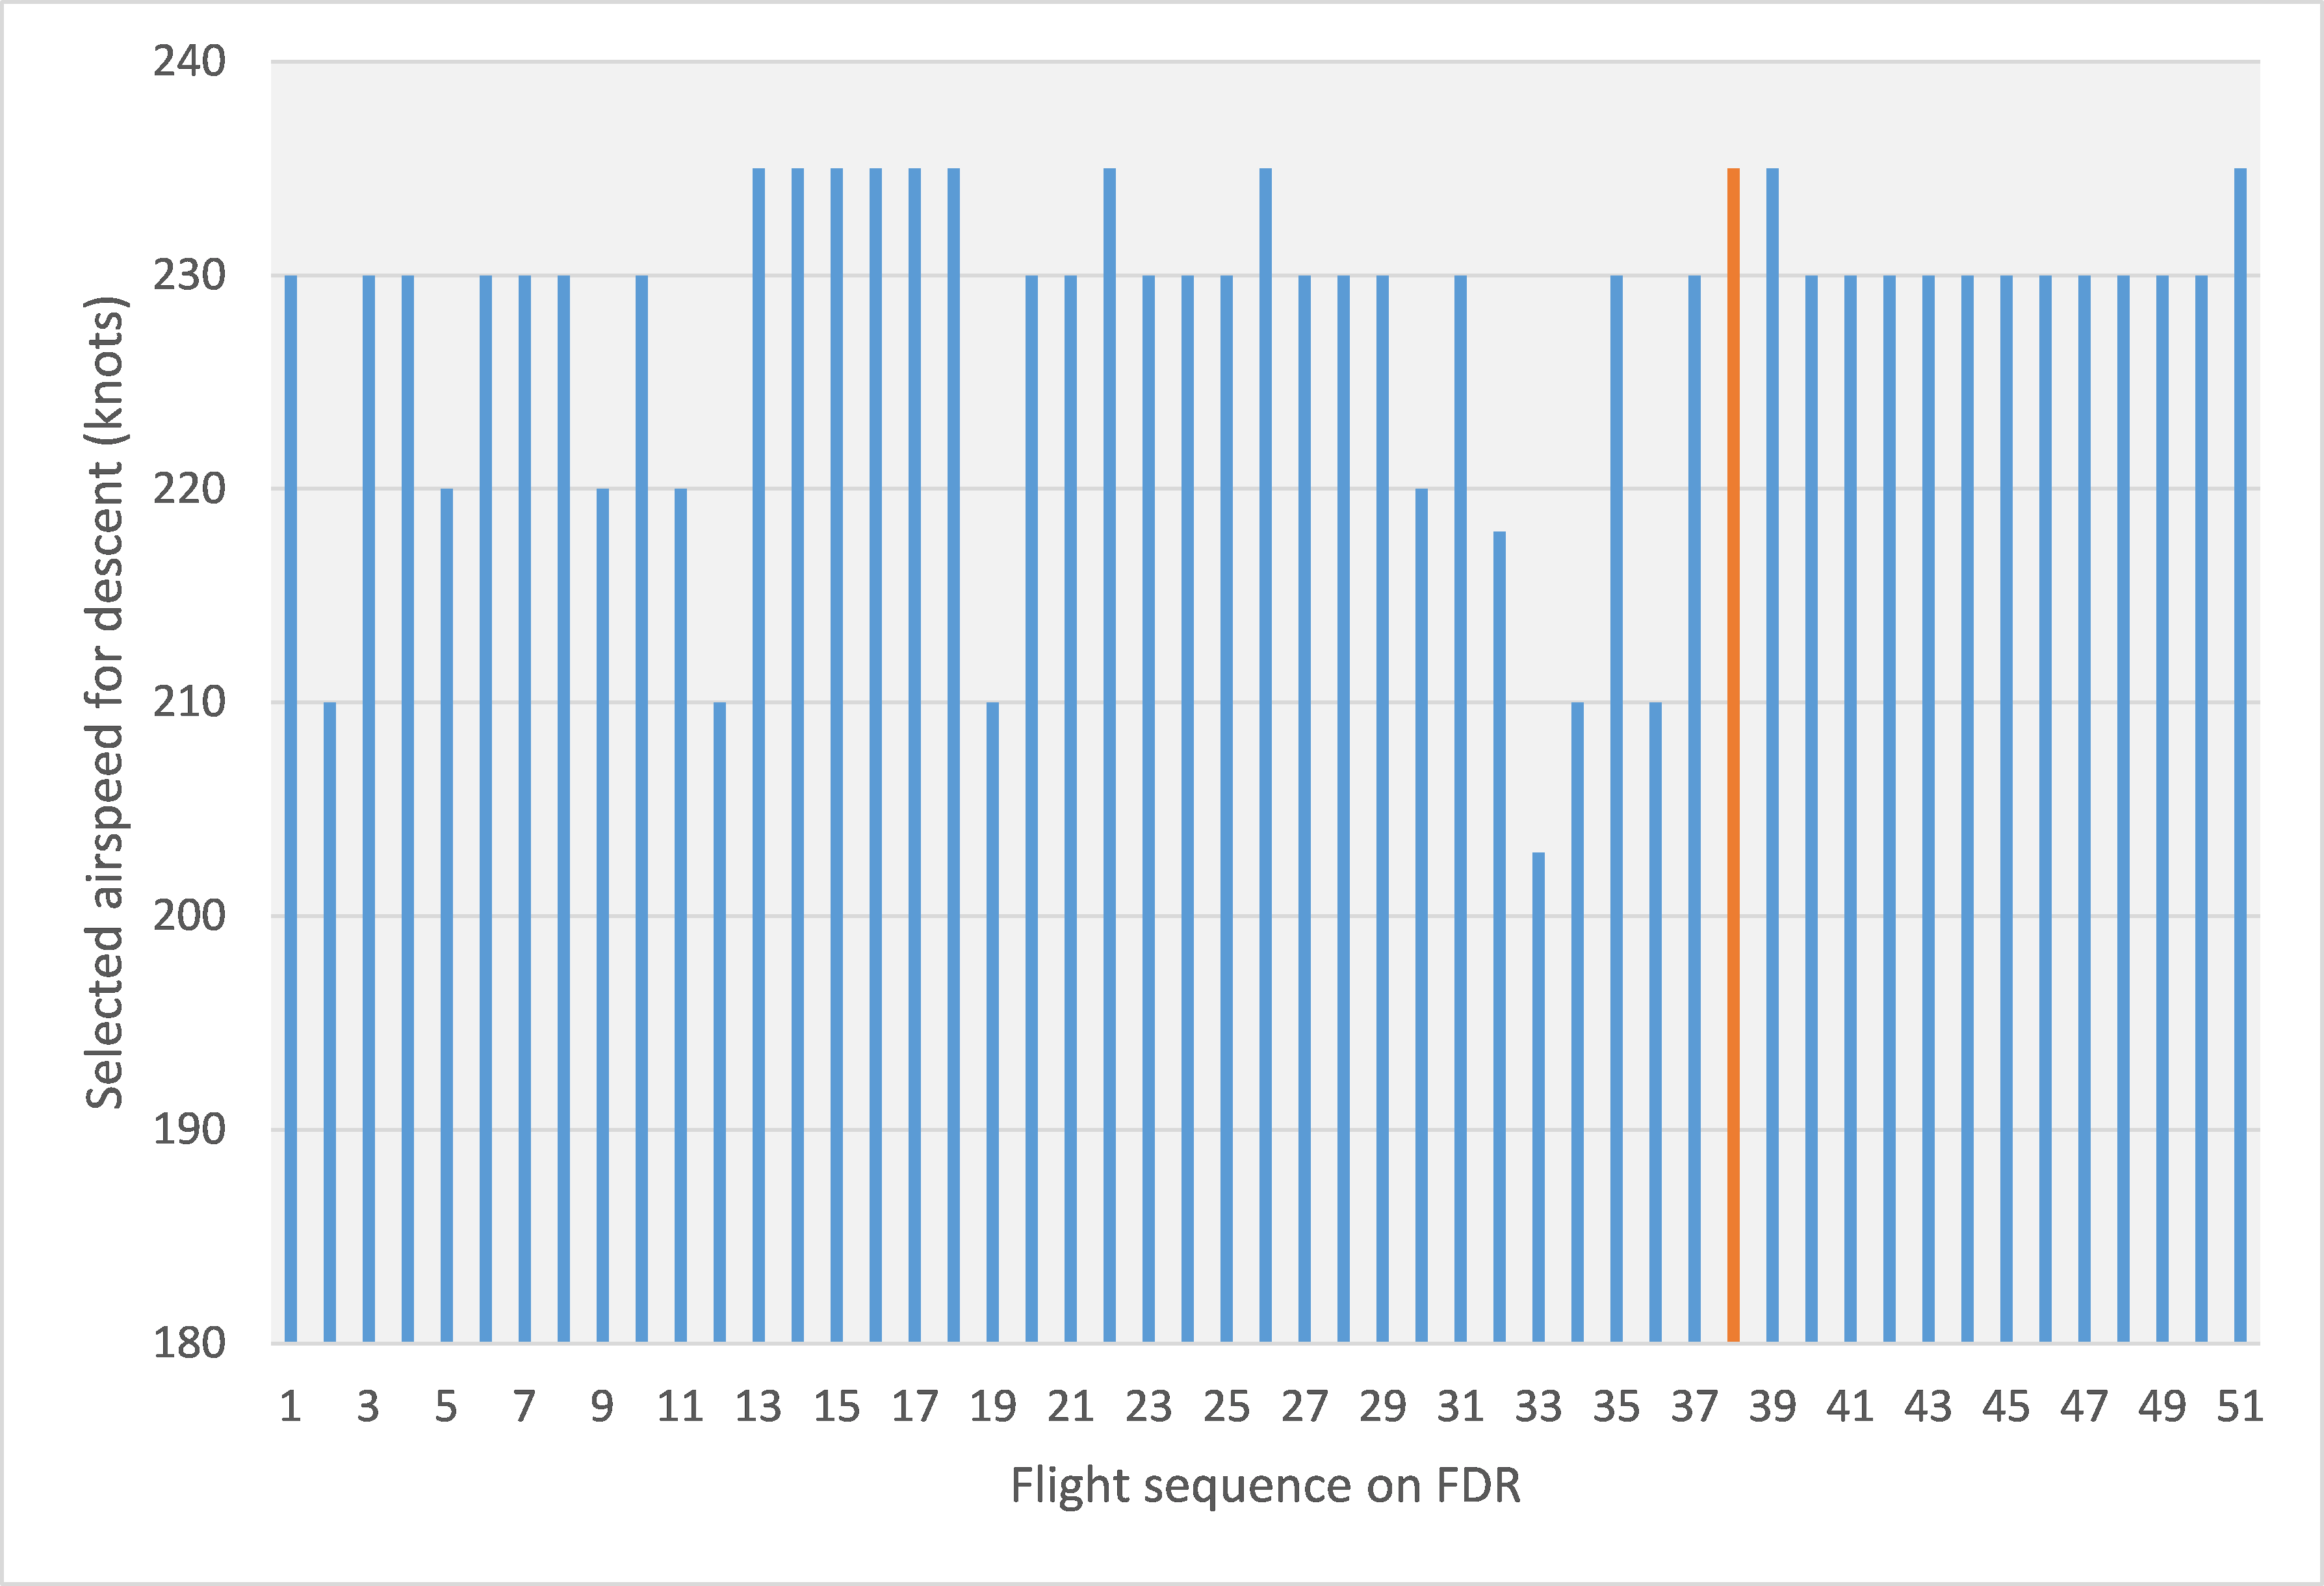
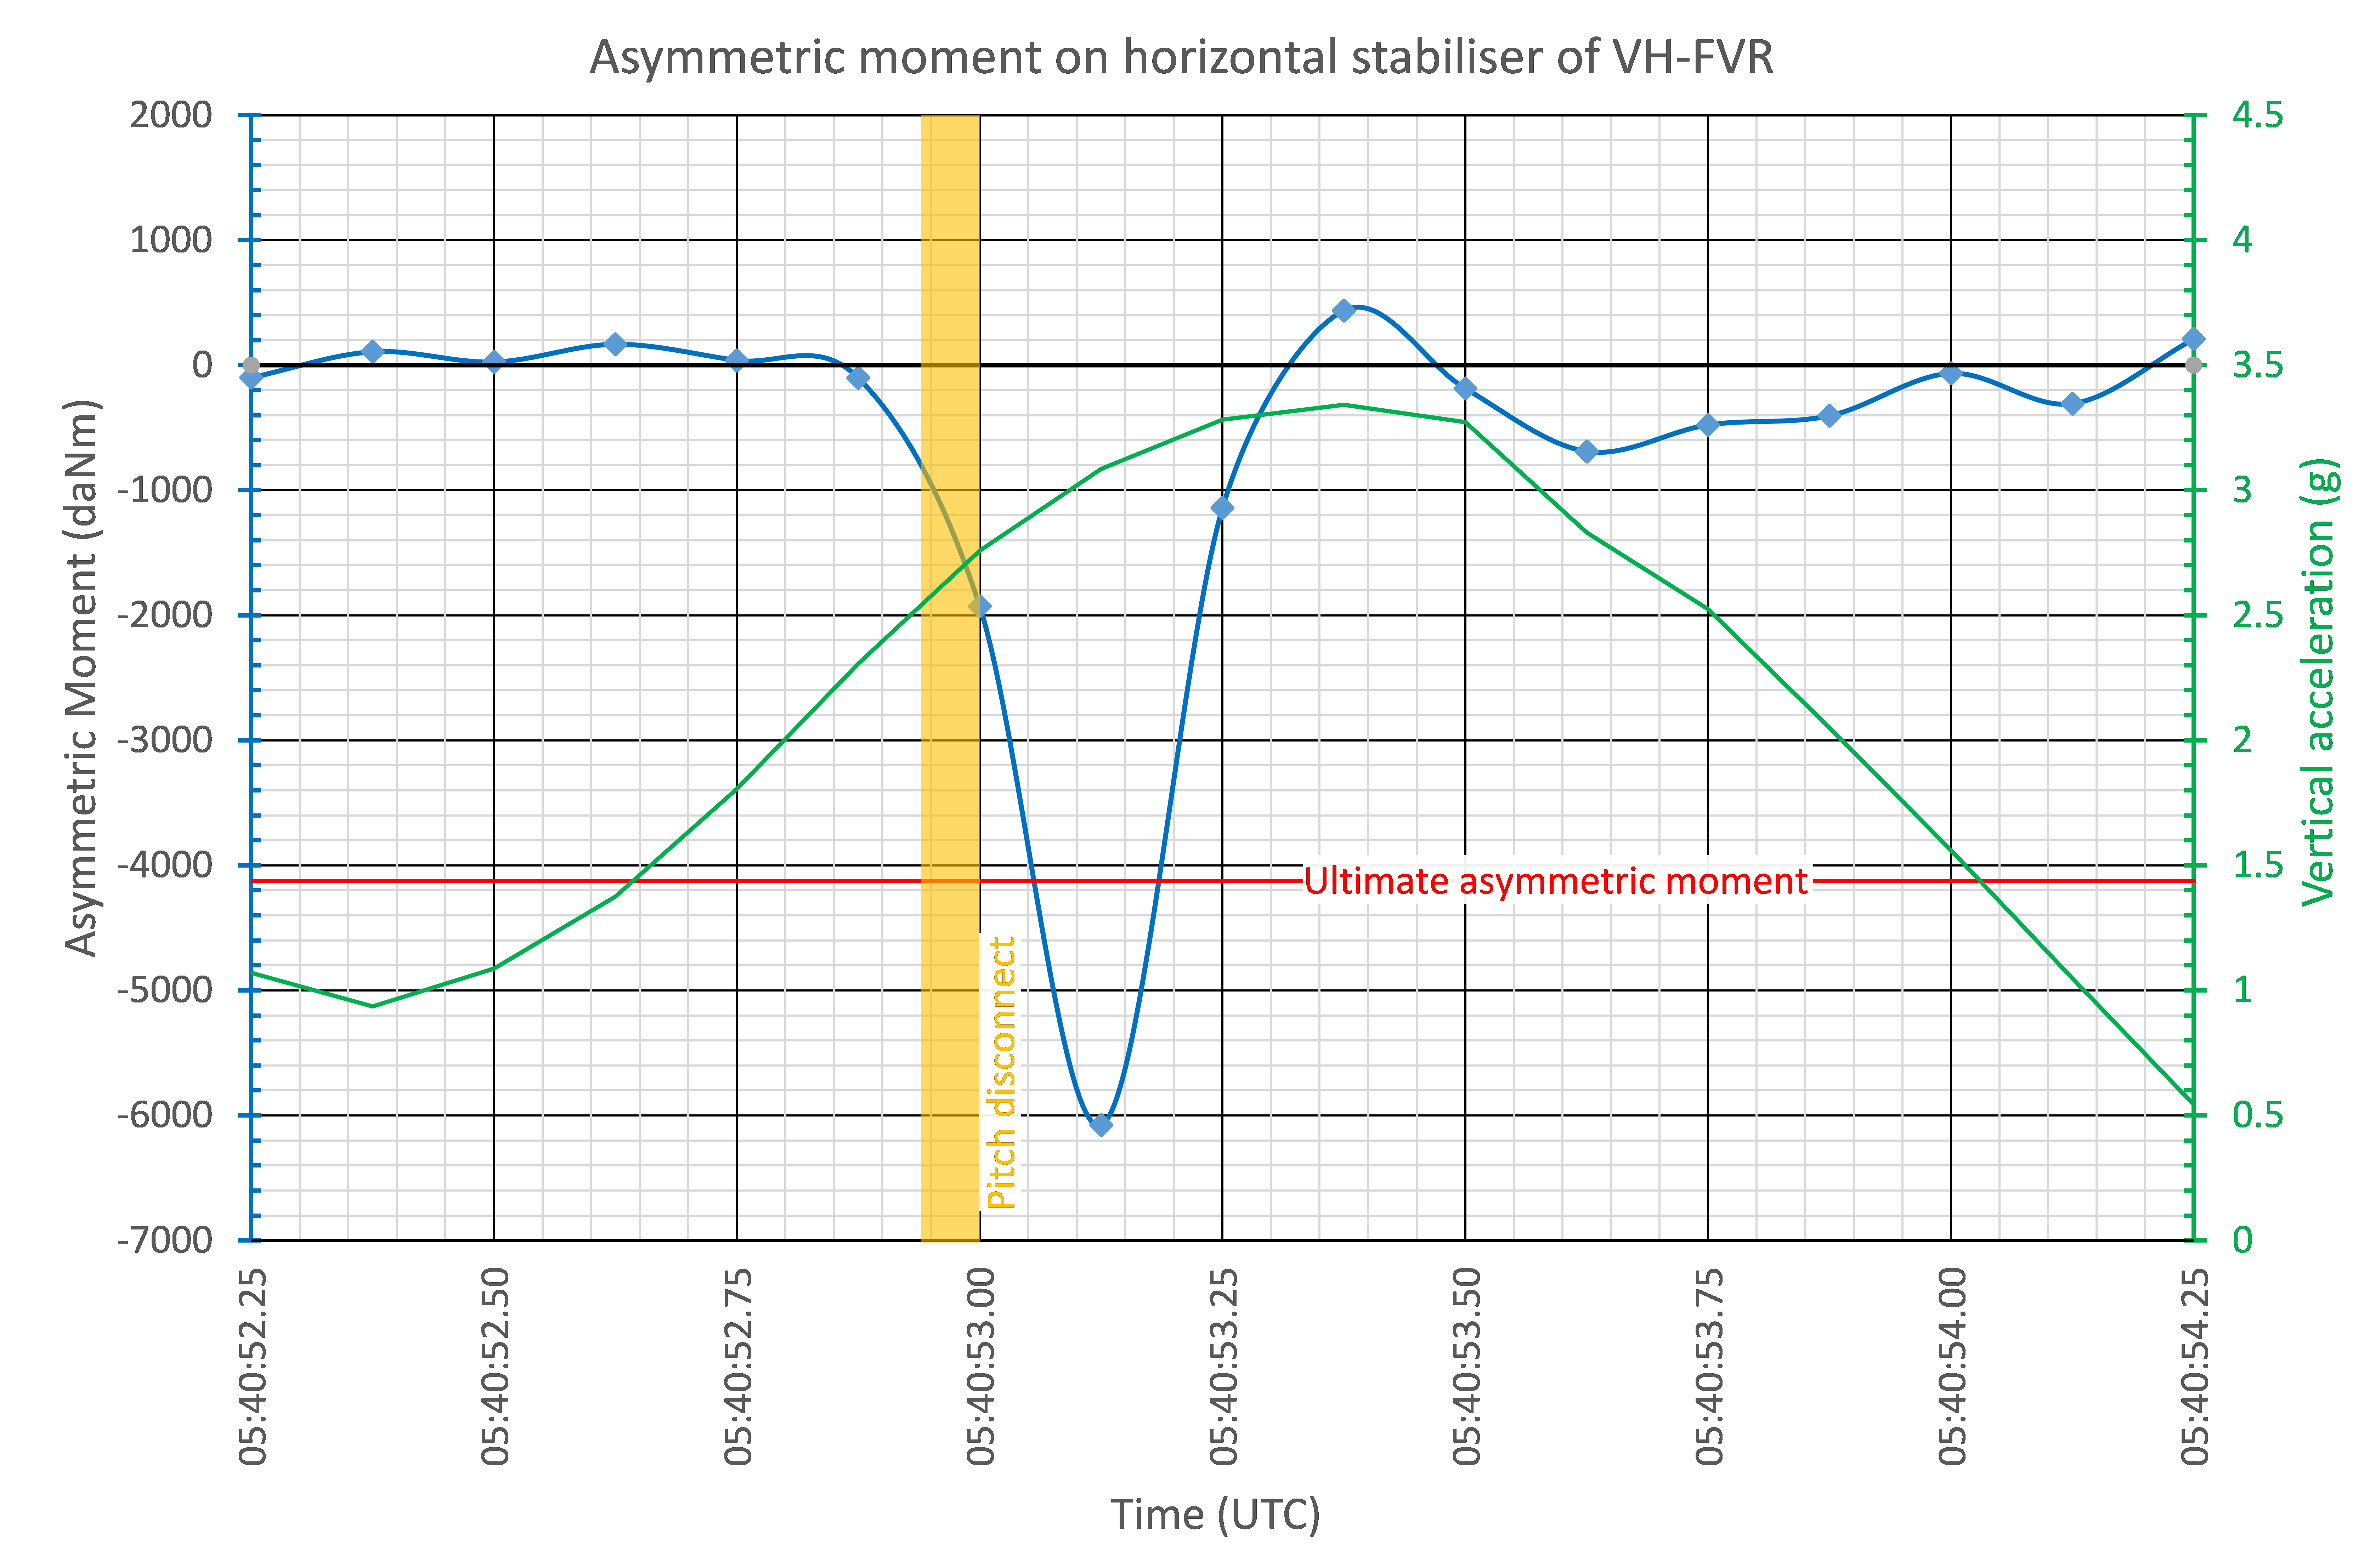
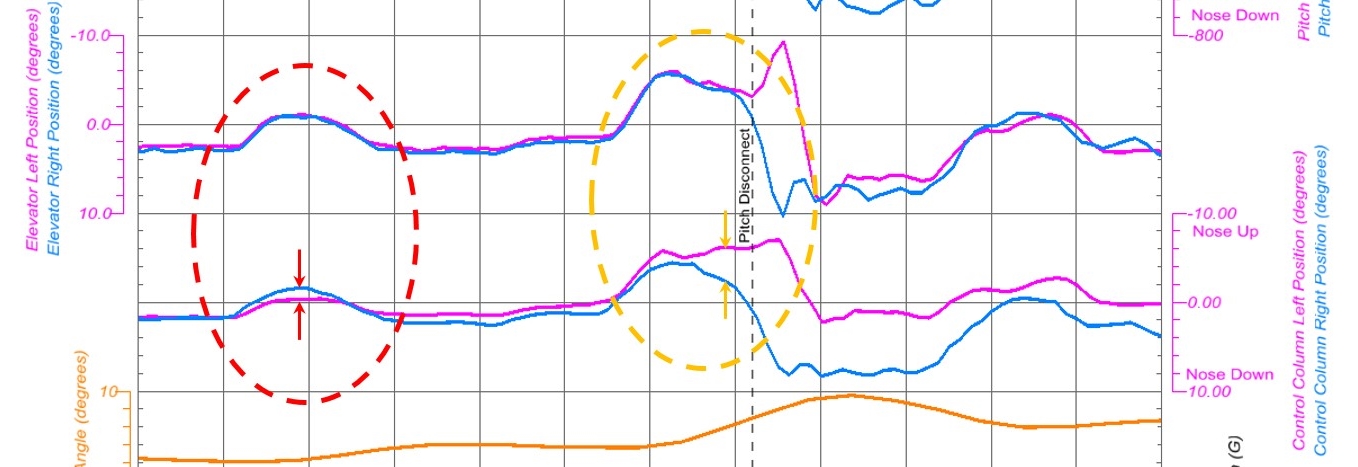
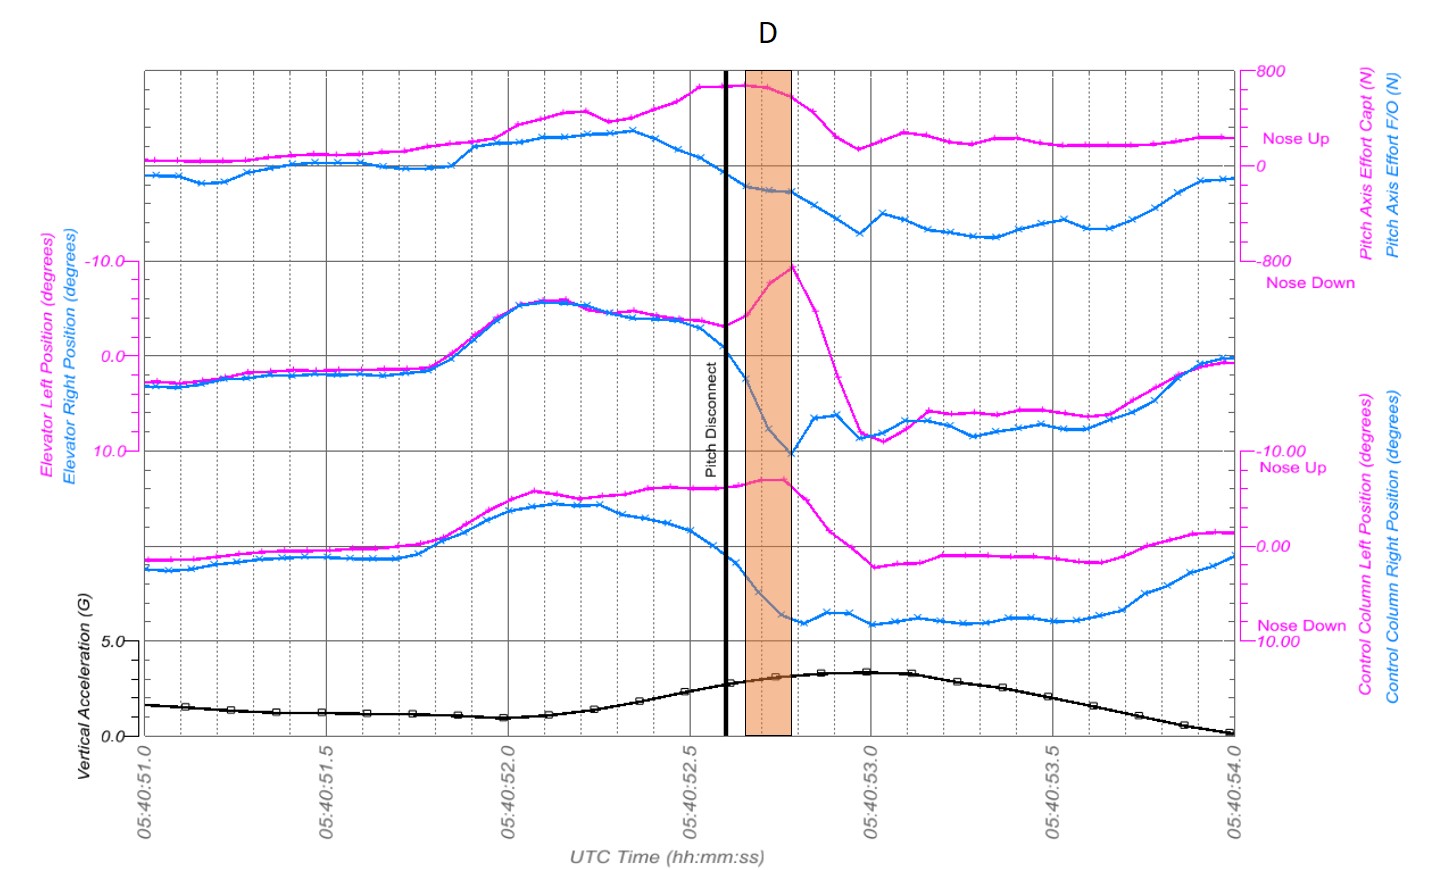
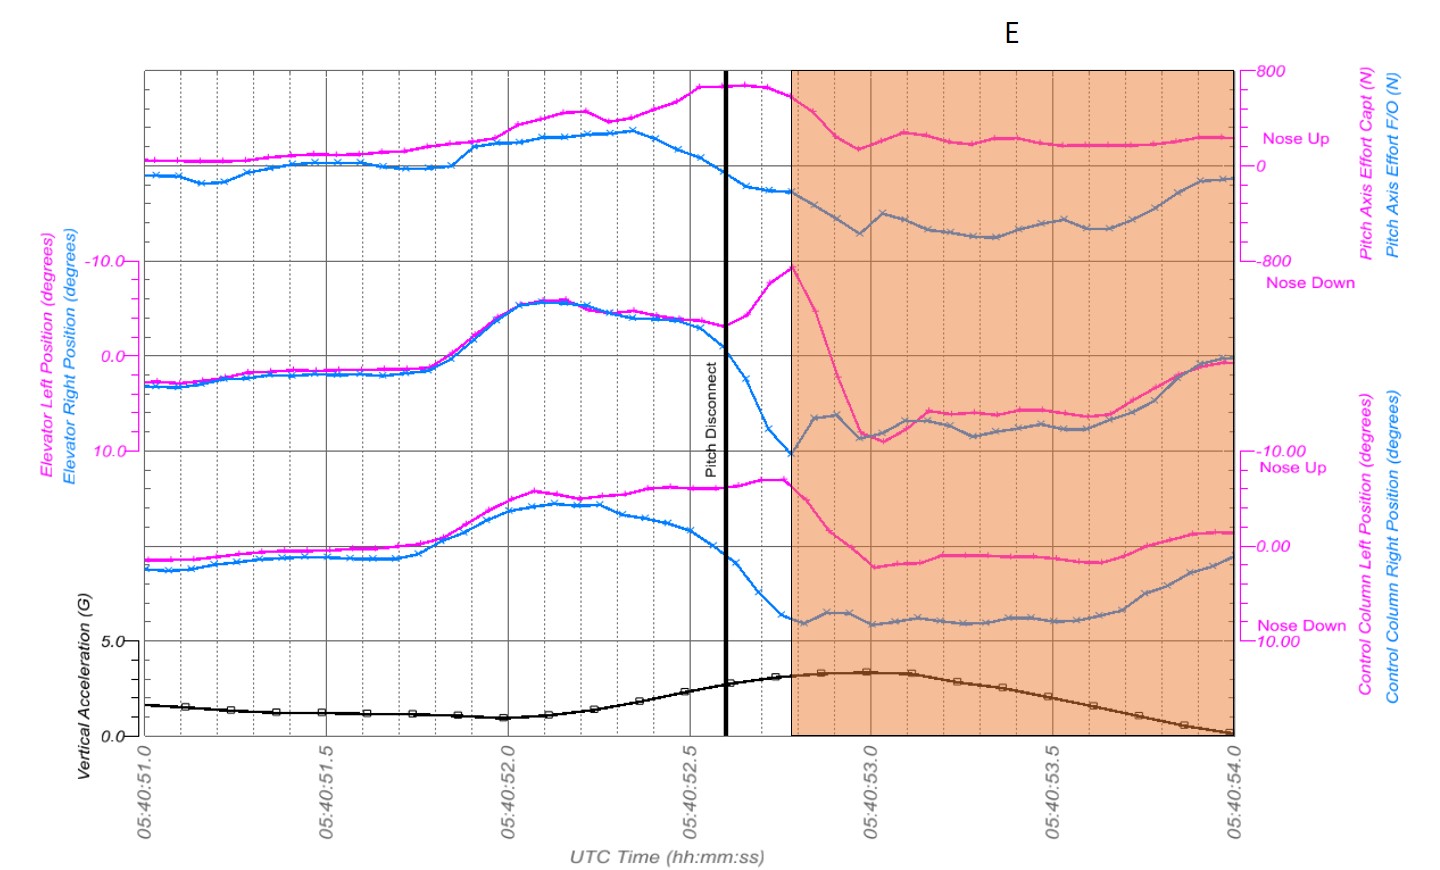
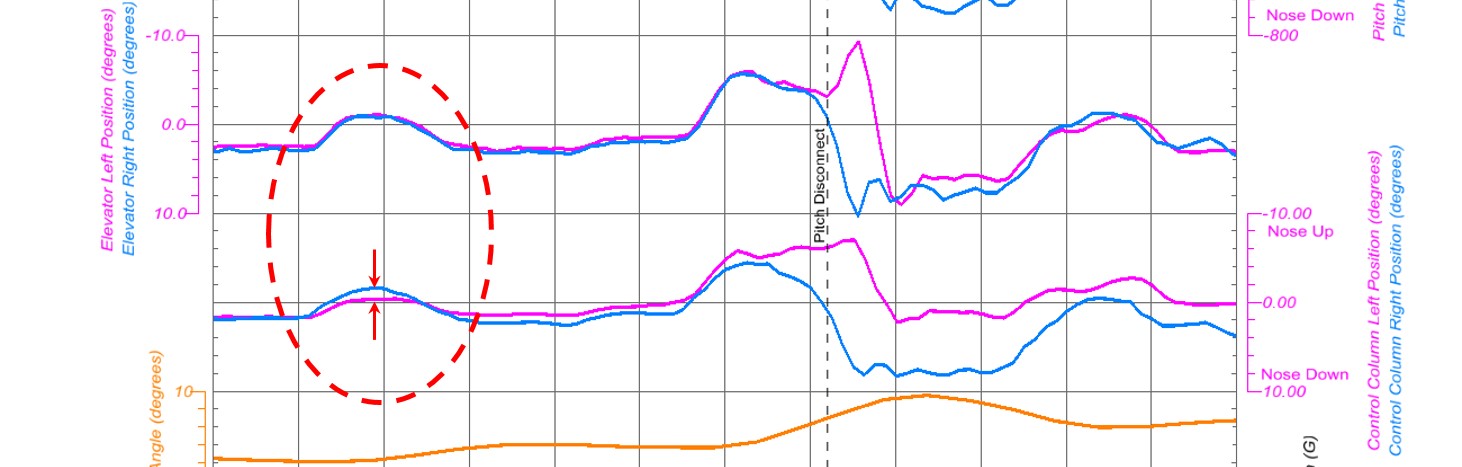
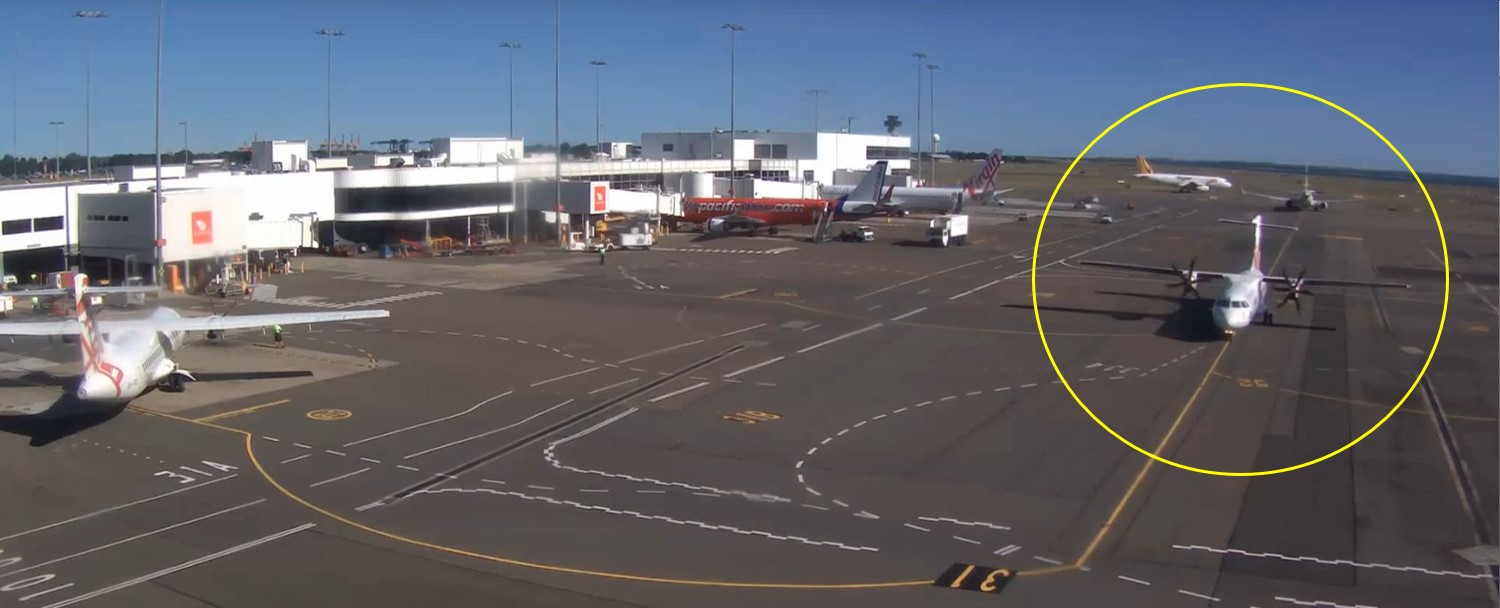
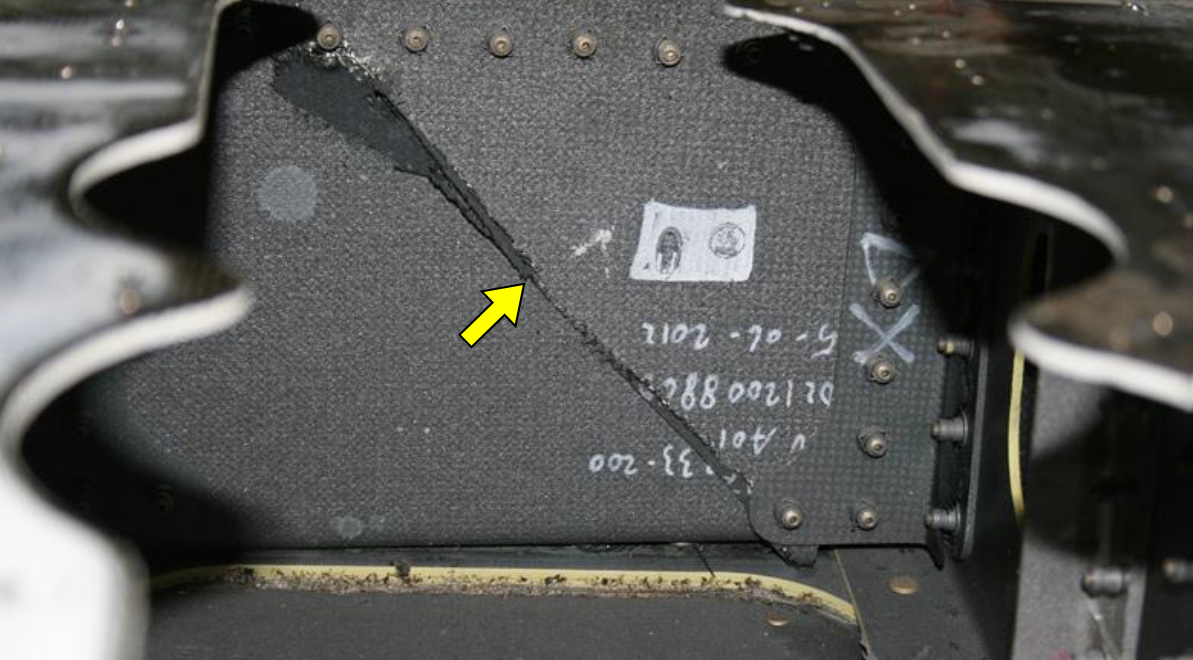
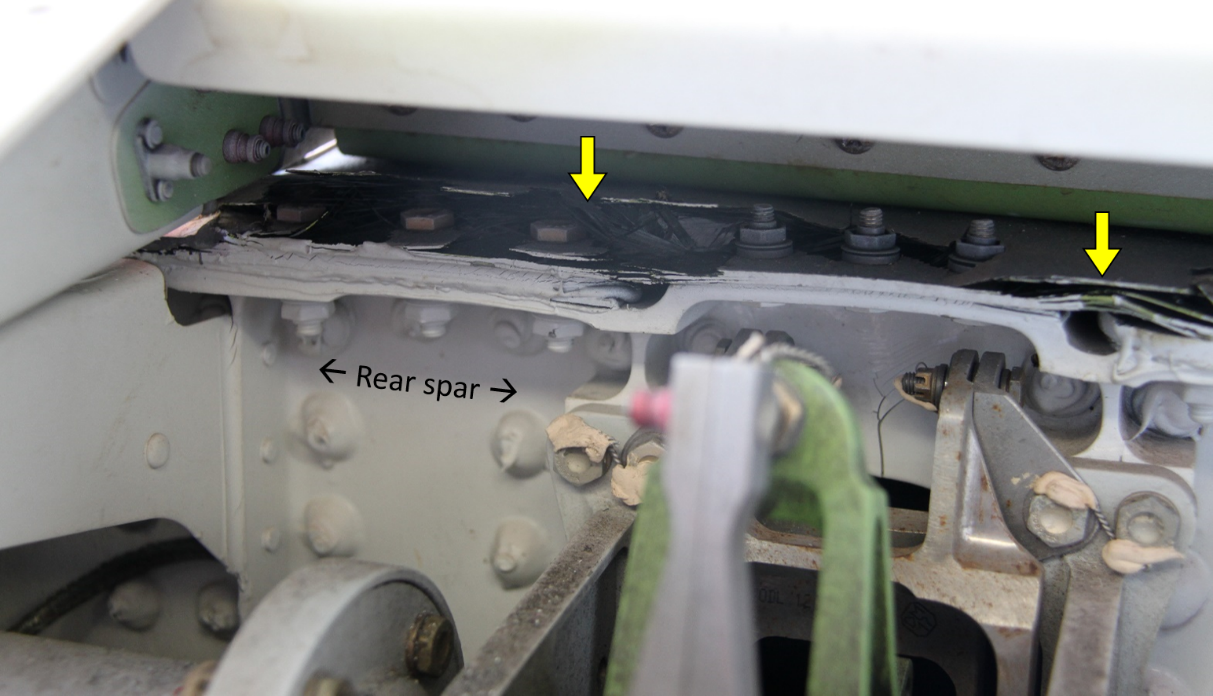
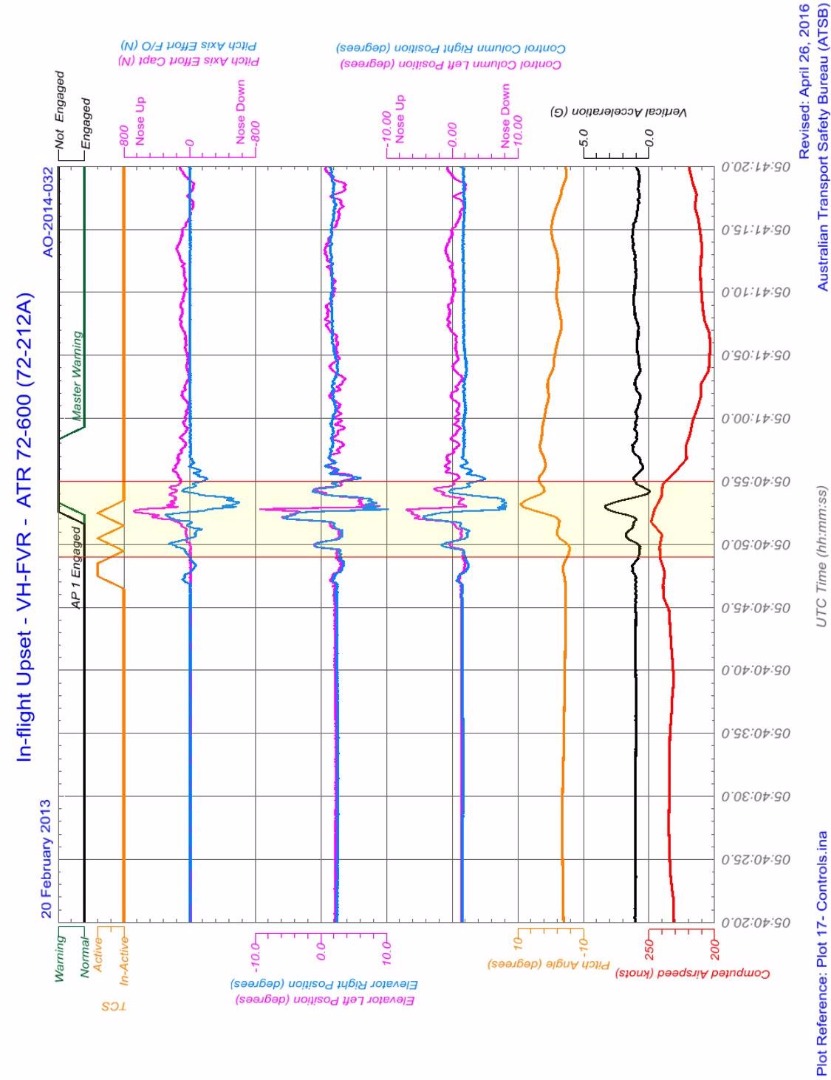
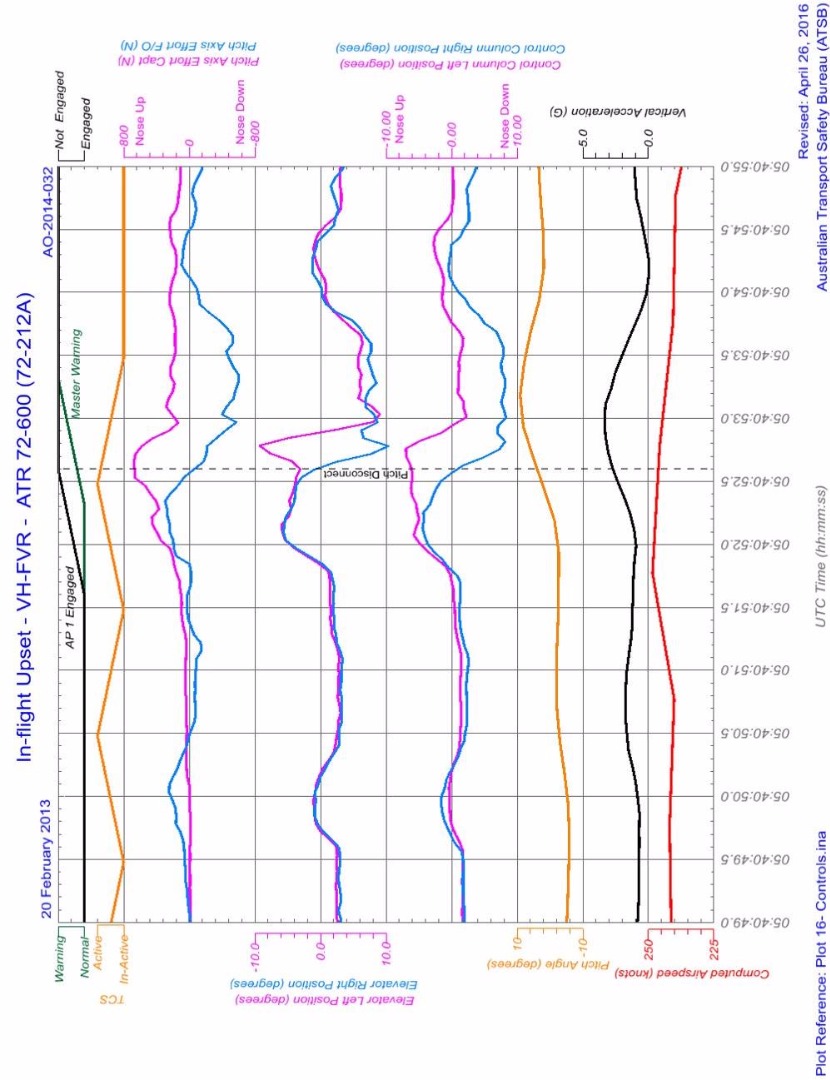
AO-2014-032 In-flight upset, inadvertent pitch disconnect, and continued operation with serious damage involving ATR 72 aircraft, VH-FVR, 47 km WSW of Sydney Airport, NSW, on 20 February 2014. In this occurrence, a rapidly decreasing tailwind lead to an increase in airspeed towards VMO. In response to the unexpectedly high airspeed trend indication and proximity to VMO, the captain made nose-up pitch commands without following the take-over procedure. The aircraft pitched up and down suddenly, and a cabin crew member in the rear of the cabin suffered a broken leg.
AO-2015-041 Flight path management occurrence involving Boeing 737, VH-YID, 55 km from Adelaide Airport, South Australia, on 9 May 2015. During a high-speed descent, the airspeed increased towards VMO. The first officer responded to the unintended speed increase by pulling back on the control column until the autopilot entered a secondary mode. There was a sudden release of the control column, and one cabin crew member in the rear of the aircraft fell, sustaining a knee injury.
AAIB investigation into Boeing 737-8AS, Serious injury to cabin crew, during descent to Manchester Airport, United Kingdom, on 14 January 2017. During a high-speed descent, a decrease in tailwind contributed to a VMO overspeed. Because the captain perceived that the autopilot was not correcting the situation, the captain disengaged the autopilot using the autopilot disengage button, and pulled back on the control column. During the accident investigation, the captain reported pulling back with more force than intended. The aircraft experienced abrupt pitch changes and one cabin crew member in the rear of the aircraft suffered a fractured ankle.
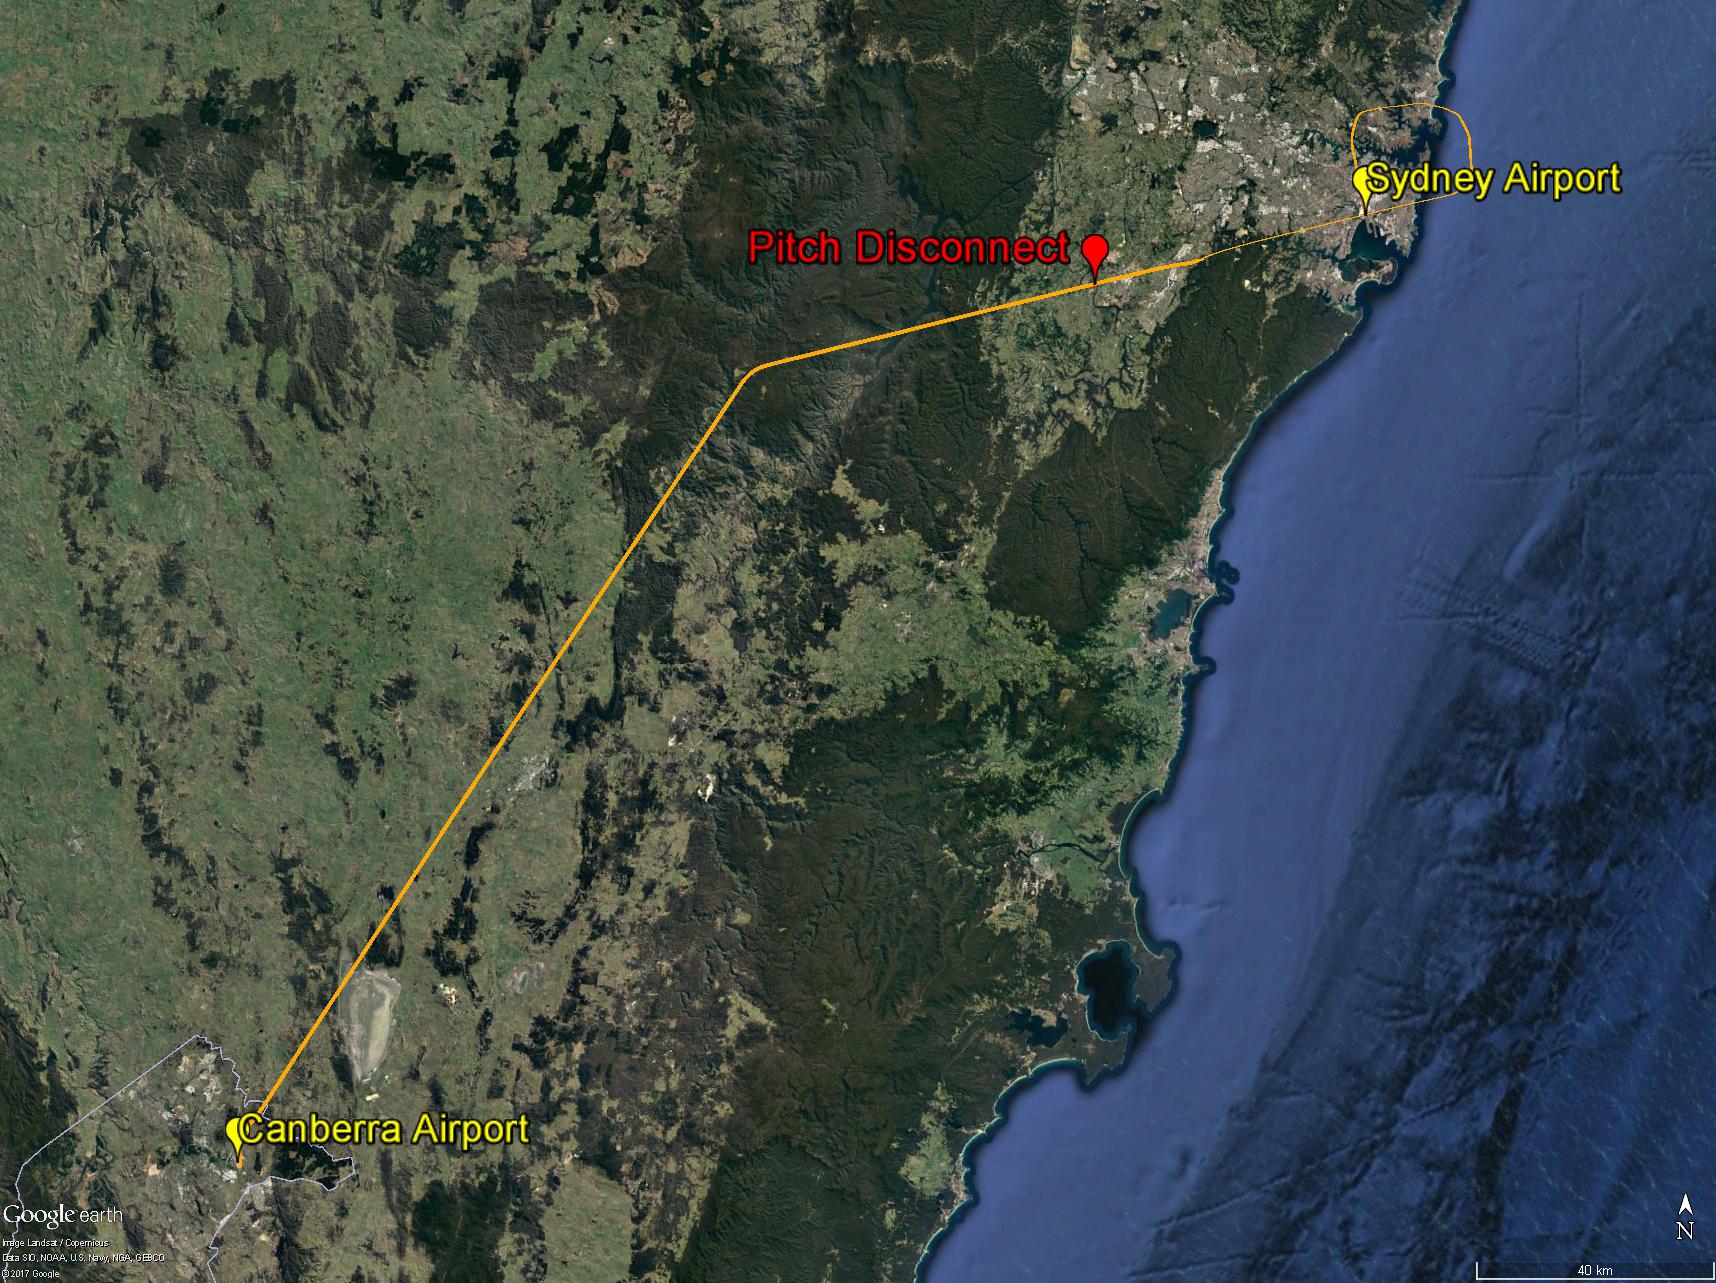
AO-2017-030 Flight path management occurrence involving Boeing 737, VH-VZZ, near Canberra Airport, ACT, on 13 March 2017. During a high-speed descent, a sudden decrease in tailwind contributed to an increase in airspeed towards VMO. The pilot flying pulled back on the control column, causing the autopilot to disconnect. The aircraft experienced sudden pitch changes, and a cabin crew member in the rear of the aircraft suffered a fractured leg.
As this summary indicates, overspeed is a risk during high-speed descent, particularly if the aircraft encounters a sudden change in wind. Pilots have responded to overspeeds by making large pull-back control forces. As highlighted in this accident and the summarised previous occurrences, the application of large control forces to correct or prevent overspeed can cause significant injuries in the cabin.
Previous VA overspeeds and autopilot disconnects
The ATSB reviewed data from other overspeed events involving VA 737s in the years prior to the occurrence. VA provided summary details of flight data from all VA 737 flights from 2014-2017, where airspeed exceeded VMO. This showed numerous overspeed exceedances, none of which involved a maximum airspeed above 359 kt, so none required a maintenance inspection.
VA also extracted data to describe 737 flights from the same period where the airspeed from top of descent to FL 50 was between 319 kt and 339 kt, to understand the actions of pilots attempting to control speed close to VMO In its internal investigation report, VA observed that ‘the data demonstrates in the last three years B737 pilots have entered CWS Pitch or manual control in an attempt to avoid a VMO/MMO exceedance or to rapidly decelerate below it.’ The data did not indicate the portion of these events where the autopilot was disengaged using the dedicated controls compared to flight control pull-through.
During a high-speed descent, the airspeed of VH-VUE increased unexpectedly and briefly exceeded the VMO limit of 340 kt. This was contrary to the operating procedures provided by the manufacturer and the operator, and contrary to the intentions of the flight crew. The captain responded to the sudden increase in airspeed by pulling back on the control column causing the autopilot to disconnect. This caused pitch changes that resulted in large changes to vertical acceleration and injuries to cabin crew at the rear of the aircraft.
The recorded data showed the development of the pitch changes was sudden, and that the onset coincided with the autopilot disconnect. The pitch changes dissipated after the large control inputs had ceased. From this, the ATSB determined that it was highly unlikely that atmospheric turbulence caused the pitch changes.
Although VMO was exceeded, it was not by an amount that required any structural inspections to ensure the ongoing airworthiness of the aircraft, according to 737 maintenance manual. The captain’s intervention probably reduced the magnitude of the eventual overspeed, and it is unknown to what extent the aircraft would have exceeded VMO had the captain not intervened. However, the recorded data indicated that the autopilot was responding to the speed increase by raising the pitch of the aircraft. Furthermore, the pilots could have used the autopilot disengage controls rather than applying breakout force and could have reduced the aircraft speed using the speed brakes.
Therefore, the safety hazards involved in this accident were primarily associated with how the captain acted to prevent overspeed, and the consequent effects of vertical acceleration on the aircraft and its occupants.
Development of the overspeed
The flight crew accepted an instruction from air traffic control to perform a high-speed descent. Accepting a high-speed descent instruction was not unusual, and the ATSB did not find that the issuance or acceptance of a high-speed descent were factors that increased risk. However, targeting a higher descent speed reduces the margin between the target airspeed and airspeed limitations, and the risk of injury due to sudden control inputs will increase due to higher speed and increased kinetic energy.
The flight crew managed the descent using level change autopilot mode, with intermittent use of the vertical speed command mode. This was generally consistent with procedures and airspeed was generally stable at 320 kt during the early descent.
However, about 30 seconds after the turn towards COMLY, when VUE was descending through around 17,000 ft, a sudden decrease in tailwind associated with a windshear encounter led to a rapid increase in airspeed.
After observing the speed increase and trend towards the maximum operating speed (VMO), the first officer (FO) changed the autopilot mode from level change to vertical speed. This is commonly used by flight crew to reduce the airspeed because, in a descent, reducing the vertical speed raises the nose of the aircraft, which consequently also reduces the aircraft’s airspeed. This was also consistent with the procedures in the Flight Crew Training Manual, and bulletins produced by the operator.
However, vertical speed mode does not directly control the aircraft’s speed, and if a windshear results in a large and rapid airspeed change, it may not provide sufficient speed control. Use of control modes that directly control the airspeed, such as the level change mode, allow the aircraft to respond directly to the airspeed changes. This is why the automatic speed protection will change from vertical speed to level change mode. Noting, however, that for very rapid wind changes, as was seen on this occasion, even the automatic flight director system (AFDS) may not be able to prevent an overspeed.
A few seconds later, the captain, who was pilot monitoring (PM) responded to the increasing airspeed by pulling back on the control column, which resulted in the autopilot disconnecting. Two seconds after the autopilot disconnect, the VMO was exceeded by one knot.
Neither crew member applied the speed brakes to prevent the speed increase, nor during recovery from the overspeed. Although they need to be applied with care at high speed, the use of speed brakes would have reduced the likelihood of an overspeed without generating large flight loads and pitching motions.
Intervention to correct speed increase
The captain responded to the unexpected speed increase by pulling back firmly and abruptly on the control column to raise the pitch attitude of the aircraft’s nose. The captain took manual control of the aircraft without notifying the FO (who was pilot flying). This was not consistent with the normal process for handover and takeover. In situations where the pilot monitoring (not flying) perceives immediate action is required to avoid a hazardous situation, there will be a tendency for the transfer of control to happen more rapidly. However, it is still important for flight crew to formally identify who has control, to maintain clarity of the pilots’ roles.
Perceived urgency and lack of autopilot control
The large pull-back control input caused an autopilot disconnect and sudden changes in pitch attitude, resulting in injuries to the cabin crew.
The initial forceful pull back on the control column was in response to what the captain perceived to be a situation involving a nose-down attitude and an unexpectedly high airspeed indication. The sudden pull-back movement was a reflexive application of well-rehearsed basic flying principles, being consistent with an attempt to raise the nose of the aircraft, rather than an explicit attempt to disconnect the autopilot.
The captain indicated at interview that their pull on the control column was more forceful than planned. Consistent with this, the 49 lb backwards force applied by the captain is a large amount of force for a pitch up manoeuvre during high-speed flight and was not consistent with procedures that cautioned against making large control inputs during high-speed, high-altitude flight.
The ATSB considered the reasons for the captain’s large control input and the absent transfer of control. When the captain saw the airspeed increasing unexpectedly and approaching VMO, the captain perceived that the autopilot was not controlling the aircraft, and that an urgent intervention was necessary. The captain related this response to a reflex, impulsive response, with the implication being the action was rapid and without conscious deliberation.
It is likely that the captain’s perception of urgency affected how the captain responded to the sudden speed increase, and contributed to the captain responding rapidly, with a low level of conscious analysis. Research shows that when individuals perceive they need to respond rapidly to a situation, they tend to consider fewer options and less information (Dismukes, Goldsmith, & Kochan, 2015) and typically use rapid, associative and unconscious information processing, which is primarily influenced by pre-existing knowledge and beliefs (Klein, 2008). Research summarised by Means, Salas, Crandall and Jacobs (1993) suggests that in real-world settings, there is a speed/accuracy trade-off between rapid intuitive decisions and more time-consuming analytical decision making.
Other research describes how individuals interact with control systems changes depending on the perceived time available. According to Hollnagel (1998), where the individual perceives there is a large amount of time, he or she is able to look ahead and think about higher level goals. The individual can sample a large amount of information, and feed-forward to test the effect of actions. However, when the individual perceives he or she has little or no time, the most obvious feature of the environment and the immediate needs of the situation will dominate the choice of action. There is no planning or analysis; the individual is essentially seeing and responding.
It was evident that the captain of VUE perceived there was no time to evaluate the sudden airspeed increase and needed to respond urgently because of a perception that the autopilot was not controlling the aircraft. While an overspeed event may not be desirable, this perception to respond urgently was inconsistent with the documentation provided by the manufacturer and the operator about the aircraft safety around VMO. Overall, the documentation implied that minor exceedances of VMO were not hazardous to the safety of the aircraft.
Concerns and beliefs about overspeed
The captain was highly concerned about overspeed, and this probably contributed to the captain’s assessment that the increase in airspeed towards VMO meant the aircraft was not in a controlled state, and that urgent action was necessary. The captain was mindful of avoiding overspeed during the descent and made several comments to the FO along the lines of ‘don’t overspeed’.
The captain’s concerns about avoiding overspeed were influenced by a perception that Virgin Australia (VA) were also concerned about overspeed and wanted to reduce overspeed events. The captain reported hearing rumours that other VA crews had been subject to some form of management review after experiencing overspeeds. Although VA had changed their management of overspeed events prior to the occurrence, it is unknown how flight crew understood these changes. In this event, it is possible that the captain’s concerns about overspeed were a carry-over from the operator’s previous management of overspeed events.
The captain’s concern about the increase in airspeed towards VMO was also influenced by perceptions and beliefs about the airspeed limits of the aircraft. The captain indicated not being aware that there was a margin between VMO and the requirement for a maintenance inspection at 359 kt, or that there was a margin between VMO and the structural limitations of the aircraft.
Influence of the speed trend vector
The speed trend vector is located on the same instrument display as the airspeed indicator. In this case, the FO reported observing the trend indicator moving towards the maximum operating speed (VMO). However, the trend indicator is not a recorded parameter in the flight data recorder, so the ATSB was unable to determine what the speed trend vector showed during the development of the overspeed. The captain reported not specifically looking at the speed trend vector prior to making the abrupt control input. While it is possible the captain’s perception of urgency was influenced by a high airspeed trend projection while observing the airspeed indicator, there was no direct evidence of this effect.
A previous ATSB investigation (AO-2014-032) found that in that instance, the speed trend vector probably indicated a projected speed well above VMO. The investigation found that the captain responded to the high trend airspeed indication by perceiving a need to intervene immediately and made pitch control inputs without following the normal take-over procedure.
Flight crew risk planning and descent preparation
As highlighted in this occurrence, pilots’ management of unexpected events or hazards during descent can be fraught with risk. The descent phase of flight is complex, and there are multiple considerations for the flight crew to manage. Pilots’ ability to manage threats is complicated by perceptions of urgency or threat to the aircraft. In these circumstances, pilots are more likely to use rapid, associative modes of response, rather than planned and analytical behaviours.
Explicit consideration and management of threats is likely to mitigate the known limitations of decision making in real-world settings. The value of formal threat review procedures, in which threats and their responses are deliberately considered ahead of encountering them, is that this removes the requirement to think and act in a time-pressured, tightly coupled setting. By considering potential threats at an earlier stage in flight, threat reviews also allow flight crews to make tactical adjustments, and to observe the effects. When pilots identify potential actions prior to being in a perceived emergency, they can also think through the implications of those actions as a crew. The FAA Aeronautical Decision Making (ADM) educational material provides further support for how threat identification and planning can help address some of these biases and tendencies in decision making.
In this occurrence, the flight crew did not effectively prepare for the risk of overspeed in the arrival briefing. Although the pilots identified overspeed was a potential risk during the high-speed descent, they did not discuss what the implications of an overspeed would be, or what actions they would take if speed started to increase unexpectedly. The crew did not elaborate about the risk of overspeed, apart from the captain saying ‘don’t exceed anything’. This was contrary to the intentions of the procedures, which indicated flight crews were to discuss threats and their management at the top of descent.
Other than the formal procedural control of the threat and error management review, there were other opportunities for the crew to think about the management of a potential overspeed at an earlier stage of the flight. The crew were evidently aware of the risk of overspeed throughout the descent, with the captain saying to the FO ‘don’t overspeed’ on several occasions, and the FO remarking that the autopilot was not very effective at holding the speed steady. Although the FO expressed a plan to reduce the target speed during the descent, there was no discussion of what the crew would do if that did not have the desired effect, or if the airspeed exceeded VMO.
Overall, this was a lost opportunity for the flight crew to effectively manage the risk of overspeed. The pilots were in a position where they had time and space to think about a potential overspeed as a crew. At the top of descent, the pilots could consider the tolerances of the aircraft to airspeed exceedances, and how they could respond safely given the high-energy state of the aircraft.
However, as the aircraft continued the descent and operated close to VMO, the time available to the flight crew reduced. When the captain saw the airspeed suddenly increase, the captain perceived the crew were in a position where there was no time to discuss the situation with the FO, to think about the implications of the overspeed, or to consider the consequences of the pull-back control action. In this way, the absence of planning at an earlier stage in the descent affected how the captain managed the risk of overspeed during the occurrence and increased the risk of unsafe intervention.
Unsecured cabin crew
Seatbelts are a very effective defence against injuries during events where cabin occupants are affected by upset forces. Analysis by the FAA shows that from 1980-2003, there were only four cases of serious injuries on United States carriers during turbulence accidents where the injured person was seated with seatbelts fastened.[12] Conversely, the FAA says that around 58 people are injured each year by turbulence while not wearing seatbelts. Consequently, procedures that require the use of seatbelts, and other methods to secure cabin occupants, are the primary means of preventing injuries during these types of events. The cabin crew were not secured prior to the sudden change in pitch attitude, which increased the likelihood of injuries.
There is a regulatory requirement for cabin crew and passengers to be seated with seatbelts fastened in turbulent conditions,[13] and procedures required the pilots to brief the cabin crew about expected turbulence during both the pre-flight and top of descent briefings. However, neither of the briefings included the forecast clear air turbulence.
Cabin crew briefings are important defences for the safe preparation of the cabin, to mitigate the risk of injury. The cabin crew do not have access to meteorological information or other indications about what is likely to happen in the descent, and therefore their ability to adequately prepare for turbulence is dependent on the information provided by the pilots. When cabin crew are adequately briefed, they can modify their duties and take other steps, such as ensuring they are seated as early as possible. Because the cabin crew were not aware of the forecast clear air turbulence, they had no ability to modify their procedures.
The ATSB considered the influence of the briefings on the injuries sustained by the cabin crew. Although the flight crew reported that they were aware of forecast moderate clear air turbulence during the descent, they perceived the conditions as smooth, and noted that there had been no returns on the aircraft weather radar. Based on the information available to him, the captain did not perceive that a turbulence encounter was likely. The injury to the cabin crew was not caused by a clear air turbulence encounter. Therefore, although the absence of briefing information about the forecast clear air turbulence was not helpful for the ability of the cabin crew to prepare for descent, this did not contribute to the injuries sustained in the accident.
During this occurrence, the ‘cabin crew prepare for landing’ announcement was made about 7 minutes before the sudden changes in pitch attitude, and the fasten seat belt signs had not been turned on. This meant that, based on normal procedures, there was no requirement or expectation from the cabin crew that they should be seated.
Delayed removal of injured cabin crew from aircraft
Defences that assist in the recovery from incidents and accidents form part of the overall safety systems for planned operations into aerodromes. For accidents involving injuries to aircraft occupants, an effective safety system should include the ability to extract casualties from aircraft. Although the use of the slide sheet was not typical, there was no evidence of any safety issues posed by this method. However, the ATSB did consider that the time taken to extract the cabin crew as indicative of a delayed response to the accident. After the arrival of VUE at Adelaide, it took over 90 minutes for the injured cabin crew to be removed from the aircraft and taken to hospital.
The communication between the crew, VA, Airport Rescue and Firefighting (ARFF) and SA Ambulance Service (SAAS) was generally effective and emergency services were notified promptly after the accident. The SAAS crew did not utilise the emergency gate to access the aircraft, because they were directed to the main terminal by ARFF. While the ARFF were at the gate when VUE arrived, the SAAS arrived shortly after. However, there was no evidence that the non-use of the emergency gate affected the timing of the response. As such, the delays associated with removing the injured cabin crew member from the aircraft were related to the on-board co-ordination of the extraction.
The main factor that complicated the extraction of the injured cabin crew was the decision by the VA ground operations supervisor to deny the request to use the catering truck. The ARFF utilise the available resources dependent on the needs of a situation, and the attending firefighters had experience using catering truck vehicles in situations like the occurrence. The ARFF had a reasonable expectation that a catering truck would be made available to them upon request.
The ground operations supervisor performs a defined role within the overall context of the normal airline operations, and the ground operations supervisor’s decision making authority is typically constrained to this role. It is not typical for the ground operations supervisor to make decisions or accept perceived risks relating to departures from procedures. In this context, it is understandable that the ground operations supervisor would be hesitant to grant permission to use equipment owned and operated by another company, which they had no experience using, and which they perceived involved a risk of injury.
On this occasion, the decision making about utilising the catering truck could have been supported by guidance from more senior personnel within VA operations, such as the flight crew. However, the flight crew did not enter the cabin after the aircraft landed, and the ground operations supervisor did not perceive there to be a need to seek their advice, as the ground operations supervisor considered the cabin crew’s condition was being managed by the ambulance officers.
Additionally, within the context of an emergency response, control agencies have a responsibility to exercise authority to task and direct individuals. There must be absolute clarity over who has control of an incident response, and the requirement of other personnel to follow directions. The Adelaide Airport Aerodrome Emergency Plan identified the SAAS as the control authority for a medical emergency. However, ambulance personnel are not likely to have extensive experience in working in and around aircraft, or to be familiar with the aerodrome emergency plans. Ambulance personnel will probably rely on the advice of ARFF and other aviation personnel to identify suitable and available equipment.
The ATSB considers that the overall response by attending personnel, including the response to the request for use of the catering truck, was indicative of a lack of clarity of control responsibility. Agencies involved in the aerodrome safety system at Adelaide Airport may consider additional methods to ensure a shared understanding of the structure of control and authority in medical emergencies.
With the ARFF and ambulance personnel on site, it is likely that the extraction of the injured cabin crew could have been escalated if there was a critical need. While the delayed extraction did not increase safety risk in this instance, the ATSB considers there are opportunities to improve how airside personnel work with emergency services.
From the evidence available, the following findings are made with respect to the overspeed and cabin crew injury involving Boeing 737, VH-VUE, 42 NM east-south-east of Adelaide Airport, South Australia, on 13 September 2017. These findings should not be read as apportioning blame or liability to any particular organisation or individual.
Contributing factors
During a high-speed descent, a sudden decrease in tailwind associated with windshear caused airspeed to approach and exceed the aircraft maximum operating speed (VMO). The flight crew did not apply speed brakes to arrest the speed increase.
In response to the airspeed rapidly increasing towards VMO, the captain (pilot monitoring) perceived a need to immediately intervene and made pitch control inputs without following the normal take-over procedure and alerting the first officer (pilot flying).
The magnitude of the captain's control input was probably greater than intended. This was influenced by a perception that the autopilot was not controlling the aircraft, so an urgent intervention was required. The magnitude of the control input caused sudden pitch changes, resulting in the injuries to the cabin crew.
Although the flight crew identified the risk of overspeed during the high-speed descent into Adelaide, they did not consider steps for mitigating that risk, or how they would manage an overspeed during the descent. This reduced the likelihood of the crew effectively responding to the unexpected increase in airspeed.
Other findings
Although the weather forecast included moderate clear air turbulence and the aircraft was making a high-speed descent, the pilots perceived that flying conditions were smooth and elected not to activate the fasten seat belt sign. The cabin crew briefings did not mention the forecast clear air turbulence. The cabin crew were not secured prior to the sudden pitch changes, which increased the likelihood of injuries.
The ground handling supervisor assessed there was a significant fall from height risk associated with the unsecured use of the catering truck. For that reason, the ground handling supervisor did not agree to the emergency services request to use that equipment to remove the injured cabin crew.
Safety issues and actions
Additional safety actions
Whether or not the ATSB identifies safety issues in the course of an investigation, relevant organisations may proactively initiate safety action in order to reduce their safety risk. The ATSB has been advised of the following proactive safety action in response to this occurrence.
The captain and the first officer (FO) of VH-VUE both underwent training and assessment after the accident. This included a review of the flight data from the accident flight, the autopilot management and other recovery techniques during that flight, as well as the correct recovery actions from an overspeed. Both pilots were assessed as having demonstrated a competent standard during these reviews.
Virgin Australia (VA) have provided pilots with additional training and information about overspeed, overspeed prevention and overspeed recovery:
In 2018, VA pilots were shown animations demonstrating mishandled and correct overspeed recoveries. VA will also include the accident occurrence as part of future non-technical skills training for pilots and cabin crew.
The Flight Crew Information Manual was updated to include a section on ‘Managing VMO/MMO Exceedances’. This section stated that aircraft have been tested beyond VMO/MMO, and that these speeds include a margin below the speeds that require maintenance action or threaten the structure of the aircraft. The manual also stated that it is acceptable to refuse an ATC instruction to perform a high-speed descent. The manual identified that disengaging the autopilot to respond to an overspeed may result in abrupt pitch change.
A Flight Crew Information Bulleting (FCIB) was sent to VA 737 pilots identifying that there had been many instances where pilots had manually intervened to respond to an overspeed or possible overspeed, and that several of these events had resulted in serious injuries. The FCIB provided information to pilots including that VMO/MMO are not never exceed speeds, and that it is acceptable to refuse an instruction to conduct a high-speed descent. The FCIB emphasised that it is preferable to accept a temporary overspeed than to make large abrupt control inputs.
An email was sent to all VA 737 flight crew, reiterating much of the information covered in the other material. This email also identified the actions pilots should apply if they allowed the autopilot to recover the overspeed, but perceived speed continue to increase or that the autopilot was not handing the situation. These procedures were to hold the control wheel and ensure there is no back pressure being applied to the controls, disengage the autopilot, then slowly raise the nose of the aircraft.
Virgin Australia have updated materials provided to ground handling staff and other personnel working airside. The updated procedures say that in situations where emergency services are in attendance, VA team members should follow reasonable directions from those agencies. Where VA team members are in doubt, the updated procedures say they should liaise with the captain, on-board cabin crew leader or airport manager, as applicable.
To respond to the perceptions within the pilot group and to further educate flight crew about management of flight safety events and the how the flight data analysis program (FDAP) worked, VA pilots undertook non-technical skills training on the FDAP during 2018/19, and senior members of the VA flight operations and safety team conducted roadshows on the management of safety events during the same period.
Sources and submissions
Sources of information
The sources of information during the investigation included:
Interviews with personnel including the flight crew and members of the cabin crew
Recorded information from on-board recorders
Meteorological information from the day of the accident
Records from emergency services operators
Manuals and other documentation related to flight crew, cabin crew and ground crew procedures
Expert analysis provided by the aircraft manufacturer.
Dismukes, R. K., Goldsmith, T. E., & Kochan, J. A. (2015). Effects of Acute Stress on Aircrew Performance: Literature Review and Analysis of Operational Aspects. Moffett Field, CA: National Aeronautics and Space Administration.
Hollnagel, E. (1998). Context, cognition, and control. In Y. Waern, Co-operation in process management - Cognition and information technology. London: Taylor and Francis.
Klein, G. (2008). Naturalistic decision making. Human Factors, 50(3), 456-460.
Means, B., Salas, E., Crandall, B., & Jacobs, T. O. (1993). Training decision makers for the real world. In G. Klein, J. Orasanu, R. Calderwood, & C. E. Zsambok, Decision making in action: Models and methods (pp. 305-326). Norwood, NJ: Ablex.
Reason, J. (1990). Human Error. Cambridge: Cambridge University Press.
Submissions
Under Part 4, Division 2 (Investigation Reports), Section 26 of the Transport Safety Investigation Act 2003 (the Act), the Australian Transport Safety Bureau (ATSB) may provide a draft report, on a confidential basis, to any person whom the ATSB considers appropriate. Section 26 (1) (a) of the Act allows a person receiving a draft report to make submissions to the ATSB about the draft report.
A draft of this report was provided to Virgin Australia, Boeing, Airservices Australia, Adelaide Airport, SA Ambulance Service, the Civil Aviation Safety Authority, the captain, the first officer, the cabin crew on board VH-VUE, and the Virgin Australia ground supervisor.
Submissions were received from Virgin Australia, Boeing, the cabin supervisor and the cabin crewmember who sustained the broken leg. The submissions were reviewed and, where considered appropriate, the text of the report was amended accordingly.
Appendices
Appendix A – DRINA NINE ALPHA STAR
Figure A: DRINA NINE ALPHA STAR
Source: Airservices Australia
Appendix B – Flight data recorder data
Figure 11: Selected parameters during descent
Source: ATSB
Appendix C – Significant weather chart
Figure C: Significant weather chart for Australia, FL 100-250. This chart was valid 0600 UTC and used for operations three hours either side of that time. The red line shows the flight planned route of VH-VUE. A body of clear air turbulence is indicated by the long-dash line, and affects the planned route, to the west of the 140° meridian of longitude.
Source: Virgin Australia, originally produced by Bureau of Meteorology
Purpose of safety investigations & publishing information
Purpose of safety investigations
The objective of a safety investigation is to enhance transport safety. This is done through:
identifying safety issues and facilitating safety action to address those issues
providing information about occurrences and their associated safety factors to facilitate learning within the transport industry.
It is not a function of the ATSB to apportion blame or provide a means for determining liability. At the same time, an investigation report must include factual material of sufficient weight to support the analysis and findings. At all times the ATSB endeavours to balance the use of material that could imply adverse comment with the need to properly explain what happened, and why, in a fair and unbiased manner. The ATSB does not investigate for the purpose of taking administrative, regulatory or criminal action.
Terminology
An explanation of terminology used in ATSB investigation reports is available here. This includes terms such as occurrence, contributing factor, other factor that increased risk, and safety issue.
Publishing information
Released in accordance with section 25 of the Transport Safety Investigation Act 2003
Ownership of intellectual property rights in this publication
Unless otherwise noted, copyright (and any other intellectual property rights, if any) in this report publication is owned by the Commonwealth of Australia.
Creative Commons licence
With the exception of the Coat of Arms, ATSB logo, and photos and graphics in which a third party holds copyright, this publication is licensed under a Creative Commons Attribution 3.0 Australia licence.
Creative Commons Attribution 3.0 Australia Licence is a standard form licence agreement that allows you to copy, distribute, transmit and adapt this publication provided that you attribute the work.
The ATSB’s preference is that you attribute this publication (and any material sourced from it) using the following wording: Source: Australian Transport Safety Bureau
Copyright in material obtained from other agencies, private individuals or organisations, belongs to those agencies, individuals or organisations. Where you wish to use their material, you will need to contact them directly.
At about 2155 Eastern Daylight‑saving Time[1] on 13 March 2017, a Qantas Airways (Qantas) Boeing 737-838 aircraft (B737), registered VH-VZZ (VZZ), was about to start its descent in to Canberra Airport, Australian Capital Territory. The aircraft was on a scheduled passenger flight from Perth Airport, Western Australia, and had two flight crew, five cabin crew, and 177 passengers on board. The first officer was the Pilot Flying (PF) and the Captain was performing the role of the Pilot Monitoring (PM).[2]
Air traffic control (ATC) cleared VZZ to descend and advised its flight crew to expect an arrival on runway 17. The controller also requested that the crew maintain maximum speed. In response, a descent speed of 320 kt was selected, 40 kt above the standard descent speed of 280 kt. The aircraft’s maximum allowable operating speed (VMO) was 340 kt.
At about 2200, the flight crew informed ATC that descent from flight level (FL) 310[3] had commenced and reported some light to moderate turbulence (Figure 1). Shortly after, ATC informed the flight crew that there would be a runway change to 35.
Figure 1: Diagram showing actions, conditions, and events during the aircraft’s descent
Source: ATSB
At about 2204, VZZ was descending past FL 280 when the flight crew made an announcement over the aircraft’s public address system advising the cabin crew to prepare for landing. That announcement provided a cue to the cabin crew that they had about 10 minutes to secure all loose items in the cabin before illumination of the ‘fasten seat belt’ sign. By the time the aircraft passed FL 270, it had accelerated to the flight crew selected speed of 320 kt.
At about 2209, the turbulence began to increase. In response, the flight crew switched on the ‘fasten seat belt’ sign and advised the passengers and crew to be seated with seat belts fastened. The operator’s procedures required cabin crew members to be seated within 1 minute of that announcement.
At that time, a cabin crew member was passing row 22 on her way back to the rear of the cabin (Figure 2). The aircraft’s movement due to the turbulence was such that she needed to hold onto the overhead lockers as she walked along the aisle. About 15 seconds later, she reached the rear galley, closed a stowage latch, and secured a rubbish bin in preparation to be seated in the left cabin crew seat.
Figure 2: Boeing 737-800 VH-VZZ aircraft seat map
Source: Qantas (annotated by the ATSB)
When VZZ descended through FL 220 (about 30 seconds after the ‘fasten seat belt’ sign was switched on), the wind direction changed by about 80 degrees, resulting in a head wind increase from 15 kt to 32 kt. That in turn led to the airspeed increasing through 325 kt, and the PF applying control column backpressure to avoid exceeding VMO. About 1 second after the maximum control column force was applied, the autopilot disengaged and the G‑Load[4] peaked at 2.2 g. The pilot monitoring reported that they were checking the instrument approach, as a result of the change to runway 35, when they heard the autopilot disengage tone and saw the speed of the aircraft increasing toward VMO.
The aircraft’s pitch angle changed by 3.87 degrees in 1 second, and its airspeed reached a maximum of 339.5 kt.
The cabin crew member recalled that, while standing in the rear galley and preparing for arrival, she felt the cabin floor drop and then quickly come up. The force due to the aircraft’s movement resulted in the cabin crew member fracturing her leg. The cabin crew member seated in the right rear seat assisted the injured cabin crew member.
The aircraft movement also resulted in a second cabin crew member in the forward galley falling forward and hitting her head on a trolley. She also received injuries to her knees, back and neck.
The flight crew received an interphone call from the cabin reporting the leg fracture injury. The turbulence subsided and the flight crew turned off the ‘fasten seat belt’ sign and first aid was provided to the injured crew members.
At about 2211, the aircraft’s speed decreased and the flight crew re-engaged the autopilot. The flight crew alerted ATC to the turbulence and were informed that no other turbulence had been reported in the area.
Due to her fractured leg, the injured crew member in the rear galley remained lying on the cabin floor for the landing. The aircraft landed at about 2234, and paramedics met the aircraft to attend to the two injured cabin crew members. Both of them were transferred to a hospital for treatment. The cabin crew member injured in the rear galley was admitted to the hospital. The other crew member was treated and discharged without admission. The aircraft was not damaged and none of the other crew or any of the passengers were injured.
Autopilot
The autopilot of VZZ remained engaged until the control column force reached about 25 lbs.
Qantas advised the ATSB that it was common practice for its B737 flight crews to manage an impending overspeed by applying control column force to override the autopilot. The expected outcome of this action was for the autopilot to revert to ‘control wheel steering-pitch’ (CWS-P)[5] mode, and raise the aircraft’s nose. According to VZZ’s first officer, the technique was part of initial B737 type rating training and line training. The captain also confirmed that this technique was commonly practiced.
Following review of the draft investigation report relating to this occurrence, Boeing advised that they were considering a revision to the overspeed guidance in the 737 flight crew training manual. Specifically, they were considering inclusion of the following preferred response to an impending overspeed:
VMO/MMO is the airplane maximum certified operating speed and should not be exceeded intentionally. However, crews can occasionally experience an inadvertent overspeed. Airplanes have been flight tested beyond VMO/MMO to ensure smooth pilot inputs will return the airplane to the normal flight envelope.
Periodic wind speed or direction changes may lead to overspeed events. Although autothrottle logic provides for more aggressive control of speed as the airplane approaches VMO or MMO, there are some conditions that are beyond the capability of the autothrottle system to prevent short term overspeeds. In these cases, leave the autopilot engaged and deploy partial speedbrakes slowly until a noticeable reduction in airspeed is achieved. Retract speedbrakes slowly when below VMO/MMO.
The autopilot of VZZ had been modified to remove the CWS-P reversion (that is, it would instead disengage when 25 lbs of control column force was applied). Boeing advised that the modification was introduced due to concern ‘…that flight crews may not recognise or correctly interpret the autoflight system automatic transition to the Control Wheel Steering mode…’.
A consequence of the modification was that the autopilot disengagement produced a sharper elevator response than reversion to CWS‑P, as that mode provided a smoothed resistance as a function of the pitch rate. That is, for the same control force input, the elevator deflection and pitch change were significantly larger when the autopilot disconnected compared to reversion to CWS‑P.
Recorded data
Examination of the relevant flight data showed that:
Minor turbulence occurred from 2208:30 to 2209:00 while the rate of descent was steady and the aircraft’s speed was about 320 kt. There were slight variations in the headwind and airspeed in this period.
At 2209:00, ‘level change mode’[6] was engaged and, over the next 20 seconds, the rate of descent increased and peaked at 4,725 ft/min.
Between 2209:30 to 2209:44, the wind direction changed about 80 degrees and the headwind increased from 15 kt to 32 kt.
At 2209:36, as the airspeed began increasing above 325 kt, the control column was pulled back and the autopilot disengaged at 2209:40. About 1 second after maximum control column force, the G-load peaked at 2.2 g and the aircraft pitch angle changed from -1.58° to 2.29°. The aircraft reached a maximum speed of 339.5 kt, 0.5 kt below VMO.
On the 9 May 2015, a Boeing B737-8FE aircraft was making a high-speed descent (320 kt) into Adelaide, South Australia. The crew responded to indications the aircraft was approaching the maximum allowable airspeed by extending the speed brakes. However, the airspeed continued to increase. The autopilot was then overridden by pulling back the control column (the force required was greater than the pilot expected) until the autopilot entered the CWS-P mode. Immediately afterwards, the control column was abruptly released. The subsequent motion of the aircraft resulted in a cabin crew member suffering a minor injury.
Safety analysis
The Qantas internal investigation of this occurrence found that in the past 6 years there had been 47 previous overspeed occurrences involving its Boeing 737-800 aircraft, of which 20 had been managed via manual intervention (that is, overriding the autopilot into CWS-P). The internal investigation also found that it was common practice among its Boeing B737-800 flight crews to descend at 320 kt (20 kt below the VMO) when cleared by ATC to conduct a high-speed descent.
The common practice of flight crews to prevent an overspeed was not a documented Qantas or Boeing procedure. As a result, the potential consequence of this practice was not considered when the autopilot was modified.
Qantas also advised that the flight crew of VZZ had no information that indicated that there would be a risk of turbulence. The wind information provided in the flight plan did not show there would be a significant change in the wind direction during descent. As such, descending at 320 kt was not considered to present an increased risk.
The first officer of VZZ responded to the increase in speed towards the aircraft’s VMO consistent with his training, experience, and observations of other crew members. As VZZ had a modified autopilot, it was not possible to override it into CWS-P. Consequently, when sufficient force was applied to the control column, the autopilot disengaged. That resulted in abrupt elevator deflection and pitch change, which in turn led to the cabin crew injuries.
Findings
These findings should not be read as apportioning blame or liability to any particular organisation or individual.
The increase in headwind while VH-VZZ was making a routine high speed descent at 320 kt resulted in the airspeed increasing towards the aircraft’s maximum allowable speed.
The pilot flying applied a control column input to prevent an overspeed, which resulted in the autopilot unexpectedly disengaging. The consequent change of pitch and g-loading led to two cabin crew suffering injuries.
The aircraft’s autopilot had been modified such that, if sufficient control column back pressure was applied, the autopilot would disengage rather than revert to the Control Wheel Steering (CWS) mode. Autopilot disengagement resulted in larger elevator and pitch responses than those associated with reversion to CWS mode.
Safety action
Whether or not the ATSB identifies safety issues in the course of an investigation, relevant organisations may proactively initiate safety action in order to reduce their safety risk. The ATSB has been advised of the following proactive safety action in response to this occurrence.
Aircraft operator
Qantas advised the ATSB that it has taken the following safety action.
Safety information notice
A safety information notice titled Pilot responses during high and low airspeed events has been provided to the flight crew. The notice advised flight crew that:
during an impending or actual overspeed event, it is preferable to keep the autopilot engaged
there is a reasonable buffer on VMO before any significant maintenance actions are required. Disengaging (and/or overriding) the autopilot to avoid an overspeed may result in an abrupt pitch change that could lead to more adverse consequences than the overspeed itself.
Safety message
Although there was no expectation of varying wind conditions during the descent on this occasion, this occurrence highlights the increased risk of overspeed when operating with a reduced margin below VMO.
The intervention by the pilot flying to prevent the impending overspeed was understandable, and consistent with previous responses of other flight crew in similar situations. However, as detailed in the Qantas safety information notice, when faced with an impending overspeed, abrupt pitch changes may have more adverse consequences than an overspeed event. The manufacturer’s preferred use of speedbrakes to manage increasing airspeed, removes the hazard associated with abrupt pitch changes.
Purpose of safety investigations
The objective of a safety investigation is to enhance transport safety. This is done through:
identifying safety issues and facilitating safety action to address those issues
providing information about occurrences and their associated safety factors to facilitate learning within the transport industry.
It is not a function of the ATSB to apportion blame or provide a means for determining liability. At the same time, an investigation report must include factual material of sufficient weight to support the analysis and findings. At all times the ATSB endeavours to balance the use of material that could imply adverse comment with the need to properly explain what happened, and why, in a fair and unbiased manner. The ATSB does not investigate for the purpose of taking administrative, regulatory or criminal action.
Terminology
An explanation of terminology used in ATSB investigation reports is available here. This includes terms such as occurrence, contributing factor, other factor that increased risk, and safety issue.
Publishing information
Released in accordance with section 25 of the Transport Safety Investigation Act 2003
Ownership of intellectual property rights in this publication
Unless otherwise noted, copyright (and any other intellectual property rights, if any) in this report publication is owned by the Commonwealth of Australia.
Creative Commons licence
With the exception of the Coat of Arms, ATSB logo, and photos and graphics in which a third party holds copyright, this publication is licensed under a Creative Commons Attribution 3.0 Australia licence.
Creative Commons Attribution 3.0 Australia Licence is a standard form licence agreement that allows you to copy, distribute, transmit and adapt this publication provided that you attribute the work.
The ATSB’s preference is that you attribute this publication (and any material sourced from it) using the following wording: Source: Australian Transport Safety Bureau
Copyright in material obtained from other agencies, private individuals or organisations, belongs to those agencies, individuals or organisations. Where you wish to use their material, you will need to contact them directly.
On 29 October 2015, a pilot who held a restricted pilot licence, and a flight instructor, prepared for a training flight at Camden Airport, New South Wales. The plan was to conduct circuits at Camden, in a Liberty XL-2 aircraft, registered VH-CZS (CZS). The pilot conducted a pre-flight inspection of the aircraft, with no defects found.
At about 1140 Eastern Daylight-saving Time (EDT), after the pilot had completed the normal pre-flight checks, and received the required air traffic control clearances, the aircraft took off for the first circuit. The pilot completed two normal circuits with touch-and-go landings on runway 06, and climbed out on runway heading for the third circuit.
During the initial climb, the pilot felt backward pressure on the control stick, and selected the electric pitch trim to a slightly nose down position. The aircraft was then in a stable climb, at an airspeed of 75 to 80 kt. As the aircraft passed about 500 ft above mean sea level (AMSL), the pilot retracted the flaps.
Passing about 700 ft, the pilot commenced a climbing turn onto the downwind leg. As the pilot rolled the wings level on downwind, the aircraft was still about 100 ft below the circuit altitude of 1,300 ft AMSL. The pilot therefore continued a shallow climb with the wings level, at an airspeed of about 95 kt. Suddenly, the control stick came back towards the pilot, and the aircraft pitched to a nose-up attitude.
The pilot pushed forward on the stick with both hands, to a full forward position. They also asked the instructor to adjust the pitch trim to a more nose-down position, to try to return the aircraft to a level attitude. The pilot stated there was something wrong and handed control of the aircraft to the instructor, who also assessed that there was a control issue. The aircraft descended rapidly in a nose-up attitude, and the aircraft then pitched nose-down.
The aircraft descended to about 700 ft, and the pilot broadcast a Mayday[1] to the Camden tower controller advising them of a control issue. The controller asked whether they could make it back to land on runway 06, and the pilot replied ‘negative’. The pilot and instructor elected to conduct a precautionary landing in a paddock ahead of the aircraft. The instructor sighted powerlines and overflew them before extending full flap and landing in the paddock.
During the landing roll, the aircraft collided with two fences and came to rest in a stand of trees. The pilot and instructor were uninjured, and the aircraft sustained substantial damage (Figure 1).
Engineering inspection
An engineer conducted a post-accident inspection of the aircraft, and did not find any obvious defect that may have contributed to the control issue.
Figure 1: Accident site
Source: Insurance assessor
Pilot comments
The pilot and instructor provided the following comments:
Once they had moved the trim to the full nose-down position, the instructor elected to leave it there and not try to move it, in case it made controlling the aircraft more difficult.
The pilot initially assessed there was a problem with the stabilator, as it felt as if something had jammed in it.
They assessed that it was preferable to land with a slight tailwind in the paddock, than to attempt to turn the aircraft and land into wind.
At the commencement of the flight, the aircraft was about 20 kg below the maximum take-off weight and within the normal centre of gravity range.
The aircraft flight manual included a checklist for partial control failure or malfunction, but they did not have sufficient time to access the manual during the incident. The checklist advised the pilot to check the trim setting and the circuit breakers, to control the aircraft with power and whichever controls were operational, and to land as soon as possible. The instructor also stated that they did not have time to check the circuit breakers, which were on the right side of the instrument panel.
The instructor reported that as well as the pitch, or elevator, control issue, the aileron, or roll control felt overly sensitive. When the instructor applied light pressure to roll the aircraft to the left, it was overly responsive. This influenced the decision to land in the paddock ahead, rather than attempt to turn the aircraft into wind or to return to land on the runway.
Operator comments
The operator assessed that the way the pilots used the trim may have led to the control difficulties.
Safety message
The pilot and instructor both commented that their communication during the incident was very good, and that played a key role in getting the aircraft safely to the ground. Faced with an abnormal situation, the pilots communicated effectively, and collaborated to share the workload.
The objective of a safety investigation is to enhance transport safety. This is done through:
identifying safety issues and facilitating safety action to address those issues
providing information about occurrences and their associated safety factors to facilitate learning within the transport industry.
It is not a function of the ATSB to apportion blame or provide a means for determining liability. At the same time, an investigation report must include factual material of sufficient weight to support the analysis and findings. At all times the ATSB endeavours to balance the use of material that could imply adverse comment with the need to properly explain what happened, and why, in a fair and unbiased manner. The ATSB does not investigate for the purpose of taking administrative, regulatory or criminal action.
Terminology
An explanation of terminology used in ATSB investigation reports is available here. This includes terms such as occurrence, contributing factor, other factor that increased risk, and safety issue.
Publishing information
Released in accordance with section 25 of the Transport Safety Investigation Act 2003
Ownership of intellectual property rights in this publication
Unless otherwise noted, copyright (and any other intellectual property rights, if any) in this report publication is owned by the Commonwealth of Australia.
Creative Commons licence
With the exception of the Coat of Arms, ATSB logo, and photos and graphics in which a third party holds copyright, this publication is licensed under a Creative Commons Attribution 3.0 Australia licence.
Creative Commons Attribution 3.0 Australia Licence is a standard form licence agreement that allows you to copy, distribute, transmit and adapt this publication provided that you attribute the work.
The ATSB’s preference is that you attribute this publication (and any material sourced from it) using the following wording: Source: Australian Transport Safety Bureau
Copyright in material obtained from other agencies, private individuals or organisations, belongs to those agencies, individuals or organisations. Where you wish to use their material, you will need to contact them directly.
On 11 May 2015, a Boeing 737 aircraft, registered VH-VOP and operated by Virgin Australia International, conducted a scheduled passenger service from Sydney, New South Wales to Christchurch, New Zealand.
Shortly after midnight, the aircraft landed on runway 29 at Christchurch. Runway 29 was shorter than the main runway at Christchurch. The aircraft landed within the required touchdown zone, using full reverse thrust, speedbrakes, and the autobrake system engaged the wheel brakes. Recorded flight data showed that the aircraft initially achieved, and at times exceeded the selected AUTOBRAKE 3 target deceleration rate. However, after crossing the runway intersection, the aircraft did not continue to decelerate as expected and the crew believed the aircraft appeared to slide or skid. In response, the crew overrode the autobrakes and applied hard manual braking while retaining full reverse thrust for longer than used in normal operations. The crew also corrected a minor directional deviation. The aircraft came to a stop about 5 m from the runway end. There were nil recorded injuries or aircraft damage.
What the ATSB found
The ATSB found that, due to increased workload, the crew misperceived the runway surface conditions and believed it was damp when in fact it was wet. As there was no regulatory direction on how a damp runway was to be considered for aircraft landing performance purposes, the operator’s policy was to treat a damp runway the same as a dry runway. As a result, the crew established the aircraft’s landing performance based on a dry rather than a wet runway and the expected runway 29 landing performance was not achieved.
The ATSB also found that, several months prior, the operator had changed its policy whereby damp runways had previously been treated as wet runways.
Based on the crew’s observations and a review of the available recorded data, it was very likely that the surface conditions on the later part of the runway had degraded to the extent that they adversely affected the aircraft’s braking capability. It was also possible that the aircraft experienced viscous aquaplaning. However, the initial exceedance of the target deceleration rate, combined with the crew’s actions, likely prevented a runway overrun.
Further, a post-incident analysis of the flight data recorder by the aircraft manufacturer found that a 5 kt tailwind existed on final approach and landing. This also significantly affected the aircraft’s landing performance and further reduced safety margins.
Additionally, and along with the United States Federal Aviation Administration, the ATSB found that the 15 per cent in-flight safety margin applied to actual landing distances during landing performance calculations may be inadequate under certain runway conditions. In these conditions, additional conservatism is encouraged.
Safety message
This incident highlights the adverse consequences of crew experiencing a high workload during critical phases of flight, including missing important information needed to determine an accurate landing performance.
In addition, runway surface condition and braking action reports (intended for the benefit of other pilots landing aircraft after them) can be subjective, and the terminology used to describe these can be inconsistent. Considerable efforts have been made by organisations such as the United States Federal Aviation Administration to address this issue with the introduction of the runway condition assessment matrix.
The occurrence
Sequence of events
On 12 May 2015, shortly after midnight local time, a Boeing 737-800 aircraft, registered VH-VOP (VOP) and operated by Virgin Australia International as Velocity 134, touched down on runway 29 at Christchurch, New Zealand. During the landing roll, the aircraft did not decelerate as expected and the crew believed it appeared to slide or skid. The crew responded to the situation and the aircraft came to a stop about 5 m from the runway end.
Pre-flight preparations
Earlier in the evening of 11 May 2015, the crew arrived at Sydney, New South Wales for the scheduled passenger service to Christchurch. During flight preparations in Sydney, the crew reviewed the notice to airmen (NOTAM)[1] and applicable weather forecasts. The NOTAMs indicated that works in progress would be occurring on the northern end of runway 02 at Christchurch, resulting in a reduced runway length on the main runway. The NOTAM also stated that runway 20 was closed for landing. There was no significant weather forecast for their arrival, but rain was expected later the next morning (after the scheduled arrival time), and at that time, the conditions were favourable to runway 02. The operator’s flight dispatch notes indicated that there were no landing performance weight restrictions for their arrival with the forecast weather conditions.
At 0941 Coordinated Universal Time (UTC),[2] VOP departed Sydney and climbed to flight level (FL)[3] 390. The first officer (FO) was designated as the pilot flying and the captain was the pilot monitoring.[4]
First contact with Christchurch air traffic control
The captain reported that, at about 1135, he contacted air traffic control (ATC) on the Christchurch Information frequency and requested the automatic terminal information service (ATIS)[5] for Christchurch Airport. The crew received the ATIS ‘X-ray’ (X) details, which advised that the runway surface conditions were dry and to expect an approach to runway 02. These details were consistent with the crew’s pre-flight assessment of the forecast conditions. The crew recorded these details on the take-off data card[6] and then prepared for the approach. Due to forecast turbulence over the Southern Alps, the crew had previously briefed the cabin crew on the need to prepare the cabin for the approach earlier than normal.
At around the same time, the crew of an Airbus A320 (A320) aircraft inbound to Christchurch and ahead of VOP, were in contact with Christchurch Area ATC. ATC advised the A320 crew that it was now raining at Christchurch Airport and the runway-in-use was about to change due to a variation in the surface wind conditions.
At 1136, ATIS ‘Yankee’ (Y) was issued, indicating that runway 29 was now in-use and the surface conditions were dry.
The A320 crew continued discussions with ATC regarding the changing weather conditions at Christchurch. The crew determined that, rain on the reported dry runway rendered it wet, therefore, they were unable to land at Christchurch due to performance restrictions and elected to divert to Wellington.
Change in ATIS and approach
At 1146, the crew of VOP established contact with Christchurch Area ATC on a different frequency from the A320 crew. The crew advised ATC that they were at waypoint ‘VANDA’ (Figure 1) maintaining FL 390 and were in receipt of ATIS X. ATC began to clear the crew to descend for the ‘BELEE 1’ arrival but then asked them to standby. Shortly after, ATC advised the crew that ATIS Y was now available with a visual approach to runway 29 and that there were ‘quite a few changes from the previous, you want to have a listen’. About 1 minute later ATC contacted the crew and advised they were cleared to descend to FL 160 for the ‘BELEE 1 Charlie’ standard arrival route for runway 29 (Figure 1). The crew acknowledged the clearance and responded ‘Velocity 160’, inadvertently transposing their cleared flight level for their call sign. ATC then confirmed their call sign as ‘Velocity 134’ and advised that ATIS Y was current with a QNH[7] of ‘993’. The crew acknowledged the QNH and requested the surface wind, which was reported as 250° at 12 kt, maximum 18 kt. The crew recorded these details on the take-off data card.
Having been notified of the change in runway-in-use, the crew commenced their preparations for the revised approach. Also, around this time, the crew noted weather ahead on the aircraft’s weather radar at waypoint ‘BELEE’, requiring a track deviation.
Figure 1: VH-VOP actual flight path (in blue) and BELEE 1 Charlie arrival route (yellow)
Source: Google earth and operator, annotated by the ATSB
The crew reported that, in order to manage an increased workload associated with the revised approach, they divided the duties. The captain focussed on entering the approach into the flight management system and assessed the aircraft’s landing performance to determine the suitability of runway 29 (which was shorter than the expected runway 02). The FO managed the weather deviation and focussed on the implications of landing on a shorter runway. The crew also discussed holding at waypoint ‘CHARR’ if additional time was needed to prepare for the approach. Due to the higher than normal workload, the captain reported that they did not get the opportunity to listen to ATIS Y.[8]
At 1149, the crew commenced their descent. Shortly after, the crew made a public address for the cabin crew to prepare for the approach.
At 1150, ATIS ‘Zulu’ (Z) was issued. At 1151, ATC advised the crew that it had been issued and that the runway was now wet with light rain. The crew acknowledged the call by responding ‘Velocity 134’. The crew did not listen to the ATIS as the details had been passed on by ATC. The details were not recorded on the take-off data card, but the crew specifically recalled being advised of light rain.
At 1152, the crew requested a 10 NM deviation to the right of track due to weather, which was approved by ATC.
At 1154, the A320 crew established communications with the same Christchurch Area ATC as VOP and advised they were diverting to Wellington. Shortly after, the pilot of another aircraft that had departed Christchurch at about 1146, advised the A320 crew that they considered runway 29 to be ‘damp, not wet’. When questioned, the crew of the departing aircraft indicated that they had taken off from runway 29 about 5-10 minutes prior and confirmed that they considered the surface conditions to be damp not wet. ATIS Y was active at the time of that aircraft’s departure and had not yet changed to ATIS Z (which indicated the runway was wet).
At 1155, the crew of VOP requested another deviation 15 NM to the right of track. ATC approved the crew to track as required around weather and then to waypoint ‘BISUP’ once clear. The crew then requested further clearance to track direct to ‘CHARR’ due to weather in the vicinity of BISUP. This was approved by ATC.
The captain, at this time, referenced the Airport Analysis Manual (refer to section titled Airport Analysis Manual (AAM) – Landing performance limit weight) to determine the aircraft’s landing performance limit weight for runway 29 with nil wind and flap 40.[9] Believing that the runway surface conditions had been reported as ‘damp’ by ATC, the captain determined that the dry limit weight would be about 68.2 t, which exceeded the aircraft’s maximum certified landing weight and their expected landing weight of 60.1 t. The crew were aware that if the rain continued and the runway was then wet rather than damp, they would have been about 1 t over the limit weight. From their experience, the crew established that AUTOBRAKE 3[10] was the most appropriate brake selection for landing.
At 1157, the crew of VOP advised ATC that they were clear of weather and were now tracking to CHARR. Prior to reaching CHARR, the FO provided a briefing for the revised approach, which included reviewing the arrival procedure, the runway, the aircraft configuration and performance limitations, and the identification and management of threats.
Monitoring the wind conditions
The crew received further descent instructions and were transferred to the next Christchurch ATC frequency. At 1201, the crew were advised that ATIS ‘Alpha’ (A) was current and the QNH was 992. ATC also advised that the surface wind was easing, indicating 240° at 5 kt and that it had stopped raining at the airport. The crew replied ‘understood’.
During the descent, the captain continued to monitor the wind conditions and assessed that a 5 kt tailwind on the longer runway 02 was more limiting than using the shorter runway 29 with nil wind.
At 1204, the crew requested an update on the surface wind and were advised that it was ‘easing back around to the south’, indicating 220° at 5 kt. Shortly after, ATC advised the crew that the surface wind had remained steady for the last 5 minutes at about 230° at 5 kt. In response, the captain questioned the availability of runway 20, to which ATC advised that it was not available for a few hours due to the works in progress, and their options were either runway 29 or runway 02 with a reduced length.
At 1208, the crew were cleared by ATC for the visual approach to runway 29 and advised that the surface wind was 200° at 3 kt, but it appeared to be changing to light and variable. Shortly after, the crew contacted Christchurch Tower ATC. During the approach, the FO focused on managing the aircraft’s profile and speed to ensure the approach was stable.
At 1211, ATC advised the crew that the surface wind was now calm.[11] Soon after, ATC cleared the crew to land on runway 29. Around this time, the captain reported he now could see the runway surface and assessed the runway as being damp rather than wet, as the surface did not appear reflective.
Landing on runway 29
At 1214, the aircraft touched down on runway 29 within the touchdown zone. Immediately after, full reverse thrust was applied and the speedbrakes deployed.
During the landing roll, as the aircraft passed the runway 02/20 and 11/29 intersection (Figure 7), the FO reported that he did not receive the expected sensation of being restrained against the seat belt and shoulder harness and the aircraft did not decelerate as expected. The FO also indicated that it felt like the aircraft was sliding. In response, the FO made a call to the effect of ‘aquaplaning’ or ‘skidding’ and applied constant ‘hard’ (but not full) manual braking, overriding the autobrake system. The captain noted that there was a lot more surface water on that section of the runway than what was observed at the beginning of runway 29.
The captain assisted the FO with manual braking. Both crew reported that they could feel the rudder/brake pedals ‘pulsing’, which indicated the antiskid system was operating. The crew elected to keep reverse thrust deployed to assist with braking.
The FO reported that he was focusing on the red runway end lights and noticed the aircraft drift slightly right, which he then corrected to bring the aircraft back onto the centreline. The captain reported that, when reverse thrust was stowed near the runway end, there was enough surface water on the runway to create a wall of spray. The FO reported that the aircraft came ‘slowly sliding’ to a stop about 5 m from the runway end lights. The aircraft was then taxied to the terminal.
About 3 minutes after landing, ATIS ‘Bravo’ (B) was issued, where the runway-in-use changed to runway 02 and the reported surface conditions were changed to ‘damp’.
Following engine shutdown, the crew re-checked the landing performance data for a damp (dry) runway. They also considered the amount of water spray observed at the runway end and believed the surface conditions at that time were not damp. Soon after, the captain spoke to a ground engineer who had also observed the significant amount of water spray. The engineer stated that water seemed to pool in that area of the runway when it rained. The captain and FO had not previously been aware of any tendency for water to pool on that runway. The FO conducted a visual inspection of the aircraft’s tyres with an engineer to see if any reverted rubber was present; none was detected. Figure 2 provides a timeline of the key events leading up to the incident.
A cabin crew member recalled that, during the landing, she heard the brakes ‘squealing’, but the aircraft did not slow down. She could also smell burning rubber and was unable to see outside as there was a large amount of water spray.
Post-flight discussion with Christchurch Tower
After disembarkation, the FO visited and spoke to Christchurch Tower staff to discuss the landing. The FO advised the Tower officer that there was a lot of standing water present at the end of runway 29, which probably was not visible from the Tower position. The officer agreed that the water was not visible. The officer also indicated they did observe the aircraft stop at the runway end for some time. The FO stated that they had planned on a damp runway as reported, however, the amount of water spray observed suggested otherwise. The FO further indicated that they noticed the standing water after crossing the runway intersection. The officer replied that another operator would reportedly not use runway 29 after they ran off the end in March 2015.[13]
The FO commented that they mainly used runway 02 and rarely used runway 29. The Tower officer noted that runway 29 was only used when there was a ‘screaming north-wester’ and they believed it was only the second time they had seen it used when wet.
The captain held a valid Air Transport Pilot (Aeroplane) Licence and Class 1 Aviation Medical Certificate. He had a total flying experience of 8,912 hours, of which 4,978 hours were in the Boeing 737 aircraft. The captain had been operating from Christchurch for the previous 7 years.
This was the fifth day of duties on the captain’s roster, which included both domestic and international flights. While the captain reported that the flight conducted the previous day was ‘fatiguing’, he felt well rested and in good health for the incident flight. There was no evidence to indicate a level of fatigue known to affect performance beyond what would reasonably be experienced towards the end of a duty late in the evening.
First officer
The first officer (FO) held a valid Air Transport Pilot (Aeroplane) and Class 1 Aviation Medical Certificate. He had a total flying experience of 8,229 hours, of which 2,786 hours were in the Boeing 737 aircraft. The FO had been operating from Christchurch for the previous 5 years.
This was the FO’s third day on roster and he reported feeling well rested and in good health. Although the FO reported feeling tired after the incident flight, there was no additional evidence to indicate a level of fatigue known to affect performance beyond what would reasonably be experienced towards the end of a duty late in the evening.
Aircraft information
Post-flight inspection
Following the incident, an engineer inspected VH-VOP’s (VOP) tyres and reported nil evidence of abnormal wear or damage indicative of reverted rubber aquaplaning (refer to section titled Aquaplaning). The tyre pressures were also normal and the aircraft’s maintenance logs showed no pre‑existing defects with the brake system. However, the engineer noted that the engines and fuselage were covered in dirty water, consistent with reverse thrust being used at high power settings.
Several days following the incident, the number 3 and 4 tyres were replaced as canvas was showing through the tread face. The exact condition of the tyres prior to the incident flight and whether this contributed to reduced braking effectiveness during landing was unknown. However, it was likely that the aircraft was flown in this period and the tyres inspected during normal daily checks.
Autobrake system
Once selected by the crew, the autobrake system supplies metered brake pressure during the landing roll to maintain a specified deceleration rate until the aircraft comes to a stop. The system has four landing selections (1, 2, 3 and MAX) that correspond to a target deceleration rate. For AUTOBRAKE 3, as selected by the crew of VOP, the target deceleration rate was 7.2 ft/sec/sec (0.224 g). If, during autobrake application, the crew applies a manual input of over 750 psi, the autobrake system will disconnect and disarm.
Antiskid system
During brake application, the antiskid system automatically controls the brake system to prevent the wheels from skidding. The system compares the aircraft’s speed with the rotational speed of each main wheel. If the wheel speed is too slow, the brake on that wheel will momentarily release. This allows the wheel speed to increase and prevents skidding.
Boeing advised that the operation of the antiskid system would not normally be felt by the crew through the brake pedals. However, if many wheels experienced a skid concurrently, for example, if all of the wheels contacted a slippery section on the runway, the crew may feel ‘bumps’ or ‘pulses’ in the pedals. This would occur due to large changes in brake pressure as the antiskid system responds to sudden variations in runway friction.
The United States Federal Aviation Administration (FAA)[14] also stated that the brakes should be applied firmly throughout the deceleration process. Specifically, when maximum braking is required, maintain maximum brake pressure and allow the antiskid system to operate. The antiskid system pulsing is caused by the modulation of the brake pressure and indicates that the system is operating normally, though this may be disconcerting to the pilot.
Main landing gear brake pressure recording switch
A review of the recorded data for the flight (refer to section titled Recorded information - Flight data recorder (FDR) analysis) identified no system failures. However, the brake pressure applied during the landing could not be determined due to an anomaly with a switch that controlled what brake pressures (main or alternate) were recorded on the flight data recorder (FDR). This resulted in the alternate,[15] rather than the main brake pressures being recorded for the incident flight. After being made aware of the anomaly, the operator identified four other aircraft with a similar defect. The defective switch on these aircraft and VOP were replaced.
Meteorological information
Forecast weather at Christchurch
An aerodrome forecast (TAF) for Christchurch was issued at 0629 on 11 May 2015, valid between 0600 on 11 May 2015 and 0600 on 12 May 2015. The TAF predicted light and heavy rain from 2200, after the aircraft’s arrival at Christchurch. This forecast was viewed by the crew prior to departing Sydney. After departing at 0941, a subsequent TAF was issued at 1102, which forecast light rain for the aircraft’s arrival and heavy rain expected later the next day (refer to Appendix A – Christchurch aerodrome forecasts (TAFs) and automatic terminal information service (ATIS)).
Actual weather at Christchurch
Weather radar imagery showed that light to moderate rain passed through the Christchurch area between 1130 and 1207 (Figure 3), prior to the aircraft landing at 1214. MetService reported that a small amount of rain was recorded, but they considered it unlikely that this resulted in standing water on the runway.
Image shows light (yellow) to moderate (blue) rain passing overhead Christchurch Airport between 1130 (left) and 1207 (right); VOP touchdown was at 1214. Source: MetService, annotated by the ATSB
Christchurch Airport had four anemometer (wind) sensors located 1,000 ft from each runway end. MetService provided the ATSB with one-minute interval data recorded by the automatic weather station, which captured temperature and wind data. The temperature at the time of landing was 12 °C. A graphical depiction of the changing wind (° Magnetic)[16] between 1135 and 1220 is shown in Figure 4.
Figure 4: Christchurch Airport one-minute interval wind data between 1135 and 1220
Images shows the changing wind speed (in red) and direction (in blue). Source: MetService, modified by the ATSB
Automatic terminal information service (ATIS)
Throughout the aircraft’s flight and arrival, multiple changes to the Christchurch Airport automatic terminal information service (ATIS) reports were issued. Relevant aspects of the ATIS reports from the time the crew first obtained the ATIS until 3 minutes after landing is shown in Table 5.[17]
Table 6 provides a summary of the key radio calls made between Christchurch air traffic control (ATC), the crew of VOP, the A320 crew, and the pilot of the departing aircraft.
Table 6: Summary of the key radio calls made on the Christchurch ATC frequencies
Time (UTC)
Summary of radio calls
1134:03
ATC advised the A320 crew that the surface wind had changed and it was raining at Christchurch. Shortly after, ATC further advised the crew that the runway-in-use was about to change to runway 29.
1139:41
The A320 crew advised ATC that they were unable to land on runway 29.
1143:00
The A320 crew advised ATC that they were diverting to Wellington.
The above radio calls were made on a different ATC frequency to those made below.
1146:01
The crew of VOP advised ATC that they were at waypoint ‘VANDA’ at FL 390 and were in receipt of ATIS X-ray with a QNH of 992.
1146:02
ATC instructed the crew to descend to FL 160 and advised that they were cleared for the BELEE 1 arrival. ATC then advised the crew to standby.
1146:24
ATC advised the crew that, prior to providing the arrival clearance, ATIS ‘Y’ was now current with runway 29 in-use, visual approaches and ‘quite a few changes from the previous, you want to have a listen’.
1147:37
ATC instructed the crew to descend to FL 160 when ready and that they were cleared for the BELEE 1 Charlie arrival to runway 29.
1147:51
The crew read back the clearance but replied ‘Velocity 160’. ATC confirmed their call sign as ‘Velocity 134’ and advised that ATIS Yankee was current with a QNH of 993.
Time (UTC)
Summary of radio calls cont…
1148:12
The crew confirmed their call sign and the QNH. The crew then requested the surface wind at Christchurch to which ATC advised it was 250° at 12 kt maximum 18 kt.
1151:17
ATC advised the crew that ATIS Zulu had been issued; the runway was wet with light rain, visibility had reduced to 20 km and the cloud was broken[19] at 6,000 ft. The crew replied ‘Velocity 134’.
1152:52
The crew requested a 10 NM diversion right of track. ATC approved the diversion and once clear of weather to track direct to ‘BISUP’.
1154:12
The crew of an A320 aircraft initially for Christchurch contacted ATC and confirmed they were diverting to Wellington.
1154:45
The pilot of an aircraft that had departed Christchurch advised the A320 crew that they ‘would call the runway 29 take-off damp not wet’.
1154:57
The pilot of the departing aircraft repeated that they had taken off from runway 29 about 5-10 minutes prior and they considered the runway to be damp.
1155:14
The crew of VOP requested a 15 NM diversion right of track. ATC advised the crew that they could track as required around the weather and then to BISUP once clear.
1155:26
The crew advised ATC that the weather was bordering BISUP and requested direct to ‘CHARR’ once clear of the weather. The revised clearance was approved by ATC.
1157:16
The crew advised ATC that they were clear of weather and tracking to CHARR. ATC acknowledged the crew and provided descent instructions.
1201:29
ATC provided the crew with further descent instructions and advised the ‘weather is Alpha’ and the QNH was 992. The crew read back the descent instruction and QNH.
1201:46
ATC also advised the crew that the surface wind was ‘easing off a bit’, indicating 240° at 5 kt and that it had stopped raining at the field. The crew replied ‘understood’.
1203-1204
The crew received several descent instructions from ATC, which were read back.
1204:54
The crew asked ATC for an update on the wind. ATC advised that it was ‘easing back around to the south but indicating 220° at 5 kt’. The crew received further descent instructions.
1205:28
ATC advised the crew that the surface wind for the last 5 minutes had remained steady at 230° at 5 kt and the wind at 2,000 ft was 350° at 26 kt.
1205:42
The crew asked ATC if runway 20 was available. ATC advised that it wasn’t available due to the works in progress at the northern end. Excavations were being conducted on that end and it wouldn’t be available for a few hours ‘so it’s runway 29 or 02 with reduced length at the moment’.
1209:05
After receiving further descent instructions, ATC advised the crew that the surface wind was 200° at 3 kt and that it ‘looks like it is going to light and variable’.
1211:12
ATC advised that the surface winds were now calm.
1213:23
ATC cleared the aircraft to land on runway 29.
1257:30
The FO went to the Christchurch Control Tower and advised of the standing water at the end of runway 29.
Air traffic control assessing runway surface conditions
The New Zealand Airways Manual of Air Traffic Services stated that, when information was not available from the aerodrome (airport) operator, air traffic service personnel should use their best judgement to describe the runway surface conditions. This included the centre half of the width of paved runways, and should be described as either of the following:
damp: the surface shows a change of colour due to moisture
wet: the surface is soaked but there is no standing water
water patches: significant patches of standing water are visible
flooded: extensive standing water is visible.
The Manual further indicated that braking action reports[20] were only to be provided by the airport operator and/or pilots, and should include the type of aircraft reporting if known.
The operator of VOP established that ATC personnel at Christchurch would regularly seek advice from the airport operator regarding the runway surface conditions. It was unknown if such information was obtained by ATC prior to VOP landing.
Runway-in-use selection
The runway-in-use indicates the runway considered by ATC to be the most suitable for the aircraft types expected to be taking off and landing at that location. The Manual of Air Traffic Services specified that, when selecting the runway-in-use, controllers should take into account the traffic circuit patterns, the available runway length, position of the sun, the approach and landing aids available, and noise considerations.
When the winds were calm or light (less than 5 kt), the main prepared runway should normally be the runway-in-use. However, where doubt existed, the prevailing local wind conditions should be taken into account when establishing the preferred runway. If the runway-in-use was not considered suitable, a pilot may request an alternative.
Christchurch Airport information
Christchurch International Airport has two runways – runway 02/20 and 11/29 (Figure 7). Runway 02/20 was used for 93 per cent of all operations, while runway 11/29 was generally only used in north‑westerly wind conditions. The captain, FO and Christchurch Tower controller also reported that runway 29 was infrequently used.
Runway 02/20, the main runway, was 3,288 m in length and had a grooved[21] surface. A notice to airmen (NOTAM), valid for the aircraft’s time of arrival, indicated works in progress (WIP) on the northern end of runway 02/20. This resulted in a reduced length of 1,920 m on runway 02, however, the full length was available with 60 minutes’ prior notice to ATC. Runway 20 was closed for landing.
At the time of the incident, runway 29 was the runway-in-use. It was 1,703 m in length, had a 60 m clearway at the end, and was not grooved. The National Aeronautics Space Administration conducted a comparative analysis of braking performance for various aircraft types on grooved and non-grooved runway pavements. That testing showed that grooved runways provided substantially increased aircraft braking capability and directional control, improved runway surface water drainage and more rapid wheel spin-up rates. The runway has since been grooved and the length extended to 1,741 m, with a 60 m clearway.[22]
The operator’s supplementary port information for Christchurch highlighted that a portion of the manoeuvring[23] and apron[24] areas were not visible from the ATC tower.
Figure 7: Christchurch Airport showing the runway directions and works in progress
Source: Google earth, annotated by the ATSB
Closed-circuit television footage
Closed-circuit television (CCTV) from the terminal showed the aircraft landing on runway 29 (Figure 8 – frames 1 and 2). While the quality of that footage was limited, around or shortly after crossing the runway 02/20 and 11/29 intersection, there was a spray of water observed coming from the aircraft (Figure 8 - frames 3 and 4).
Figure 8: Screenshots of footage showing VH-VOP landing on runway 29
Images show the spray of water first visible in frame 3 and then more apparent in frame 4. Source: Christchurch International Airport Limited, annotated by the ATSB
CCTV footage of the apron area showed a reflective surface indicative of a ‘wet’ surface. The drainage characteristics of the apron were unknown, but they were unlikely to be the same as that for a runway. Therefore, it was not possible to establish if these conditions were representative of that present on runway 29 at the time.
Post-incident runway inspection
While an assessment of the runway condition was not done immediately following the incident, an inspection was conducted several days later. That inspection found that the runway intersection was relatively flat with a slight camber out from the centreline to the runway edges. There did not appear to be any wheel rutting or deformations in the runway surface that were conducive to the formation of standing water.
Rubber removal and Gilsonite application
In October 2014, rubber removal on runway 11/29 had been undertaken followed by the application of Gilsonite. At Christchurch Airport, about 66 per cent of the airside pavement surface is asphalt that rarely receives aircraft traffic loadings. This pavement deteriorates from environmental factors and is replaced about every 12-15 years due to embrittlement and cracking, which creates foreign object debris. The application of Gilsonite is a preservation agent that extends the life of the pavement surface. Upon application, there is an initial reduction in pavement friction before undergoing a curing process, which allows the friction values to progressively return to status quo.
Runway surface friction testing
New Zealand Civil Aviation Authority Advisory Circular AC139-13 stated that the runway surface condition has a major impact on the safety of aircraft operations, particularly relating to landing performance. Airport operators are required to closely monitor runway friction levels to ensure they are kept at an acceptable level. To do this, operators should regularly conduct friction testing to build up an overview of the runway condition over a period of time to identify any deterioration. The results of such testing are assessed based on the following levels, which determine the action to be taken.
Design objective level – DOL: The friction level to be achieved or exceeded on a new or resurfaced runway within one year.
Maintenance planning level – MPL: The friction level below which corrective maintenance action should be initiated.
Minimum friction level – MFL: If the friction level is below the minimum friction level, maintenance should be arranged to restore the friction level and a NOTAM issued advising that the runway may be slippery when wet. If the friction level is significantly below, the airport operator should consider withdrawing the runway from use when wet.
Christchurch Airport tested both runways every 3 months using continuous friction measuring equipment[25] (GripTester).[26] This testing was conducted at both 3 m and 6 m from the runway centreline and at speeds of 65 km/h (35 kt) and 95 km/h (51 kt). The lower speed determines the overall mix of macro-texture and micro-texture/contaminant/drainage condition of the runway surface.[27] The higher speed provides a further indication of the surface’s macro-texture.
Following the application of Gilsonite in October 2014, the friction testing results showed that a considerable portion of runway 11/29 was below the MPL. Follow-up testing conducted on 9 March 2015 showed a marked improvement. However, the last third of runway 29 (western end), from about 1,100 m onwards, was mostly below the MPL at both speeds. In response, the airport operator reported that they undertook a light water cut[28] of the centre section (16 m) of the last third (western) of runway 29 in June 2015. Despite this, there was no appreciable improvement in the runway friction levels. The operator of VOP reported that they were not aware of these results prior to the incident, although there was no requirement for airport operators to advise of such.
Although not applicable to these results, a NOTAM was issued after this incident for 26 June - 29 August 2015 stating that the eastern third of runway 11/29 may be slippery when wet. Subsequent to runway 11/29 being grooved in August-September 2015, testing showed that the majority of the runway was above the MPL and exceeded the design objective level in some areas.
Recorded information
Flight data recorder (FDR) analysis
The aircraft was fitted with a FDR and following the incident, the data was downloaded by the operator and provided to the ATSB. The aircraft’s recorded data was also analysed by Boeing. The data showed the following (Figure 9):
A stable approach[29] with flaps 40 was performed.
There was a 5 kt tailwind and essentially zero crosswind just prior to touchdown.
The flare[30] was initiated at a radio altitude of about 30 ft.
The aircraft settled onto the right main landing gear immediately followed by the left main landing gear.
Initial touchdown occurred at a computed airspeed of 138 kt, which was 3 kt above the flap 40 landing reference speed of 135 kt (VREF40).
The aircraft’s actual landing weight was 60,164 kg.
The aircraft touched down within the touchdown zone. Based on the crew’s report of the aircraft coming to rest about 5 m from the runway end, Boeing established that the aircraft touchdown point was about 920 ft (about 280 m) beyond the runway 29 threshold.
Immediately after touchdown, the autobrakes engaged, and the speed brakes and thrust reversers deployed.
With the autobrakes engaged, the AUTOBRAKE 3 target deceleration rate of 0.224 g was initially achieved and then exceeded to a maximum of 0.29 g.
At a computed speed of about 79 kt, shortly after crossing the runway intersection, the autobrakes were disengaged and manual braking commenced. During the application of manual braking, the aircraft’s deceleration reduced to below the AUTOBRAKE 3 target rate. The rate decreased despite the crew applying greater than AUTOBRAKE 3 pressure to override the autobrakes and the FO reported applying ‘hard’ braking with the captain assisting.[31] Overall, the average deceleration from touchdown to the aircraft stopping was about 0.179 g. Refer to Appendix B for a graphical representation of the aircraft’s deceleration during the landing.
The commanded brake pressures during landing could not be verified as the alternate brake pressures were recorded instead of the main brake pressures (refer to section titled Main landing gear brake pressure recording switch).
A minor directional deviation was observed during the later stages of the landing to maintain runway heading, consistent with that reported by the FO (Figure 9).
Reverse thrust was reduced to idle when at a ground speed of about 20 kt. Reverse thrust was normally reduced when the aircraft’s airspeed was about 60 kt.
Figure 9: Aircraft’s ground path and recorded data after crossing the runway 11/29 and 02/20 intersection
Image shows the aircraft’s ground path (in yellow) and recorded data after crossing the runway 11/29 and 02/20 intersection (the zigzag yellow line on the last section of the runway was the result of flight data recording limitations). Source: Google earth, annotated by the ATSB
Boeing simulations
Boeing conducted simulations using the recorded data available in an attempt to characterise the amount of brake pressure applied and the runway conditions. While assumptions were made regarding the runway condition and commanded brake pressure, the results indicated that ‘good’ braking capability was initially achieved until the aircraft crossed the runway intersection. Between the intersection and the runway end, the aircraft’s braking capability significantly reduced. Deceleration throughout the landing was initially consistent with the characteristics of a wet runway and then consistent with a flooded runway after crossing the runway intersection. Boeing further stated that, since runway 29 was not grooved, if standing water was present between the intersection and runway end, the aircraft’s braking capability would have been reduced.
Operational information
Industry landing performance requirements and advice
Certified landing data and Civil Aviation Order 20.7.1B (June 2005)
Certified landing data is used during pre-flight planning to establish the maximum take-off weight at which the aircraft can subsequently land within the available landing distance at the destination or alternate airport. This data is determined during aircraft certification under flight testing conditions and does not represent all operational situations, and excludes the use of reverse thrust. To take into account the differences between testing and normal operations, a safety margin of 1.67 and 1.92[32] is applied to this data for a dry and wet runway respectively (Figure 10). The landing performance charts in the Virgin Australia Airlines (VAA) and Virgin Australia International (VAI) (collectively known as VAA VAI) Airport Analysis Manual (AAM) are derived from certified data.
Consequently, the Civil Aviation Safety Authority (CASA) Civil Aviation Order (CAO) 20.7.1B, section 11.1, issued in June 2005, stipulated that the landing distance required for a jet-engine aircraft involved in regular public transport operations was either:
when landing on a dry runway, 1.67 times the distance required to bring the aircraft to a stop on a dry runway
when landing on a wet runway, 1.92 times the distance required to bring the aircraft to a stop on a dry runway or the distance set out in the flight manual or operations manual for operating on a wet runway.
Figure 10: Graphical representation of certified landing data and the safety margins for a dry and wet runway
Source: Flight Safety Foundation (2009b)
Southwest Airlines accident and FAA safety alert 06012
On 8 December 2005, a Southwest Airlines Boeing 737 ran off the end of runway 31 Centre after landing at Chicago Midway International Airport, Chicago, Illinois, United States (US). The US National Transportation Safety Board (NTSB) determined that the probable cause of the accident was the pilots’ failure to use available reverse thrust in a timely manner to safety slow or stop the aircraft after landing, which resulted in a runway overrun. Also found contributing was the operator’s failure to provide clear and consistent guidance on policies and procedures relating to arrival landing distance calculations, and a failure to include a safety margin in the arrival assessment to account for operational uncertainties. However, at the time, the FAA did not require or standardise arrival landing distance assessments nor specify safety margins for these assessments.
Following the accident, the FAA conducted an audit to evaluate the adequacy of the relevant regulations and guidance, which found:
About 50 per cent of the operators surveyed did not have policies for assessing whether sufficient landing distance existed at the time of arrival, even when conditions were different and worse than those planned prior to departing.
Not all operators who performed landing distance assessments had procedures that considered the runway surface conditions or reduced braking action reports.
Many operators who performed landing distance assessments did not apply a safety margin to the expected actual landing distance; operators who did were inconsistent in applying an increasing safety margin as the expected actual landing distance increased.
Some operators had developed their own contaminated runway landing performance data or were using data from third parties. In some cases, the data had been misused or was not updated with the aircraft manufacturer’s current data, or had shorter landing distances when compared with manufacturer data for the same conditions.
Landing distances published in the Airplane Flight Manual were determined during flight testing and were not representative of normal operations (certified data). These flights were conducted by test pilots demonstrating the shortest landing distance for a given aircraft weight, with a ‑3.5° approach angle, high touchdown sink rates and the use of maximum manual braking. Therefore, the landing distances in the Manual were shorter than the landing distances normally achieved.
Wet and contaminated landing distance data may not represent normal operations as it was typically computed using the dry, smooth, hard surface runway data established during certification. This, along with other factors that affect landing distances, were taken into consideration with the addition of a significant safety margin for pre-flight planning. However, the regulations did not specify a particular safety margin for arrival landing distance assessments and it was left largely to the operator and/or the crew to determine.
Manufacturers did not provide standardised ‘advisory’ landing distance information. However, most turbojet manufacturers provided information for a range of runway or braking action conditions using varying deceleration devices and settings under a variety of meteorological conditions. This information was contained in a wide variety of documents, dependent on the manufacturer.
As a result of the NTSB’s investigation into the accident, they recommended that the FAA immediately require operators to conduct arrival landing distance assessments before every landing based on existing performance data, actual conditions, and incorporating a minimum safety margin of 15 per cent
Consequently, on 31 August 2006, the FAA issued a safety alert for operators (SAFO)[33] (SAFO 06012 – Landing Performance Assessment at Time of Arrival (Turbojets)). The SAFO stated:
This SAFO urgently recommends that operators of turbojet airplanes develop procedures for flightcrews to assess landing performance based on conditions actually existing at time of arrival, as distinct from conditions presumed at time of dispatch. Those conditions include weather, runway conditions, the airplane’s weight, and braking systems to be used. Once the actual landing distance is determined an additional safety margin of at least 15% should be added to that distance. Except under emergency conditions flightcrews should not attempt to land on runways that do not meet the assessment criteria and safety margins as specified in this SAFO.
The FAA indicated that the landing distance assessment should be conducted as close to the time-of-arrival, taking into consideration the crew’s workload, using the most up-to-date information. However, such an assessment did not need to be made before every landing, only when the conditions at the destination deteriorated while en route.
For the assessment, the 15 per cent safety margin should be added to the actual landing distance[34] and the resultant distance should be within the landing distance available.[35] The FAA considered this to be the minimum acceptable safety margin for normal operations. While the FAA recognised that the 15 per cent had not been substantiated, the margin was established based on historic links to the safety factor used for a wet/slippery runway for dispatch (pre-flight) landing requirements, which was already in existence.
Advisory landing data and Civil Aviation Order 20.7.1B (May 2014)
In response to the FAA SAFO 06012 recommendations, some manufacturers of jet-engine aircraft, including Boeing and Airbus, introduced actual landing distance information to assist pilots with making a more accurate in-flight assessment of the landing distance required. This information is classified as ‘advisory’ data and assumes the use of reverse thrust. It is designed to be used to determine a landing distance (actual landing distance) that can be realistically achieved taking into account the actual weather and runway conditions existing at the time-of-arrival, as distinct from the conditions prevailing during pre-flight planning. These conditions include the reported braking action, braking systems to be used, aircraft weight, approach speed, altitude, runway slope, wind and temperature. Once the actual landing distance has been calculated, a safety margin of 15 per cent (1.15) is applied to determine the landing distance required.
In May 2014, CASA amended CAO 20.7.1B to align the landing distance requirements for regular public transport jet-engine aircraft with a maximum take-off weight greater than 5,700 kg with international practice. This change provided a before take-off (using certified data) and in‑flight landing distance determination (using either advisory or certified data):
Before take-off: When landing on a dry runway, the landing distance required is 1.67 times the distance required to bring the aircraft to a stop on a dry runway; and when landing on a wet runway, 1.92 times the distance required, or the distance set out in the flight manual or operations manual for operating on a wet runway.
In-flight: If actual landing distance data is supplied, the landing distance required is 1.15 times the actual landing distance. If this data is not available, the 1.67 and 1.92 before take-off safety margins apply.
At the time of the CAO change, CASA also published Civil Aviation Advisory Publication 235-5(0). The publication explained the amendment to the landing distance requirements and the inclusion of the 15 per cent in-flight safety margin. The purpose of the publication, similar to the FAA’s SAFO, was to provide guidance and explanatory information about the meaning of the amended regulatory requirement, and describe methods to help comply with these requirements.
Boeing incorporates actual landing distance charts in the Performance In-flight section of the Quick Reference Handbook (QRH). Some operators have the 15 per cent safety margin incorporated into these charts, removing the need to manually apply the margin to the actual landing distance.
Inadequate 15 per cent safety margin and FAA SAFO 15009
In response to several landing events where the braking coefficient was found to be less than what was expected for a wet runway, the FAA issued SAFO 15009 in August 2015 (after this incident). The SAFO (SAFO 15009, Turbojet Braking Performance on Wet Runways) warned operators and pilots of jet-engine (turbojet) aircraft that:
…advisory data for wet runway landings may not provide a safe stopping margin under all conditions.
While the FAA recognised that landing overruns on wet runways usually involved multiple contributing factors, an analysis of these events raised concerns regarding stopping performance assumptions. The cause of the underperformance was not fully understood, but the FAA cited possible factors relating to runway conditions including texture, drainage, puddling in wheel tracks and active precipitation. Specifically, the analysis showed that, 30-40 per cent of additional stopping distance may be required in certain cases where the runway was very wet, but not flooded. This indicated that:
…applying a 15% safety margin to wet runway time-of-arrival advisory data as, recommended by SAFO 06012, may be inadequate in certain wet runway conditions.
As a result of the above, the FAA suggested that operators should consider applying additional conservatism in their time-of-arrival assessment when either:
active moderate to heavy precipitation existed on a non-grooved or non-porous friction course overlay runway
active heavy precipitation existed on a grooved or porous friction course overlay runway.
Operator’s landing performance procedures
Requirement to review landing performance
In February-March 2015, Virgin Australia New Zealand (VANZ) was incorporated into Virgin Australia International (VAI). The VAA VAI Operating Policies and Procedures – General manual detailed the landing performance procedures for prior to take-off (prior to dispatch) and prior to arriving at the destination:
Prior to dispatch, the Pilot-in-Command (PIC) must ensure that the maximum performance landing weight limit is not exceeded in accordance with CAO 20.7.1B.[36]
Prior to arrival, the PIC must review landing performance to determine that sufficient landing distance is available with adequate safety margin. This review should include consideration for:
- The runway of intended use
- The conditions existing at the estimated time of arrival
- The aircraft configuration and means of deceleration that will be used for landing.
An assessment of no change to the conditions since pre-dispatch landing weight limit calculation may constitute this review.
For diversion to an alternate, an assessment of landing weight and determination that sufficient landing distance is available with adequate safety margin shall be completed prior to arrival.
Cross-checking landing performance
For take-off, the Operating Policies and Procedures – General manual stated that crews must ensure that the environmental and load sheet information used to derive take-off performance data was cross‑checked. Once that data was derived, the other pilot must independently cross‑check the calculation by completing a full recalculation and verifying the base-line data used for the calculation and the final extracted figures. The other pilot must also independently verify the accuracy of the data entered into the flight management system. There was no such requirement for crews to independently cross-check landing performance information and the resulting calculation.
Sources to be used for landing performance
For the incident flight, the crew used the AAM to establish the aircraft’s landing performance. At that time, the VAA VAI Performance and Loading Manual (Boeing 737) indicated that landing performance was to be determined by referencing the tabulated factored landing data prepared for each location in the AAM (Christchurch shown in Figure 11 below). However, when a non-normal condition occurred in-flight, the un-factored non‑normal configuration landing distances for various runway surface conditions contained in the QRH (Figure 13 below) were to be used.
The crew of VOP had previously operated under VANZ, and indicated that during this time they had used the AAM in‑flight to establish their landing performance and had used the QRH for determining non-normal landing distances in-flight and during simulator assessments. Prior to CAO 20.7.1B (May 2014), VAA and VAI crews were also using the AAM in-flight, however, the operator reported that they would also use the QRH (Figure 13 below) to plan a ‘landing solution’ in-flight.
Guidance regarding Civil Aviation Order 20.7.1B changes
Following the CAO 20.7.1B amendments, the operator received feedback from crews indicating the changes to in-flight landing performance requirements were ambiguous and that there were various interpretations as to how they could be applied. In response, the operator published an article (referred to as a ‘Q and A’) in September 2014 on the VAA and VAI intranet. The article provided guidance to crews on complying with the regulations and techniques for planning a suitable stopping solution. Specifically, the article highlighted the following:
For pre-dispatch landing performance determination, refer to the factored figures provided in the AAM.
For in-flight, the normal configuration landing distances in the QRH (Figure 13 below) should be consulted. The new requirement was to add a 15 per cent safety margin to the actual landing distance, taking into account the planned flap setting, autobrake selection and actual conditions. This equated to the landing distance required.
If the landing distance required was in excess of the landing distance available, a higher autobrake setting should be used. If AUTOBRAKE 3 was not sufficient with the safety margin, but MAX AUTO or MAX MANUAL was, a suitable solution would be to plan to land with AUTOBRAKE 3 and override with manual braking. This was applicable if the landing distance required was ‘just outside’ the landing distance available. However, if it was ‘well above’, MAX AUTO should be used.
The landing distances are predicated on touching down at 1,000 ft. A touch down beyond this point would rapidly compromise the 15 per cent safety margin, even if the aircraft landed within the touchdown zone.
The Q and A provided a mechanism for the operator to issue expanded standardisation guidance, in a timely manner, regarding the use of in‑flight landing data under the amended CAO. This information was for educational purposes only; the techniques discussed were recommendations only and did not constitute policy. The captain and FO reported they were not aware of this particular Q and A prior to the occurrence.
The operator reported that the corresponding policy had not been updated at the time of the occurrence as they were still seeking clarification from CASA regarding the CAO requirements and waiting on additional data from Boeing.
VANZ to VAA VAI transition training on landing performance
As part of the VANZ transition to VAA VAI, the New Zealand crews were required to undergo additional training prior to operating Australian registered aircraft for VAA VAI. The crews participated in a two-day training course where they were advised of the landing performance requirements stipulated in the May 2014 version of CAO 20.7.1B. The crews were made aware of the dispatch and in-flight requirements. For dispatch, the maximum landing weight with the 1.67 and 1.92 safety margins was applied, as previously used by the crew. For in-flight, the dispatch maximum landing weight method could be used or the QRH landing distance data with a 15 per cent margin applied.
However, the training noted that using the QRH was a recent rule change and the corresponding update of the operator’s policy was still pending. Consequently, in the interim, crews were instructed to use the dispatch maximum landing weight found in the AAM (or the onboard performance tool (OPT)[37] when requested).
Landing performance calculations
While the crew used the AAM on the incident flight as required, a review of the aircraft’s landing performance for the flight was conducted referencing both the AAM and QRH. Each review considered the runway and weather conditions used by the crew, the conditions reported on the current ATIS (A), and the actual wind information established from the FDR (refer to section titled Recorded information – Flight data recorder analysis).
The VAA VAI AAM landing performance charts are provided for specific airports and flap settings (refer to Appendix C for an example of the AAM chart). These charts are presented in a cross‑tabulation[38] format where, based on the runway-in-use, variables such as the wind and runway surface conditions are used to establish the landing limit weight. The aircraft is only permitted to land provided the actual landing weight does not exceed the weight stipulated on the chart, unless a higher emergency exists. The crew then determine what level of braking is suitable for the landing. The Christchurch runway 29 landing chart for 40 flap was referenced by the crew (Figure 11).
Figure 11: AAM extract for runway 29 at Christchurch Airport[39]
Image shows the AAM extract for runway 29 at Christchurch Airport with 40 flap, highlighting (in red) the wind information and landing limit weights for a dry and wet runway. Source: Virgin Australia Airlines, annotated by the ATSB
Based on the conditions used by the crew (dry (damp) runway surface and nil wind), the resulting AAM landing limit weight was 68.2 t, which was above the aircraft’s maximum structural landing weight of 66.3 t. This was also 8.1 t above the aircraft’s actual estimated landing weight of 60.1 t, and therefore, considered suitable for landing. Similarly, with a 3 kt headwind and 5 kt tailwind determined from the ATIS (reported) and the FDR (actual) respectively, the aircraft was also able to land on a dry runway. However, for a wet runway surface, the aircraft was not certified to land under any of these conditions. With nil wind, the aircraft was about 1 T above the landing limit weight and with a 5 kt tailwind, it was about 5.7 kt too heavy (Table 12).
Table 12: Comparison of AAM landing limit weight between the conditions used by the crew, and for the reported and actual wind conditions
Actual conditions determined from the FDR (5 kt tailwind)
Dry
69.34
68.2
63.0
Wet
60.06
59.1
54.4
VOP’s landing weight was 60,164 kg (about 60.2 t)
The AAM provides crews with the knowledge of whether or not the aircraft can land on a particular runway in the current conditions and with the expected landing weight. However, the crew still need to determine the appropriate level of braking to ensure the aircraft can safely land on the available runway length. This is achieved through crew experience and training. The Boeing 737 NG Flight Crew Training Manual stated that:
For normal operation of the autobrake system select a deceleration setting.
Settings include:
- MAX: Used when minimum stopping distance is required. Deceleration rate is less than that produced by full manual braking
- 3: Should be used for wet or slippery runways or when landing rollout distance is limited. If adequate rollout distance is available, autobrake setting 2 may be appropriate
- 1 or 2: These settings provide a moderate deceleration suitable for all routine operations.
Experience with various runway conditions and the related airplane handling characteristics provide initial guidance for the level of deceleration to be selected…
…If stopping distance is not assured with autobrakes engaged, the PF [pilot flying] should immediately apply manual braking sufficient to assure deceleration to a safe taxi speed within the remaining runway.
Quick Reference Handbook (QRH) – Actual landing distance
The QRH normal configuration landing distance chart (Figure 13 and Appendix D) is used to calculate the aircraft’s (predicted) actual landing distance based on a level of reported braking action and autobrake setting. To do this, crews calculate an adjustment for up to seven variables (aircraft weight (WT ADJ), altitude (ALT ADJ), wind (WIND ADJ), runway slope (SLOPE ADJ), temperature (TEMP ADJ), approach speed (APP SPD ADJ) and partial/nil reverse thrust if applicable (REVERSE THRUST ADJ). Each adjustment is then added or subtracted to a baseline reference distance (REF DIST – this distance includes an air distance allowance of 305 m (1,000 ft).[41] The resulting calculation predicts the actual landing distance. Effectively, the QRH provides what is considered a ‘landing solution’ as it takes into account all the necessary variables to determine an aircraft’s landing performance.
In some cases, the 15 per cent in-flight safety margin is incorporated into this chart. However, if this is not the case, the safety margin is then added to the calculated actual landing distance to establish the landing distance required. At the time of the incident, the operator’s QRH chart did not include the safety margin and no such guidance was included on the version of the chart used by the VAA VAI crews.
In addition, there was no specific guidance provided to the operator’s crews on whether the adjustments were to be exact (interpolated) or rounded to the nearest conservative value. Boeing indicated to the ATSB that they did not promote any particular calculation technique, allowing operators to make that determination based on the knowledge of their crews and operating environment. While Boeing considered interpolation acceptable, they would suggest rounding up in terms of weights and speeds, and being conservative, so not to induce errors.
Figure 13: QRH normal configuration landing distances with 40 flap for ‘good’ reported braking action
Source: Virgin Australia Airlines
The ATSB used the normal configuration QRH landing distance chart for flaps 40 to calculate the predicted actual landing distance (without a 15 per cent safety margin) and the landing distance required (incorporating a 15 per cent safety margin) for VOP (Table 14). The calculations took into account varying autobrake configurations, approach speed additives, and the surface wind conditions used by the crew, and the reported (ATIS) and actual (FDR) wind conditions. Table 14 shows the landing performance calculations for both dry and wet runways. While there were no reports of braking action, ‘good’ reported braking action[42] reported braking action was used for the wet runway calculations. To establish the most precise distances, the adjustments were interpolated. Specifically, the calculations showed:
Conditions used by the crew (orange): The crew planned the landing using a dry runway, AUTOBRAKE 3, nil wind and VREF + 5 kt (approach speed). The QRH calculated actual landing distance using these conditions was about 123 m shorter than the landing distance that was available for runway 29. However, if the 15 per cent safety margin was applied, the landing distance required would have exceeded the landing distance available, requiring the use of a higher braking selection. If the wet (‘good’ reported braking action) data was used, the landing distance required increased by about 15 m.
Reported conditions (green): For a wet (‘good’ reported braking action) runway with AUTOBRAKE 3, VREF + 5 kt and the 3 kt headwind reported by the ATIS the calculated actual landing distance was about 131 m shorter than the landing distance available. If the 15 per cent safety margin was applied, the landing distance required exceeded the landing distance available by about 104 m.
Actual conditions (blue): For a wet (‘good’ reported braking action) runway with AUTOBRAKE 3, VREF + 5 kt, and the unreported 5 kt tailwind (later determined from the FDR), the calculated actual landing distance was about 5 m greater than the landing distance available. If the 15 per cent safety margin was applied, the landing distance required exceeded the landing distance available by about 261 m.
The FDR analysis determined that the aircraft landed with an airspeed of VREF + 3 kt and an actual air distance of about 280 m (2 kt slower and 25 m less than the QRH assumptions respectively). For the actual conditions, these should have resulted in an actual landing distance about 58 m less than the landing distance available. However, the average deceleration achieved from 138 kt at touchdown to the aircraft being stopped about 1,418 m later was about 0.179 g. AUTOBRAKE 3 performance is predicated on 0.224 g deceleration. Therefore, despite initially exceed AUTOBRAKE 3 performance and the later application of firm manual braking, the overall landing performance achieved on the wet runway was less than what would have normally been achieved with AUTOBRAKE 3. If the 15 per cent safety margin was applied, the calculated landing distance required would have exceeded the landing distance available by about 189 m.
Overall, under all of the above conditions, to meet the landing distance requirements stipulated in CAO 20.7.1B, AUTOBRAKE MAX or MAX MANUAL braking would have been required. As shown in Table 14 (black text), the landing distance required was within the runway length available on either a wet (with good reported braking action) or dry runway.
Table 14: Comparison of QRH actual landing distances for a dry and wet (‘good’ reported braking action) runway
Table shows a comparison of the QRH actual landing distances for a dry and wet (‘good’reported braking action) runway with varying brake selections for the conditions used by the crew (nil wind), and the reported (3 kt headwind) and actual (5 kt tailwind) conditions, and the corresponding landing distance required.
Environmental effects on the actual landing distance
As previously discussed, the crew were of the understanding that there was nil wind and the runway was damp (dry). The ATIS current at the time of landing indicated that the runway was wet and there was a 3 kt headwind, but Boeing later determined that there was a 5 kt tailwind. While the difference in wind component between the ATIS and that established by Boeing could not be resolved, environmental factors can have a significant effect on aircraft landing performance. In this case, as shown in Figure 15, the wet runway and 5 kt tailwind accounted for a 0.7 and 7.9 per cent increase respectively in the actual landing distance. The remaining distance between this, and when VOP was stopped, was attributable to the additional effects of the runway surface conditions (3.2 per cent). Combined, these environmental conditions resulted in about a 12 per cent increase to the actual landing distance.
Figure 15: Effect of environmental conditions on the actual landing distance (not to scale)
Source: ATSB
Underestimated conditions and effect on safety margins
The International Civil Aviation Organization (ICAO) has recognised that information provided by personnel assessing and reporting runway surface conditions is crucial to the effectiveness of runway condition reporting.
A misreported runway condition alone should not lead to an accident or incident. Operational margins should cover for a reasonable error in the assessment, including unreported changes in the runway condition. But a misreported runway condition can mean that the margins are no longer available to cover for other operational variance (such as unexpected tailwind, high and fast approach above threshold or long flare).[43]
To gain an appreciation of when the 15 per cent in-flight safety margin may be inadequate, the ATSB compared the QRH landing distances for varying brake settings. Specifically, this was done to examine the potential reduction in the safety margin when the runway condition (reported braking action) was underestimated.
If the runway conditions were reported ‘dry’ and this was used to calculate the QRH landing distance, when in fact the conditions were wet ‘good’ reported braking action,[44] for AUTOBRAKE 3, the difference would be negligible (less than 1 per cent). However, if AUTOBRAKE MAX or MAX MANUAL braking were used, the landing distance for the actual conditions would be 18 per cent or 38 per cent (respectively) greater than the landing distance calculated for the reported conditions (Figure 16). Similarly, if the conditions were reported wet ‘good’ reported braking action but were actually wet ‘medium’ reported braking action, for AUTOBRAKE 3, the difference would be about a 12 per cent increase. For AUTOBRAKE MAX and MAX MANUAL braking, the difference would be an increase of at least 27 per cent and 34 per cent respectively.
Figure 16: Comparison of QRH landing distances when the runway conditions are underestimated
Image shows a comparison of QRH landing distances when the runway conditions are underestimated between ‘dry’ to ‘good’ and ‘good’ to ‘medium’ reported braking action. Source: ATSB
Electronic devices for performance calculations
Boeing recognised that using charts (AAM and QRH) to establish landing performance continue to be a viable option. However, the use of electronic devices such as the Boeing OPT was encouraged. A tool such as OPT allows crews to perform real-time, precise extraction of data based on current weather and runway conditions, without the need for complex calculations and extensive guidance.
Similarly, the International Air Transport Association has also recognised that operators must provide performance data to enable crews to operate aircraft safety, economically and in accordance with applicable rules and practices. To assist with this, the International Air Transport Association has developed the standardised computerised aircraft performance tool, which allows performance calculations to be generated electronically using an iPad.
Runway surface conditions and braking action reports
Information regarding runway conditions are normally available from three sources:
a description of the runway surface condition by either air traffic control, pilots and/or airport personnel
pilot braking action reports
readings from runway friction measuring devices as used by airport personnel.
While extensive research has been conducted to establish a correlation between runway friction measuring device readings and aircraft braking friction capability, the results have been inconclusive (FAA, 2016). Consequently, the following will focus on the first two sources of information.
Runway surface conditions
The VAA VAI Performance and Loading Manual (Boeing 737), effective from February 2015, defined runway surface conditions as either dry, damp, wet or contaminated. Specifically, a damp runway was:
A runway surface that is not dry, but has insufficient moisture to make it appear reflective. A damp runway shall be considered a wet runway.
However, during the incorporation of VANZ into VAI, this definition was changed due to operational requirements with flying into some locations in New Zealand. Further, the operator indicated that there was no guidance on damp runways in CAO 20.7.1B, but the change was consistent with the European Aviation Safety Agency (EASA) definition detail below. Subsequently, a flight crew operating notice was also issued in February 2015 and stated that:
A runway is considered damp when the surface is not dry, but when moisture on it does not give it a shiny appearance. For performance purposes, a damp runway may be considered to be dry.
The amended definition was consistent with the crew’s understanding of how a damp runway was classified and treated for performance purposes at the time of the incident. The Manual was later amended to reflect this change.
Broadly, the term ‘damp’ to describe runway surface conditions is used inconsistently. In Australia, CASA considers a runway to be either, dry, wet or contaminated; they do not use the term damp. However, Airservices Australia use the terms, damp, wet, water patches and flooded. Internationally, ICAO defines runway surface conditions as:
dry, wet or contaminated (Annex 6 – Operation of Aircraft)
damp, wet or standing water (Doc 4444 – Air Traffic Management; Annex 14 – Aerodromes)
damp, wet, water patches or flooded (Doc 9137 – Airport Services Manual)
Larger aircraft manufacturers provide performance and limitation data for dry and wet runway surface conditions, but not damp. Consequently, and unless otherwise directed, operators determine how a damp runway should be treated for performance purposes. As detailed above for VAA VAI, prior to the VANZ transition, a damp runway was considered wet, but after, it was considered dry. At the time of the incident, the EASA also stated that a damp runway, other than a grass runway, may be considered to be dry. An informal review of other Australian operators found that the term damp was applied inconsistently.
A CASA subject matter expert indicated to the ATSB that they would consider a damp runway to be wet for performance purposes. Similarly, Boeing and the FAA (refer to section titled Operational information -Runway surface conditions and braking action reports - Achieving standardisation) also considered a damp runway to be wet. The International Federation of Air Line Pilots’ Association Runway Safety Manual quoted the Joint Aviation Authorities, which stated that evidence had become available, which established that a damp runway did not provide an equivalent braking surface as a dry runway. This was further highlighted by the United Kingdom Civil Aviation Authority (Civil Aviation Publication 789 Requirements and Guidance Material for Operators – The Use of Performance Data Appropriate to the Existing Runway Conditions):
Operators should be aware of the importance of using the performance data appropriate to the existing runway conditions…It is not sufficient for a runway to be considered, for performance purposes, as dry when it is wet solely on the basis that it is constructed with, for example, grooves or porous friction course pavement…Although a runway may have a grooved or porous surface, it may not be possible to demonstrate that it retains an 'effectively dry' braking action when wet. This may be because the type of surface is inherently not physically capable of retaining dry braking friction characteristics in the presence of sufficient moisture to be termed 'wet'.
Braking action reports
Similar to that observed with runway surface conditions, the terminology used by pilots to describe the braking characteristics of an aircraft varies amongst organisations. For example, the Airservices Australia Aeronautical Information Package and Boeing 737 flight crew operating manual use the terms ‘good, medium or poor’, while ICAO use the terms ‘good, medium-good, medium, medium-good and poor’. Until recently, the FAA also used the term ‘fair’.
Subjective assessment and inconsistent terminology
A BMT Fleet Technology presentation to the European Aviation Safety Agency Runway Friction and Aircraft Braking – The way forward Workshop in March 2010 highlighted the limitations associated with assessing runway surface conditions. Specifically, the visibility of the surface conditions may be affected by visual field of range, ambient visibility (precipitation, illumination of the surface at night, fog/freezing fog), depth perception, contaminant feature contrast (low light reducing shadows, bright sunlight creating glare, contaminant reflectivity), and eyesight.
Similarly, the FAA SAFO 06012 highlighted that runway surface conditions may be reported using several types of descriptive terms and that pilot braking action reports were subjective. Specifically, the possibility of two pilots operating identical aircraft under the same conditions reporting a different level of braking action. This may be attributed to specific differences between the aircraft, the aircraft’s weight, pilot technique used for landing, or the pilot’s experience and expectations. The assessment of an aircraft’s braking capability relies on pilot judgement.
The subjective nature and inconsistent terminology used to describe runway surface conditions and reported braking assessments has been widely recognised by industry.
Firstly, the FAA (2015b) outlined the reliance on pilots for assessing conditions:
Pilot-reported braking action is a subjective assessment of runway slipperiness. The pilot bases the assessment on observations of braking deceleration and directional controllability during landing rollout.
The runway surface condition at airports is a critical safety concern…water on runways can have a significant impact on aircraft performance…braking action is an area where there is little standardization between pilots, industry and regulators…There are many different definitions of these terms, and their use may lead flight crews into believing that a runway is safe to use for their aircraft when it may not actually be safe; miscalculating the landing rollout length; or configuring the aircraft incorrectly for landing.
Comfort and others (2010) outlined some of the inherent challenges in assessing conditions:
…challenges with the accuracy of friction measurement…surface contaminants are visually assessed, not measured…human factors affect RCR [runway condition reporting] accuracy... terminology used to describe runway conditions by RIs [runway inspectors] is not standardised…runway state (dry, wet, contaminated) and condition descriptions used to describe aeroplane TaLP [take-off and landing performance] are not standardized or harmonized...
To enhance the safety of operations it is clear that crews of arriving aircraft have an understanding of the prevailing conditions at an airport and more importantly can gain an expectation of how their aircraft is likely to handle. For this to happen there must be a harmonised system of runway condition reporting. At present there is a lack of harmonisation of the runway state definitions of the various regulatory bodies…Specifically, there is a disconnect between the treatment of grooved/PFC [porous friction course overlay] runways in JAR-OPS and scientific research into dry, damp and wet runway states.
In a previous research report, the ATSB (2009) highlighted the lack of standardisation in defining braking conditions:
Definitions of braking actions are another area where there is little standardisation between pilots, industry and regulators…Less than adequate runway condition information in heavy precipitation is a safety issue and a potential contributing factor to runway excursion accidents. Where this information does exist, it is often conflicting (reported by multiple sources), generic (uses general terms), misleading (only applicable to certain aircraft types), or outdated (due to the dynamic nature of weather)…On wet runways, there is generally little information available to flight crews on the depth of any standing water on the runway.
The measurement of certain parameters suffer from inherent ambiguity in the aviation industry. A prime example is runway condition. There simply has not been an agreed industry standard on reporting runway conditions and determining its relationship with runway friction and aircraft braking performance...The current industry approach is to measure and report runway friction periodically using standard equipment and wet surface conditions. However, it also is common practice to rely on pilots' subjective reporting, particularly for contaminated runways.
Johnsen (2007) emphasised the risks of basing braking action on pilot assessments alone:
The pilot’s assessment of braking action is a personal judgment that is influenced by a number of factors; given the same conditions and aircraft, two pilots likely will judge the conditions differently. Various factors affect the pilot’s perception. Braking action on a long runway, for example, might be perceived as better than braking action on a shorter, marginal runway where the end seems to approach substantially faster.
Giesman (2005) specifically highlighted the subjectiveness of the term ‘damp’:
Damp runway…friction was reduced compared to dry…friction may be better than wet…subjective term…
The Flight Safety Foundation (date unknown) also outlined the risks posed by pilot subjectivity and other factors:
Pilot braking action reports can be affected by the reporting crew’s experience and the equipment they are operating…Pilot braking action reports generally are the most recent information available and therefore provide information about changing runway conditions. However, pilot reports are subjective. The pilot of a small airplane may perceive different braking conditions than the pilot of a large airplane. The braking action assessment also can be influenced by the airplane’s weight, approach speed, amount of wheel braking applied and the location on the runway where the highest amount of wheel braking is used.
The CASA subject matter expert, who was also a member of the ICAO Flight Operations Panel, advised the ATSB that the terminologies used to describe braking action were not standardised. It would be difficult to achieve standard reporting as it was reliant on how the pilot assessed the landing and the technique used, which was subjective. However, the officer indicated that, in the future, ICAO will require pilots to make braking action reports and they will be provided with guidance material to assist with reporting. Further, if an aircraft had not recently landed, air traffic control would be required to make a subjective assessment of whether the runway was dry, damp or wet.
The deficiencies and limitations for assessing and reporting runway surface conditions using the existing methods were also highlighted in the FAA report (Subbotin and Gardner, 2013) Takeoff and Landing Performance Assessment Validation Effort of the Runway Condition Assessment Matrix (refer to section titled Operational information -Runway surface conditions and braking action reports - Achieving standardisation). These included:
pilot reports were too subjective in nature
standard definitions of pilot report terms did not exist
training and guidance was not given to pilots on how or when to report braking action
there was no correlation between pilot reports from different aircraft types
most aircraft manufacturers did not provide performance data in terms of braking action
friction-measuring devices could only be operated on certain runway surface conditions and there was a lack of repeatable readings on consecutive measurements
there was no correlation between runway coefficient of friction (Mu)[45] and aircraft braking performance
there were various terms and definitions used to describe runway surface contaminants
inconsistent or lack of reporting accurate contaminant depth on a runway made it difficult to determine aircraft performance degradation.
Achieving standardisation
Following the 2005 Southwest Airlines overrun accident, the FAA found that industry practices did not have adequate guidance and regulations addressing operations on non-dry, non-wet runways. As a result, the FAA formed the takeoff and landing performance assessment aviation rulemaking committee (known as TALPA ARC) to make recommendations on improving the safety of operations on wet or contaminated runways. Most notably, the committee found that (Subbotin & Gardner, 2013):
…there was a lack of a standard means to assess and communicate actual runway conditions at the time of arrival, particularly when conditions have changed, in terms that directly relate to aircraft landing performance.
The committee’s primary recommendations were to use a runway condition assessment matrix (RCAM – Figure 17 and Appendix E) and to ensure the use of common terminology by those involved in the process of determining and reporting runway surface conditions and their effect on aircraft performance. The matrix provided a methodology for communicating actual runway conditions to pilots based on expected aircraft performance. Of note, the matrix considered a damp runway to be wet.
The matrix also provided criteria relating to control and braking. For example, ‘good’ reported braking action was defined as, braking deceleration was normal for the amount of braking applied and directional control was normal. For ‘medium’ reported braking action, braking deceleration was noticeably reduced for the amount of braking applied and directional control was also noticeably reduced.
Figure 17: RCAM extract
Source: FAA
In 2009, a validation effort to assess the RCAM was commenced and the results were documented in the report Takeoff and Landing Performance Assessment Validation Effort of the Runway Condition Assessment Matrix. This process involved validating the correlation between the matrix surface condition descriptions and pilot braking action reports, and determining the useability of the matrix for airport operators and pilots. Based on the results of the validation efforts, it was recommended that the FAA implement the RCAM.
In August 2016, the FAA notified operators, pilots, training providers and other personnel that they would be implementing the RCAM in the US, effective from 1 October 2016 (SAFO 16009 – Runway assessment and condition reporting). The matrix would be used by airport operators to perform assessments of runway conditions and by pilots to interpret the reported runway conditions. The SAFO highlighted that:
The RCAM is presented in a standardized format, based on airplane performance data supplied by airplane manufacturers, for each of the stated contaminant types and depths. The RCAM replaces subjective judgments of runway surface conditions with objective assessments tied directly to contaminant type and depth categories.
Further to the FAA’s efforts to achieve harmonisation with runway condition reporting, ICAO also intend to standardise the reporting of runway conditions in an attempt to reduce runway excursion events. Becoming applicable on 5 November 2020, ICAO will be adopting the RCAM, which will allow crews to more accurately determine aircraft take-off and landing performance. ICAO highlighted that this will provide a solution to a long outstanding problem with correlating aircraft performance to runway state information in a more objective manner.
In September 2016, EASA issued a notice of proposed amendment (2016-11) regarding aircraft performance requirements for commercial air transport operations. The purpose of the amendment was to increase the current level of safety in relation to aircraft performance, to improve harmonisation with the FAA, and to align with ICAO. Specifically, EASA stated their intention to delete the ‘damp’ runway definition as this condition would be included in their definition of a ‘wet’ runway.
Flight following services
The operator’s Flight Dispatch Policy Manual stated that flight following services were provided to all Virgin Australia aircraft[46] to primarily enhance and contribute to the safety of a flight. This service was the responsibility of the flight dispatcher and commenced from the time a flight plan was submitted to air traffic services until confirmation of a safe landing. It included the advice and provision of operationally critical information (OCI), and other information relevant to the safe and efficient operation of that flight. While the Manual detailed what was considered OCI, of most relevance to this incident was:
Any other operational requirements assessed by the dispatcher to be relevant to the operation of the flight.
The manual also noted that, due to operational constraints with high frequency radios and a short sector length of less than 3 hours, the transmission of OCI could not be assured. However, it was a dispatcher's duty of care to attempt to contact the crew by radio or to relay OCI advice via ATC, which may affect the safe continuation of the flight.
During pre-flight planning, the crew were provided with the Christchurch TAF issued at 0629 and were aware of rain forecast for later in the morning. The operator’s investigation found that the revised TAF issued at 1102 was not transmitted to the crew in-flight. They assessed that the change in weather conditions was not considered OCI and had no operational significance to the aircraft en route to Christchurch.
An aircraft’s brakes provide the primary means for stopping, but their contribution to the total stopping force varies significantly with the runway conditions and groundspeed. The amount of braking force on the tyre depends on the tyre to runway surface friction and the weight on the wheel. The presence of contaminants such as water, ice or slush can lift the tyre above the runway surface on a layer of water. This phenomenon is known as 'aquaplaning' or 'hydroplaning'.
The presence of a layer of water can reduce the coefficient of friction between the tyres and the runway in three ways: viscous, dynamic and reverted rubber aquaplaning. All three can degrade both the braking and cornering capability of the aircraft, thereby affecting deceleration and directional control.
Reverted rubber aquaplaning: This occurs when the heat from a locked-wheel being dragged across a wet surface generates steam. The pressure of the steam is sufficient to raise the centre of the tyre off the runway surface while the edges remain in contact. Heat from the steam reverts the rubber to its natural state, leaving a black, gummy deposit of reverted rubber on the tyre. It will also typically leave distinctive marks on the runway.
Dynamic aquaplaning: This occurs when a build-up of hydrodynamic pressure at the tyre-runway surface area creates an upward force that lifts part or all of the tyre off the surface. Total aquaplaning will occur when there is complete separation between the tyre and surface, and wheel rotation stops. The depth of water required to support dynamic aquaplaning varies from 0.1 inch (2.54 mm) for a well-worn tyre to 0.3 inches (7.62 mm) for new tyres with full tread depth. The speed required to generate sufficient water pressure to raise the tyre off the runway depends on the tyre pressure and if the wheel is rotating as it moves through the water. If the tyre is rotating, the minimum speed will be nine times the square root of the tyre pressure. If the tyre is not rotating, the minimum speed will be 7.7 times the square root of the tyre pressure. In this case, this equated to 129 kt and 110 kt respectively. This was about 35 kt and 16 kt above VOP’s recorded computed speed after crossing the runway 11/29 and 02/20 intersection.
Viscous aquaplaning: This occurs when the runway surface is lubricated by a thin film of water, reducing the coefficient of friction. The tyre is unable to penetrate this film and contact with the surface is partially lost. Essentially, it makes the runway slippery. When operating on damp or wet runways, a loss of tyre braking and cornering ability is mainly attributable to this type of aquaplaning. However, it is most severe on runways with a smooth texture, where a layer of water only 0.01 inches (0.254 mm) deep can significantly reduce the coefficient of friction. This can occur at any tyre speed. Generally, there is little or no post-event evidence available to determine if viscous aquaplaning has occurred.
Runway excursions
Runway veer-offs (when an aircraft departs the side of the runway) and overruns (when an aircraft departs the end of a runway) are collectively termed runway excursions. The international aviation community has invested a considerable amount of time and resources into reducing the risk of runway excursions. Some of the research into runway excursions has found:
Boeing analysis of event data between 2003 and 2010 showed that 68 per cent of runway landing overruns occurred after a stable approach, 55 per cent touched down within the touchdown zone, 90 per cent landed on an other-than-dry runway and 42 per cent landed with a tailwind of 5 kt or greater. The analysis emphasised that a runway overrun was frequently the result of more than one contributing factor occurring simultaneously. Figure 18 shows the common factors in runway overruns during landing. The size of the circle represents the relative frequency the item was a contributing factor to the overrun.
Figure 18: Factors in landing runway overruns
Source: Jenkins & Aaron (2012)
ATSB reviewed world-wide runway excursion accidents between 1998 and 2007 and found that there were 141 accidents involving commercial jet aircraft that resulted in 550 fatalities to passengers, crew and persons on the ground. Of these accident, 120 occurred during landing. The most common types of contributing factors were crew technique or decision-related factors, and weather-related factors.
Flight Safety Foundation (2009c) (briefing note (2009a)) runway safety initiative found that commercial transport aircraft worldwide were involved in 417 runway excursion accidents between 1995 and March 2008. Of this, 79 per cent occurred during landing. Among these landing excursions, 47 per cent were overruns. The Foundation recognised that runway excursions were usually the result of one or more factors. Specifically, some of the following factors contribute to runway overruns:
incorrect assessment of landing distance for prevailing wind and runway conditions
unanticipated runway conditions
unanticipated wind shear or tail wind
extended flare
ground spoilers/speed brakes not deployed
brake/antiskid malfunction
touchdown long
inaccurate surface wind information
unstable approach
late braking
hydroplaning/aquaplaning
approach and touchdown fast.
National Aerospace Laboratory NLR (van Es, 2005) examined 400 landing overrun accidents between 1970 and 2004 and found that the corresponding accident rate had reduced by a factor of three over the past 35 years. This decrease was most likely due to improvements in braking devices such as antiskid and autobrakes, a better understanding of runway friction issues, and safety awareness campaigns. The study also highlighted that, often the surface condition varied along the runway. For example, only part of the runway was flooded with pools of standing water while the remainder was wet. Of the accidents examined, 48 per cent occurred on a wet/flooded runway. The research also concluded that there appeared to be a significant increase in the risk of landing overruns when one of the following factors was present:
On 24 November 2010, the crew of a Boeing 737 aircraft were preparing to land on runway 12 at Hobart, Tasmania. The crew were informed that the runway was wet, but understood that the braking was ‘good’. Based on the reported weather, aircraft weight and airport conditions, the FO determined that a flap setting of 30° and the use of AUTOBRAKE 3 would provide sufficient braking for the landing. When at about 1,000 ft, the crew were advised by ATC that the wind was tending more northerly and they were offered the option of landing on runway 30. For various reasons, the crew elected to continue the approach to runway 12.
The touchdown and initial deceleration was reported to be normal. When at about 60 kt and three quarters of the way through the landing roll with reverse thrust stowed and autobrakes disengaged, the captain assumed control of the landing and braking. Soon after, the braking response was not as expected and the captain increased braking pressure until no further braking could be applied. The FO reported that it felt like the aircraft was sliding or aquaplaning. The cabin crew also reported that the deceleration did not feel normal in the last portion of the landing.
The captain re-introduced reverse thrust. The FO noted that once the aircraft reached the runway threshold markings at the southern end, the aircraft’s speed decreased significantly. The aircraft overran the runway onto the sealed stopway and came to a stop about 4 m beyond the runway end.
To lengthen the life and prevent the surface from breaking up, the runway had been resealed in February 2010. Some sections of the runway had broken up and required patching, and the patching was not grooved. After the incident, the runway and stopway area were inspected. While no damage was found it was noted that there was rubber build-up around the runway 30 touchdown area; runway patching in this area had not been re-grooved.
From the evidence available, the following findings are made with respect to the reduced braking effectiveness during landing involving a Virgin Australia International Airlines Boeing 737-800, registered VH-VOP that occurred at Christchurch Airport, New Zealand on 11 May 2015. These findings should not be read as apportioning blame or liability to any particular organisation or individual.
Safety issues, or system problems, are highlighted in bold to emphasise their importance. A safety issue is an event or condition that increases safety risk and (a) can reasonably be regarded as having the potential to adversely affect the safety of future operations, and (b) is a characteristic of an organisation or a system, rather than a characteristic of a specific individual, or characteristic of an operating environment at a specific point in time.
Definitions of the following headings are provided in the section titled Terminology used in this report.
Contributing factors
Due to the crew experiencing increased workload, the crew misperceived critical landing information, which resulted in the aircraft’s landing performance being determined based on a damp (dry) runway rather than a wet runway.
The runway surface conditions combined with the autobrake selection resulted in the aircraft exceeding the landing performance limitations for runway 29 for both the reported and actual wind conditions.
Using the operator's Airport Analysis Manual to establish that the aircraft could land safely on runway 29 relied on the crew's judgement to determine the braking level required. While that judgement was consistent with the flight crew training manual, the Quick Reference Handbook indicated that a higher braking level than chosen was needed to meet the landing distance safety margin requirements.
It was very likely that the amount of water on the later part of runway 29 resulted in less than 'good' braking action. Along with the possibility of viscous aquaplaning and despite the crew applying hard braking, this water resulted in a reduced braking capability.
Several months prior to the incident, Virgin Australia Airlines/Virgin Australia International changed their policy on calculating landing performance for damp runways from referencing a wet runway to a dry runway. [Safety issue]
There was no regulatory direction from the Civil Aviation Safety Authority on how a damp runway was to be considered for aircraft landing performance.[Safety issue]
Virgin Australia Airlines/Virgin Australia International did not have a policy requiring crews to independently cross-check environmental information and landing performance calculations in-flight, removing an opportunity to detect crew errors.[Safety issue]
Other factors that increased risk
The operator provided guidance on landing performance through an uncontrolled mechanism, which did not provide assurance that crews had read, understood and applied the critical information contained within that guidance.
The flight following department did not highlight to the crew the changing weather conditions, which had the effect of minimising their landing options for Christchurch.
The subjective nature of assessing runway surface conditions and braking action, increases the risk of incorrect landing performance determination.
Civil Aviation Order 20.7.1B stipulated that a 1.15 (15 per cent) safety margin was to be applied to the actual landing distance for jet-engine aircraft with a maximum take-off weight greater than 5,700 kg. This safety margin may be inadequate under certain runway conditions, which increases the risk of a runway excursion. The corresponding guidance in Civil Aviation Advisory Publication 235-5(0) had not been updated to account for this.[Safety issue]
The inherent complexity of re-calculating landing performance data in-flight using the operator’s Quick Reference Handbook increases the risk of errors, especially during times of elevated crew workload.
Other findings
The operator's guidance was inconsistent with its policy for determining in-flight landing performance.
Initial aircraft autobraking above the required deceleration rate, combined with the crew’s application of hard manual braking and delayed stowage of reverse thrust, likely reduced the risk of a runway excursion.
The main landing gear brake pressure recording switch was faulty, therefore, the amount of brake pressure applied during landing was not recorded by the flight data recorder.
Safety analysis
Introduction
After touching down on runway 29 at Christchurch Airport, New Zealand, the aircraft did not decelerate as expected during the later stages of the landing roll. In response, the crew overrode the autobrakes, applied hard manual braking and retained the use of reverse thrust until near the runway end. The aircraft stopped about 5 m from the runway end.
A review of the recorded flight data confirmed that the approach was stable, the approach speed was normal, the aircraft landed within the touchdown zone and in proximity to the required touchdown point. Deceleration devices (speedbrakes and autobrakes) were deployed in a timely manner.
The runway was not inspected immediately following the incident. Therefore, the amount of water present during the landing was unknown. However, a later runway inspection found no indications that the later part of runway 29 was predisposed to the formation of standing water. Further, along with the brake pressures not being recorded, the ATSB was unable to establish if the runway surface friction, including the application of Gilsonite, contributed to the reduced braking capability.
This analysis will examine why the crew misperceived the runway surface conditions and how this affected the aircraft’s landing performance. It considers runway surface conditions and the terminology used to report on this. Further, the requirements and adequacy of landing distance calculations is discussed along with the operator’s policy and procedures for this. The analysis also explores the provision of weather information to crews in-flight.
Misperceived critical landing information
Citing Hart (n.d.), Orlady and Orlady (1999) defined workload as:
…a hypothetical construct that reflects the interaction between a specific individual and the demands imposed by a particular task. Workload represents the cost incurred by the human operator in achieving a particular level of performance
A person experiences workload differently based on their individual capabilities and the local conditions at the time. Kantowitz and Casper in Wiener and Nagel (1988) indicated that people are most reliable under levels of moderate workload. However, extremes of workload increases the possibility of error. It was further acknowledged that workload may be affected by factors not under the crew’s control, such as weather and communication requirements
Both crew reported experiencing a higher-than-normal workload during the later stages of the flight. Prior to the descent, the crew were of the understanding that runway 02 was in-use and they had completed their preparations for this approach. However, due to shifting wind conditions, the runway-in-use changed to runway 29. The crew were advised of this change and they subsequently commenced preparations for the revised approach. Also around this time, the crew made several track deviations due to weather. The crew's workload increased considerably having to manage the runway change and weather deviations.
Green and others (1996) also recognised that:
As the demands of the task, or the workload, are increased, the standard of our performance increases until an optimum level of workload and performance is achieved. Any increase in workload after this point leads to a degradation in performance. At extremely high levels of workload (overload), important information may be missed due to the narrowing or focusing of attention onto only one aspect of the task.
The crew’s high workload coincided with the time when critical information was conveyed by air traffic control (ATC) regarding the changing reported runway surface conditions at Christchurch (from dry to wet). The crew inadvertently missed this information and based on a pilot broadcast of the perceived runway conditions, they believed the conditions were reported as damp, rather than wet. Further, due to the higher than normal workload, the crew did not get the opportunity to listen to the automatic terminal information system reports indicating it was raining at the airport and/or the runway was wet.
Consequently, in accordance with the operator’s procedures for a damp runway, the crew determined if the aircraft could land on runway 29 based on a dry runway from the operator’s Airport Analysis Manual (AAM). If the crew had used a wet runway as a reference, the AAM would have indicated a safe landing was not possible.
Runway 29 landing performance exceeded
According to the AAM, with a wet runway surface, the aircraft’s actual landing weight was above the landing performance limit weight for both the reported and actual wind conditions by about 100 kg and 5.7 T respectively. Therefore, at the time of landing, the aircraft exceeded the AAM landing performance limitations for runway 29.
The captain assessed that the initial part of runway 29 was damp. A pilot who departed Christchurch about 30 minutes prior to VH-VOP (VOP) landing had also reported that the runway surface was damp rather than wet. However, the surface conditions were reported wet by ATC and the amount of water spray observed during the later stages of the landing indicated that this section of the runway at least was wet.
At the time of landing, the reported wind conditions from the automatic terminal information service indicated a 3 kt headwind, while the actual wind determined by the flight data recorder showed a 5 kt tailwind. Notably, the automatic weather station data was showing a change in the wind direction around this time and the automatic terminal information service issued shortly after landing indicated the wind was now variable.
The Quick Reference Handbook (QRH) landing distance charts provide a landing solution by taking into account braking selections. With AUTOBRAKE 3, as selected by the crew, for a wet runway (‘good’ reported braking action):
For the reported wind conditions, the calculated actual landing distance was within the landing distance available. However, when the 15 per cent in-flight safety margin stipulated in the Civil Aviation Safety Authority (CASA) Civil Aviation Order (CAO) 20.7.1B was applied, the landing distance required exceeded the landing distance available.
For the actual wind conditions, both the calculated actual landing distance and landing distance required exceeded the landing distance available (air distance of 305 m and reference speed plus 5 kt). However, when taking into account the reduced air distance and speed at touchdown established from the flight data recorder, the calculated actual landing distance was within the landing distance available, but the landing distance required exceeded it.
Therefore, to meet the CASA in-flight landing distance requirements, a setting of AUTOBRAKE MAX or MAX MANUAL would have been required. Landing performance calculations are designed to ensure the aircraft stops within the confines of the runway. By exceeding these requirements, the risk of an overrun event is increased.
Of significance, the QRH calculations also showed that the wet runway, 5 kt tailwind and additional effects from the runway surface conditions combined, increased the aircraft’s expected actual landing distance by about 12 per cent.
Determining brake configuration for landing
The operator’s AAM could be used both pre-dispatch and in-flight to determine if the aircraft’s expected landing weight was below the landing limit weight for each runway with the given wind and runway surface conditions. In this case, for a dry runway, the AAM indicated that the aircraft could land on runway 29.
However, unlike the QRH, the AAM does not provide a landing solution. Therefore, the crew, based on their judgement and training, determine the braking configuration required. While the crew had minimal experience landing on runway 29, their decision to use AUTOBRAKE 3 was based on their experience from operating at airports with similar runway lengths. This judgement was consistent with the guidance in the Boeing 737 flight crew training manual.
During transition training the crew were instructed to use the AAM rather than the QRH for in-flight landing performance. If the QRH had been referenced and the CAO 20.7.1B 15 per cent in-flight safety margin applied, the crew would have determined that they were unable to land on runway 29 when both dry and wet, using AUTOBRAKE 3 and with the given environmental conditions. Consequently, MAX AUTO or MAX MANUAL braking would have been required to safely land.
If a higher level of braking had been used, the aircraft would have initially decelerated at a greater rate. The aircraft would have then entered the standing water at a slower speed and likely stopped sooner.
Runway 29 surface conditions and reduced braking
A small amount of rain had passed through the Christchurch area shortly before the aircraft’s arrival. Around this time, the pilot of a departing aircraft reported the runway 29 surface conditions as ‘damp’, though the automatic terminal information service issued shortly afterwards indicated the runway was ‘wet’, equating to ‘good’ reported braking action.
After passing the runway intersection during landing, the aircraft did not decelerate as expected, and closed-circuit television footage showed a spray of water coming from the aircraft. Similarly, water spray was also observed when stowing reverse thrust. There was no runway inspection conducted immediately after the landing. Therefore, it was not possible to assess the amount of water present at the time of landing or if any tyre marks were visible. A later inspection did not detect any irregularities, although water was said to sometimes pool on the later part of the runway.
Despite the first officer (FO) applying manual braking in excess of the AUTOBRAKE 3 selection and the captain assisting, the aircraft’s deceleration reduced rather than increased. This was consistent with Boeing’s assessment via simulations that the runway conditions were initially likened to a wet runway and then with a flooded runway after the intersection.
Further, the crew indicated that, when sensing the antiskid operating they were applying close to or maximum manual braking effort. This, combined with the minor directional deviation, showed that there were variations in the runway surface friction. Also, runway 11/29 was not grooved at the time, which was known to reduce aircraft braking capability and affect directional control.
When referencing the United States Federal Aviation Administration (FAA) runway condition assessment matrix, the noticeably reduced braking capability of the aircraft with near to maximum manual braking being applied and the minor directional deviation would indicate that the braking action was ‘good to medium’ or ‘medium’ during the later stages of the landing. Therefore, it was very likely that the amount of water on the later part of runway 29 did exceed the limits that would achieve a 'good' braking action.
Although there was no physical evidence of reverted rubber aquaplaning and the aircraft’s speed after passing the runway intersection was below the minimum speeds required for dynamic aquaplaning, viscous aquaplaning could not be discounted.
Therefore, despite the crew applying hard braking, the amount of water on the runway along with the possibility of viscous aquaplaning resulted in a reduced braking capability of the aircraft.
Operator’s change in damp runway definition
Several months prior to the incident, the Virgin Australia Airlines/Virgin Australia International’s policy on calculating performance for a damp runway changed. The policy changed from a damp runway being considered wet to now being treated as dry. The crew were aware of the change in definition, and believing the runway surface conditions were damp, they determined if the aircraft was able to land based on a dry runway. This established that they could land on runway 29. The crew were also aware that they could not land if the runway was wet.
Irrespective of the crew’s incorrect understanding of the runway condition, if the operator’s previous definition had applied at the time, the crew would have used wet instead of dry landing performance data. This would have likely resulted in the crew seeking an alternative landing solution such as changing runways (if available), holding to burn off fuel or diverting to another airport.
Regulatory direction regarding damp runways
While the term ‘damp’ was used by air traffic service providers and airport operators internationally to describe runway surface conditions, it was not used by CASA or by major aircraft manufacturers for providing performance data. Consequently, there was no regulatory direction from CASA to operators on how a damp runway was to be considered for performance purposes. Instead, it was the operator who determined if a damp runway was treated as dry or wet. In this case, the definition adopted by Virgin Australia Airlines/Virgin Australia International was based on operational requirements and that used the by European Aviation Safety Agency.
In addition, the term has been applied inconsistently among Australian operators. This is of particular concern since research has shown that a damp runway may not provide an equivalent braking surface as a dry runway. This increases the risk of an excursion as a result of overestimating an aircraft’s braking efficiency.
Cross-checking environmental information and landing performance
Cross-checking is a fundamental element in all multi‑crew operations, and is a vital mechanism for detecting errors. For example, when one crew member calculates aircraft performance, the other cross-checks the base-line data (including the environmental information) and calculation, or duplicates the calculation. The absence of a cross-check removes an opportunity for crews to identify errors before they lead to consequences.
At the time of the incident, Virgin Australia Airlines/Virgin Australia International had a policy requiring crews to cross‑check take-off performance data. However, there was no such requirement for cross-checking in-flight environmental information and landing performance calculations. An informal review of other Australian operators found that one or both of these were to be cross‑checked. For example, one operator requires the automatic terminal information service details, in particular the QNH, to be verified and viewed by more than one crew member.
An exploratory study of error detection processes during normal line operations conducted by Thomas and others (2004) found that 57 per cent of all errors observed remained undetected by the crew. The study also identified that cross-checking and monitoring of other crew actions was the most frequently observed error detection process. Overall, the authors concluded:
With reference to the errors that were detected, the result of this study suggest that error detection is more easily accomplished by the crew-member who was not responsible for the error. Accordingly, this study emphasised the importance of crew cooperation in the multi-crew environment and highlights the essential role of monitoring and cross-checking in maintaining safety.
When the captain, as the pilot monitoring, obtained the environmental information (automatic terminal information service) from ATC, the FO was focusing on his pilot flying duties and was not as attentive to the details provided. Therefore, cross-checking the landing performance calculations alone would not have identified the misperceived runway conditions as the FO was also of the understanding that the runway conditions were damp. However, in-line with the research above, if the FO had to independently cross-check the environmental information, it was likely that he would have identified that the runway conditions were in fact wet. The subsequent cross-check of the landing performance calculations using this information would have established that they could not land on runway 29 at that time.
Guidance provided through an uncontrolled mechanism
While it was recognised that the operator was providing crews with clarification on the CAO 20.7.1B changes, the ‘Q and A’ guidance contained critical information regarding landing performance determination. As this guidance was only accessible on the operator's intranet, there was no mechanism for knowing who had read the information. Therefore, the operator could not be assured that the critical information contained in the Q and A had been read, understood and uniformly applied by crews.
Flight following
Crews should be made aware of changing weather conditions that potentially reduce their landing options available at the intended destination. This would assist crews with deciding whether to continue to their destination, hold until the conditions improve or to burn off fuel (to decrease landing weight), or divert to another airport.
After reviewing the Christchurch aerodrome forecast prior to departing Sydney, the crew were expecting rain later in the morning. However, an amended forecast was issued while the aircraft was en route, indicating light rain for their arrival. The operator assessed that this change in conditions was not operationally critical and therefore, the information was not passed to the crew. While the crew could obtain the weather in-flight by other means and were later advised by ATC of rain at the airport, the forecast rain reduced their landing options at Christchurch. The aircraft was unable to land on runway 29 when wet, runway 20 was closed due to the works in progress and the wind conditions were least favourable for runway 02 at the time.
If the above weather information had been provided to the crew earlier in the flight through flight following services, particularly during a period of low workload, this would have allowed them more time to consider the implications and assess alternatives. An increased awareness of the changing conditions may have also acted as a primer for the information later provided by ATC regarding the runway surface conditions.
Subjective assessment of runway conditions
It has been widely recognised by industry that runway surface conditions and pilot braking action reports are subjective and the terminology used to describe these are inconsistent. In this incident, this issue was highlighted by the differences in how the runway conditions were assessed by the pilot of the previously departing aircraft, the crew of VOP, the aircraft’s actual performance as recorded by the flight data recorder, and what was recorded by the automatic terminal information service.
Various organisations have highlighted that ambiguous braking action reports may result in a miscalculation of the landing rollout length. This was confirmed by the ATSB’s calculations utilising the QRH for the Boeing 737. These calculations showed that, in some circumstances, if the runway surface conditions and braking action were under-reported, the landing performance would also be underestimated. This subsequently reduces, and in some cases exceeds safety margins.
The Southwest Airlines overrun accident led to the FAA instigating the development and implementation of a runway condition assessment matrix. This matrix will assist in achieving a harmonised, consistent approach to assessing runway conditions.
In-flight landing distance safety margin
As highlighted by the International Civil Aviation Organization, operational margins should cover for a reasonable error in runway condition assessment. However, a misreported condition may mean that margins are no longer available to account for other operational variances.
The FAA recommended that ‘at least’ or ‘a minimum’ of a 15 per cent safety margin should be added to actual landing distance calculations as a minimum acceptable margin for normal operations. However, in response to several landing events, in late 2015 (after this incident), the FAA recognised that 15 per cent may be inadequate under certain wet runway conditions and subsequently encouraged operators to apply additional conservatism.
While the FAA has recognised that the margin had not been substantiated, they, combined with the ATSB’s calculations, show that the safety margin may be inadequate under certain conditions. Specifically, the ATSB found that underestimating these conditions may diminish, and in some circumstances, exceed the 15 per cent safety margin applied to the landing performance data.
CASA introduced the 15 per cent in-flight safety margin for landing distance requirements in the 2014 amendment to CAO 20.7.1B based on the FAA recommendation, but did not include the provision of ‘at least’ or ‘a minimum of…’. CASA advised the ATSB that the CAO is a document that contains legal requirements and as such, is not expressed in terms of ‘at least the following…’ or ‘a minimum of…’. Further, CASA indicated that regulatory requirements represent the absolute minimum required by law and it is incumbent on the operator to determine if they need to operate, or if circumstances dictate they should operate, above the regulatory minimum. The corresponding Civil Aviation Advisory Publication (235-5(0)) to the CAO 20.7.1B amendment provided guidance and explanatory information about the changes made. This publication also stipulated a 15 per cent in-flight safety margin.
Although not considered to have contributed to this incident, in some circumstances there is an increased risk of a runway excursion by only using the 15 per cent in-flight safety margin instead of ‘a minimum of…’ or ‘at least’ 15 per cent. Civil Aviation Advisory Publication 235-5(0) would provide a suitable mechanism for highlighting the FAA’s observations and encouraging additional conservatism above the minimum regulatory requirement of 15 per cent.
When compared with other methods for establishing landing performance, such as the AAM and electronic devices, the operator’s QRH is more complex. To determine the actual landing distance using the QRH, seven adjustments are required to be calculated by the crew: weight, altitude, wind, runway slope, temperature, approach speed and use of reverse thrust. These adjustments are added/subtracted from a reference distance to determine the aircraft's actual landing distance. The CAO 20.7.1B 15 per cent safety margin is then added onto the resultant actual landing distance to establish the landing distance required. This complexity may increase if the adjustments are to be interpolated rather than rounded to the nearest conservative value.
The QRH normal configuration landing distance charts would generally be referenced by crews in‑flight when there was a change from the pre-dispatch conditions, such as the runway surface conditions, the runway-in-use or diverting to another airport. A change in conditions would typically increase workload experienced by crew. As shown in this incident, the change in runway-in-use, combined with the weather deviations, increased the crew’s workload. It is well‑known that crew experiencing a high workload will be more likely to make errors. As previously discussed, effective cross-checking can assist with error detection and may provide the last line of defence against an occurrence. However, measures to prevent errors in the first place should be implemented when possible.
Operator’s landing performance policy and guidance inconsistent
At the time of the incident, the operator’s policy stipulated that the AAM was to be used for determining landing performance. While it was recognised that the operator was in discussions with CASA regarding the CAO 20.7.1B changes, the policy differed from the guidance provided in the Virgin Australia Q and A. The Q and A indicated that the AAM was to be used pre-dispatch and the QRH used in-flight. However, it was not known if the inconsistency between the policy and guidance resulted in confusion among crews. Irrespective, CAO 20.7.1B allowed both the AAM (certified data) and QRH (advisory data) to be used to establish landing performance in-flight.
Further, during transition training for the incorporation of Virgin Australia New Zealand into Virgin Australia International, the New Zealand crews were instructed to use the AAM to determine their in-flight landing performance. This was considered an interim measure until the operator’s policy had been updated to reflect the CAO 20.7.1B changes. However, the Q and A guidance advised crews to use the QRH in‑flight. While the crew of VOP were not aware of the Q and A prior to the incident, their transition training was consistent with the policy but contradicted the guidance.
Crew’s actions prevented a runway excursion
According to the AAM, the aircraft was unable to land on runway 29 when wet. The QRH indicated that, for a wet runway with ‘good’ reported braking action, the actual landing distance was marginally less than the landing distance available with the actual reduced air distance and reference speed. However, the surface conditions on the later part of the runway likely resulted in less than ‘good’ reported braking action, which reduced the aircraft’s braking capability. Consequently, the aircraft was stopped about 5 m from the runway end. It was likely that the initial exceedance of the AUTOBRAKE 3 deceleration rate, combined with the crew's application of hard manual braking and retaining reverse thrust prevented a runway excursion.
Safety issues and actions
The safety issues identified during this investigation are listed in the Findings and Safety issues and actions sections of this report. The Australian Transport Safety Bureau (ATSB) expects that all safety issues identified by the investigation should be addressed by the relevant organisation(s). In addressing those issues, the ATSB prefers to encourage relevant organisation(s) to proactively initiate safety action, rather than to issue formal safety recommendations or safety advisory notices.
Depending on the level of risk of the safety issue, the extent of corrective action taken by the relevant organisation, or the desirability of directing a broad safety message to the aviation industry, the ATSB may issue safety recommendations or safety advisory notices as part of the final report.
The initial public version of these safety issues and actions are repeated separately on the ATSB website to facilitate monitoring by interested parties. Where relevant the safety issues and actions will be updated on the ATSB website as information comes to hand.
Change in ‘damp’ definition for performance purposes
Several months prior to the incident, Virgin Australia Airlines/Virgin Australia International changed their policy on calculating landing performance for damp runways from referencing a wet runway to a dry runway.
Virgin Australia Airlines/Virgin Australia International did not have a policy requiring crews to independently cross-check environmental information and landing performance calculations in‑flight, removing an opportunity to detect crew errors.
In-flight landing distance safety margin may be inadequate
Civil Aviation Order 20.7.1B stipulated that a 1.15 (15 per cent) safety margin was to be applied to the actual landing distance for jet-engine aircraft with a maximum take-off weight greater than 5,700 kg. This safety margin may be inadequate under certain runway conditions, which increases the risk of a runway excursion. The corresponding guidance in Civil Aviation Advisory Publication 235‑5(0) had not been updated to account for this.
Additional safety action
Whether or not the ATSB identifies safety issues in the course of an investigation, relevant organisations may proactively initiate safety action in order to reduce their safety risk. The ATSB has been advised of the following proactive safety action in response to this occurrence.
Operational restrictions at Christchurch
The operator issued a flight crew operational notice, effective from 12 May 2015 and valid until 23 July 2015, indicating that runway 11/29 at Christchurch was not be used when the runway surface conditions were reported ‘damp’ or ‘wet’, unless an overriding emergency dictated otherwise. The availability of the runway under those conditions would be reviewed once their internal investigation had been completed. This restriction was later removed after runway 29 was grooved and the operator’s internal investigation had been completed.
Simulator training
As a result of this incident, the operator incorporated crew training on landing distance calculations, touchdown points, and manual braking techniques following autobrake disconnection into their recurrent simulator sessions.
Safety margin incorporated into the actual landing distance charts
Subsequent to the incident, the operator has advised the ATSB that they are in the process of having the 15 per cent safety margin incorporated into the actual landing distance charts in the Performance In-flight section of the Quick Reference Handbook (QRH).
Civil Aviation Authority of New Zealand
The Civil Aviation Authority of New Zealand highlighted that any braking action report from the airport operator would need to be standardised, although previous efforts to do this via friction testing has had limited acceptance worldwide. However, the United States Federal Aviation Administration runway condition assessment matrix, in real-time, provides standardised information. This, along with using the associated takeoff and landing performance assessment procedures, which have already been accepted by aircraft manufacturers, can provide reliable and repeatable certified landing performance data. Standardised pilot braking action reports combined with the use of the matrix can potentially provide useful guidance. As of 31 July 2018, the Civil Aviation Authority of New Zealand Civil Aviation Rules Part 139.103 (b) (3) states that an aerodrome maintenance program must:
…provide for the measurement and provision of real-time surface condition reporting when a runway is contaminated using standardised reporting methods.
The above rule will allow guidance on braking action reporting to be more readily incorporated into operational procedures.
Sources and submissions
Sources of information
The sources of information during the investigation included:
the crew of VH-VOP
Virgin Australia Airlines/Virgin Australia International
New Zealand Transport Accident Investigation Commission
Civil Aviation Safety Authority. (2013). Consultation Draft – Amendment of CAO 20.7.1B and CAO 20.7.4: Briefing document – May 2013.
Civil Aviation Safety Authority. (2014a). New performance provisions for CAO 20.7.1B and CAO 20.7.4 (Civil Aviation Advisory Publication 235-5(0)).
Civil Aviation Safety Authority. (2014b). Notice of final rule making: Aeroplane weight & performance limitations (NFRM OS 13/03).
Civil Aviation Safety Authority. (2014c). Civil Aviation Order 20.7.1B – Aeroplane weight and performance limitations – specified aeroplanes above 5 700 kg, or 2 722 kg if driven by 2 or more jet engines – all operations. Retrieved from www.legislation.gov.au/Details/F2014C01352
Dismukes, R.K., Berman, B.A., & Loukopoulos, L.D. (2007). The limits of expertise: Rethinking Pilot Error and the Causes of Airline Accidents. Aldershot, Ashgate.
European Aviation Safety Agency. (2016). Notice of Proposed Amendment 2016-11: Review of aeroplane performance requirements for commercial air transport operations. Retrieved from www.easa.europa.eu/system/files/dfu/NPA%202016-11.pdf
Federal Aviation Administration. (2006). Landing Performance Assessment at Time of Arrival (Turbojets) (Safety Alert to Operators SAFO 06012).
Federal Aviation Administration. (2015a). Turbojet Braking Performance on Wet Runways (Safety Alert to Operators SAFO 15009). Retrieved from www.nbaa.org/ops/safety/SAFO15009.pdf
Federal Aviation Administration. (2016). Frequently Asked Questions about the Take-off and Landing Performance Assessment (TALPA) Initiative for Airport Operators.
Green, R.G., Muir, H., James, M., Gradwell, D., & Green, R.L. (1996). Human factors for pilots (2nd ed.). Aldershot: Ashgate.
Harris,D. (2000). Human Performance on the Flight Deck. Surrey: Ashgate.
International Air Transport Association. (2011). Preventing Runway Excursions: Landing on wet/Contaminated Runways. Retrieved November 13, 2015.
International Air Transport Association. (2016). Guidance Material for Improving Flight Crew Monitoring (1st ed.).
International Civil Aviation Organization. (n.d.). Manual of Aircraft Accident and Incident Investigation (DOC 9756-AN/965). Montreal, Canada: International Civil Aviation Organization.
International Civil Aviation Organization. (2016). Adoption of Amendment 13 to Annex 14, Volume I (letter AN 4/1.2.26-16/19). Montreal, Canada: International Civil Aviation Organization.
Jenkins, M., & Aaron Jnr, R.F. (2012). Reducing runway landing overruns, Boeing AERO, 47, 15‑19.
National Academies of Sciences, Engineering, and Medicine. (2008) Analysis of Aircraft Overruns and Undershoots for Runway Safety Areas. Retrieved from www.trb.org/Publications/Blurbs/159849.aspx
National Transportation Safety Board. (2007). Runway Overrun and Collision, Southwest Airlines Flight 1248, Boeing 737-7H4, N471WN, Chicago Midway International Airport, Chicago, Illinois. December 8, 2005 (NTSB/AAR-07-06). Retrieved from www.ntsb.gov/investigations/AccidentReports/Reports/AAR0706.pdf
Orlady, H.W., & Orlady, L.M. (1999). Human Factors in Multi-Crew Flight Operations. Aldershot: Ashgate.
Yager, T.J. (1969). Comparative braking performance of various aircraft on grooved and ungrooved pavements. Retrieved from ntrs.nasa.gov/search.jsp?R=19690011092
Submissions
Under Part 4, Division 2 (Investigation Reports), Section 26 of the Transport Safety Investigation Act 2003 (the Act), the Australian Transport Safety Bureau (ATSB) may provide a draft report, on a confidential basis, to any person whom the ATSB considers appropriate. Section 26 (1) (a) of the Act allows a person receiving a draft report to make submissions to the ATSB about the draft report.
A draft of this report was provided to the crew of VH-VOP, Virgin Australia Airlines/Virgin Australia International, the Civil Aviation Safety Authority, the Civil Aviation Authority of New Zealand, the New Zealand Transport Accident Investigation Commission, The Boeing Company, and the National Transportation Safety Board.
Submissions were received from the crew of VH-VOP, Virgin Australia Airlines/Virgin Australia International, the Civil Aviation Safety Authority, the Civil Aviation Authority of New Zealand, and The Boeing Company. The submissions were reviewed and where considered appropriate, the text of the report was amended accordingly.
Terminology used in this report
Occurrence: accident or incident.
Safety factor: an event or condition that increases safety risk. In other words, it is something that, if it occurred in the future, would increase the likelihood of an occurrence, and/or the severity of the adverse consequences associated with an occurrence. Safety factors include the occurrence events (e.g. engine failure, signal passed at danger, grounding), individual actions (e.g. errors and violations), local conditions, current risk controls and organisational influences.
Contributing factor: a safety factor that, had it not occurred or existed at the time of an occurrence, then either: (a) the occurrence would probably not have occurred; or (b) the adverse consequences associated with the occurrence would probably not have occurred or have been as serious, or (c) another contributing factor would probably not have occurred or existed.
Other factors that increased risk: a safety factor identified during an occurrence investigation, which did not meet the definition of contributing factor but was still considered to be important to communicate in an investigation report in the interests of improved transport safety.
Other findings: any finding, other than that associated with safety factors, considered important to include in an investigation report. Such findings may resolve ambiguity or controversy, describe possible scenarios or safety factors when firm safety factor findings were not able to be made, or note events or conditions which ‘saved the day’ or played an important role in reducing the risk associated with an occurrence.
Safety issue: a safety factor that (a) can reasonably be regarded as having the potential to adversely affect the safety of future operations, and (b) is a characteristic of an organisation or a system, rather than a characteristic of a specific individual, or characteristic of an operational environment at a specific point in time.
Safety action: the steps taken or proposed to be taken by a person, organisation or agency in response to a safety issue.
Appendices
Appendix A – Christchurch aerodrome forecasts (TAFs) and automatic terminal information service (ATIS)
OPR INFO: RUNWAY 02 REDUCED LENGTH DUE WORK IN PROGRESS NORTH REFER NOTAM BRAVO 2400 AND YELLOW PAGES
WIND: 010/08
VIS: 40KM
CLD: NSC
TEMPERATURE: 16
DEW POINT: 06
QNH: 992
2000FT WIND: REPORTED 350/26
ATIS Y
ATISNZ NZCH Y 1136
APCH: VA
RWY: 29
SFC: DRY
OPR: RWY02 RED LEN DUE WIP N REF B2400 AND YEL PGS
WIND: 250/12 MAX18
VIS: 40KM
PWX: RA
CLD: SCT060
TT: 14
DP: 08
QNH: 993
2000FT: R350/26
PAC: IAB
ATIS Z
ATISNZ NZCH Z 1150
APCH: VA
RWY: 29
SFC: WET
OPR: RWY02 RED LEN DUE WIP N REF B2400 AND YEL PGS
WIND: 250/10 MAX15
VIS: 20KM
PWX: -RA
CLD: BKN060
TT: 13
DP: 09
QNH: 993
2000FT: R350/26
PAC: IAB
ATIS A
ATISNZ NZCH A 1157
APCH: VA
RWY: 29
SFC: WET
OPR: RWY02 RED LEN DUE WIP N REF B2400 AND YEL PGS
WIND: 220/07
VIS: 20KM
PWX:
CLD: BKN070
TT: 13
DP: 09
QNH: 993
2000FT: R350/26
PAC: IAB
ATIS B
ATISNZ NZCH B 1217
APCH: RNAV
RWY: 02
SFC: DAMP
OPR: RWY02 RED LEN DUE WIP N REF B2400 AND YEL PGS
WIND: VRB03
VIS: 30KM
PWX:
CLD: NSC
TT: 12
DP: 09
QNH: 991
2000FT: R280/20
PAC: IAB
Appendix B – VH-VOP deceleration during landing
The AUTOBRAKE 3 target deceleration rate compared with the average deceleration for VH-VOP measured in g’s, where negative values indicate deceleration (left axis), and the computed airspeed and groundspeed (right axis) from just prior to touchdown on runway 29.
Source: ATSB
Appendix C – Airport Analysis Manual landing performance chart for flap 40
Source: Virgin Australia Airlines
Appendix D –Quick Reference Handbook normal configuration landing distance chart for flap 40
Source: Virgin Australia Airlines
Appendix E – Runway condition assessment matrix (RCAM)
Source: Federal Aviation Administration
Purpose of safety investigations & publishing information
Purpose of safety investigations
The objective of a safety investigation is to enhance transport safety. This is done through:
identifying safety issues and facilitating safety action to address those issues
providing information about occurrences and their associated safety factors to facilitate learning within the transport industry.
It is not a function of the ATSB to apportion blame or provide a means for determining liability. At the same time, an investigation report must include factual material of sufficient weight to support the analysis and findings. At all times the ATSB endeavours to balance the use of material that could imply adverse comment with the need to properly explain what happened, and why, in a fair and unbiased manner. The ATSB does not investigate for the purpose of taking administrative, regulatory or criminal action.
Terminology
An explanation of terminology used in ATSB investigation reports is available here. This includes terms such as occurrence, contributing factor, other factor that increased risk, and safety issue.
Publishing information
Released in accordance with section 25 of the Transport Safety Investigation Act 2003
Ownership of intellectual property rights in this publication
Unless otherwise noted, copyright (and any other intellectual property rights, if any) in this report publication is owned by the Commonwealth of Australia.
Creative Commons licence
With the exception of the Coat of Arms, ATSB logo, and photos and graphics in which a third party holds copyright, this publication is licensed under a Creative Commons Attribution 3.0 Australia licence.
Creative Commons Attribution 3.0 Australia Licence is a standard form licence agreement that allows you to copy, distribute, transmit and adapt this publication provided that you attribute the work.
The ATSB’s preference is that you attribute this publication (and any material sourced from it) using the following wording: Source: Australian Transport Safety Bureau
Copyright in material obtained from other agencies, private individuals or organisations, belongs to those agencies, individuals or organisations. Where you wish to use their material, you will need to contact them directly.
On 6 August 2014, at about 0500 Eastern Standard Time (EST), the pilot of a Fairchild SA227 aircraft, registered VH-UZI, conducted a pre-flight inspection and weight and balance calculations for a freight charter flight from Rockhampton to Townsville, Queensland.
During the take-off run, the pilot reported all indications and performance were normal passing 70 knots. Passing V1, as the pilot increased the back pressure on the control yoke to rotate the aircraft for take-off, the control column felt heavy and the aircraft nose wheel did not lift off the ground. The pilot continued to increase the back trim and back pressure on the control yoke and the ‘out of trim’ warning sounded. The pilot rejected the take-off, applied maximum braking and reverse thrust.
After taxiing the aircraft back to the parking bay, the pilot requested the freight be re-weighed. The pilot then recalculated the aircraft weight and balance with the actual freight distribution and found the centre of gravity slightly more forward than the original load sheet position.
The pilot set the stabiliser trim gauge in the cockpit to read a nose up attitude, and then externally inspected the position of the stabiliser. He observed the stabiliser in a neutral position and therefore determined that the gauge did not accurately indicate the stabiliser position. The pilot assessed that the combination of the incorrectly loaded freight causing a more forward centre of gravity and the inaccurate stabiliser trim gauge led to the out of trim warning and overly heavy control pressure required for the attempted take-off.
The stabilizer trim potentiometer in the aircraft was replaced which resolved the fault.
On 20 February 2014, Virgin Australia Regional Airlines (VARA) was operating an ATR 72 aircraft, registered VH-FVR, on a scheduled passenger flight from Canberra to Sydney. During descent with the autopilot in vertical speed mode, the first officer as pilot flying was manually adjusting engine power to maintain the airspeed around the target of 235 kt.
While passing through about 8,500 ft, the aircraft encountered a significant windshear that resulted in a rapidly decreasing tailwind. This led to a rapid increase in airspeed, with the airspeed trend vector (displaying predicted speed on the primary flight display) likely indicating well above the maximum operating speed (VMO) of the aircraft of 250 kt. The first officer reduced engine power and made nose-up control inputs in an attempt to slow the aircraft.
In response to the unexpectedly high airspeed trend indication and their proximity to VMO, the captain (pilot not flying) perceived a need to take over control of the aircraft, with the intention of preventing the airspeed exceeding VMO. The captain took hold of the controls and made nose-up pitch control inputs without immediately following the specified take-over procedure and alerting the first officer of his intent.
About 1 second after the captain initiated the nose-up control inputs, the first officer (unaware that the captain was also making control inputs) reversed his control input. The differential forces in the left (captain) and right (first officer) pitch control systems reached the threshold to activate the pitch uncoupling mechanism, disconnecting the left and right pitch control systems from each other.
The captain completed the take-over by announcing he had control about 5–6 seconds after taking hold of the controls. However, before the takeover procedure was completed, the addition of the captain’s and first officer’s nose-up control inputs resulted in a pitching manoeuvre that exceeded the limit load factor for the aircraft.
Given the high airspeed, asymmetric elevator deflections that occurred immediately following the pitch disconnect event resulted in aerodynamic loads that exceeded the strength of the horizontal stabiliser and resulted in significant damage to the stabiliser.
At the start of the pitching manoeuvre, the senior cabin crew member was unrestrained in the rear of the cabin as she waited for a passenger to return to their seat. When the aircraft pitched back down, the cabin crew member was thrown from her seat and suffered a broken leg.
The flight crew continued the flight using one of the pitch control systems and landed without further incident at Sydney.
Based on the crew report of an in-flight pitch disconnect associated with moderate turbulence, and data recorded by the aircraft’s on board maintenance systems, VARA maintenance watch arranged for the contracted approved maintenance organisation, Toll Aviation Engineering, to carry out the applicable maintenance. However, the licenced aircraft maintenance engineers involved in the Inspection after flight in turbulence and/or exceeding VMO did not carry out the specified general visual inspection of the stabilisers probably because of a breakdown in the coordination and certification of the inspection tasks between the engineers. The damaged horizontal stabiliser was not detected and the aircraft was released to service.
VH-FVR under tow following completion of post-occurrence maintenance. The angle of the horizontal stabiliser relative to the angle of the wings indicates substantial structural deformation.
Source: Sydney Airport
During the next 5 days the aircraft was operated on 13 flights and was subject to routine walk‑around visual inspections by flight crew and engineers. No one identified any anomalies until flight crew observed some damage after a suspected bird strike. The aircraft was grounded and subjected to extensive maintenance that included replacement of the horizontal and vertical stabilisers.
Upper tailplane of VH-FVR showing damage to horizontal and vertical stabilisers that was evident when the damage was identified 5 days and 13 flights after the in-flight upset/pitch disconnect and associated maintenance.
Source: ATSB
What the ATSB found
In-flight upset and pitch disconnect
The ATSB identified a number of operational factors that contributed to the in-flight upset and pitch disconnect.
During the descent, when the sterile flight deck policy was applicable, the flight crew engaged in non-pertinent conversation. This distracted the crew and probably reduced their ability to monitor and respond to fluctuations of airspeed.
While passing through about 8,500 ft on descent into Sydney, the aircraft encountered a significant windshear that resulted in a rapidly decreasing tailwind. This led to a rapid increase in the airspeed, with the airspeed trend vector likely indicating well above the maximum operating speed (VMO).
In response to the unexpectedly high airspeed trend indication, and their proximity to VMO, the captain (pilot not flying) perceived a need to immediately intervene, and made pitch control inputs before following the normal take-over procedure and alerting the first officer (pilot flying).
The addition of the captain’s and first officer’s nose-up control inputs resulted in a pitching manoeuvre that exceeded the limit load factor for the aircraft.
The magnitude of the captain's nose-up control input was probably greater than he intended, due to his response to a high stress level, but increased the probability that the aircraft's limit load factor would be exceeded.
Shortly after the captain initiated the nose-up control inputs, the first officer reversed his control input. The differential forces in the left (captain) and right (first officer) pitch control systems were sufficiently large to inadvertently activate the pitch uncoupling mechanism, disconnecting the left and right pitch control systems.
Given the high airspeed, the asymmetric elevator deflections that occurred immediately following the pitch disconnect event resulted in aerodynamic loads on the tailplane that exceeded its strength and damaged the horizontal stabiliser.
During the course of this investigation, the ATSB became aware that other in-flight pitch disconnect occurrences had occurred in ATR 72 aircraft and considered that the related procedural controls were not sufficiently effective. To alert the effected parties, the ATSB published an interim report (15 June 2016) with the following safety issue:
Inadvertent application of opposing pitch control inputs by flight crew can activate the pitch uncoupling mechanism which, in certain high-energy situations, can result in catastrophic damage to the aircraft structure before crews are able to react.
After further investigation, the ATSB published a second interim report (5 May 2017) in support of another safety issue that related to concern about transient elevator deflections in ATR 72 aircraft. The ATSB issued three recommendations to key stakeholders to address the following safety issue:
The aircraft manufacturer did not account for the transient elevator deflections that occur as a result of the system flexibility and control column input during a pitch disconnect event at all speeds within the flight envelope. As such, there was no assurance that the aircraft had sufficient strength to withstand the loads resulting from a pitch disconnect.
Further ATSB analysis identified another four safety issues that relate to different aspects of the ATR pitch control system and related design standards.
The design of the ATR 72 pitch control system resulted in limited tactile feedback between the left and right control columns, reducing the ability of one pilot to detect that the other pilot is making control inputs. In addition, there were no visual or auditory systems to indicate dual control inputs.
Flexibility in the ATR 72’s pitch control system between the control columns results in a change in the aircraft’s longitudinal handling qualities and control dynamics when dual control inputs are made. This could result in an aircraft-pilot coupling event where flight crew may find it difficult to control the aircraft.
The (European) design standard for large transport aircraft, Joint Aviation Requirements - Part 25 (JAR-25), did not require that the demonstrated potential for flexibility in the control system to develop transient dynamic loads, be considered during certification. Similarly, the current certification standard for Large Aeroplanes (CS-25) does not address this issue.
Although the design standard for the aircraft (JAR-25) required the control system to be of sufficient strength to withstand dual control inputs, it did not require consideration of the effect that dual control inputs may have on control of the aircraft. Similarly, the current design standard (CS-25) does not address this issue.
Inspection and continued operation
Further to establishing that the damage went undetected because the aircraft tail was not inspected in accordance with the turbulence/VMO exceedance job instruction card, the ATSB identified other maintenance-related factors that increased risk:
ATR (aircraft manufacturer) did not provide a maintenance inspection to specifically assess the effect of an in-flight pitch disconnect. As a result, if an in-flight pitch disconnect occurred, the aircraft may not be inspected at a level commensurate with the criticality of the event. And, as a legacy of there being no inspection specific to an in-flight pitch disconnect, there is potential for other ATR aircraft to have sustained an in-flight pitch disconnect in the past and be operating with undetected horizontal stabiliser damage.
In the job instruction card JIC 05-51-11 DVI 10000 Inspection after flight in turbulence and/or exceeding VMO, ATR (aircraft manufacturer) did not specify the ground support equipment required or clearly state that the general visual inspection (GVI) of the stabilisers included a close examination of the upper surface. Given engineers tasked with the inspection may not be aware that ATR referred to the standard definition of a GVI, there was a risk that engineers tasked with the inspection would not interpret the card correctly.
Toll Aviation Engineering (approved maintenance organisation) did not define, document, or otherwise assure the intended arrangements for coordination of maintenance at line maintenance stations, which allowed for the development of local operating practices that were not consistent with the expectations of an approved maintenance organisation management.
Although Toll Aviation Engineering (approved maintenance organisation) specified fatigue management procedures, the licenced aircraft maintenance engineers (LAMEs) who were involved in the inspection after flight in turbulence and/or exceeding VMO operated outside the nominated hours of work. As such, the LAMEs were at risk of fatigue on the day of the inspection and/or the day following.
What's been done as a result
Initial safety action
In March 2014, VARA issued an airworthiness memo about release to service of ATR aircraft following an in-flight pitch disconnect. Then, in June 2014, VARA provided guidance to ATR pilots about descent procedures and potential airspeed limitation exceedances. VARA and the subsequent operator of ATR aircraft, Virgin Australia Airlines (VAA), reviewed and revised operational procedures and guidance relevant to the occurrence, and added elements to their training and checking processes.
In June 2014, Toll Aviation Engineering (TAE) provided guidance to maintenance personnel about safety reporting. Later, in February 2016, Toll Aviation and TAE issued a safety alert to affected personnel to advise that an aircraft was to be grounded for maintenance after an in-flight pitch disconnect. As the operator of ATR 42 aircraft, Toll Aviation informed flight crews of ATR and EASA communications and added applicable elements to their training and checking processes.
ATR released an All Operators Message in February 2016 to inform operators of revised maintenance and operational documentation relating to the pitch control system and pitch disconnect occurrences. The revised documentation included the requirement for a detailed visual inspection after an in-flight pitch disconnect.
The European Aviation Safety Agency (EASA) released Safety Information Bulletin 2016-20R1 in December 2016 to highlight the risks associated with rapid and large alternating control inputs and the addition of ‘Inappropriate Flight Control Inputs’ to its risk portfolio.
Further and ongoing safety action
In response to safety issues identified by the ATSB, ATR advised that they would conduct a short risk assessment of continued operation and conduct a detailed engineering analysis of the transient elevator loads during a pitch disconnect. From the risk assessment completed by December 2016, ATR found that no further action was required in the short term.
For the engineering analysis, ATR developed an analytical model supported by ground and flight testing. In the worst jammed controls scenario considered, the loads resulting from transient elevator deflections associated to a pitch disconnect at VMO would slightly exceed the certification ultimate loads. ATR considers that the structural assessment performed for the jamming loads envelope demonstrates that the structure is capable to sustain this load increase with positive strength margins.
The ATR engineering analysis also identified that the elasticity of the cables had two notable effects on the jammed control column scenario. First, the pilot effort required to activate the pitch uncoupling was excessively high at VMO. Second, the residual pitch authority allowed flight crew to decelerate the aircraft before uncoupling. In response, ATR revised the pitch channel jamming procedure.
The ATSB notes that ATR has not advised of any engineering analysis concerning the effect of transient elevator deflections resulting from pitch uncoupling activated by dual control inputs (no jamming). In that regard, ATR advise that they issued the all operators message in February 2016 and the following actions have been taken at various industry levels:
EASA released the SIB 2016‐20 to highlight the risks associated to rapid and large alternating control inputs.
EASA added the ‘Inappropriate Flight Control Inputs’ item to its risk portfolio in the frame of their risk management system, recognising this is an industry concern. It will cover the issue of simultaneous inputs, as well as inputs of large amplitude or frequency inadequate for the flight phase at the event.
Paragraph 5.3 of the ICAO Airplane Upset Prevention and Recovery Training Aid revision 3 (AUPRTA:
) highlights the risk of upset induced by pilot excessive input.
ATR advise that at this point the continued airworthiness of the ATR 42/72 fleet is assured but recognise they must continue to analyse threats such as these. Indeed, ATR is also part of a working group at EASA level re-examining industry wide experience.
The ATSB acknowledges the extensive analysis carried out by ATR under the supervision of EASA. EASA advised that should an unsafe condition be identified then ATR and EASA will take action as per Annex I paragraph 21.A.3 of Commission Regulation (EU)No 748/2012 to ensure the ongoing safe operation of the ATR42/72 aircraft.
CASA advised that they have been involved in a comprehensive dialogue with ATR and EASA regarding the assessment of the transient elevator deflections associated with pitch disconnect to address this safety recommendation. CASA has also engaged with the ATSB throughout the investigation and intends to provide a further response to the ATSB safety recommendation following the release of the final report.
The ATSB is monitoring the ongoing safety action, especially in regard to the recommendations issued, and will update the website accordingly.
Safety messages
This occurrence was a complex event with a number of safety factors and issues identified in different domains. As such, stakeholders should study the parts of the report that are relevant to their domain and consider the applicable safety implications. The ATSB draws attention to the following:
From an operational perspective, the event shows how a flight crew whose intention was to keep the aircraft within the prescribed limitations, can inadvertently expose the aircraft to a higher level of risk. When taking action to address potential aircraft exceedances, flight crew should consider the serious consequence of applying aggressive or large control inputs at high-speed relative to the risk posed by the exceedance. Flight crew should also adhere to sterile cockpit procedures to optimise their performance in the higher risk phases of flight and apply the handover/takeover procedures to ensure dual control inputs are avoided or coordinated to maintain effective control.
In terms of continuing airworthiness, the conduct of an inspection may be the sole opportunity to detect aircraft damage. As such, to avoid a single point failure it is imperative that the form of the inspection be fit-for-purpose and for inspections to be effectively coordinated and certified.
For aircraft manufacturers and airworthiness authorities, there can be unforeseen consequences of aircraft design characteristics. It is important that when identified, these are recognised and addressed during operational service of the aircraft type.
The occurrence
1a. In-flight upset and pitch disconnect
On 20 February 2014, Virgin Australia Regional Airlines (VARA) was operating an ATR 72 aircraft, registered VH-FVR, on scheduled passenger flights from Sydney, New South Wales (NSW), to Canberra, Australian Capital Territory (ACT), and return, as Virgin Australia flights VA652 and VA657, respectively.
The captain was then rostered to operate VH-FVR on a charter flight from Sydney to Narrabri, NSW and return. That flight was scheduled to depart Sydney 25 minutes after the scheduled arrival time of the Canberra to Sydney flight.
Sydney to Canberra flight (VA652)
Having commuted from Brisbane, the first officer arrived for duty before the captain and carried out the flight planning for the Sydney-Canberra-Sydney route. The first officer had obtained the weather data, which indicated possible turbulence at all levels in the area[1] and a crosswind in Canberra gusting to 26 kt. The captain reviewed the planning, and based on the forecast weather, decided to be the pilot flying[2] for the first sector from Sydney to Canberra.
The aircraft pushed back on time, at about 1435 Eastern Daylight-saving Time,[3] but did not take off until 1454, which was later than planned due to a long taxi and holding for traffic. The departure and climb to the cruise at flight level (FL) 140[4] were uneventful.
The Canberra automatic terminal information service (ATIS)[5] current during the climb, indicated that turbulence could be expected on the approach to runway 35. At 1500, the trend type forecast for Canberra airport changed to indicate that there was moderate turbulence below 5,000 ft. This was about 6 minutes after take-off, so the flight crew were likely unaware of this change.
The cruise was uneventful and the conditions were reported as being smooth. When the flight crew commenced the descent, they were engaged in an operationally non-pertinent conversation and did not inform air traffic control (ATC) of their descent until about a minute later.
Initially, the descent target speed was 230 kt, which the captain reduced to 200 kt then to 170 kt because of the anticipated turbulence. The recorded data indicates that there was some turbulence, but nothing significant until the last 1,500–2,000 ft of the final approach into Canberra.
The aircraft landed at 1337, approximately 9 minutes behind schedule.
Canberra to Sydney flight (VA657)
While the aircraft was on the ground in Canberra, the captain reported that he checked the weather for the return flight. The revised forecast available for the area at that time indicated improved conditions. The return flight to Sydney pushed back 1 minute ahead of schedule at 1604 carrying two flight crew, two cabin crew and 48 passengers. The first officer was designated as the pilot flying for the return flight.
While the flight crew were waiting for the cabin to be readied for take-off, the flight crew engaged in some operationally non-pertinent conversation. The aircraft took off from runway 35 at 1612.
In order to minimise their exposure to the turbulence experienced during the approach to Canberra on the previous sector, the crew set the aircraft up for a maximum rate of climb, which was slower and steeper than normal. Other than the expected turbulence during the first 1,500 ft, there was nothing significant during the climb to FL170.
After passing 10,000 ft, the captain obtained Sydney ATIS ‘Yankee’,[6] which did not indicate any turbulence in the area. The captain also contacted the operator over the company frequency to provide an estimated arrival time and request fuel for the next flight. During this exchange, the captain was informed that the planned departure time for the following charter flight to Narrabri had been brought forward by 5 minutes. This reduced the available turnaround time from 25 minutes to 20 minutes.
Following this, the captain made some preparations for the Narrabri flight. These preparations included weight and performance calculations, and weather considerations. Although the captain carried out the preparations primarily by himself, there was occasional interaction with the first officer.
After briefing the captain for the approach and landing, the first officer offered to enter some details for the next flight into the aircraft’s navigation systems. The captain declined the offer, indicating that he wanted to do it himself for the experience, as this was his first flight into Narrabri as pilot in command. After that, the captain notified a cabin crew member and the first officer of the reduced turnaround time. He also expressed his concerns to both about the limited time available to complete the turnaround.
Before commencing the descent, the flight crew conducted a routine brief for the anticipated arrival to runway 16 Right. To account for the effect of the tailwind, the first officer commenced the descent 5 NM earlier than initially planned, and selected a target airspeed bug[7] to 235 kt on the airspeed indicator. The captain accepted these decisions and the descent was commenced, with the autopilot engaged in vertical speed hold mode.
The selected target descent speed was 15 kt less than the maximum operating speed of 250 kt and 35 kt above their cruising speed of 200 kt. In vertical speed hold mode, the autopilot automatically controlled the vertical speed by adjusting the elevator, while the airspeed was controlled by the flight crew using engine power.
Shortly after, the captain commented that he expected the tailwind to decrease as they descended. He indicated that this would effectively add a headwind and the airspeed would ‘pop’. This appeared to confuse the first officer a little, as he had just observed an increase in the tailwind during their last turn. The captain indicated to the first officer that he was thinking aloud and they did not discuss it any further.
On first contact with Sydney Approach, the flight crew were assigned runway 16 Left. This was different to the runway and approach that the crew had anticipated and briefed before the descent. The crew changed instrument approach diagrams, reconfigured the aircraft navigation systems, and discussed the differences from the previously briefed approach procedure.
Descending through about 12,500 ft, the captain switched on the fasten seatbelt sign. The flight crew then completed the transition-down checklist, which was held at the last item, awaiting a report from the cabin that it was secure.
Initially, the selected vertical speed for the descent was set at -1,000 ft/min[8] and the engine power was maintained at about the cruise setting, while the airspeed increased from 200 kt to the target airspeed. After reaching the target airspeed, the engine power was reduced. The selected vertical speed was varied a number of times, ranging from -500 to -2,100 ft/min. A final setting of -1,600 ft/min was selected about 3 minutes into the descent.
About 4 minutes 30 seconds into the descent, at an altitude of about 10,600 ft, the airspeed started to decrease. At about this time, while waiting for the cabin secure report from the cabin crew, the captain began an operationally non-pertinent conversation. He expressed concern about the time available for the next turnaround and annoyance about other organisational issues. Although the conversation was primarily from the captain, there were indications that the first officer had become engaged in the discussion.
While this discussion was occurring, the first officer attempted to return the aircraft to the target airspeed by increasing the engine power. The power was incrementally increased but the airspeed continued to decrease. Without any significant change to power and pitch, this airspeed trend reversed to rise from 228 kt to 237 kt in about 13 seconds. In response, the first officer reduced the power. Ten to 15 seconds after the power reduction, the airspeed again started to decrease. The first officer again increased the engine power, but 10 seconds later reduced it to idle when the speed started to increase again.
When the aircraft was at about 8,500 ft, the captain stopped his operationally non-pertinent conversation. The airspeed continued to increase, and in an attempt to reduce the airspeed, the first officer used the touch control steering function[9] to temporarily regain manual control, and raised the aircraft’s nose by pulling back on the control column for a short period. The airspeed reduced in response to the first officer’s control input; however almost as soon as the first officer returned the nose-up input to neutral, the airspeed started to increase again.
The first officer repeated the nose-up input, but this time with a larger control input. At the same time, the captain urged the first officer to ‘grab it’. The aircraft’s response was similar to the previous input and the airspeed continued to increase after the first officer’s input was eased.
The captain, who reported he was unsure that the first officer’s actions would prevent the aircraft from exceeding the maximum operating speed, decided to take control and placed his hand on the control column. About a second later, the captain disconnected the autopilot and made a nose-up control input. Almost simultaneously, the captain instructed the first officer to ‘pull it up’, and the first officer made another slightly larger nose-up control input. At this point, both pilots were applying nose-up control inputs.
The first officer eased off on his input in a manner and timing consistent with the two previous control inputs, while the captain’s nose-up pitch input was maintained. As the aircraft’s nose-up pitch and vertical acceleration increased, the first officer began to push forward on the controls to become a nose-down input.
The recorded data showed that while the first officer’s control input was transitioning to a nose‑down input, the left and right elevators stopped moving in unison and rapidly moved in opposite directions. The captain’s control column moved slightly further back (nose-up) before quickly returning to a neutral position. At the same time, the first officer’s control column moved to a full forward (nose-down) position and the master warning activated. The first officer’s control column was held fully forward for about 1 second before, it too, returned to a neutral position.
The first officer reported, that during the event, the airspeed trend indicator was ‘off-the-chart’ and significantly exceeded 250 kt. It was also reported that the aircraft felt ‘heavy’ and required two hands on the controls to raise the nose. Both flight crew also reported that the aircraft did not respond to the control inputs as they expected. There was no indication that either flight crew were aware that the other was making simultaneous control inputs.
During the event, the aircraft’s pitch attitude changed from about 4.5º nose down to about 9º nose up[10] over the space of about 1 second. The vertical acceleration increased to a maximum of 3.3 g, at about the same time that the master warning activated, and reduced to 0 g about 1 second after reaching its maximum, before returning to 1 g.
About 2 seconds after the master warning activated, the captain announced to the first officer that he had control. The first officer responded and released the controls. The first officer then advised that the master warning had activated due to a pitch disconnect.[11] The crew verified that the aircraft was under control at a stable attitude and speed, observing that it was level or in a slight descent and with an airspeed of about 230 kt. The captain requested that the speed bug be set to 200 kt and they checked the function of each control column. Running through the pitch disconnect procedure on the engine and warning display, the captain noted a speed limitation of 180 kt and requested the speed bug be set to 170 kt.
About 1 minute 30 seconds after the pitch disconnect, a cabin crew member contacted the flight crew to alert them that the senior cabin crew member (SCCM) had been injured and couldn’t feel her leg. The captain later contacted the cabin and spoke to the SCCM, who informed him that while waiting for a passenger to return to their seat, she was thrown from her seat and believed that her leg was broken. The captain informed the SCCM that they had a technical issue when they hit turbulence. He also informed her that they would have an ambulance available for her when they landed, and would get the passengers to stay on board until she had been treated.
In the next contact with ATC, the crew transmitted a PAN[12] call and asked for an ambulance to be available for an injured crewmember. They also requested radar vectors[13] and a change to land on runway 16 Right, to minimise taxi time. ATC accepted the requests and provided vectors until they were lined up on the runway for the final approach.
The autopilot was re-engaged about 2 minutes after the pitch disconnect and manually disengaged at an altitude of about 2,400 ft during the approach. The remainder of the approach and landing was manually flown by the captain, who had continued as the pilot flying, without further event.
After landing, the captain contacted the operator on the company frequency to request a bay and engineering support. They also found that the ambulance was not on its way because additional information was required before it could attend. That information was then provided.
The flight crew completed the ‘after landing’ procedures, reconnected the two elevator control systems, and the captain checked on the condition of the SCCM. Airport firefighters provided first aid until an ambulance arrived at the bay, about 10 minutes after the aircraft had parked. The SCCM was the only person injured and was transported by ambulance to a hospital where she was treated for a fractured leg. The passengers disembarked the aircraft once the SCCM had been evacuated from the aircraft.
After attending to the evacuation of the injured cabin crew, the captain called the applicable VARA duty pilot to report the incident as turbulence with pitch disconnect and injury to cabin crew member. The duty pilot relieved the crew from further flying to facilitate drug/alcohol testing and VARA safety investigation interviews. Other VARA and Virgin Australia Airlines responses included a threat assessment while the aircraft was inbound to Sydney and initiation of a safety investigation.
The VARA safety assurance manager called the ATSB 24-hour notification number at 1740 and reported that flight 657 en route from Canberra to Sydney had encountered turbulence at 10,000 ft that resulted in a suspected broken leg to one of the cabin crew. The flight crew had declared a PAN and subsequently landed at Sydney. The ATSB noted this information and deferred a decision about investigation pending more information from VARA. Late the next day, VARA emailed to the ATSB a copy of the Air Safety Incident Report that reported autopilot disconnect, moderate turbulence, pitch disconnect, master warning, and checklist action. On this basis, and with confirmation of serious injuries to the cabin crew member, the ATSB classified the occurrence as an accident/serious incident and commenced a short (limited scope) investigation on 24 February 2014.
Figure 1: The flight path of VH-FVR (orange line) from Canberra Airport to Sydney Airport. The location of the aircraft when the pitch disconnect occurred is indicated by the red marker.
Source: Google Earth, annotated by the ATSB
1b. Inspection and continued operation
Post-occurrence maintenance
As a regular public transport operator, Virgin Australia Regional Airlines (VARA) was required to manage the continuing airworthiness of its aircraft fleet within an approved organisational and procedural framework. The framework implemented by VARA included a maintenance watch function to ensure that scheduled maintenance was conducted and defects were rectified by an approved maintenance organisation.
Maintenance of the ATR 72 aircraft operated by VARA was contracted to Toll Aviation Engineering (TAE), an approved maintenance organisation based at Brisbane Airport. TAE also provided line maintenance services comprising light scheduled maintenance and defect rectification as required at Sydney and Canberra Airports.
20 February 2014
On the afternoon of the occurrence, two Licenced Aircraft Maintenance Engineers (LAMEs) were on duty for TAE at Sydney. Both LAMEs were authorised to carry out line maintenance of ATR 72 aircraft and certify for all or part of that maintenance. One of the LAMEs was the designated senior base engineer for TAE at Sydney (these two engineers are referred to as senior base engineer and LAME 1 respectively).
After the pitch disconnect, and while the aircraft was inbound to Sydney, ground operations for the airline advised the engineers that the captain requested they attend the aircraft on arrival. No reason was given, but this type of request was common practice if an aircraft had a problem.
When the engineers arrived at the bay and saw the aircraft with emergency services in attendance, they ascertained that something serious had occurred. From a quick conversation with the crew, through a flight deck window, the engineers were aware there had been a pitch disconnect and possible overspeed. Given the likelihood of maintenance action, the engineers retrieved their laptop for access to the aircraft maintenance manual.
After the injured cabin crew member was evacuated and the passengers disembarked, the engineers were able to access the flight deck to consult further with the flight crew. The crew advised that the pitch disconnected during descent but were not sure how it happened. At the time, they had been responding to a rapid increase of airspeed and were unsure if the maximum operating speed (VMO) had been exceeded or if the event was related to the autopilot or turbulence. On that basis, the flight crew made an entry in the aircraft maintenance log of ‘pitch disconnect in-flight’.
LAME 1 requested the flight crew include more information in the maintenance log. From his perspective, a pitch disconnect could be associated with a range of problems and he needed more information to make an engineering assessment. Although pitch disconnects occurred occasionally in ATR aircraft during the landing roll, he was not aware of any pitch disconnect having occurred in-flight.
Given the flight crew’s uncertainty about the circumstances, LAME 1 accessed the maintenance data display of the aircraft systems computer and printed off a post‑flight report and G-meter report. These reports confirmed the pitch disconnect and recorded a number-1 engine oil pressure low warning at the same time of 1640:53.[14] There was no record of a VMO exceedance.
Recorded on the G-meter report was a maximum vertical load factor of 3.34 g at 1641. This load factor was abnormally high and prompted LAME 1 to discuss it with the crew, who were surprised about the high value. The crew added ‘associated with moderate turbulence’ to the maintenance log entry.
LAME 1 established from the aircraft maintenance manual that the maximum ‘g’ was outside of the acceptable limits for the aircraft weight. As a result, he grounded the aircraft. He identified the applicable maintenance as the Inspection after flight in turbulence and/or exceeding VMO. The data from the quick access recorder[15] was downloaded, at around this time, and transferred electronically to VARA maintenance watch. This data was forwarded to the ATR Airlines Technical Response Centre.
Based on the information provided by LAME 1, the maintenance watch engineer on duty in Brisbane confirmed the inspection that would be required and arranged for the Sydney engineers to carry out that task. Consistent with common practice at the time, maintenance watch did not issue any documentation to the engineers.
Maintenance watch requested the engineers download the cockpit voice recorder (CVR) and advised that the necessary tooling for that task had been dispatched to Sydney. Maintenance watch also advised the Sydney engineers that the aircraft was scheduled for a flight at 0800 the next morning. The Sydney engineers accepted the tasking and did not make any requests to maintenance watch for additional time, technical advice or specialist equipment.
While LAME 1 was liaising with the flight crew and accessing the post-flight reports, the senior base engineer took the opportunity to walk around the aircraft and look for damage. The senior base engineer reported that this walk-around was based on his experience that an overspeed often required a visual inspection. During the walk-around the senior base engineer stood below the tail and looked up. No damage was observed.
At 1837, the aircraft was towed off the arrival bay to a remote parking area. It was parked and secured. The LAMEs then left the area to prepare for the inspection (Figure 2).
Figure 2: Aircraft being parked on remote bay at 1846 on 20 February 2014 (still image copied from closed circuit TV footage) in preparation for post-occurrence maintenance.
Source: Sydney Airport (image cropped by the ATSB)
LAME 1 and the senior base engineer had started duty at 0530 and 0730, respectively, to work on another grounded aircraft. This was earlier than their rostered afternoon shift. Given this start time and the anticipated amount of work to conduct the turbulence/VMO exceedance inspection, the engineers considered that they needed assistance. The senior base engineer called in one of the other Sydney based engineers who had been on a rostered day off. The incoming engineer (referred to as LAME 2) was also authorised to perform and certify for maintenance of ATR 72 aircraft.
On arrival at the TAE office sometime between 1830 and 1900, LAME 2 participated in a discussion with the senior base engineer and LAME 1 about the occurrence and requirements of the assigned inspection. The ATR job instruction card, JIC 05-51-11 DVI 10000 Inspection after flight in turbulence and/or exceeding VMO required a general visual inspection of the fuselage, stabilisers and wings, with more detailed inspections if any anomalies were found. A detailed inspection of the wing attachment fittings was also required irrespective of the results of the general visual inspection.
The discussion involving the LAMEs was not a formal shift handover and there was no record of the matters discussed nor any directions given. The senior base engineer recalled that he discussed the turbulence inspection with LAME 2. He also recalled he then advised that he and LAME 1 would help with the tasks that required more than one person, such as the removal of overhead lockers in the cabin to gain access to the wing attachment fittings. Although the senior base engineer did not recall handing over the inspection to LAME 2 at that stage, it was his intention to do so. LAME 1 recollections did not include any detail about the initial discussion.
LAME 2 recalled that when he arrived at the office, the other engineers were printing job instruction cards for inspection of the wing attach fittings and discussing the requirements. He was advised that the g loading was outside of the acceptable limits and that maintenance watch had requested a turbulence inspection. LAME 2 was also made aware that a cabin crew member was injured and the only information provided by the crew was that the pitch disconnected in moderate turbulence.
In regard to the initial engineering response, LAME 2 recalled that the senior base engineer advised him he had carried out quite a detailed walk-around of the aircraft in daylight and found no signs of defects. From what the senior base engineer said, LAME 2 understood that the general visual inspection of the aircraft had been done and he was now required to assist with a detailed visual inspection of the wing attachment fittings. LAME 2 recalled that there was no discussion about who was running the inspection or how the inspection would be coordinated.
From about 2000, LAME 2 with the assistance of LAME 1 worked on disassembling some of the aircraft interior to access the wing attachment fittings. The senior base engineer viewed his role during this period as keeping an overview, and providing support, without being completely involved in the inspection. For some of the time, the senior base engineer was attending to another matter.
While the LAMEs were inspecting the aircraft, maintenance watch completed an event notification for ATR with the following event description (with ATSB editing for clarity):
During descent with autopilot engaged both pilots noticed the airspeed rapidly accelerate and have both reached for the controls causing pitch disconnect. During this event, the aircraft sustained 3.34 G in-flight acceleration causing the flight attendant to become injured.
The notification indicated that an in-flight turbulence inspection was being carried out and the pitch disconnect test had been carried out with nil defects reported. Maintenance watch subsequently transferred a copy of the QAR data to the ATR centre.
At about 2200, the detailed visual inspection of the wing attach area was completed with nil defects identified. All of the engineers returned to the office and the two engineers who had been on duty for up to 16 hours 30 minutes, signed off at about 2230. When the senior base engineer left the office, he considered the general visual inspections were still to be completed and this would be done by LAME 2. It should be noted that from the time maintenance watch requested the inspection, no arrangements were made by the senior base engineer or the LAMEs to borrow or hire a high-access platform such as a cherry picker or scissor lift as would be required for close inspection of the horizontal stabilisers.
After attending to an arriving aircraft, LAME 2 returned to VH-FVR at about 2300. The engineer borrowed a nearby fixed-height stand to provide an elevated platform and positioned it to the rear of the left wing. That stand was described as the best he could get at that time and was of a height that provided a view of the top of the wing but not the top of the stabilisers. While on the stand, the engineer shone a torch over the upper surface of the wing, rear fuselage and tail (Figure 3). The engineer was on the stand for about a minute and the torchlight was directed to the rear fuselage and tail for a couple of seconds. No damage was identified.
Figure 3: Aircraft visual inspection underway at 2306:44 with LAME 2 on the stand at the rear of the left wing. The circle and arrow indicate the location of the LAME and the direction of torchlight (still image copied from closed circuit TV footage)
Source: Sydney Airport (image cropped and annotated by the ATSB)
LAME 2 described this work as a continuation of the inspection started by the senior base engineer and LAME 1. He considered that, based on the text of the job instruction card and information from the crew, as communicated in the log and from the senior base engineer and LAME 1, the general visual inspection had been carried out satisfactorily. On reflection, LAME 2 described the external inspection he conducted as a final check prior to certification rather than the general visual inspection as specified in the job instruction card.
At 2330, LAME 2 certified in the aircraft maintenance log that the Inspection after flight in turbulence and/or exceeding VMO was carried out in accordance with ATR JIC 05-51-11 DVI 10000, with nil defects evident. The engineer explained to the ATSB that he understood he was signing for the work carried out by himself and the other two LAMEs involved in the post-occurrence maintenance. Advice as to completion of the inspection and nil-defect result was communicated to maintenance watch who forwarded that information to VARA personnel and to the ATR Airlines Technical Response Centre.
Although LAME 2 was rostered to start work at 0600 the next day, he was expecting that would be changed in response to his late finish. However, as LAME 2 was finishing up in the office, the senior base engineer called to request that he start work at 0600, as rostered. LAME 2 agreed to the early start and signed off at about 2345.
21 February 2014
LAME 2 arrived at work the next morning at 0600. He, and another engineer (referred to as LAME 3), also on the morning shift, attempted to download the CVR but were unsuccessful. Consequently, the aircraft was held until a replacement CVR could be freighted from Brisbane. During the work in relation to the recorders, LAME 2 took the opportunity to inspect the interior of the rear fuselage, where the recorders were located, but did not identify any anomalies.
The number-1 engine oil pressure warning that appeared on the post-flight report was entered as a ‘discrepancy’ in the maintenance log. In the closing maintenance action, it was noted there had been no other faults or erratic indications. LAME 2 certified that the oil level was checked and an engine ground run carried out with nil defects evident. In accordance with the engine manufacturer’s data, no further action was required.
Other maintenance carried out was an operational test of the pitch uncoupling mechanism re‑engagement system and a check that the pitch uncoupling mechanism had reconnected. The rear cabin area where the senior cabin crew member was injured was also checked and no damage was identified.
On the basis that all of the maintenance log entries had been certified as closed, LAME 3 issued a certificate of release to service at 1330.
Figure 4: Aircraft being towed away from remote bay at 1215 on 21 February 2018 (still image copied from closed circuit TV footage). Note the angle of the horizontal stabiliser relative to the angle of the wings.
Source: Sydney Airport (image cropped by the ATSB)
Other maintenance, 21–24 February 2014
The following routine maintenance tasks were carried out on VH-FVR by various TAE engineers at Sydney Airport.
Line check 21 February
Line check 22 February
Weekly check 23 February
Line check 24 February
These checks included a visual inspection of the aircraft during a ‘walk-around’ at ground level. No defects were identified. The line check carried out on 24 February was the last recorded maintenance before a flight to Albury on 25 February.
Further operation and suspected birdstrike
Subsequent to the post-occurrence maintenance completed on 21 February 2014, the aircraft was operated on a further 13 flights. The respective flight crews did not record any anomalies or defects during their pre-flight inspections and there were no reports of any abnormal aircraft handling characteristics.
On 25 February, aircraft VH-FVR was operated on a scheduled passenger flight from Sydney to Albury, NSW. On descent into Albury, the aircraft passed in close proximity to birds, which alerted the captain to the possibility of a birdstrike on the left side of the aircraft. There were no in-flight indications that a bird had struck the aircraft but after landing, the captain noticed the aircraft’s pitch trim system fluctuated abnormally.
The captain conducted a walk-around inspection and, although there was no evidence of a birdstrike on the left of the aircraft, he identified a dent in the top leading edge of the vertical stabiliser. The captain advised the operator’s maintenance watch who dispatched a LAME to Albury to inspect the aircraft.
The LAME, who was LAME 1 from 20 February, used scissor lift equipment to gain access to, and inspect the stabiliser. The LAME did not find any evidence of a birdstrike, such as blood or feathers. However, the LAME did find indications of significant structural damage to the horizontal stabiliser, and contacted maintenance watch to cancel the following flights. Upon further examination and discussion with VARA, it became evident that the damage found at Albury was probably a consequence of the occurrence on 20 February.
Late the next day, VARA emailed to the ATSB photos of the damage and advice that the damage found at Albury was probably a consequence of the occurrence on 20 February. On the following day, the ATSB upgraded the investigation and assigned a senior investigator to lead a team of investigators.
Due to the continued operation of the aircraft for an additional 13 flights, the exact extent of damage at the time of the pitch disconnect event could not be conclusively determined. However, gross distortion of the horizontal stabiliser was visible on the CCTV footage of the aircraft taxiing to the bay after landing following the occurrence flight (Figure 5).
Figure 5: Images from Sydney Airport CCTV footage showing the deformation to the horizontal stabiliser of VH-FVR (right) as compared to an undamaged ATR 72, VH-FVQ (left).
The image was taken as the aircraft taxied to the bay on 20 February 2014. Note that the left tip of the horizontal stabiliser VH-FVR is visibly lower that the right when compared to the angle of the wing. Source: Sydney Airport
The ATSB examined the aircraft in Albury, New South Wales, with the horizontal stabiliser in place on the aircraft and with it removed. The aircraft manufacturer examined the aircraft in Albury before transporting the horizontal stabiliser to their facilities in Italy for detailed examination and testing.[16] These examinations identified substantial structural damage to the horizontal stabiliser.
In addition to the gross deformation of the horizontal stabiliser, damage was observed prior to removal of any fairings and access panels. The visible damage included:[17]
distortion of upper forward fairing (Figure 6)
distortion of the upper side of the right hand horizontal stabiliser leading edge (Figure 6)
cracked sealant between horizontal and vertical stabilisers, and horizontal stabiliser leading edge (Figure 7)
fractured and exposed composite material in the upper skin panel (Figure 7)
fasteners pulled through the composite material (Figure 7 and Figure 8)
contact marks between the lower left fairing and rudder (Figure 8)
cracking of the horizontal stabiliser right lower skin panel (Figure 9).
Figure 6: Distortion in the upper forward fairing right side horizontal stabiliser leading edge prior to removal of any fairings or access panels.
Source: ATSB
Figure 7: Damage visible on the upper left side of the horizontal stabiliser included cracked sealant, fractured and exposed composite material, and fasteners pulled through the composite material
Source: ATSB
Figure 8: Damage visible on the lower left side of the horizontal stabiliser included fasteners pulled through the lower left fairing, fractured fasteners for securing the fairing and contact marks between the fairing and the rudder.
Source: ATSB
Figure 9: Damage visible on the lower right side of the horizontal stabiliser included fasteners pulled through the lower skin and cracks in the lower skin panel.
Source: ATSB
Further damage was identified when the fairings and leading edges were removed. That damage included:
cracking of the lower skin around the rear left horizontal-to-vertical stabiliser attachment point (Figure 10)
a full thickness, diagonal crack in the front spar extending through the full depth of the spar (top to bottom flange) (Figure 11 - left)
delamination and cracking of the composite material of the upper skin at the rear spar (Figure 11 - right)
cracking of the composite material in the centre leading edge above the forward attachment fittings (Figure 12)
deformation of the mid horizontal-to-vertical stabiliser attachment fittings (Figure 13).
Figure 10: Horizontal-to-vertical stabiliser attachment with the lower left fairing removed showing the cracking in the skin panel adjacent to the attachment fitting.
Source: ATSB
Figure 11: Crack in the horizontal stabiliser front spar (left) identified by orange arrow. Cracking and delamination in the composite skin at the rear spar (right) identified by yellow arrows.
Source: ATSB
Figure 12: Damage in the centre leading edge section above the forward attachment points, included cracking and delamination in all corners of the cut-out and cracks in the ribs (not shown) and deformation of the material around the attachment points (not shown).
Source: ATSB
Figure 13: Mid-right attachment lug. Left image shows the lug while connected to the vertical stabiliser. Cracks and missing white paint (green patch) were indications of distress. Right image shows the lug following removal of the horizontal stabiliser.
The purple dashed line has been added as a visual reference to highlight the bending in the lug. The damage to the mid-left lug was similar. Source: ATSB
The manufacturer’s examinations also identified significant internal damage. This included:
delaminated areas and cracking in the lower splice plate
delaminated areas in the upper splice plate
cracking in the forward back-up fitting (metal support beam between the forward attachment lugs)
buckling and cracking in the internal ribs
buckling in the centre lightening hole in the metallic section of the rear spar
disbonding between the rear spar and skins
delaminated areas in the rear spars
delaminated areas in the upper and lower skins on both the left and right sides.
Samples taken from critical areas in the structure were examined and found to comply with the design drawings for the horizontal stabiliser.
Although there was no damage identified in the vertical stabiliser, due to the magnitude of the loads applied during the event, the manufacturer required replacement of the horizontal and vertical stabilisers before further flight.
Aircraft operator overview
From their main base in Perth, Western Australia, Virgin Australia Regional Airlines (VARA) managed a fleet of Fokker 50, Fokker 100, Airbus A320 and ATR 72 aircraft on regular public transport (RPT) and charter services. The airline operated the ATR 72 aircraft only on the east coast of Australia from bases in Brisbane, Queensland, Sydney, New South Wales, and Canberra, Australian Capital Territory.
The VARA operation was fully instituted on 3 May 2013 after Virgin Australia Airlines completed the acquisition of Skywest Airlines (Skywest) and the Civil Aviation Safety Authority (CASA) approved the change of Air Operator’s Certificate (AOC) entity. In the 18 months before the changeover, Skywest had been operating the ATR 72 aircraft for Virgin Australia Airlines on an aircraft, crew, maintenance and insurance services agreement.
Personnel information
There were a total of four crew on board VH-FVR during the flight — two flight crew and two cabin crew. A summary of the crew’s relevant training and experience is provided in the following sections.
Flight crew
Captain
The captain held an Air Transport Pilot (Aeroplane) Licence (ATPL) issued in Australia in February 2009. He held a Class 1 civil aviation medical certificate issued on the basis of an examination in December 2013. This certificate, valid until December 2014, had nil restrictions. The captain’s aeronautical experience is summarised in Table 1.
The captain started at Skywest in May 2012 as a direct entry captain and remained with the operator when it changed to VARA. Prior to commencing with Skywest, the captain had served as a pilot in the Australian military and had accumulated a total of 2,929.5 hours of flying experience.
In July 2012, the captain completed the ATR 72-500 type-rating course followed by the ATR 72‑600 differences course. Both of these were carried out at the ATR training centre in Toulouse, France. The following training and checking was completed with the operator.
Skywest human factors course – August 2012
Skywest ATR 72-500 conversion course – January 2013
Check-to-line ATR 72-500 – March 2013
Simulator proficiency check – August 2013
VARA ATR 72-600 transition course – August 2013
Check-to-line ATR 72-600 – September 2013
Throughout his training records there were notes indicating that the captain demonstrated good situation awareness and crew resource management (CRM) skills. There was a note early in his training observing that further work was required on standard calls, but there were no further notes indicating that this was an ongoing issue.
First officer
The first officer held an Air Transport Pilot (Aeroplane) Licence (ATPL) issued in October 2013. Prior to this, the first officer held an ATPL issued in the United Kingdom. He held a Class 1 civil aviation medical certificate issued on the basis of an examination in March 2013. This certificate, valid until March 2014, had nil restrictions. The first officer’s aeronautical experience is summarised in Table 2.
Table 2: First officer’s relevant aeronautical experience
Total flying hours
3,816
Total flying time on ATR 72-100/200/210
882
Total flying hours on ATR 72-500
1,607
Total flying hours on ATR 72-600
583
Total flying hours in last 90 days
56.5
Total flying hours in last 30 days
56.5
Total flying hours in last 7 days
2.3
The first officer started with Skywest in April 2012 and remained with the operator when it changed to VARA. Prior to commencing with Skywest, the first officer had accumulated 3,046 hours of flying experience. This experience included 686 hours as captain of ATR 42 and 72[18] type aircraft with a previous employer.
In April 2012, he completed the ATR 72-600 differences course at the ATR training centre in Toulouse, France. The following training and checking was completed with the operator.
Skywest human factors course – May 2012
Skywest ATR 72-500 conversion course – June 2012
Check-to-line ATR 72-500 – September 2012
Simulator proficiency check – October 2012
Skywest ATR 72-600 conversion course – January 2013
Check-to-line ATR 72-600 – March 2013
Simulator proficiency check – April 2013
Simulator proficiency check – September 2013
Skywest promotion to command program – September 2013
Instrument landing system proficiency check – December 2013.
Throughout the first officer’s training records there were notes indicating that the first officer had good aircraft handling/flying skills and situation awareness.
Cabin crew
The crew in the passenger cabin consisted of two members, a senior cabin crew member (SCCM) and a cabin crew member (CCM). These crew members had responsibilities for customer service and passenger safety, particularly in the case of an emergency situation.
The SCCM started with Skywest in June 2013 and completed the initial cabin crew training. In November 2013, she completed the senior cabin crew training program, and after a line check, was promoted to the role of SCCM.
The CCM completed the Skywest cabin crew initial training in August 2013. Her most recent line check was carried out in February 2014.
Meteorological information
Information used by the flight crew
The operator reported that they did not retain the flight documents or briefing packs from each flight at the time of the occurrence. As a result, the ATSB could not determine precisely on what information the flight crew had based their flight planning. However, according to the operator’s flight planning procedures, the flight crew were to access the National Aeronautical Information Processing System (NAIPS)[19] for a briefing on the current and expected meteorological conditions relevant to the route to be flown. The operator’s procedures also required, that where the pre-flight briefing was obtained more than 1 hour prior to the estimated time of departure, pilots should obtain an update before each departure.
The first officer reported that he obtained a specific pre-flight information briefing through NAIPS when conducting the flight planning for the route from Sydney. This would have provided the appropriate weather information for the route between Sydney and Canberra.
During the flight from Sydney to Canberra, the ATIS was available to the flight crew via the aircraft radio communication systems.
The departure time for return flight from Canberra was more than 1 hour from the departure from Sydney, so the flight crew were required to obtain an update before their departure. The captain reportedly checked the weather using a portable electronic device during the turnaround in Canberra.
The following information is based upon the information that was available through NAIPS during the return flight from Sydney to Canberra and the ATIS information at the time it was reviewed by the flight crew.
Area forecasts
The flights from Sydney to Canberra and return were carried out within the Area 21 forecast zone.
The area forecast applicable to the Sydney-Canberra route, and available at the time of flight planning, was an amended Area 21 forecast issued at 0947 and valid from 0950 to 2200. The overview was for some isolated showers and broken low cloud that was expected to clear by 1200 and then for broken low cloud to develop on the south coast after 2000.
The wind in the area was forecast to be from the west to north-west and increase with altitude from 30 kt at 7,000 ft to 60 kt at 14,000 ft. South of Canberra, the winds above 10,000 ft were expected to be up to 20 kt stronger. Turbulence was forecast to be moderate in cumulus cloud and moderate otherwise at all levels throughout the forecast area.
At 1506, while the crew was en route to Canberra, another area forecast was issued. There was little substantive change to the weather outlook; however, winds were forecast to ease by 5-10 kt and turbulence moderate now above 10,000 ft rather than at all levels. It is likely that the captain reviewed this updated forecast when checking the weather during the turnaround in Canberra.
Aerodrome meteorological conditions
The aerodrome forecast (TAF)[20] for Sydney Airport, which was valid from 1100 until 1700, indicated that the winds were 10 kt from the south-east. There was no mention of turbulence in the area.
The TAF for Canberra Airport that was in effect for the flight from Sydney to Canberra and the departure from Canberra, indicated that the forecast winds were from the west at 16 kt. There was no mention of turbulence.
At the time that the aircraft departed Sydney, the Canberra Airport aerodrome meteorological report (METAR), which had a trend type forecast (TTF) current from 1430, indicated that the winds were 15 kts, gusting to 26 kt from the west-north-west with no significant weather. However, at 1500, 6 minutes after take-off, a revised METAR/TTF for Canberra Airport was issued noting that there was moderate turbulence forecast below 5,000 ft.
The Canberra Airport ATIS included a message to expect turbulence over runway 35, south of the runway intersection. Although it was not captured on the cockpit voice recorder, it was normal for flight crew to review the ATIS when inbound to an airport. Canberra ATIS ‘Kilo’ was current during the approach and departure from Canberra. Along with other airport information, ATIS ‘Kilo’ noted that the winds were 15 to 25 kt from 280°, which was all crosswind on runway 35, visibility was 10 km, scattered clouds at 4,500 ft, temperature 20°C, and QNH 1011. It also warned of turbulence over runway 35, south of the runway intersection.
Post-occurrence meteorological analysis
The Bureau of Meteorology advised that the satellite picture did not indicate any turbulence due to cloud and the Sydney and Wollongong weather radar images did not show any significant returns. From other sources such as weather balloon flights, profiler wind data and nearby surface reports, there did not appear to be any turbulence due to wind, including shear and topographical effects.
However, the bureau went on to advise that the balloon flight suggested a relatively strong inversion was developing during the day of the occurrence. The aircraft would have been traversing from a warmer stable atmosphere into a relatively cooler and unstable layer between 7,000 and 10,000 ft. This could account for any reported moderate turbulence.
Atmospheric data recorded by aircraft
The data on the flight data recorder (FDR)[21] on VH-FVR included a head wind parameter. Review of that parameter from the Canberra-to-Sydney flight, indicated that the head wind component, which was at that time a tail wind, decreased from 19 kt to 16 kt while the indicated airspeed increased from 233 kt to 252 kt in the lead‑up to the pitch disconnect event. However, ATR informed the ATSB that this parameter was filtered and did not necessarily represent the instantaneous longitudinal wind speed component. Given the effect that this could have on the recorded wind, an estimate of the instantaneous local wind speeds during descent was made using the true airspeed, groundspeed, track and heading information from the FDR.
The path that the aircraft travels over the ground is a combination of the speed and direction that the aircraft is travelling through the air and the movement of the air through which it is travelling. As such, the local wind vector (speed and direction) can be back calculated as the vector difference between the true airspeed and the groundspeed vectors as shown in Figure 14.
Figure 14: Calculation of local wind vector (green) using the true airspeed (blue) and groundspeed (brown) vectors. The true airspeed and groundspeed were recorded on the FDR.
Source: ATSB
The wind vector may be illustrated as two components when referenced to the true airspeed. The component of the wind vector parallel to the true airspeed is the head/tailwind component, and the perpendicular component is the crosswind. In accordance with the vector representation shown in Figure 15, a positive parallel component is a tailwind.
Figure 15: Wind components. The component of the wind that is parallel to the true airspeed is the head/tailwind and the perpendicular component is the crosswind.
Source: ATSB
The variation in the calculated wind vector and tailwind components during the 2 minutes leading up to the pitch disconnect are shown in Figure 16. During that period, there are a number of changes in the tailwind, the most significant of these occurred during the 10 seconds leading up to the pitch disconnect, where the tailwind dropped from about 30 kt to about 10 kt. The tailwind component continued drop for a couple of seconds after the pitch disconnect, to a minimum of about 6 knots, before it increased again to greater than 20 kt.
Figure 16: Plot of the calculated tailwind and indicated airspeeds during the 2 minutes leading up to the pitch disconnect. The tailwind was derived from the true airspeed and groundspeeds recorded on the FDR.
Note the rapid decrease in the tailwind associated in the seconds before (shaded area) the pitch disconnect (dashed line). Source: ATSB
Operational risk controls/procedures
Operational risk controls and procedures were contained in a number of documents relating to VARA’s ATR 72 operations. These included the:
VARA Flight Operations Policy and Procedures Manual (FOPPM)
Skywest/VARA Flight Crew Training Manual (FCTM)
ATR 72 Flight Crew Operating Manual (FCOM).
Unless otherwise noted, the following information is drawn from these documents.
Crew coordination
Flight crew roles and responsibilities
The VARA ATR 72 aircraft operated with two flight crew: a captain and a first officer. The captain, as the pilot in command, is the primary responsibility holder for the safe and efficient conduct of the flight. The first officer is responsible to the pilot in command to assist in the safe and efficient conduct of the flight. In the absence of a relief captain, the first officer must assume the role of pilot in command if the captain becomes incapacitated during the flight.
In addition to the distinction of duties between the captain and first officer, there was a further division of responsibilities between the pilot flying and the pilot not flying. The roles of the pilot flying and pilot not flying[22] were not defined in one place, but were distributed across the FOPPM, FCTM and ATR 72 FCOM. The responsibilities for each role were summarised as:
pilot flying
control of the aircraft flight path (position and speed)
setting the engine power
navigation
aircraft configuration (including flaps, landing gear and autopilot modes)
initiation of procedures
pilot not flying
communications
monitor the flight path, the speed, mode changes, systems and engines
read out checklists
operation of systems (such as flaps and landing gear) as directed by the pilot flying.
The detailed tasks assigned to each crewmember was specified throughout all three documents and varied by the phase of flight and the applicable procedure.
Handover and takeover procedures
The aircraft operator’s FOPPM contained the handover and takeover procedures. Those procedures stipulated that handover of control from one flight crew member to another must always be conducted in a positive manner. To minimise confusion or operational risk, the pilot flying was required to retain control until the pilot not flying had advised that he/she had taken control of the aircraft. In abnormal situations, or as otherwise required, the captain was required to initiate the takeover procedure.
The procedure also stipulated that in critical phases of flight, the captain must have their hands positioned to enable rapid takeover of controls.
ATSB observation
By the nature of the procedure, to ensure that somebody is always in control of the aircraft when manually flying, there will be some time during a handover when both flight crew members will have hold of the controls. In normal situations where the aircraft is in steady level flight, this is unlikely to result in any hazards. However, in situations where the pilot flying has initiated a manoeuvre and the pilot not flying has decided that immediate action is required to prevent a hazardous situation, the time to act is limited. In such a situation, there will likely be a short time when both flight crew are making control inputs concurrently.
Standard calls
The aircraft operator stipulated a number of standard crew calls in the FOPPM for the pilot flying and pilot not flying roles. If a crew member did not initiate a call as required, the roles of initiator and responder were to be reversed so that the other crew member initiated the call. The standard calls in relation to changing control of the aircraft are listed in Table 3.
Table 3: Standard calls for transfer of control of the aircraft
Condition
Pilot response
Pilot not flying
Pilot flying
When relinquishing control of the aircraft to another flight crew member
I have control
You have control
When the captain assumes control of the aircraft after landing or when the pilot not flying has cause to take control of the aircraft without delay
I have control
You have control
Although there were no standard calls specific to speed control during the descent phase, there were a number of standard calls that related to speed deviations during other stages of flight. For example, during approach the pilot not flying was required to use the standard call of ‘speed’ and the pilot flying was to respond with ‘checked’ to indicate that they were aware of the speed situation.
Sterile flight deck procedures
The FOPPM stipulated that sterile flight deck procedures[23] would apply on all flights during the high workload periods before and after take-off, and during the latter stages of climb, descent, approach, landing and taxi. Specifically, the FOPPM noted that the phases of flight where these procedures applied were:
Once the flight deck door being closed and locked (and after the correct headcount has been given to the Pilot in Command) until the fasten seat belts sign is turned off; or until the after take-off PA from the Flight Crew, whichever comes first.
When on climb or descent and within 1000 feet of an assigned altitude.
On descent from the time the fasten seat belts sign is turned on until the fasten seat belts sign is turned off (when the aircraft is parked at the aerobridge or is parked in the stand position).
This was also provided in graphical form (Figure 17). The ‘No Contact Phase identified’ was an additional phase where the cabin crew were not to contact the flight crew.
When sterile flight deck procedures were in effect the flight crew were required to limit their conversation to matters directly associated with the operation of the aircraft.
Figure 17: Graphic from the VARA FOPPM showing the phases of flight where the sterile flight deck and no contact procedures applied
Source: Virgin Australia Regional Airlines
ATSB observation
The ATSB identified a number of occasions during both the flight into Canberra and the occurrence flight out of Canberra, where the flight crew engaged in non-operationally pertinent conversation during phases of flight where the sterile flight deck procedures applied; including the minutes immediately before the pitch disconnect event.
Flight planning
The FOPPM included information on the company’s requirements for flight planning. The general requirements noted:
It is important that flight planning be completed early enough to allow a thorough pre-flight inspection and on time departure without the need for haste, which may result in something being overlooked. If a Flight Crew Member anticipates that a particular flight or series of flights will require extra flight planning time then he/she should inform Central Operations as soon as possible so that anticipated duty times may be adjusted.
In terms of obtaining weather information, the FOPPM required that during the flight planning stage, the pilot in command communicates with NAIPS for a briefing on current and expected meteorological conditions. Where that briefing was obtained more than 1 hour prior to the estimated time of departure, flight crew were to obtain an update before each departure. Some variations to this were permitted, but none were applicable to the flight.
For operations on the east coast (that is, ATR operations), the FOPPM stated that updated weather would be provided by the Ground Handling Agent on each turnaround. However, it also noted that telephone communication may be used if this was not available, or if clarification of the briefing material was needed.
ATSB observation
The flight crew were not provided with updated weather information by the Ground Handling Agent during the turnaround in Canberra. However, it appeared that the captain obtained the latest weather using a personal electronic device during the turn around. Hence, the intent of the procedure, that is to obtain the latest weather, was achieved.
Use of fasten seat belts sign on descent
According to the FOPPM, the seat belt sign should be switch on during descent at FL150 following the pilot flying’s command of ‘Seat belt sign on’. If the cruising altitude is below FL150, then the seat belt sign should be selected on prior to the top of descent.
The seat belt sign was also to be selected on before entering areas of known turbulence.
ATSB observation
For the occurrence flight, the captain did not switch the fasten seatbelt sign on until they were descending through about 12,500 ft. The delay in switching on the sign was probably due to the increased workload that resulted from the change in the runway for the arrival in Sydney. The seat belt sign was switched on before the pitch disconnect, so the delay likely had no effect on the safety of the passengers during the event.
Flight in turbulence
According to the FOPPM, the pilot in command was required to:
…carefully consider the possibility of encountering turbulence, having regard to forecasts of turbulence, wind strength and direction, mountain wave activity and proximity of cumulonimbus clouds. Turbulence is the leading cause of in-flight injuries. Cabin crew or passengers may sustain severe injury if they are not warned and adequately secured.
The FOPPM also required the flight crew to turn the fasten seat belt sign on and advise the cabin crew to be seated by making a public address before entering areas of known or anticipated turbulence.
The aircraft operator advised flight crew who entered areas of moderate to severe turbulence to use the autopilot in accordance with the ATR 72 FCOM, alert the senior cabin crew member, and reduce airspeed to turbulence penetration speed, particularly below 15,000 ft.
Other considerations listed in the FOPPM for flight in turbulence included:
maintaining constant attitude with reference to the attitude indicator, avoiding overcorrection and excessive load application to the aircraft structure
avoiding power alterations unless high or low speed limits are exceeded
not chasing airspeed or altitude
both flight crew monitoring the flight instruments.
There were no references regarding flight in turbulence in the ATR 72 FCOM. A note in the operator’s FCTM advised that it was important for crew to use the autopilot as much as they could to ‘increase availability and crew awareness’.
The FCTM also advised that, while ATR did not define a turbulence penetration speed as such, the flight crew should reduce speed to not above the rough air maximum speed of 180 kt during turbulence.
ATSB observation
Based upon the prevailing wind conditions and their previous experience, the flight crew had anticipated turbulence on the descent into Canberra. As such, the captain reduced their descent speed.
There was no indication that the flight crew intended descending into Sydney at a reduced airspeed. This was probably due to them having only experienced turbulence during the later stages of the approach into Canberra, and the forecast improved conditions.
Although the fasten seat belts sign was already on, in preparation for landing, there were no announcements made to the cabin crew that would indicate that the flight crew were anticipating turbulence during the descent.
Windshear
The operator defined windshear in the FCTM as an atmospheric phenomenon where there is a notable change in wind direction and/or speed over a short distance. It was treated as an abnormal situation that could be encountered in the vicinity of thunderstorms, in rain showers, during a frontal passage or at coastal airports. The potential danger of windshear encounters below 500 ft (on take-off or approach/landing) was emphasised and recovery procedures for those situations were provided.
The FCTM also noted that severe windshear above 1,000 ft could be unpleasant, but could generally be negotiated safely. There were no specific recovery procedures provided for windshear encountered above 1,000 ft.
The operator’s FOPPM required that the pilot in command comply with the requirements of the ATR 72 FCOM for windshear; however, the reference provided did not exist in the FCOM. A search of the FCOM identified that the only treatment for windshear was the inclusion of a wind factor to the final approach speed ‘to give extra margin against turbulence, wind shear’, and other factors.
ATSB observation
There was some indication that the captain was anticipating the possibility of windshear when he voiced the effect of a decreasing tailwind, and the potential it had to result in an increase in airspeed. However, the captain had accepted the descent airspeed of 235 kt selected by the first officer, so did not appear to foresee the need to further decrease the descent speed to provide additional margin on the maximum operating speed (VMO).
Descent procedures
Manufacturer’s procedures and guidance
The manufacturer provided some descent procedures in the FCOM. These were distributed between the ‘before descent-descent’ procedures and the automatic flight control system (AFCS) information. The ‘before descent-descent’ procedures in the FCOM focused on preparing for the arrival and approach, and configuration of the flight management system. The only performance related procedures were in relation to configuring the flight management system for the change from pressure to barometric altitudes at the transition altitude, and insertion of wind information for the approach.
The FCOM does not indicate a preference for the AFCS mode to be used for the descent. The before descent checklist refers the pilot flying to indicated airspeed or vertical speed mode as required. There is no reference to the descent speeds, either vertical speed or airspeed, in the before descent-descent procedures.
The AFCS section of the FCOM recommends that indicated airspeed hold mode be used for climb, but does not recommend either indicated airspeed or vertical speed modes for descent. Cautionary information was provided in relation to climb in vertical speed hold mode (Figure 18).
Figure 18: Cautionary note in FCOM relating to use of vertical speed hold (VS) mode during climb
Source: VARA
The FCOM also provided performance information for descent. Descent performance charts were provided for 1 reference weight, 3 speeds (200 kt, 220 kt and 240 kt) and two different descent profiles (at a given rate and at a given gradient).
Operator procedures and guidance
The operator provided descent procedure information in their FOPPM, but this primarily related to airways information and cautionary advice regarding terrain clearance. There was no information with regard to the operator having a policy for selection of the descent speed.
The FCTM did not contain guidance on the selection of a descent airspeed, but did contain information on the automatic airspeed selection capability of the aircraft.[24] However, the FCTM also noted that the operator’s policy was that the speed bug (the selected airspeed indicator) was to be used in manual mode only.
The ‘Before descent’ standard operating procedure in the FCTM noted that an action for the pilot flying was to select VS [vertical speed] mode on the AFCS. There was no other information regarding the AFCS mode selection for descent in the operator’s documentation.
ATSB observation
The selection of the descent airspeed was based upon the judgement of the flight crew, taking into account minimum and maximum airspeed limits and environmental conditions, such as icing conditions and turbulence.
Although there was no particular policy on what AFCS mode to use for descent, the before descent procedure in FCTM would suggest that vertical speed mode was the preferred option. The flight crew’s use of vertical speed mode was consistent with this.
Maximum operating speed procedures
The FCOM listed the VMO for the ATR 72 as 250 kts. It also noted that this limit must not be intentionally exceeded in any flight regime and was indicated as a red and white bar on the side of the airspeed indicator tape.[25]
The aircraft will activate an overspeed warning[26] if the VMO is exceeded; however, unlike other situations such as stall, the FCOM did not provide a recovery procedure.
The operator did not provide any procedures or guidance relating to overspeed situations in the FOPPM or FCTM. The operator reported that they did not provide any training to crews on overspeed recovery, nor was it included in any their simulator programs. However, an overspeed condition was demonstrated during their unusual attitude recovery nose-low scenario as part of their conversion course.
Crew resource management and human factors information provided by the operator
Crew resource management information
The operator provided information in the FOPPM on crew resource management (CRM) techniques. The FOPPM covered a range of factors relating to effective CRM, but only those aspects considered applicable to this occurrence are contained in this report.
VARA used the following definition of CRM:
CRM consists of all the knowledge, skills and roles used to most effectively direct, control and coordinate all available resources towards safe and efficient operations.
The material noted that communication is central to the success of CRM, and that the communication must be clear and effective. It also noted that, historically, aviation accidents contributed to by human error included factors such as distraction, and failure to communicate intent and plans.
The CRM information included the company’s policy on automation. They considered automation to be a useful tool to aid in-flight crew workload management and situation awareness. The automation policy contained a number of significant operational points, which included that one pilot must always be exclusively responsible for flight path management, regardless of the level of automation used. According to the flight crew roles, previously described, the one pilot responsible for flight path management is the pilot flying.
The operator’s CRM was largely based upon the ‘support process’. The support process is a guide to ‘appropriate assertion’ to enhance crew cooperation and situation awareness. The support process is made up of three distinct stages:
guidance
procedural (the solution statement)
emergency (the emergency statement).
The guidance stage is generally achieved through normal flight deck conversation. The use of standard calls provides both crew members with the same perception and understanding of their environment and its implications.
The procedural stage requires either a response or positive action from the other flight crew member. This stage is triggered following the repetition of either a standard operating procedure exceedance call, or an urgent guidance request by a flight crew member without an adequate resolution.
If time permits during the procedural stage, the supporting flight crew member should propose a solution using the solution statement. The solution statement consists of addressing the crew member by their position title, the proposed action and the outcome to be avoided.
The emergency stage is the last attempt to either raise the flight crew member’s situation awareness to that of the rest of the flight crew or for them to explain their actions and intent. The emergency statement stresses that action must be taken immediately and reiterates the action necessary to avoid an incident, accident or major safety breach. The emergency statement is mandatory when the solution statement has not resolved the situation.
The material makes it clear that a failure to respond to the emergency statement should be considered as some form of incapacitation and that a positive take-over of control is mandatory.
The support process was expected to progress from the guidance to emergency stages, as required (Figure 19), but the FOPPM noted that depending on the urgency of the situation, it may be necessary to skip some steps or enter the process at a later stage.
Figure 19: Flowchart of the relative urgency of communication used in the support process
Source: Virgin Australia Regional Airlines
ATSB observation
Although the captain did not use standard terminology, there were indications that he attempted to use the support process during the speed increase. A form of solution statement was made when telling the first officer to ‘pull it up’. However, the captain did not give the first officer the opportunity to respond and did not make an emergency statement, or announce his intention to take over control, before taking hold of the controls. This may have been based upon his perception of the limited time to act.
Human factors information
The FOPPM provided a range of human factors guidance material to highlight some potential ‘pitfalls’ for crews. The guidance material covered, among other aspects, threat and error management, situation awareness and information acquisition and processing.
Under the topic of threat and error management, the operator defined threats as:
events external to the aircraft that increase operational complexity
are outside the control of the flight crew
require immediate crew attention to maintain safety.
Examples of threats identified in the information included distractions, time pressures, system malfunctions and weather.
The guidance material advised that threats should be managed by verbalising the threat as it is recognised. Once identified flight crews should openly discuss management of the threat so that plans may be constructed and modified appropriately. It did, however, also note that discussion of threats that are not relevant to the particular flight may lead to distraction from more important activities.
The sections on error, and error management, focused on the prevalence of human error, and how they can be prevented, or at least minimised, and containment of errors made. A key strategy of error management involved identifying the most likely times errors will occur, such as during periods of high workload, and implementing safety procedures during these times. An example provided was that of the sterile cockpit procedures. The example highlighted take-off and landing represented the time of greatest accident risk and that the sterile cockpit procedure provided a filter that allows communication of safety issues, but blocks communication of non-urgent information.
Situation awareness was described as ‘the accurate perception of the factors and conditions affecting the aircraft, aircrew and passengers during a specific period … This includes knowing what has happened, what is going on in the present and how it may affect what may happen in the future.’
ATSB observation
In the context of awareness of the aircraft state, the captain’s non-pertinent conversation in the minutes before the speed increase probably reduced his situation awareness, making it difficult for him to properly interpret the potential effect the large speed trend vector would have on the safety of flight.
In a section on information acquisition and processing, the FOPPM identified that:
…we are all limited in the amount of information we can absorb at one time. Once that limit is reached, trying to take on board more information results in either the new information being ignored or other data being lost. In either case, situation awareness is compromised. The only way to maintain situation awareness during such periods is to control the workload of the crew.
One of the methods identified to manage workload was to ‘buy some time’ through the use of holding patterns, delaying a departure, requiring radar vectors or deferring non-essential tasks.
ATSB observation
In the period of flight leading up to the pitch disconnect event, the captain did not at all times minimise his workload. Carrying out preparation for the following flight and partaking in non-essential conversation, during periods where sterile cockpit procedures applied, would likely have unnecessarily distracted him from the current situation and increased his workload.
However, following the event, the captain displayed good workload management techniques by requesting radar vectors for the remainder of the flight and deferring non-essential communication with the company until after landing.
Human factors training
The company provided an internal human factors training course to all of their flight crew. This was required initial training for all incoming flight crew and was to be refreshed every 2 years. When the first officer and captain completed the Skywest human factors training, in May and September 2012 respectively, the course content was the same.
The course predominantly followed and expanded upon the information presented in the FOPPM. A Skywest/VARA human factors coordinator conducted classroom-based exercises involving facilitator-led presentations, discussions, and group activities.
Course materials included several presentations that addressed one or more of the topics. In the threat and error management presentation, flight crew were instructed to monitor the flight instruments as if they were hand flying, and if the aircraft or pilot flying were not doing what they were supposed to do, to intervene. The presentation itself did not amplify how the intervention was to occur, but it was likely intended that this would follow the support process, which was also included in the training package.
Cabin crew procedures
In the ATR 72 aircraft, the seat for the senior cabin crew member (SCCM) is at the rear of the cabin adjacent to the toilet, main cabin door (L1), and other rear door (R1). The cabin crew member (CCM2) seat is at the front of the cabin between the row 1 window emergency exits (Figure 20).
Figure 20: ATR 72 cabin configuration
Source: Virgin Australia Regional Airlines
The aircraft was equipped with an interphone and passenger address system that allowed communication between the flight deck and the two cabin crew stations, as well as between the cabin crew stations. Passenger address of the cabin was available from the flight deck and from both crew member stations.
The operator stipulated that ATR cabin crew commence securing the cabin for landing after the flight crew had switched the fasten seat belt sign on during descent. On completion of the cabin secure checks for landing, the senior cabin crew member was to ensure that all cabin crew were seated with full harness fitted prior to advising the flight crew that the cabin was secure.
On passing 5,000 ft above ground level the flight crew would cycle the seat belt sign to produce two chimes. This was a signal for the cabin crew that landing was imminent and if they were not seated, they shall be seated immediately.
In abnormal and emergency situations, the SCCM was the primary contact person for the flight crew. If the situation permitted, the SCCM would be called to the flight deck for a briefing. The SCCM would then brief the other cabin crew, and passengers if required.
Aircraft information
General
VH-FVR was an ATR 72-212A ‘600 Series’ aircraft manufactured in 2012 by the French-Italian aircraft manufacturer ATR (ATR-GIE Avions de Transport Régional). The ATR 72 is a high-wing, twin-engine turboprop short-haul regional airliner seating up to 78 (VH-FVR was configured for 68 passengers and 4 crew). The ATR 72 was derived from the ATR 42 by stretching the fuselage by 4.5 m and increasing the engine power. The ‘600 Series’ primarily differed from the previous ATR versions by the incorporation of a ‘glass cockpit’.[27]
Flight information presentation
ATR 72-212A ‘600-series’ aircraft have a ‘glass cockpit’ consisting of a suite of electronic displays on the instrument panel. The instrument display suite includes two primary flight displays (PFDs); one located directly in front of each pilot (Figure 21). The PFDs display information about the aircraft’s flight mode (such as autopilot status), airspeed, attitude, altitude, vertical speed and some navigation information.
The engine and warning display, located in the middle of the instrument panel (Figure 21), is divided into five areas. The upper half contains the flight control trim and flap setting information on the left, the engine display on the right and miscellaneous information (outside temperature, time and weight information) in the lower window of the upper half. The lower half is dedicated to the display of alerts and procedures from the flight warning system.
Figure 21: View of the ATR 72-212A glass cockpit showing the electronic displays. Highlighted are the captain’s and first officer’s primary flight displays, the engine and warning display and the master warning and caution lights on the captain’s and first officer’s sides.
Source: ATSB
Airspeed indication
Airspeed information is displayed on the left of each PFD in a vertical moving tape–style representation that is centred on the current computed airspeed (Figure 22). The airspeed tape (1) covers a range of 42 kt above and below the current computed speed (2) and has markings at 10 kt increments. The current computed airspeed is also shown in cyan figures immediately above the airspeed tape (3).
The airspeed trend indicator (4) presents a prediction of the airspeed in 10 seconds if the acceleration were to remain constant. The airspeed trend is represented as a yellow arrow that extends from the current airspeed reference line to the predicted airspeed.
The maximum permitted airspeed is presented as a prominent red and white striped bar on the right of the airspeed indicator tape (5). The maximum speed is calculated and presented based upon the current aircraft configuration. The example in Figure 22 represents the maximum operating speed of 250 kt.
The selected airspeed[28] used by the AFCS is presented as a cyan ‘bug’ on the right of the airspeed tape (6).
Figure 22: Representation of the airspeed indicator on the PFD
The example shows a current computed airspeed of 232 kt with an increasing speed trend that is shown in this case as a vertical yellow arrow and is approaching the maximum speed in the current configuration of 250 kt.
Note: the airspeed information shown in the figure is for information only and does not represent actual values from the occurrence flight. Source: ATSB
Altitude and vertical speed indication
The altitude and vertical speed indicators are located on the right side of each PFD (Figure 23). The altitude information is presented on a moving tape-style representation (1) with a numeric readout of the current altitude in feet (2). The selected altitude is shown on the altitude indicator in both bug form (3) and as a numeric readout above the altitude tape (4).
The vertical speed is presented immediately to the right of the altitude indicator. The indicator consists of a vertical scale (5) in thousands of feet per minute (ft/min), the current vertical speed being indicated by a green pointer (6), and a numeric readout in hundreds of feet per minute (7).
The selected vertical speed, used by the AFCS in vertical speed mode, is presented on the vertical speed indicator in both bug form (8) and as a numeric readout in hundreds of ft/min above the indicator scale (9).
Figure 23: Representation of the altitude and vertical speed indicators on the PFD
The example shows a current altitude of 9,540 ft with the bug for the selected altitude set at 9,200 ft. The current vertical speed is shown to be -1,200 ft/min and the selected vertical speed is set at -700 ft/min.
Note: the information shown in the figure is for information only and does not represent actual values from the occurrence flight. Source: ATSB
Flight warning system
The flight warning system provides the crew with information for the management of normal and abnormal configurations of the aircraft systems. The flight warning system interfaces with the flight crew through a visual and aural system. The visual system consists of master warning and master caution lights on the instrument panel combing, directly in front of each flight crew member, and the alert and procedure windows on the lower half of the engine and warning display (Figure 24). Two aural alert chimes, warnings and cautions, are associated with the master warning and master caution alerts.
Figure 24: The bottom half of the engine and warning display is dedicated to the flight warning system. The alert window, on the left, lists all of the active alerts. The procedure window on the right automatically presents any procedures associated with the active alert. The pitch disconnect warning is provided as an example.
Source: ATSB
The flight warning system provides four alert levels:
Warnings – corresponding to an emergency situation requiring the flight crew to take prompt corrective actions. Warnings are identified by the master warning light flashing red, with an associated continuous repetitive alert chime, and a red warning message displayed in the alert window on the engine and warning display.
Cautions – corresponding to an abnormal situation requiring the flight crew to take timely corrective actions. The time taken for action is left to the crew’s discretion. Cautions are identified by the master caution light flashing amber, with an associated single chime, and an amber message in the alert window on the engine and warning display.
Advisories – corresponding to a situation requiring crew monitoring due to a loss of redundancy or degradation of a system. Advisories are identified by an amber caution message displayed in the alerting window in the engine and warning display, but without an aural alert.
Information – corresponding to an information situation action. The information is provided by a cyan, green or white message on the associated control display. There is no associated message on the engine and warning display.
Overspeed alert
The flight warning system included an overspeed alert. This alert is intended to warn the flight crew that they have exceeded a limit airspeed. The limit airspeed, indicated by the red and white striped bar on the airspeed tape, varies depending on the configuration of the aircraft. This limit may be the maximum flap extension speed, the maximum landing gear extension speed, or the maximum operating speed for the clean aircraft.[29]
The overspeed alert activates when the aircraft exceeds the applicable airspeed limit and persists until the airspeed is reduced to below the limit speed. The overspeed alert is an aural ‘clacker’ alert; there was no associated visual warning for an overspeed. The alert cannot be cancelled by the flight crew, except by using the emergency audio cancel switch.[30].
Aircraft structure
The aircraft’s fuselage and wing are primarily constructed from aluminium alloy. The vertical and horizontal stabilisers of earlier ATR 42 and 72 aircraft (Figure 25) were also constructed from aluminium alloy components, but in later models, including the ATR 72-212A, both the vertical and horizontal stabilisers were constructed from carbon fibre reinforced polymer composite materials.
Figure 25: ATR 72 70-seat, twin-engine turboprop, high-wing regional airliner highlighting the location of the vertical and horizontal stabilisers.
Source: ATSB
The horizontal stabiliser is primarily made up of three components; a closed box structure, leading edges and the elevators (Figure 26). The closed box structure provides the primary structure for the horizontal stabiliser and consists of spars,[31] inboard and outboard closure ribs, and upper and lower skin panels (Figure 27). The skins are joined by splice plates bridging the centre section.
Figure 26: General components of the horizontal stabiliser include the primary box structure, leading edges and elevators, hinged off the rear spar.
Source: ATSB
Figure 27: The closed box structure for the horizontal stabiliser consists of a number of spars, including the front and rear spars, skins panels, closure ribs and splice plates.
Source: ATSB
The horizontal stabiliser is mounted on the top of the vertical stabiliser and attached at six points, three on each side, using aluminium alloy lugs (Figure 28). These attachment points are normally covered by an aerodynamic fairing and are not visible without removal of the fairings.
Figure 28: Attachment of the horizontal stabiliser to the vertical stabiliser. Three of the six attachment lugs highlighted within dashed orange boxes. Three similar lugs are on the left side of the attachment.
Source: ATSB
Aircraft systems
The ATR 72 primary flight controls essentially consist of an aileron and spoiler on each wing, two elevators and a rudder. All of the controls, except for the spoilers, are mechanically actuated from controls in the cockpit.
Pitch control system
Pitch control of the aircraft is provided by two elevators, one on the left and one on the right (Figure 29). The elevators are surfaces that form the rear edge of the horizontal stabiliser and can be rotated up or down about a hinge that attaches the elevators to the stabiliser. Rotation of the elevators up or down changes the direction and magnitude of the aerodynamic forces generated by the horizontal stabiliser, thus providing pitch control. Pitch trim is provided by trim tabs located on the inner trailing edge of each elevator. The pitch trim tabs, like the elevators themselves, can be rotated up or down, changing the aerodynamic load on the elevators.
When the elevators are moved, the trim tabs move in the opposite direction to the elevator. This produces an aerodynamic load on the elevator in that direction to reduce the pilot effort required to move the controls.
Figure 29: Location of the elevators on the horizontal stabiliser of the ATR 72 (highlighted in blue)
Source: ATSB
The pitch control system consists of left and right control columns in the cockpit connected to the elevators via a system of cables, pulleys, push‑pull rods and bell cranks (Figure 30). The left (captain’s) and right (first officer’s) control systems are basically a copy of each other, where the left control column is connected to the left elevator and the right system is connect to the right elevator.[32] Each of the left and right systems are referred to as channels.
To permit continued operation in the event of the controls becoming jammed, the pitch control system has been designed to allow the left and right control channels to operate independently.[33] This is achieved by the inclusion of a spring-loaded ‘pitch uncoupling mechanism’ (PUM) located between the left and right elevators, as highlighted in Figure 30.
Figure 30: ATR 72 elevator/pitch control system with the pitch uncoupling mechanism circled in red
Source: ATR, annotated by the ATSB
In normal operation, the PUM is engaged, connecting the left elevator directly to the right elevator. The forces applied on one side of the pitch control system are transmitted from one elevator to the other as a torque (twisting force) through the PUM. In this configuration, moving one control column moves both the left and right elevators and the other control column. When the PUM is activated (disengaged) the left elevator is disconnected from the right elevator and the controls operate independently. Activation of the PUM, separating the left and right channels, is operationally referred to as a pitch disconnect.
The flight crew are not required to action any separate systems in order to activate the PUM. Activation occurs automatically when the torque transmitted through the PUM reaches a preset level. The design intention was that the activation torque would be reached by the flight crew applying a control force against a jam. This could also be achieved by flight crew simultaneously applying opposing forces on the left and right control columns. The prescribed activation torque was equivalent to opposing forces of 50 to 55 daN (about 51 to 56 kg force) being simultaneously applied to each control column.[34]
The status of the PUM is monitored by a sensor in the mechanism. The flight crew are alerted to activation of the PUM by the master warning (which provides both aural and visual alerts) and a flashing red PITCH DISC message in the alerts window on the engine and warning display (Figure 24). The associated pitch disconnect procedure is also presented on the engine and warning display in the procedure window adjacent to the PITCH DISC message.
The ATR 72-212A included a reconditioning electrical actuator in the PUM assembly. This component allowed the flight crew to reconnect the PUM by placing the controls in the neutral position and depressing a button in the cockpit. The reconditioning actuator is deactivated in flight and reconnection of the PUM can only be achieved on the ground. This reconditioning feature was not included in early variants of the ATR 42/72. In those aircraft, reconnecting the PUM was a maintenance action that required access to the mechanism between the elevators.
ATR advised that, because a jammed pitch control can occur in any phase of flight, a spring‑loaded PUM was selected over a directly–controlled mechanism. Their logic for this approach was that this type of mechanism provided an intuitive way to uncouple the two pitch channels and recover control through either channel. ATR also advised that a directly‑controlled uncoupling mechanism increased the time necessary for a pilot to identify the failure, apply the procedure and recover pitch authority during a potentially high-workload phase (such as take-off or the landing flare).
The pitch control system also includes a force measuring system located in the linkage at the base of each control column (identified as ‘dynamometric rod’ in Figure 30). The force measurements are provided to the autopilot system and the FDR system, where it is recorded as the ‘pitch axis effort’. The pitch axis effort values recorded on the FDR can be converted to an equivalent force applied at the grips of the control column. The function for this conversion was supplied by ATR.
System testing
During examination of the aircraft by the ATSB, operation of the pitch disconnect system was tested in accordance with the instructions in the aircraft maintenance manual. The loads applied to the control columns to activate the PUM were found to be at a value marginally greater than the manufacturer’s required value. The reason for this was not determined, but may be related to the damage sustained during the pitch disconnect event.
It was noted during the testing that there was a slight delay between the activation of the PUM and the activation of the aural and visual alerts. Analysis of videos taken of the testing identified a delay of approximately half a second between separation of the pitch channels and activation of the master warning. There was also a delay of approximately 1 second between the pitch channel separation and the presentation of the PITCH DISC message on the engine and warning display. Analysis of the aircraft systems by the aircraft manufacturer found that these delays were consistent with the characteristics of the system. [35]
Automatic flight control system
The aircraft was equipped with an automatic flight control system (AFCS) that included flight director and autopilot functionality. The AFCS provides a number of lateral and vertical control modes that can be selected by the flight crew to manage the aircraft’s flight path. ATR recommended systematic use of the AFCS to increase the accuracy of guidance and tracking, enhance passenger comfort, and reduce pilot workload, while increasing safety.
The flight director provides information to the flight crew through command bars on the primary flight display. If the flight director command bars are active during manual flight, the pilot flying maintains the selected flight path by making control inputs to follow the command bars.
The autopilot includes servo-actuators in the pitch, roll and yaw control systems that move the control surfaces as directed by the autopilot (Figure 30 shows the location of the autopilot servo-actuator in the pitch system). When engaged, the autopilot will automatically make control inputs to satisfy the flight director commands. The autopilot also includes a yaw damper[36] function that can be engaged by itself, or in combination with the autopilot.
Manual control can be temporarily achieved by the flight crew without disengaging the autopilot through the touch control steering (TCS) function. This function is enabled by pressing the TCS button, located on the front of each control wheel, and is only active while the button is depressed.
The AFCS control modes include a basic mode, which holds the pitch and roll attitude that the aircraft was at when the autopilot was engaged, and a range of lateral and vertical control modes. The vertical modes include altitude hold, indicated airspeed hold, and vertical speed hold.
In altitude hold mode the AFCS will maintain the altitude at which the mode was selected.
Indicated airspeed hold mode will maintain the airspeed at the time that it is engaged. The selected airspeed can be manually adjusted by the flight crew, or automatically set by the AFCS and is displayed on the PFD airspeed tape as a ‘bug’ on the side of the tape, as previously described in the section titled Airspeed indication.
When vertical speed hold mode is engaged, the AFCS will hold the aircraft’s vertical speed at the time of selection. The selected vertical speed can be manually changed by the flight crew through a control on the instrument panel, or by using the TCS function to manually attain the desired vertical speed. The vertical speed at the time that the TCS button is released will be set as the target speed for the AFCS. The selected vertical speed is displayed on the vertical speed indicator.
There is also another vertical mode, ‘altitude select mode’, that arms the AFCS during a descent or climb to capture and hold a selected altitude. If a different altitude is selected, the AFCS will guide the aircraft to the selected altitude, using the either the indicated airspeed or vertical speed modes, whichever has been selected. The selected altitude can be manually selected by the flight crew, or be part of a flight plan in the flight management system.
In all cases, the aircraft is controlled in its selected vertical mode by deflection of the elevators. The AFCS does not control the engine power setting, so that in all modes, the engine power must be manually controlled by the flight crew.
When engaged, the autopilot can be manually disengaged by any of the following actions:
Pressing the autopilot or yaw damper push-buttons on the AFCS control panel.
Pressing the autopilot quick disconnect switch push-button on either control wheel.
Actioning any of the manual pitch trim switches.[37]
Applying a force over 30 daN on any rudder pedal, or 10 daN on the pitch axis control column. Applying a force of 30 daN to the rudder pedals will also disengage the yaw damper.
The autopilot will also automatically disengage if:
the autopilot engagement condition is no longer met
the stall warning threshold is reached
there is disagreement between, or failure of, the air data or attitude and heading reference systems
there is a mismatch between the left and right trim positions (trim mismatch).
Speed selection philosophy
The FCOM stated that the 600 series ATR 72 provided two selectable speed modes: AUTO speed and MAN speed.
AUTO speed, presented as a magenta bug on the PFD speed tape, is the managed speed computed by the flight management system and depends on the flap lever position, power management, normal and icing conditions, number of operating engines, and other factors.During the descent phase, the automatic speed target was 240 kts.
MAN speed, displayed as a cyan bug on the PFD speed tape, is the speed manually selected by the pilot.
The FCOM noted that the AUTO speed mode ‘ensures safe speeds to operate the aircraft in all flight phases.’
Operational information and procedures associated with a pitch channel jam and pitch disconnect
The FCOM contained system information and procedures associated with the pitch disconnect system.
The FCOM section describing the pitch control system noted that ‘In the case of jamming, pitch control will be recovered by applying on both control columns a differential force (52 daN) disengaging the pitch coupling system.’
The Procedures and techniques section of the FCOM, noted:
ATR 72 is equipped with classical mechanical primary flight controls on all three axis. The following peculiarities must be highlighted:
PITCH: Both elevators are connected through a pitch uncoupling device in order to leave sufficient controllability in case of mechanical jamming of one control surface.
Activation of this device:
- requires heavy forces (52 daN/114 lbs) to be applied to the control columns, which minimizes the risk of untimely connection.
- indicated to the crew through the red <> on the EWD.
- allows the flight to be safely achieved: refer to procedures following failures.
Note 1: WHEN PITCH DISCONNECT takes place WITHOUT REAL JAMMING, speed has to be limited to 180 kt and bank angle to 30° until flap extension to avoid overstressing the stabiliser.
Note 2: The TWO yokes must be held once the aircraft is landed.
The FCOM section regarding Procedures following failure contained two items relating to the pitch disconnect, one was the elevator jam procedure (Figure 31), the other was specifically for a pitch disconnect (Figure 32).
Figure 31: ATR 72 FCOM procedure for an elevator jam
Source: ATR
Figure 32: ATR 72 FCOM procedure for a pitch disconnect
Source: ATR
Recorded information
VH-FVR was fitted with a flight data recorder (FDR) and cockpit voice recorder (CVR), as it was required to. One FDR and two CVRs were received by the ATSB on 3 March 2014 and downloaded. One CVR contained the flight on 20 February 2014, having been removed by the operator following the pitch disconnect occurrence, and the other contained the flight into Albury, NSW on 25 February 2014, when there was a suspected birdstrike.
Flight data recorder
The FDR contained 68.8 hours of data, capturing 51 flights, which included both the pitch disconnect and suspected birdstrike occurrences.
In-flight upset and pitch disconnect event
The following figures provide selected relevant parameters from the FDR from the flight on 20 February 2014:
Figure 33 presents the control column position and elevator deflections during the control check prior to the flight. This confirms that the no-load control column-to-elevator ratio was about 1:2.
Figure 34 presents the primary flight path control parameters (engine torque, airspeed, and vertical speed) during the descent. This figure also indicates the time of key events during the descent.
Figure 35 presents a period spanning 30 seconds before and after the pitch disconnect.
Figure 36 presents the 6-second period, highlighted in yellow in Figure 35, to provide clarity of the parameter values during the pitch disconnect event.
Figure 37 presents selected lateral-directional (yaw and roll) control parameters over the same 6‑second period as Figure 36.
Figure 38 presents selected environmental data recorded over a 24 second period, from about 22 seconds before the pitch disconnect.
Figure 39 presents the parameters relating to disconnection of the autopilot, including the captain’s trim switch, AFCS message, and autopilot/yaw damper engagement status parameters.
Figure 33: FDR information showing the control column and elevator positions during the pre-flight control checks.
Note: the scale for the control column is twice that of the elevator, indicating that the control column to elevator ratio was effectively 1:2. Source: ATSB
Figure 34: FDR information showing the primary control parameters (engine torque, airspeed, and vertical speed) from the top of descent to shortly after the pitch disconnect. Key events from the descent are also identified on the chart.
Source: ATSB
Figure 35: FDR information showing the relevant pitch parameters for a period spanning about 30 seconds before and after the pitch disconnect. The yellow shaded period is presented in Figure 36.
Source: ATSB
Figure 36: FDR information showing the relevant pitch parameters for the shaded 6‑second period in Figure 35, during which the pitch disconnect took place. The estimated time of the pitch disconnect is shown with a black dashed line at time 05:40:52.6
Source: ATSB
ATSB observations
The following observations were made regarding the recorded data presented above:
Leading up to the in-flight upset and pitch disconnect, there was no indication of turbulence.
Leading up to the pitch disconnect, both elevators moved in unison.
In the seconds leading up to the in-flight upset and pitch disconnect, there were a number of rapid increases in the recorded airspeed.
The first officer made three nose-up control inputs correlating with the use of the touch control steering. Between each of the nose-up inputs were nose-down inputs of 7 to 8 daN and a peak lasting about 0.1 second of about 15 daN.
The peak vertical acceleration was reached approximately 0.8 seconds after the peak elevator deflection on all three occasions.
At about time 05:40:50.1, or about 2.5 seconds before the pitch disconnect, a small load (pitch axis effort) of about 3 daN was registered on the captain’s pitch control.
The captain started to make a nose-up pitch input shortly before the FO made the third nose-up input.
When the FO started moving the control column forward (nose-down) at about 05:40:52.3, the load on the captain’s control increased (nose-up) at about the same rate that the first officer’s decreased.
A 05:40:52.6 the elevators uncoupled. At that time: - the pitch axis effort recorded in the captain’s pitch channel was 67 daN[38] and in the first officer’s was ‑8.5 to ‑19 daN[39] - the aircraft pitch angle was increasing - the vertical acceleration was about +2.8g and increasing.
After this time, the elevators no longer moved in unison.
Peak elevator deflections of +10.4° and -9.3° were recorded about 0.2 seconds after the pitch disconnect.
About 0.25 seconds after the peak deflections, the captain moved the control forward until both elevators were in similar positions.
A maximum vertical acceleration of 3.34g was recorded at about 05:40:53.0.
The master warning activated after the pitch disconnect.[40]
Figure 37: FDR information showing selected lateral-directional (yaw and roll) control parameters over the same 6 seconds as Figure 36. The yaw axis force required to disconnect the autopilot (AP) is identified as a pink dashed horizontal line on the yaw axis effort parameter.
Source: ATSB
Figure 38: FDR information showing selected environmental data over a 24 second period, from 22 seconds before the pitch disconnect. The estimated time of the pitch disconnect is shown with a black dashed line at time 05:40:52.6
Source: ATSB
Figure 39: FDR information showing the captain’s pitch trim up command (PTUPCAPT), AFCS message (AFCSMAM) and autopilot/yaw damper engaged (APYDENG) parameters following the pitch disconnect event.
Source: ATR
ATSB observation
The data indicates that the recorded autopilot/yaw damper engaged parameter changed directly from both engaged to no automation. However, the automatic flight control system message changed from no message, to autopilot disengaged and then to autopilot/yaw damper disengaged, before returning to no message. It was also observed that the captain made a nose-up pitch trim command at about the same time.
Each of these parameters are recorded once per second; however, each is written at a slightly different time. Because of this, we can see that the autopilot was probably disengaged by the captain moving the pitch trim rocker switch on the control yoke, before a rudder force in excess of the threshold disengaged the yaw damper.
The captain reported that he intentionally disengaged the autopilot; however this data indicates that he probably used the trim switches instead of the autopilot disconnect. It was not known if the captain intentionally actioned the trim switches to disconnect the autopilot, or if it was accidental. The autopilot disconnect button is located adjacent to the trim switches on the same handle of the control yoke.
Analysis of the elevator positions after the pitch disconnect
Data recorded on flights before and after the occurrence flight were also examined. The average elevator positions were compared before and after the occurrence flight. Figure 40 shows the average elevator positions, and the difference between the left and right elevator positions, for a range of flights before and after the occurrence flight.
Figure 40: Comparison of the average position for the left and right elevators over a range of flights before and after the pitch disconnect.
Also included on the chart is the difference between the left and right elevator positions. Note: A negative flight number indicates that the flight was taken before the pitch disconnect. Source: ATSB
ATSB observation
After the occurrence flight, there was a persistent difference between the left and right elevator positions of about 0.5º that was not evident prior to the pitch disconnect.
The size and persistent nature of the difference between the elevator positions is an indication that the damage to the horizontal stabiliser was generated during the pitch disconnect event and that any further degradation of the structure was probably minimal.
Vertical accelerations following the pitch disconnect
Examination of the vertical accelerations (flight load factors) during the 13 flights following the pitch disconnect (Figure 41), found that the largest vertical acceleration was 1.4 g.
Figure 41: Vertical acceleration recorded on flights between 20 February 2014 and 25 February 2014. The peak acceleration during the in-flight upset was 3.34 g. The maximum on the subsequent flights was 1.4 g.
Note, the data spikes below 0.5 g are due to the system operation when the aircraft is powered down and do not indicate that the vertical acceleration was less than 0.5 g. Source: ATSB
Selected airspeed used during descent
The airspeed that was initially selected for the descent for the 51 flights contained on the FDR were examined (Figure 42). For a number of the flights, the selected airspeed was lowered during the descent, for reasons that were not determined, but could be for factors such as turbulence and airspace restrictions. The initial selected airspeeds varied from 203 to 235 kt. The data indicates that 230 kt was the most commonly selected initial selected descent airspeed, with 29 of the 51 descents being at this speed. Eleven flights, including the occurrence flight (flight 38), had a selected airspeed of 235 kt, which was the second most commonly selected speed.
Figure 42: History of the initially selected descent airspeed for the descent for each of the 51 flights captured on the FDR. The occurrence flight is highlighted in orange.
Source: ATSB
Cockpit voice recorder
The CVR fitted to VH-FVR recorded to solid state memory on an endless loop principle (that is, the oldest recording is overwritten by the most recent). The CVR from the 20 February flight contained over 2 hours of recorded sounds on four separate channels, consisting of:
captain’s interphone system
first officer’s interphone system
cockpit area microphone
cabin passenger address system.
The CVR was downloaded by the ATSB and the quality of all channels was good. The contents were found to include:
The last 15.5 minutes of flight VA652 from Sydney to Canberra. The recording commenced shortly before the start of the descent and finished when the engines were shut down at terminal.
About 1 hour and 3 minutes of flight VA657 from Canberra to Sydney (the occurrence flight). The recording commenced when the engines were started at Canberra and finished when the engines were shut down in Sydney at the conclusion of the flight.
The remainder consisted of a number of ground events during maintenance, which contained background sounds and conversations by maintenance staff captured on the cockpit area microphone. There was no information relevant to the occurrence flight identified within these sections.
The CVR was reviewed in detail by the ATSB and any information obtained from the CVR that was pertinent to the investigation has been used in the development of this report.
Aircraft design risk controls – Certification of the pitch disconnect system
During the certification of an aircraft type, the applicant (in this case the aircraft manufacturer) and the certifying authority negotiate an agreed design standard and common interpretation of the requirements contained in that standard. To obtain certification of the aircraft type, the applicant must satisfy the certifying authority that compliance has been demonstrated for all applicable sections of the agreed design standard.
At the time that the ATR 72 was certified in 1992, the certifying authority was the Direction Générale de l'Aviation Civile (the French National Aviation Authority). On 28 September 2003, the certifying authority changed to the European Aviation Safety Agency (EASA).
Design standard
The ATR 72 was designed and certified to the (European) Joint Aviation Requirements Part 25 (JAR-25). The applicable change status of JAR-25 used for the certification was change 13. JAR‑25 consisted of 3 sections. Section 1 contained the requirements, Section 2 contained the acceptable means of compliance and interpretations, and Section 3 contained the advisory material. The paragraphs in each of sections 1, 2 and 3 were identified by JAR, ACJ[41] and AMJ[42] prefixes, respectively.
The ATSB identified that the following requirements are of particular relevance to this investigation.
JAR 25.143 Controllability and manoeuvrability
JAR 25.143(a) specified that the aircraft must be safely controllable and manoeuvrable during take-off, climb, level flight, decent, and landing. JAR 25.143(b) also required that it must be possible to make a smooth transition from one flight condition to any other without exceptional piloting skill, alertness, or strength, and without danger of exceeding the limit load factor.
JAR 25.143(c) specified that, where, during testing required by (a) and (b), marginal conditions exist with regard to the required pilot strength, the maximum acceptable pilot forces for the pitch control are:
75 lb (33.4 daN)[43] for a temporary application with both hands available.
50 lb (22.2 daN) for temporary application with one hand available.
10 lb (4.4 daN) for prolonged application.
The associated advisory material, ACJ 25.143(c), noted that ‘In the event of failure conditions which are assessed as improbable, greater forces may be acceptable.’
JAR 25.305 Strength and deformation
This section of the regulations defined the requirements for the proof of strength for the aircraft’s structure. This included the definitions of limit and ultimate loads:
(a) The structure must be able to support limit loads without detrimental permanent deformation. At any load up to limit loads, the deformation may not interfere with safe operation.
(b) The structure must be able to support ultimate loads without failure for at least 3 seconds. However, when proof of strength is shown by dynamic tests simulating actual load conditions, the 3‑second limit does not apply.
It also included a requirement regarding the effects of flexibility of aircraft structure and the rate of load application.
(c) Where structural flexibility is such that any rate of load application likely to occur in the operating conditions might produce transient stresses appreciably higher than those corresponding to static loads, the effects of this rate of application must be considered.
JAR 25.397 Control system loads
The section specifies that the aerodynamic loads on the control surfaces need not exceed those that would be generated by a pilot applying the limit pilot forces specified in JAR 25.397(c) to the controls in the cockpit. For a system with a control wheel, the maximum pilot force for the elevator was specified as 300 lb (133.4 daN) and the minimum was 100 lb (44.5 daN).
ATSB observation
This requirement indicates that the standard recognises the capacity for flight crew to apply control input loads greater than those specified in JAR 25.143(c), for controllability of the aircraft. Thus, the standard requires that the total control system has the strength to withstand such input loads.
JAR 25.399 Dual control system
This section of the regulations required that dual control systems be designed for (a) the pilots to be operating in opposition and (b) in the same direction, with forces not less than the loads specified.
ATSB observation
This requirement implies that when this regulation was written, the authors considered that opposing dual control inputs was a foreseeable situation.[44]
Under the context, which the requirement was presented, the implication is that the control system must have the strength to withstand the dual control inputs. The requirements did not specify that consideration be given to the effects dual control inputs may have on the aircraft handling, or other potential outcomes.
JAR 25.671 Control systems – General
This section details a number of general requirements regarding the detailed design of control systems. Of particular note is subsection (c) which states:
The aeroplane must be shown by analysis, test, or both, to be capable of continued safe flight and landing after any of the following failures or jamming in the flight control system and surfaces (including trim, lift, drag and feel systems) within the normal flight envelope, without requiring exceptional piloting skill or strength. …
The applicable failure case listed was case (3):
Any jam in a control position normally encountered during take-off, climb, cruise, normal turns, descent and landing unless the jam is shown to be extremely improbable, or can be alleviated. A runaway of a flight control to an adverse position and jam must be accounted for if such runaway and subsequent jamming is not extremely improbable.
Additional interpretive material was provided in ACJ 25.671. This included a section on 25.671(c), but only applied to subsection (1), which was not applicable to the jam case.
JAR 25.1309 Equipment, systems and installations
This section applies to the safe functioning of equipment, systems and installations. The parts applicable to this investigation are:
(a) The equipment, systems and installations whose functioning is required by the JAR and normal operating regulations must be designed to ensure that they perform their intended functions under any foreseeable operating conditions. (See ACJ Nos. 1 and 2 to JAR 25.1309.) …
(b) The aeroplane system and associated components, considered separately and in relation to other systems, must be designed so that (see ACJ Nos. 1 and 3 to JAR 25.1309) –
(1) The occurrence of any failure condition which would prevent the continued safe flight and landing of the aeroplane is extremely improbable, and
(2) The occurrence of any other failure condition which would reduce the capability of the aeroplane or the ability of the crew to cope with adverse operating conditions is improbable.
…
(d) Compliance with the requirements of subparagraph (b) of this paragraph must be shown by analysis, and where necessary, by appropriate ground flight or simulator tests. The analysis must consider (See ACJ No. 1 to JAR 25.1309) –
(1) Possible modes of failure, including malfunctions and damage from external sources.
(2) The probability of multiple failures and undetected failures.
(3) The resulting effects on the aeroplane and occupants, considering the stage of flight and operating conditions, and
(4) The crew warning cues, corrective action required, and the capacity of detecting faults.
To assist the designer in meeting the requirements of JAR 25.1309, additional guidance for ‘acceptable means of compliance and interpretations’ was provided in ACJ 25.1309. This information was applicable as it provided the guidance material for assessment of the risks of failures and events on the safety of the aircraft.
The guidance stated that the objectives of JAR 25.1309 (a) to (d) were that:
Systems, considered separately and in relation to other systems, should be designed with the objective that there is an inverse relationship between the maximum acceptable probability of an occurrence and the severity of its Effect, such that a Catastrophe from all system causes is Extremely Remote.
The effects were categorised from minor through to catastrophic, where a:
Minor Effect results in a slight reduction in safety margins such that the airworthiness is not significantly affected and any actions are well within the capability of the crew.
Major Effect results in a significant reduction in safety margins and there is a reduction in the ability of flight crew to cope with adverse operating conditions as a result of an increase in workload or as a result of conditions impairing their efficiency. There may be injuries to occupants.
Hazardous Effect results in a large reduction in safety margins. There may be physical distress to the flight crew and they cannot be relied upon to perform their tasks accurately or completely. Serious injury, or death, of a relatively small proportion of occupants may occur.
Catastrophic Effect is one which results in the loss of the aeroplane and/or fatalities.
The associated probabilities for major, hazardous and catastrophic effects were defined as:
Remote – unlikely to occur to each aeroplane during its total operational life but which may occur several times when considering the total operational life of a number of aeroplanes of the type. (10-5 to 10-7 occurrences per flight hour[45]).
Extremely Remote – unlikely to occur when considering the total operational life of all aeroplanes of the type, but nevertheless, has to be considered as being possible. (10-7 to 10-9 occurrences per flight hour).
Extremely Improbable – So Extremely Remote that it does not have to be considered as possible to occur. (less than 10-9 occurrences per flight hour).
Although JAR 25.1309 and the associated ACJ were concerned primarily with failure conditions, the ACJ contains a section on operation without failure conditions which states:
Systems, considered separately and in relation to other systems, should be designed that, when they are operating within their specifications, it is Extremely Improbable that an Event will occur such as to cause a Catastrophe.
An ‘Event’ was defined as an occurrence which has its origin distinct from the aeroplane.
EASA Certification Specification 25 (CS-25)
Since the certification of the ATR 42/72 series aircraft, the certification design standard JAR-25 has been replaced by EASA Certification Specification 25 (CS-25). Although CS-25 was not applicable to the structure or control system of the ATR 72, it was reviewed to determine if there had been any significant changes that would affect the design and certification.
There were a number of minor changes noted, but the most significant was the inclusion of an additional requirement CS 25.302 Interaction of systems and structures. This required that for aeroplanes equipped with systems that affect structural performance, either directly or as a result of a failure or malfunction, the influence of these systems and their failure conditions must be taken into account. There was also an associated appendix that contained additional information with regard to this requirement.
EASA informed the ATSB that:
From a historical point of view, the requirements of CS 25.302 and Appendix K were developed to mainly address systems that provide a certain load alleviation function. As such, these requirements are currently mostly related to failure cases identified under CS 25.1309. Although some of the considerations mentioned in Appendix K could also be used for the failure conditions identified under CS 25.671 (excluding jamming conditions), such as dynamic effects at the time of failure, CS 25.302 is generally not applied to mechanical flight control systems.
There were some changes and additions to the control system design requirements. The only change potentially applicable to this investigation was in CS 25.415. Subpart (e) required that ‘where control system flexibility is such that the rate of load application in the ground gust conditions might produce transient stresses appreciably higher than those corresponding to static loads’ additional factors be applied to the control system loads. However, as the text suggests, this was only applicable to the ground gust conditions. There were no similar requirements for in-flight conditions.
Similar to JAR-25, CS-25 included additional advisory and interpretive material with the design standard. In CS-25, this was presented as Book 2 – Acceptable Means of Compliance (AMC), with the information corresponding with the particular requirements prefixed with AMC. AMC 25.671 was essentially identical to ACJ 25.671, with only the references differing to the ACJ.
Flight control system safety assessment
In showing compliance with the design standard during certification, in particular JAR 25.671(c) and 25.1309, the manufacturer completed a system safety assessment for the flight control system. The ATSB was supplied with an extract of that system safety assessment for items pertaining to the jamming of the flight control system and untimely operation of the pitch uncoupling mechanism.
The flight control system safety assessment extract showed that the manufacturer’s assessment included structural studies, simulation and flight test. Examination of the assessments made within the system safety assessment extract found that the manufacturer had considered that if the system became jammed the PUM allowed the left and right channels to be separated, permitting continued safe flight on one channel alone. There was also consideration of an untimely disconnect due to inadvertent activation, or mechanical failure of the PUM, that resulted in the separation of the two systems.
To demonstrate continued safe flight and landing, the manufacturer considered conditions that occur after the left and right channels had been separated. This included consideration of both the aircraft’s handling qualities and the loads associated with manoeuvring the aircraft. They considered six jamming scenarios, including a jam during cruise at VMO. For each of those scenarios, flight loads were computed for the expected manoeuvres, including those leading to load factors between -1g and 2.5g, and gust loads.
ATSB observation
Although ATR considered a number of scenarios regarding the structural capability of the aircraft with the PUM activated (that is the systems decoupled), there was no indication that the effects on the aircraft from any transient aerodynamic loads generated immediately following activation of the PUM were considered.
The basic premise for a pitch disconnect at high airspeed, was that the aircraft could be safely slowed[46] to an airspeed below the limits that the manufacturer imposed for flight with a pitch disconnect. Those speed limitations were presented in the FCOM. The maximum of those aircraft limitations was 180 kts (70 knots below VMO) and there was no requirement to slow the aircraft to a speed below that limitation before disconnecting the controls.
Overall, the manufacturer assessed that the effect resulting from a jam or inadvertent operation of the PUM was ‘major’, when the correct procedure was applied. The probability was assessed as ranging from 2.0x10⁻⁷ to 3.9x10⁻⁷ occurrences per flight hour. Thus, the objective that major consequences occur at a rate no greater than ‘remote’ was shown for the cases studied. Associated with the system safety assessment were the results from a flight test that was carried out to show compliance with JAR 25.671(c). The results also noted that the failure case was classified as major, but added that it was due to ‘operational constraints’.
During the investigation, the aircraft manufacturer reassessed the likelihood of an untimely pitch disconnect due to inadvertent opposing dual control inputs. The reassessment was based upon the number of incidents reported to the manufacturer[47] and the number of hours flown by the world‑wide fleet of ATR aircraft. This reassessment determined that the occurrence rate was 4.23x10⁻⁷ occurrences per flight hour, which was only slightly greater than their predicted values and still with the range for a remote probability specified in ACJ No. 1 to JAR 25.1309.
Flight testing
The flight test carried out during certification of the ATR 72 to demonstrate that the aircraft was ‘capable of continued safe flight and landing without requiring exceptional piloting skill and strength following jamming of one pitch control channel’ was based on what the manufacturer considered was the most adverse case with regards to aircraft controllability. The case examined during the flight test involved manually holding the right control column such that the elevator was maintained at 11° nose-up for a go-around and landing.
As a result of the testing, the manufacturer and certifying authority accepted that ‘Approach and landing with one pitch channel jammed do not require exceptional skill or pilot strength when relevant procedure is applied’.
The flight test results provided to the ATSB included an 11 second section of data around the time that the flight crew intentionally activated the PUM and separated the pitch control channels in-flight.
The flight test data showed that when the flight crew initiated the control inputs to separate the left and right pitch channels, the airspeed was at about 154 kt (96 kt below the aircraft’s VMO) and the elevators were at about 4° nose-up. As such, the pitch disconnect was carried out in preparation for the test, rather than being considered as part of the test to show compliance.
The flight test data also indicated that the pitch disconnect was achieved by the right seat occupant holding the control column in a fixed position while the test pilot in the left seat pulled back on the control column with sufficient force to activate the PUM.
An ATSB review of the recorded flight test data identified that the:
maximum recorded pitch axis efforts were 62 daN and 56 daN on the left and right pitch channels, respectively
maximum difference between the elevator positions during the test was 34° (left elevator at ‑23° and right elevator at 11°)[48]
left control column moved a further 5° nose-up following activation of the PUM while the recorded pitch axis effort dropped from 62 to 20 daN
elevator movement following activation of the PUM was initially increased, before presenting a characteristic of a transient underdamped oscillatory behaviour (refer to appendix A).
Design load
The manufacturer advised that, having considered a number of load cases, the maximum ultimate load[49] condition for unsymmetrical elevator deflection was the loads generated by the following conditions, plus an additional 10 per cent margin:
154 kt airspeed
elevator nose-down (as a result of jammed 8° the stick pusher jamming at full extension)
the other elevator at full nose-up position, leading to a difference of 33° between both elevators.[50]
The manufacturer further advised that the ultimate load was also equivalent to the following conditions, without any margin:
the above condition at 161 kt
differential elevator deflections of 36° (full opposing deflections) at 154 kt
differential elevator deflection of 15.6° at 250 kt (VMO).
Manufacturer’s engineering analysis
Preliminary loads analysis
In April 2014, ATR performed a load analysis based on data from the aircraft’s quick access recorder[51] that had been supplied to them by VARA. The analysis was based upon a simplified methodology and was aimed at identifying the main structural components that were either close to, or beyond the design limits. That analysis examined the:
shear (vertical) loads generated at the root of the wing
bending moment generated in the wing
vertical shear loads at the root of the horizontal stabiliser
asymmetric moment (one side up, the other down) in the horizontal stabiliser.
The analysis found that the design loads for a number of major components were exceeded during the event. Specifically, the analysis identified that the:
limit bending moment for the wing was exceeded by about 6 per cent
limit load for the engine mounts was exceeded
limit shear moment on the horizontal stabiliser was exceeded twice during the event,
on both the left and the right by about 10 per cent, when both flight crew were making nose-up control inputs
on the right side by about 12 per cent, immediately after the pitch disconnect, when the elevators were at their peak opposing deflections
ultimate asymmetric moment on the horizontal stabiliser was exceeded by about 47 per cent.
Due to the dynamic nature of the occurrence, the loads were not static, so the loads exceedances were only for short periods of time. For example, the variation in the asymmetric moment of the horizontal stabiliser is presented in Figure 43, clearly illustrating it exceeded the ultimate asymmetric moment for only about 0.125 seconds.
Figure 43: Variation in the calculated asymmetric moment in the horizontal stabiliser during the pitch disconnect event. The data calculated by ATR are represented by blue diamonds. A curve has been fitted to the data to represent the variation of the moment during the event.
The ultimate load (asymmetric moment) is shown by a red line and the time of the pitch disconnect identified by a vertical yellow line. Also included on the chart, in green, is the vertical acceleration recorded on the FDR. Source: ATSB, based upon data supplied by ATR
ATSB observation
As would be expected, the asymmetric moment was approximately zero when the elevators were connected. As the elevators started to move in different directions immediately before the PUM activated, an asymmetric moment was generated.
Although not shown in Figure 43, ATR’s analysis identified that the peak asymmetric moment coincided with the maximum difference in the elevator positions.
The figure also shows that there is no apparent correlation between the vertical acceleration and the asymmetric moment, indicating that the asymmetric loads on the horizontal stabiliser can be examined separately. This is further examined in the Safety Analysis.
Note: a timing difference of about 0.25 seconds was identified between the quick access recorder (QAR) data used in the ATR analysis and the FDR data obtained by the ATSB. This difference was very likely due to the different manner in which the time is treated by different programs used to analyse the data. The times identified in Figure 43 are those used by ATR in their preliminary loads analysis.
Detailed structural analysis of the horizontal stabiliser
In September 2016, ATR provided the ATSB with the results of a detailed structural analysis of the horizontal stabiliser. That analysis was a computer-based analysis[53] using the loads calculated from the preliminary analysis in 2014.
The analysis confirmed that the stresses generated during the pitch disconnect event exceeded the strength of the horizontal stabiliser. The results of the analysis found that the calculated stresses were consistent with much of the damage observed during the detailed examination of the stabiliser. However, there were a number of damaged areas, where the analysis indicated that it should have had sufficient strength to withstand the loads. ATR surmised that the additional damage was probably from the redistribution of loads in the structure when other structure failed. The analysis did not model the loss of strength when the structure exceeded its strength and as such did not account for a redistribution of loads.
The analysis calculated that the strength of some components were exceeded by considerable margins. This included primary structures such as the forward spar, where the calculated applied loads were about 57 per cent greater than the allowable load.[54]
Pitch uncoupling mechanism activation loads
The prescribed activation load for the PUM (when the aircraft is stationary on the ground) was equivalent to opposing forces of 50 to 55 daN being simultaneously applied to each control column, a total differential input of between 100 and 110 daN. However, it was noted that during the pitch disconnect event, the PUM activated when the captain’s pitch axis effort was 67 daN and the first officers was in the range, -8.5 to -19 daN, a difference of 75.5 to 86 daN. At the request of the ATSB, ATR analysed the factors that could result in the PUM activating at loads below 100 to 110 daN — the threshold indicated in the aircraft documentation.
ATR’s analysis identified two aerodynamic effects that could result in variations in the PUM activation threshold. The first of these, was that the elevators are balanced to be nose-heavy when there are no aerodynamic loads. When the pitch uncoupling loads are measured on the ground, there is a gravity effect due to the mass balances that must also be overcome. This effect is reduced in the air because the aerodynamic loads compensate for this mass balance effect. This was reported to reduce the threshold by about 4.5 daN.
The second effect is due to elevator and trim tab rigging tolerances, generating different aerodynamic loads on the left and right elevators. These differences result in a torque being transferred through the PUM that is independent of the control input. ATR reported that, at the maximum tolerances, the torque could change the PUM activation threshold by ±8.5 daN.
The total effect of this was that the in-flight PUM activation threshold could vary between 87 and 114 daN. Additionally, the accuracy of the sensors could result in further variation in the recorded pitch axis effort values of ±6 daN, meaning the recorded pitch axis effort differential could be as low as 81 daN.
Manufacturer’s review of the occurrence from the recorded data
In March 2014, the ATR performed an analysis of the QAR data supplied to them by the operator. The ATSB was supplied with a copy of the technical note that contained their analysis of the event.
The technical note identified that ‘the PUM disconnection and the vertical load factors experienced by the airplane are the consequence of the actions of both pilots at the same time on their respective yoke.’ In addition, ATR raised and discussed the following three areas that were of concern to them.
Dual piloting
As a general rule, simultaneous actions on the flight controls by both pilots is not recommended by ATR. It is reserved to some very specific cases, such as take-off with type II / IV de-icing fluids (AFM [Aircraft Flight Manual][55] 7–01.12) with dedicated crew training. Under a stressful environment and possible attention tunneling, it may be difficult for either of the pilots to see what the other’s actions are. The other’s efforts on the control may be misleading and rather appear as flight control jamming or “stronger than expected” aerodynamic forces. An efficient communication is therefore the best protection against undesired and possibly opposite actions. In particular, the Captain may wish at any time to take the controls over the F/O [first officer] when the latter is PF [pilot flying]. In such case, he shall use an unambiguous phraseology such as “I have controls”, “My control” or “My airplane”.
One of the most adverse consequence of dual piloting is an uncoupling of both pitch channels, indicated by the PITCH DISCONNECT message. In such case, each column controls one elevator. If they are not deflected in the same direction, torsion and bending moments will result on the horizontal tailplane. Particularly at high speed, those can threaten the airplane’s structural integrity by creating loads over the design limit loads.
The pitch disconnect procedure clearly addresses that issue by recommending the IAS to be maintained below 180 kt or even lower in some cases, for instance when one elevator is jammed in a full down position. However given the dynamics of the event, it was not possible for the crew to instantaneously lower the airspeed to this value.
Besides, the AFM provides guidance to perform a ferry flight[56] with elevators uncoupled. It does specifically mention limitations in terms of weight, load factor and airspeed. All those limitations have been exceeded during the event.
Limit speed overshoot
Exceeding a limit speed (be it VFE, VMO or VLE)[[57]] should obviously be avoided. Anticipating the possible speed excursion is of course the best option, and it is made easier by observing the speed trend arrow on the speed tape of the PFD in the -600 version airplanes. However, even after having anticipated by reducing rate of descent or power, external disturbances may lead the IAS to get above one of those speeds by a couple of knots. Such an event requires actions to be taken but will not threaten the safety of flight in a short term. As a consequence, there is no urge whatsoever to get below the limit speed, provided the overshoot is limited and does not increase.
Recovery from a limit speed overshoot should be done smoothly to avoid load factors and therefore loads that can become high on the structure. The recovery actions are conventional and do not require the application of a procedure. The first way of acting is obviously reducing the power of the engines, but when the PLA [power lever angle] already are in flight idle position only a change in the rate of descent can have an effect. This may be done through the autopilot [AP] if engaged by reducing the target IAS [indicated airspeed] or VS [vertical speed], or with the flight controls in manual flight. Using the TCS function to momentarily take over the AP orders and pitch the airplane up is also an option to avoid disconnecting the AP.
It should be underlined that ATR does not recommend using a specific AP mode between vertical speed (V/S) or IAS for the descent. The vertical speed mode makes it easier for the crew to follow a given glide path. The crew controls the descent speed with the power setting. Therefore this mode does not protect against possible speed overshoots, especially if power setting already is at flight idle. In IAS mode, the AP adjusts the pitch to follow the target airspeed and the crew controls the rate of descent with the power setting. The IAS mode therefore provides a better protection in case of airspeed increase due to external conditions because in such case the AP would pitch up the airplane.
ATSB observation
ATR have advised that the speed trend vector is a useful tool for anticipating a possible VMO exceedance and that an exceedance of a couple of knots does not threaten safety of flight in the short term, provided that the overshoot is limited and does not increase.
The ATSB notes that for this occurrence, the magnitude of the speed trend vector reported by the flight crew probably indicated to them that if they did not take immediate action, they were potentially going to exceed VMO by a considerable margin. The full scale deflection of the speed trend vector arrow indicates that in 10 seconds later, at their present acceleration, the airspeed would be 42 knots above their current speed. This could have suggested to the flight crew that if they took no corrective action at the time, they could have exceeded VMO by 30 to 40 kt.
In this event, the AFCS was engaged in vertical speed mode, which ATR advised did not protect against an overspeed. Once the engine power was reduced to flight idle, and with the airspeed continuing to increase, the only option remaining for the flight crew to reduce the speed was to make a manual nose-up pitch input.
Also, the recorded data indicates that VMO was exceeded by a couple of knots, even with the large dual control inputs. Although not suggesting that this was an appropriate action, it indicates that the VMO exceedance may otherwise have not been so limited.
Use of flight controls
During the event, both pilots applied significant forces, up to 70 daN, on their control column. A force over 50 daN on the rudder pedals was also recorded. The level of forces, possibly due to the stress surrounding the situation, was however not required to control the situation the crew was facing, namely a slight VMO overshoot.
More specifically, concerning the use of rudder, operational recommendations have evolved in the last decade. The ATR FCOM clearly cites normal or abnormal situations in which the rudder may be used safely: crosswind situations during take-off or landing, to counteract engine traction asymmetry, or in case of rudder trim runaway, aileron jam or landing gear issues. It also specifies that rudder should not be used to induce roll or counter roll induced by any type of turbulence. It adds that aggressive, full or nearly full, opposite rudder inputs must not be applied. In the case of the MSN 1058[[58]] event, the efforts recorded on the control wheel were low (< 5 daN) and the roll attitude of the airplane remained low as well. This shows that there was apparently no significant lateral disturbance and probably no need to use the rudder.
ATSB observation
Due to the limitations of the data recording system in the aircraft, it was not possible to determine which flight crew member made the large rudder input. Neither of the flight crew made mention of a need to use the rudder during the event, nor did the conditions indicate that it was required.
It is possible that given the speed at which the events occurred, the rudder input was not intentional and was a part of their reaction to the situation.
Simulation of the captain’s input
The recorded data indicated that the first officer’s third nose-up control input, of about 27 daN, which occurred at the same time as the captain’s control input, was only marginally larger than the second, of about 25 daN. As such, the expected aircraft response would have been slightly greater than the second input, and the resulting load factor would have been expected to be well within the flight envelope.
However, the captain’s initial nose-up control input, of about 45 daN, was significantly larger than the first officer’s. Because the two inputs occurred at the same time, the effect of the captain’s input could not be derived directly from the recorded data. At the request of the ATSB, ATR simulated the aircraft’s response to a single control input of 45 daN. To approximate the conditions at the time that the captain made the input, the simulation was initially run with the following parameters:
an airspeed of 250 kt
an altitude of 15,000 ft
a rate of descent of 3,300 ft/min
a weight of 19,500 kg
the centre of gravity at 25 per cent of the mean aerodynamic chord.
The simulation examined the effect of six control input profiles with a maximum pitch axis effort input of 45 daN. The profiles examined were:
A sharp input case, where the control input was increased from 0 to 45 daN in 0.05 seconds, which were then held for 1, 3 and 5 seconds.
A smooth input case, where the control input was increased from 0 to 45 daN over second, also held for 1, 3 and 5 seconds.
The results of the simulation showing the variation in elevator position, vertical acceleration, and airspeed over time are shown in Figure 44.
Figure 44: Results of the simulation of a single 45 daN input at 15,000 ft with a rate of descent of 3,300 ft/min. Note, the control input was made at time = 1s.
Source: ATR
These results showed that:
The greatest load factor of 2.6 g resulted from the sharp input. Also, the peak load factor from the smooth input case, was only marginally lower than the sharp input.
The peak load factor was insensitive to the duration of control input. Except for the sharp input of 1 second duration, where the load factor initially followed the profile of the longer duration inputs, but reached its peak value of 2.5 g, before decreasing.
When the input was held for 1 second, the airspeed decrease was negligible after 1 second.
When the input was held for 3 seconds, the airspeed decreased by 6 to 8 kt after 3 seconds.
When the input was held for 5 seconds, the airspeed decreased by 17 to 20 knots after 5 seconds.
The elevators initially deflected by about 4.1°, before slowly increasing. This was probably as a result of the airspeed decreasing.
At the request of the ATSB, ATR also ran the simulation at 8,500 ft and with a rate of descent of 1,500 ft/min to compare the effect that those parameters would have on the results when these conditions were similar to the occurrence conditions. For comparative purposes, the smooth input held for 3 seconds case was used for all cases. The results of this comparative study are shown in Figure 45.
Figure 45: Results of the simulation of a single 45 daN input, with a comparison of the effects of rate of descent and altitude.
Note, the control input was initiated at time = 1s. Source: ATR
The comparative study found that decreasing the altitude reduced the maximum load factor, but by a negligible amount. However, reducing the rate of descent increased the maximum load factor from 2.6 to 2.7 g. The initial elevator deflection also increased to about 4.7°.
ATSB observations
The FDR data showed that during the occurrence, the captain’s input was increased to 45 daN over about 0.3 seconds, which is much sharper than the smooth input, but not quite as sharp as 0.05 seconds modelled for the sharp input. The resulting aircraft response would be expected to be somewhere between the two input profiles.
Because of the dual control input and reversal of the first officer’s input, we do not know for how long the captain would have held the nose-up input. The captain reported that the intent was to prevent the airspeed exceeding the maximum airspeed. Examining the speed changes estimated by the simulation, it is unlikely that the captain would have held the input for 5 seconds, yet it is unlikely that a 1-second input would have had an appreciable effect within that time. Hence, it is more likely that an input held for between 1 and 3 seconds would have been a reasonable duration input to get the airspeed increase under control. Thus, the resulting aircraft response would likely have been somewhere between the 1 and 3 second duration inputs.
Based upon this, the response of the aircraft to the captain’s control input was probably in the range of 2.6 to 2.7 g.
Also of note was that both the FDR and the simulation show that it takes about 1 second for the aircraft to reach the maximum vertical acceleration after the maximum elevator deflection is attained. This delay would increase the difficulty for a pilot to prevent an overstress, particularly in cases where rapid actions are required.
Note The maximum pitch axis effort load recorded on the captain’s side was 67 daN, which occurred at the point that the PUM activated. However, the ATSB decided to examine the captain’s 45 daN input because the ATSB considered that this was the control input load associated with an intentional control input by the captain. The ATSB’s reasoning for this is discussed in detail in the section of the analysis titled Magnitude of the flight crew inputs and in Appendix B to this report.
Pitch system flexibility
Differences in control column position
It was noted on the FDR data that when control inputs were made, prior to the pitch disconnect, the left and right elevator deflections were the same, but the left and right control column positions differed from each other (Figure 46). Given that the control column positions matched when there was no control input load, the differences in the recorded position was unlikely to have been a result of a recording or sensor error.
Figure 46: Excerpt from the flight data recorder information around the time of the pitch disconnect. The circled areas highlight regions where there was a notable difference in the left and right control column positions before the pitch disconnect. The arrows highlight the difference in the control column position (lower pink and blue lines).
Note, there is no corresponding difference between the position of the left and right elevators (upper pink and blue lines) until just before the pitch disconnect. Source: ATSB
A difference in the control columns was also noted during the on-ground testing of the pitch disconnect system after the occurrence. When applying the control loads in order to intentionally activate the PUM, a significant difference in the control column positions was observed before the PUM activated (Figure 47).
Figure 47: Still image from video of on-ground pitch disconnect testing carried out on VH‑FVR following the occurrence. The right control column was held fully forward while the left control was pulled back. The image is just before the pitch uncoupling mechanism activated. Note the difference between the left and right control column positions. The left control column is about halfway through its full travel, while the right control column is at the forward limit.
Source: ATSB
It was reported by an operating pilot to the ATSB, that when performing a pitch disconnect in the ATR 72 flight simulator, there was very little deflection in the control column (in the order of millimetres of movement) when applying the loads required to disconnect the system.
ATSB observation
Given the amount of control column movement during the ground testing, it appears that the flexibility in the system is not modelled in the ATR 72 flight simulator.
Changes in the control ratio
According to the aircraft documentation, the elevator deflection limits are 23° nose-up to 13° nose-down and the corresponding control column deflections are 11.25° nose-up to 6.75° nose-down.[59] Thus, the control column deflections are amplified by the pitch control system to result in elevator deflections about twice that of the control columns (a control column to elevator deflection ratio of about 1:2). This ratio appeared in the FDR data of the control check carried out by the flight crew, when the aircraft was on the ground at the beginning of the flight (Figure 33). That is, when the flight control column was moved by 1°, the elevators deflect by 2°. However, the ATSB noted that the control deflection ratio varied from this value during the occurrence flight. This was particularly noticeable in the immediate lead-up to the pitch disconnect event, where the ratio dropped below 1:1.
ATR informed the ATSB that this change in the control deflection ratio was due to the inherent flexibility in the control system. This flexibility means that the relationship between the elevator position and the control column position is modified by the force transmitted through the pitch control system (the ‘pitch axis effort’) and the stiffness of the system. The result is, that the higher the force required to move the controls, the less that the elevators will move for a given control column movement.
ATSB observation
The manufacturer reported that the cables in the pitch control system were primarily responsible for the flexibility. The cables extend from each control column to the rear fuselage at the base of the vertical stabiliser. The remainder of the pitch control system running up the vertical stabiliser and back to the elevators is made up of push-pull rods, which are much stiffer.
The design of the pitch control system is such that the entire length of the control system lies between each control column, rather than directly connected to each other. That is, over 60 m of cables, rods and linkages join the left and right control columns (via the PUM in the rear of the aircraft), even though they are physically only about 1 m apart (see Figure 30 on page 43). It was considered that the differences in the control column positions and the changes in the control ratio was due to the flexibility of the control system between the left and right control columns.
Elevator deflections during a pitch disconnect event
Manufacturer’s calculated elevator deflections
In September 2016, in response to questions from the ATSB regarding the control system flexibility, ATR calculated the expected differential (difference between the left and right sides) in control column position and elevator deflection following a pitch disconnect at the maximum operating speed, VMO. Their calculations took into account the effect that flexibility has on the control ratio and were based upon the assumption that the control columns maintained the position they were at when the PUM activated.
The manufacturer’s analysis determined that following a pitch disconnect, the difference between the left and right control column positions would be 6.8° and the resulting elevator deflections would be 8.5°.
ATSB observation
These calculations were carried out by the aircraft manufacturer before the ATSB had gained a full understanding of the transient elevator behaviour and briefed the manufacturer. Consequently, the calculations were based on a ‘static’ balance of the forces between the control column input and the aerodynamic loads on the elevators. In a static analysis, it is assumed that there has been time for the forces to balance and it does not account for the transient inertial or damping effects when components move. As a result, these are more representative of the steady‑state elevator deflections. That is, they are the deflections that, given time, the elevators would attain after the pitch channels disconnected from each other.
The majority of the analysis on aircraft structures and systems is carried out on a static basis. Dynamic analysis is typically only carried out where the design standard requires such analysis, or the designer has identified that a dynamic situation can result in loads greater than the static case.
Dynamic elevator response
The ATSB identified that the occurrence event differed from the model used by the manufacturer to determine the maximum elevator deflections resulting from a pitch disconnect. During the occurrence, the control columns moved after the PUM activated, and the elevators moved in a dynamic manner, with an oscillatory characteristic that was similar to that observed in the data from the flight testing (Figure 48).[60] The captain’s side also exhibited a rapid increase in the elevator position immediately following the pitch disconnect that was not commensurate with the change in the control column position during the same time. The captain’s control column moved back by about 1°, but the elevator deflection increased by about 6°.
Figure 48: Excerpt from the FDR data from VH‑FVR during the pitch disconnect event. The underdamped oscillatory characteristic response of the elevator movement following pitch disconnect is circled in yellow. The region circled in red indicates that there was also some oscillation in the control column, but the amplitude was not commensurate with the elevator deflections.
Source: ATSB
Pitch control systems of comparable aircraft
The ATSB reviewed the pitch control systems of the following similar size aircraft that were designed for regional passenger operations:
Bombardier DHC-8
SAAB 340B
British Aerospace ATP
Embraer EMB-120
Dornier 328
British Aerospace 146.
Bombardier DHC-8
The Bombardier (formerly de Havilland Canada) DHC-8 (Dash 8) is a twin-engine turboprop transport category aircraft seating 39 to 78 passengers, designed and manufactured in Canada. The aircraft has a high-mounted wing and high-mounted stabiliser.
The pitch control system is a conventional mechanical system. The control columns are connected to the elevators through a mechanical system of push-pull rods, cables, bellcranks and pulleys.
The left and right control columns of the DHC-8 are connected together under the cockpit floor through a ‘pitch interconnect torque tube’. Left and right elevator cables run separately aft from this torque tube. The pitch interconnect torque tube contains a pilot-activated pitch disconnect clutch mechanism. The pitch disconnect clutch is normally engaged.
In the event of a jam in the pitch control, the left and right systems can be disconnected from each other by pulling on the pitch disconnect handle, located on the centre console, and rotating it 90° to lock it in the disengaged position. The pitch jam procedure requires the flight crew to release the force on the control columns before disconnecting the pitch channels.
SAAB 340B
The SAAB 340B is a twin-engine turboprop transport category seating 33 to 36 passengers, designed and manufactured in Sweden. The aircraft has a conventional low-mounted wing and low-mounted stabiliser.
The pitch control system is a conventional mechanical system. The control columns are connected to the elevators through a mechanical system of push-pull rods, cables, bellcranks and pulleys.
The system description for the elevators in the Aircraft Operations Manual noted that the left and right control channels are mechanically interconnected. However, in the case of a jam, the systems can be separated by ‘applying excessive force to the control column or disconnected by pulling the pitch disconnect handle’.
The pitch disconnect handle is located on the right side of the centre console. Pulling the pitch disconnect handle activates an electrical actuator which separates the left and right system. The description did not include an indication on where the interconnect or actuator were located within the system. There was no indication of what forces, other than ‘excessive’ would be required to overpower the interconnect unit.
British Aerospace ATP
The BAe ATP is a twin-engine turboprop transport category seating 64 passengers, designed and manufactured in the United Kingdom. The aircraft has a conventional low-mounted wing and low-mounted stabiliser.
The elevators are mechanically operated directly from the control columns through a system of cables, rods and levers that run from the left control column back to the left elevator. Under normal conditions, the control columns are interconnected through a torque tube under the cockpit floor and the elevators are interconnected through an electro-mechanical elevator release unit located between the left and right elevators.
The torque tube between the left and right control column contains a spring-loaded detent mechanism that will allow the left and right control columns to move independently when in excess of 100 lb (about 45 kg) of force is applied. In addition, the controls can be physically separated at the detent by pulling on a ‘force relief’ handle in the cockpit. When either of these is activated, the solenoid in the elevator release unit activates, separating the left and right elevators.
When the elevator systems are split, the left control column operates the left elevator through a mechanical connection. The right control column has partial control over the right elevator through the standby control system, where a sensor on the right control column is used to drive the right elevator through the autopilot servo on the right elevator.
Embraer EMB-120
The Embraer EMB-120 is twin-engine turboprop transport category aircraft seating 24-30, designed and manufactured in Brazil. The aircraft has a conventional low-mounted wing and a high-mounted stabiliser.
The pitch control system is a conventional mechanical system. The control columns are connected to the elevators through a system of push-pull rods, cables, bellcranks and pulleys.
The pitch control system consists of two independent control systems that are interconnected through a ‘disconnectable’ link. The reference material did not show exactly where the disconnectable link is located. However, a schematic indicated that each control column was connected to a bellcrank by a push-pull rod and the disconnectable link was located between those bellcranks. There were no cables indicated in the controls between the control columns and the disconnectable link. Thus the interconnection between the left and right control columns would likely be quite stiff.
Disconnection of the left and right systems is achieved by manually pulling the ‘elevator disconnector handle’ located on the left of the centre console. The jammed elevator procedure in the Flight Manual simply required disengagement of the autopilot and pulling the elevator disconnect.
Dornier 328
The Dornier 328 is a twin-engine turboprop transport category aircraft seating up to 32 passengers and 3 crew, designed and manufactured in Germany. The aircraft has a high-mounted wing and stabiliser. A turbofan powered version was also produced as the 328JET.
The pitch control system is a conventional mechanical system. The control columns are connected to the elevators through a system of push-pull rods, cables, bellcranks and pulleys.
The pitch control system contains two independent channels on the left and right sides of the aircraft, with a ‘pitch disconnect mechanism’ interconnecting the two channels for normal operation. The pitch disconnect mechanism is located in the rear of the aircraft behind the pressure bulkhead. Control cables run the length of the aircraft from the control columns to the rear pressure bulkhead, a distance of about 17 m.
Similar to the ATR, the pitch disconnect mechanism is activated by a force differential between the left and right pitch channels, so that in the case of a jam, the systems are disconnected by applying a load of 50 daN to the control column(s). The elevator control jammed procedure in the FCOM required the flight crew to disengage the autopilot and for both crew to push or pull in the same direction. The procedure also required that activation of the pitch disconnect system required the flight crew to note it in the logbook.
British Aerospace 146
The BAe 146 is a 4-turbofan engine transport category aircraft seating 70 to 112 passengers, designed and manufactured in the United Kingdom. The aircraft has a high-mounted wing and high-mounted stabiliser.
The pitch control system consists of a mechanical system of push-pull rods, cables, pulleys and bellcranks that articulate servo tabs on the trailing edge of the elevators. The aerodynamic loads generated by the servo tabs control the position of the elevators, which in turn generates the control loads.
The systems connecting the two control columns to the servo tabs are independent, but interconnected through a torque tube with a disconnect mechanism. The left and right systems can be manually separated by pulling on the disconnect handle located on the centre console.
ATSB observations
Of the aircraft considered above, it was evident that the requirements of FAR/JAR 25.671 had been achieved in a number of ways. The predominant solution was by providing separate left and right systems which are normally interconnected, but have a means of separating them in the case of a jam.
The review found that the ATR 42/72 is not the only aircraft to include a force breakout mechanism in the pitch disconnect system. Of those studied, the SAAB 340B, BAe ATP and Dornier 328 also included a force breakout system. In the case of the SAAB 340 and BAe ATP, there was though these aircraft had additional capability to manually separate the systems without the application of force to the controls.
The ATR 42/72 and Dornier 328 were the only aircraft identified where the pitch channel disconnect was located at the rear of the aircraft. The control column interconnection between all other aircraft studied was more likely to be stiff as there were no control cables in the system between the control columns.
Human factors information
Monitoring
Monitoring is an extensive set of behavioural skills that all flight crew members are expected to have. This skill set is specified in the aircraft operator’s standard operating procedures and involves the primary roles of monitoring the aircraft’s flight path, communications and the activities of the pilot flying. The United Kingdom Civil Aviation Authority (UK CAA) has defined monitoring as:[61]
The observation and interpretation of the flight path data, configuration status, automation modes, and on-board systems appropriate to the phase of flight. It involves a cognitive comparison against the expected values, modes, and procedures. It also includes observation of the other crew member and timely intervention in the event of deviation.
The difficulties that flight crew members have with maintaining effective monitoring are thought to be due to them not directly controlling the system being monitored. Humans are poor at maintaining vigilance for infrequent events, and equipment failures in modern airline operations are rare. Flight crew members rarely receive direct feedback on the effectiveness or consistency of their monitoring unlike the feedback they would receive when they may fly an aircraft manually.
Dismukes and Berman found that in most instances where flight crew members were failing to monitor the aircraft state or position, there were competing concurrent task demands on the crew’s attention.[62] Humans have a limited ability to divide attention amongst tasks and generally have to switch attention back and forth between tasks. This leaves an individual vulnerable to losing track of the status of one task while being engaged in another. Flight crews are taught and assessed for workload management in CRM classes but this focuses on priorities and distributing the workload amongst crew members and not on how to manage attention when juggling concurrent task demands.
Distraction
The UK CAA identified that distraction has been a major factor affecting flight crew allocation of attention when monitoring breaks down. While humans are capable of attending to more than one task using selective attention techniques, they have limited cognitive capacity. If one of the tasks consumes all the attentional capacity of a crew member, then task shedding will occur.
In 1981, the United States Federal Aviation Administration (FAA) introduced the ‘sterile cockpit rule’ in response to many aircraft accident investigations where it was found that flight crew had diverted attention from operational tasks and had become occupied with items unrelated to flying. The highest proportion of distractions was found to have come from crew members having non-pertinent conversations.
Distraction has been found to have been instrumental in the breakdown of monitoring in two major recent accident investigations.
On 27 August 2006, the flight crew of Comair Flight 5191, a Bombardier Canadair Regional Jet 100ER, attempted to take-off from the wrong runway at Lexington, Kentucky (NTSB, 2007).[63]
On 12 February 2009, the flight crew of Colgan Air Flight 3407, a Bombardier DHC-8-400, lost control of the aircraft while on approach into Buffalo, New York.[64]
In both instances, the flight crew became distracted by non-pertinent, or non-flight related, conversations at important phases of the flight, or at times when the crews should have been observing sterile cockpit procedures. The distractions resulted in a break down in their monitoring, and the flight crews inappropriately managing their workload. This resulted in the flight crews losing their understanding of the state, or position, of the aircraft.
Decision making and attention
Researchers (Klein,[65] Patterson and others,[66] and Kahneman[67]) have proposed a dual system of decision making whereby individuals can use either analytical or intuitive reasoning. For judgments where time is available and competing options can be evaluated, individuals can make conscious decisions using analytical reasoning. For decisions in time-constrained environments, individuals can make decisions using intuitive reasoning where the steps are often unconscious and based on pattern recognition.
For intuitive decision-making, an experienced individual will identify a problem situation as similar or familiar to a situation they have dealt with before and will extract a plan of action from memory. If time permits, they will confirm their expectations prior to initiating action. If time does not permit, actions will need to be initiated with uncertainty that may result in a poor decision. (A ‘person will consider a decision to be poor if the knowledge gained would lead to a different decision if a similar situation arose’, Klein).
Human attention is guided by two factors:
expectancy — an individual will look where they expect to find information
relevance — an individual will look to information sources they consider relevant to the important tasks and goals they need to carry out.
At the same time, an individual’s attention is normally attracted by the salient events in their environment — a flashing light, a highlighted checklist item or an auditory alarm.
Lastly, the allocation of attention is modulated by the effort required to move attention from one location to another and the perceived value to an individual of this effort. The key factor is expectancy. It is well-demonstrated that people are more likely to detect targets when expected and less likely to detect targets that are not expected (Wickens and McCarley).[68]
Cross-cockpit communication
Field and Harris[69] noted that there are multiple physiological communication channels operating within the cockpit. In their basic form, the communication is between the pilots, from the aircraft to the pilot, and from the pilot to the aircraft. The latter were also described as being ‘control inputs’. They also identified that communication takes place via three channels, the:
visual channel (divided into the central visual system, which is under conscious control, and the peripheral visual system, which is largely unconscious)
auditory channel
tactile channel (involving the proprioceptive[70] and kinaesthetic[71] systems).
Field and Harris noted that distributing information across the sensory modes, and avoiding overburdening any particular channel, could optimise the pilot workload and enhance their situation awareness.
Their study into cross-cockpit linkages found that pilots perceived the position and movement of the control column in conventional technology aircraft[72] as beneficial in providing them with state and anticipatory information. It also ‘conveys information from one pilot to the other concerning the status of the aircraft and the handling pilot’s intentions, without the need of either verbal or visual information’ and that ‘the importance of the interconnection of the stick/column was associated with monitoring the actions of the other pilot’. The pilots in the study placed a greater emphasis on the importance of the interconnection between the two pilots’ controls for monitoring the actions of the other pilot, than on feedback from the actions of the autoflight systems. Field and Harris also noted that this was not the case with fly-by-wire aircraft as communication via the tactile channel was no longer available.
It has also been proposed that flight crew situation awareness can be enhanced by conveying information in several sensory modalities rather than overburdening one modality when processing of simultaneous information from several sources is required.[73]
Review of previous occurrences
History of ATR pitch disconnect occurrences
ATR advised that whenever a pitch disconnect occurrence is reported to them, they systematically request the QAR/FDR data to analyse the event, understand the root cause for the disconnection in flight, and, where feasible (depending on recorded parameters), evaluate the loads sustained for comparison with potential reported damage. The following pitch disconnect occurrences were reported to the ATSB by ATR.
On the ground
The ATR42/72 aircraft type had a history of occasional pitch disconnects on the ground. ATR analysed these occurrences and established that certain conditions during landing could lead to excitation of a structural vibration mode close to the elevators’ anti-symmetric vibration mode. This could result in a disconnection between the pitch control channels. These type of on-ground events have not resulted in aircraft damage.
Tests were performed by ATR to determine the conditions in which those events occur. It appeared that the conditions include a combination of several factors: reverse thrust application, wind conditions and crew action on the control column.
In-flight
ATR provided occurrence details and short summaries for 11 in-flight pitch disconnect occurrences based on operator reports. The summaries indicated a number of factors that resulted in the pitch disconnects, including encounters with strong turbulence and mechanical failure within the pitch uncoupling mechanism. There were some occurrences where the origin of the pitch disconnect could not be established. However, for the purposes of this investigation, the ATSB has focussed on those occurrences where opposite pitch inputs (simultaneous nose‑down/nose-up) were identified as primarily contributing to the occurrences.
Opposite efforts applied on both control columns
Three occurrences were identified where a pitch disconnect occurred as a result of the flight crew simultaneously applying opposite pitch control inputs. At the time of this report, two of the three occurrences were under investigation by other international transport safety agencies, so verified details of these occurrences were not available.
In the occurrence that was not being investigated, the operator reported to ATR that during an approach, severe turbulence was encountered and the pitch channels disconnected. Although the recorded flight data did not contain a direct record of the load applied by each pilot, ATR’s analysis determined that the pitch disconnect was most likely due to opposing pitch inputs made by the flight crew, rather than being a direct result of turbulence.
In addition to these three events, there were two occurrences where a pitch disconnect occurred due to opposing crew pitch inputs; however, the primary factor was a loss of control after experiencing in-flight icing. The pitch disconnects occurred while the flight crew were attempting to regain control of the aircraft. In one of these occurrences, the horizontal stabiliser separated from the aircraft before it impacted with the terrain. In the other, the flight crew regained control of the aircraft and landed safely.
Pitch system jam occurrences
ATR reported that they were not aware of any pitch disconnects associated with a jammed pitch control system.
A review of past occurrences identified one ATR 72 with a partially jammed pitch control that occurred in the United States on 25 December 2009. According to the United States National Transportation Safety Board’s (NTSB) investigation into the occurrence: ‘The flight crew twice attempted the Jammed Elevator procedure in an effort to uncouple the elevators. Despite their attempts they did not succeed in uncoupling the elevators.’[74]
The FDR data for the occurrence showed that both the first officer, the pilot flying at the time, and the captain attempted to disconnect the controls by applying both nose-up and nose-down control inputs. The system in the aircraft did not record the value of the pitch axis effort, only if the effort exceeded 22 lb (10 kg). The FDR data also showed that the attempts to disconnect were carried out at speeds greater than 200 kt.
The flight crew reported that they regained increased control of the elevators when the aircraft was slowed to 180 kt. However, on final approach the controls again felt jammed. After conducting a go-around, a successful landing was carried out on the second attempt with both controls partially jammed.
The NTSB identified that a fractured bracket for the left elevator lower stop was restricting movement of the left elevator. The fractured bracket was attributed to improper use of the gust lock when on the ground, resulting in the elevator repeatedly striking the lower stop, generating fatigue cracks in the brackets.
Airworthiness directives were issued by both EASA and the FAA mandating inspection of all ATR 42 and 72 aircraft as a result of this occurrence.
Operator’s history of VMO exceedances
A search of the VARA occurrence database for overspeed events from 2012 to 2014 identified seven occasions where an ATR 72 crew reported a VMO overspeed event on descent. In these events, six of which were before the occurrence, the crew cited turbulence and/or distraction as contributing factors. Where target speed was reported, it was 230 or 235 kt and where details were provided about recovery actions, the reported crew actions were reduction of power, disconnection of autopilot, and manual nose-up input. The ATSB noted that there was no significant geographical pattern to the occurrences and that there were 14 reported flap overspeed events during the same period.
A search of the ATSB database also identified one report of a VMO exceedance in an ATR 72, while they were under the Skywest operation in June 2012. In that occurrence, the aircraft was on descent at about 240 kt, when the airspeed rapidly increased due to an atmospheric disturbance. At the time, the pilot monitoring was distracted by another operational task.
VARA also supplied a copy of all incident reports lodged by the flight crew involved in the VH‑FVR occurrence. Neither of those flight crew had lodged reports to the operator of an overspeed event, including flap, gear and maximum operating speed.
Dual control inputs
A dual control input is an event where both of the flight crew make control inputs on their respective controls at the same time.
The ATSB was not able to find a specific reference (procedure, regulation, or other) that specifically precluded dual control inputs. However, the normal separation of duties between the pilot flying and the pilot not flying, should result in only one pilot, the pilot flying, manipulating the primary flight controls at any one time.
In an article in their Safety First magazine, Airbus stated:[75]
One of the basic task sharing principle for any aircraft operation is that one pilot is Pilot Flying at a time. Therefore, if the Pilot Not Flying disagrees with the Pilot Flying inputs, he/she has to verbally request corrective actions or, if deemed necessary, to take over the controls by clearly announcing “I have controls”.
This will mean that he/she becomes Pilot Flying from that moment and the other Pilot Not Flying. Nevertheless, the feedback gained from line operations monitoring indicates that dual inputs still occur and are also sometimes involved in operational incidents analyzed by Airbus.
Airbus also identified that there were three types of dual stick[76] input:
spurious inputs
comfort inputs
instinctive inputs.
They identified spurious inputs as those that were due to inadvertent movement of the stick, such as from an accidental contact with the control. These are typically time limited and small control inputs and have minimum effect on the aircraft.
Comfort inputs are short interventions by the pilot not flying when they have decided they want to improve the aircraft’s attitude or trajectory, and are generally experienced during approach, capture of the glideslope or localiser, or flare. Airbus noted that these type of inputs have minor effects, but because the pilot flying is not aware of these interventions, they may attempt to counteract the inputs by the pilot not flying.
Instinctive dual inputs are typically due to a reflex action by the pilot not flying. Airbus identified that this may occur as a result of an unexpected event, an overspeed situation, or a dangerous manoeuvre. They also found that such instinctive interventions were more significant in terms of stick deflection and duration. The input is typically in the same direction and may lead to over control of the aircraft.[77]
Recognising the potential ineffectiveness of the procedural defences, Airbus designed and implemented a warning system that provides both flight crew with visual and aural alerts when dual side-stick inputs are made. Control of the aircraft can then be made by one pilot pressing on the ‘priority’ button on their side stick. This action temporarily disables the other side stick.
Sample of occurrences involving dual control inputs
The prevalence of dual control inputs is difficult to ascertain as they are unlikely to be reported, unless they either result in an occurrence, or are identified during an occurrence investigation and considered significant enough to be reported. A search of the internet found a number of occurrence investigations that identified dual control inputs. All of those identified involved Airbus fly-by-wire aircraft.
Crosswind landing event, 26 October 2005, Airbus A340[78]
On 26 October 2005, the outboard bead heel of the number-1 wheel tyre on the left main landing gear (MLG) of an Airbus A340-642 aircraft, registered HS-TNA, separated from the outboard rim of the wheel assembly during a landing on runway 16, at Melbourne Airport, Victoria, Australia.
The aircraft touched down with 15° of yaw as a result of its handling by the flight crew. That yaw angle was greater than recommended by the aircraft manufacturer, and increased the risk of damage to the MLG at touchdown. It also increased the risk that the resultant groundslip angle of the MLG tyres would exceed the ‘saturation’ point at which they entered a fully-skidded state.
The pilot in command made dual side stick inputs during the latter stages of the approach intending to assist the copilot to maintain the attitude and trajectory of the aircraft. Those dual inputs compounded the handling difficulties being experienced by the copilot and increased the associated risks.
ATSB observation
The dual control inputs made by the pilot in command appear to fall into the ‘comfort’ intervention, as identified by Airbus, to correct the aircraft’s attitude or trajectory at that stage of the approach. The copilot was unaware of the pilot in command making the inputs and likely resulted in the over-control of the aircraft during the landing.
Unstable approach, triggering GPWS and MSAW warnings, dual input, missed approach, at night under instruction, 11 April 2012, Airbus A320[79]
On 11 April 2012, an Airbus 320, registered SX-BHV, was operating on a charter flight from Ajaccio to Lyon Saint-Exupéry Airport, France. The pilot in command was under training from an instructor in the right seat.
During the approach into Lyon Saint-Exupéry Airport, the flight crew experienced difficulty in capturing the instrument approach path. As a result of changes in the aircraft’s flight control system, the aircraft descended below the approach path with a vertical speed of 1,200 ft/min. At a height above ground of 950 ft, the aircraft’s ground proximity warning system (GPWS) activated a ‘Terrain Terrain Pull Up Pull Up’ alert. The instructor responded by increasing the engine thrust and pitching the aircraft up without calling out that he was taking over control. When the aircraft was at a nose-up attitude of 9° the instructor applied nose-down inputs.
A few seconds later, air traffic control received a minimum safe altitude warning (MSAW) and alerted the flight crew that they were too low and below the glide path. Approaching the desired altitude, the instructor reduced the engine thrust and maintained the nose-down control inputs. The pilot in command/student, then commenced making nose-up inputs while the instructor continued to apply nose-down inputs.
Air traffic control instructed the flight crew to climb to 5,000 ft. The thrust was increased and as the instructor applied nose-up inputs, the student applied nose-down inputs. The instructor then took over control and the autopilot was connected. The aircraft was stabilised and a second approach conducted for a successful landing.
ATSB observation
The dual control inputs made by the instructor appear to have been an ‘instinctive’ intervention, as identified by Airbus, to prevent the aircraft continuing into a hazardous situation. Because there was no formal take-over of controls, the pilot in command/student was either unaware of the instructor’s inputs, or there was confusion as to who was controlling the aircraft and as a result, opposing dual controls were input.
ATR flight operational analysis
ATR provided data from their Flight Operational Analysis program regarding typical flight control input forces and dual control input occurrences. The Flight Operational Analysis program is a service provided by ATR to its operators, to assist them with identifying underlying safety concerns. Operators in the program supply ATR with recorded flight data, which is aggregated with multiple operators and analysed by ATR. Operators receive individual feedback, and global de-identified results are shared with the operator community.
ATR analysed approximately 30,000 flights to assess the distribution of control column forces during take-off, flight and landing,[80] and approximately 53,000 flights to assess the occurrence rate of dual control inputs.
The results of the analysis of the control column forces are summarised in Table 4.
Table 4: Summary of the results of ATR’s analysis of control column forces from their Flight Operational Analysis data[81]
The analysis of dual control inputs identified 30 dual control input events from 53,271 flights. Of the 30 events, 5 events were in the same direction, and 25 were in opposite directions. The analysis also identified that:
The only dual control input above 200 kt was the VH-FVR occurrence.
By phase of flight
6.7 per cent were during initial climb
6.7 per cent were during cruise
3.3 per cent were during approach
83.3 per cent were during final approach.
Other than the VH-FVR, occurrence, the maximum differential force in 27 events in 600 series aircraft was 48 daN.[83]
ATSB observations
The following observations regarding the Flight Operational Analysis are made:
• In December 2016, ATR also reported that the ATR fleet had accumulated approximately 26.5 million flight hours, in 29.5 million flights. Therefore, the Flight Operational Analysis covered approximately 0.2 per cent of the total number of ATR flights.
• During the pitch disconnect occurrence, the first officer applied a 27 daN nose-up input and 21 daN nose-down input. These control loads were in the top 5 per cent of the flight phase control loads, but below the maximum recorded in the Flight Operational Analysis data set.
• The captain’s control input of 45 daN was greater than any flight phase control loads in the Flight Operational Analysis data set.
• The distribution of the events by phase of flight fits with the expectation that dual control input events would occur most commonly on final approach, when there is little time for action to be taken. In such situations, flight crew actions are more likely to be instinctive.
• The ATSB was informed of at least 3 other inflight pitch disconnect occurrences due to opposing dual control inputs. Therefore, there must be at least 3 other occurrences where the opposing dual control inputs were in the order of 87 to 114 daN (refer to ATR’s analysis of in-flight Pitch uncoupling mechanism activation loads).
Safety analysis
Introduction
On 20 February 2014, Virgin Australia Regional Airlines (VARA) was operating an ATR 72-212A aircraft, registered VH-FVR, on a scheduled passenger flight from Canberra, Australian Capital Territory (ACT), to Sydney, New South Wales (NSW), operating as Virgin Australia flight VA657. During the descent into Sydney, an in-flight upset and pitch disconnect occurred. Following post-occurrence maintenance, the aircraft was returned to service.
Five days later, the captain of VH-FVR (a scheduled passenger flight from Sydney) suspected that they had struck a bird while on descent into Albury, NSW. Inspecting the aircraft after landing, the captain identified possible damage in the vertical stabiliser and requested an engineering inspection. The engineering inspection, which included a close examination of the horizontal stabiliser, confirmed the presence of the observed damage in the vertical stabiliser. However, the inspection also identified significant structural damage in the horizontal stabiliser and the aircraft was grounded.
As a whole, the damage to the vertical and horizontal stabiliser was not consistent with the suspected birdstrike. The asymmetric nature of the damage, was however, consistent with the aircraft manufacturer’s analysis of the loads generated during a pitch disconnect and in-flight upset that occurred on 20 February 2014, some 13 flights prior to the identification of the damage. Thus, the damage is not considered to be as a result of a birdstrike and this report is focused on the 20 February occurrence. This was further reinforced by the immediate and persistent recorded change in the difference between the left and right elevator positions following the pitch disconnect event.
The following analysis examines the factors that led to the in-flight upset and pitch disconnect, and will also look at how the pitch disconnect resulted in damage to the aircraft. This will include examination of the behaviour of the pitch control system during a pitch disconnect and the aviation systems in place to prevent an aircraft from being damaged in normal operation.
During the investigation, other safety factors were identified that, although they may not have contributed to the 20 February occurrence, were considered of sufficient importance to include in this report.
This analysis does not examine the post-occurrence inspections, nor the continued operation with damage in the stabiliser. Those details are examined in detail in Part 3 of this report.
In-flight upset and pitch disconnect
Selection of descent parameters
The descent into Sydney was carried out with the autopilot engaged and the automatic flight control system (AFCS) operating in the vertical speed hold (VS) mode. In this mode, the autopilot controlled the elevator position to maintain the selected vertical speed, and the pilot adjusted the engine power setting to maintain the target airspeed.
Selected airspeed
The first officer, who was the pilot flying at the time, selected a target airspeed of 235 kt for the descent. Why this speed was chosen is not clear. Neither the manufacturer, nor the operator, provided any guidance on the selection of an appropriate airspeed for the descent. There was also no discussion captured on the cockpit voice recorder (CVR) to indicate why 235 kt was chosen.
The captain had selected a lower descent airspeed on the previous flight into Canberra because of expected turbulence, but accepted 235 kt when selected by the first officer for this descent into Sydney. The flight crew had reported that the only turbulence experienced during the Sydney to Canberra flight was during the descent into Canberra, and that the rest of the flight was smooth. Also, according to the area forecast current during the flight, the probability of moderate turbulence below 10,000 ft was no longer applicable. Thus, the captain may have accepted the descent speed, because he did not expect any turbulence during the descent into Sydney and found the airspeed acceptable for smooth air.
There were indications during the flight that the captain felt some time pressure regarding the following scheduled flight to Narrabri, NSW. The possible effects of the stress associated with this pressure are discussed in more detail in the section of this analysis titled Captain’s initial input of 45 daN. However, there was no indication that the captain influenced the first officer to select an airspeed higher than what he would otherwise have selected.
A review of the other 50 flights contained on the flight data recorder (FDR) indicated that there was no standard airspeed used across crews for the descent. Amongst those flights, 235 kt was the highest descent airspeed, but was not unusual, being the second most commonly selected descent airspeed. All of the flights used a descent airspeed below the 240 kt that the aircraft would have provided when using the automatic speed selection function of the AFCS. This was consistent with the operator’s policy to use the selected speed in manual mode only, and indicated that the flight crews were typically conservative in their selection of airspeed. However, beyond this, neither the manufacturer nor the operator provided any guidance on the selection of appropriate descent airspeeds.
Overall, the first officer was very experienced on the ATR 72 and there was no indication, such as forecast turbulence, that the airspeed selected by the flight crew was inappropriate for the conditions.
Selected vertical speed
Although the operator did not specifically state what vertical mode was to be used for descent, the guidance in the Flight Crew Training Manual (FCTM) indicated that the vertical speed hold mode was to be selected on the AFCS during the ‘Before descent’ procedure. Selection of the vertical speed mode was also consistent with automation being used to fly the descent profile generated by the flight management system from the flight plan. During the descent in this case, the selected vertical speed was changed on a number of occasions, indicating that the descent profile was being actively managed by the pilot flying.
In contrast to the manufacturer’s recommendation in the Flight Crew Operating Manual (FCOM) for the climb segment, where they recommended the use of indicated airspeed hold mode, they did not recommend either vertical speed or indicated airspeed modes for descent. When recommending the indicated airspeed mode for the climb segment, the manufacturer highlighted the risks associated with the lack of airspeed protection when the AFCS is in vertical speed mode with the autopilot engaged. During climb in vertical speed mode, the aircraft is at risk of stalling because the AFCS will attempt to maintain the selected vertical speed at the expense of ensuring that a safe airspeed is maintained.
Unlike the cautionary information for climb, there was no information to alert the flight crew of the potential for exceeding the upper speed limits when using vertical speed mode for descent. The provision of such information may assist in reminding flight crew of the importance of actively monitoring and controlling their airspeed during a descent.
Windshear, impending overspeed and dual control input
During the descent, the first officer had been controlling the airspeed through changes to the engine power. Using this method, the first officer had been able to keep the airspeed within 4 to 5 kt of the target airspeed, until the last 2 minutes before the pitch disconnect.
During those 2 minutes, the airspeed decreased despite the first officer increasing the engine power (torque[84]). About 36 seconds before the pitch disconnect, the airspeed began to fluctuate rapidly. The first officer adjusted the engine power in an attempt to correct the fluctuations, ultimately resulting in the power being retarded to flight idle. When the airspeed continued to increase, the first officer used the touch control steering function to temporarily disengage the autopilot and use the elevator to control the airspeed by pulling back on the control column. The FDR information showed that the first officer made two nose-up inputs, which appeared to temporarily prevent the increase in the airspeed; however, upon releasing that control input, the airspeed continued to climb.
Similarly, in the seconds leading up to the pitch disconnect, there is a distinct correlation between the increasing airspeed and a corresponding rapid decrease in the calculated tailwind (shaded region in Figure 49). Thus, it is likely that there was a significant windshear that resulted in the indicated airspeed rapidly increasing toward VMO in 10 seconds before the pitch disconnect.
Figure 49: Comparison of the variation in the calculated tailwind component (blue) with the indicated airspeed (red) for a period of approximately 2 minutes before and 30 seconds after the pitch disconnect.
The shaded region shows a significant decrease in the tailwind component at the same time as the indicated airspeed increases. Source: ATSB
Due to the system operation and how the data is recorded, neither the ATSB nor the manufacturer, were able to determine precisely what the speed trend vector indicated throughout the event. However, the general trend of the airspeed recorded over this time indicates that the speed trend was likely well in excess of the maximum operating speed (VMO). This is verified by the flight crew’s comments that the trend vector was ‘off-the-scale.’[85] This would have indicated to the flight crew that a significant overspeed was imminent and required immediate action.
The ATSB found that: While passing through about 8,500 ft on descent into Sydney, the aircraft encountered a significant windshear that resulted in a rapidly decreasing tailwind. This led to a rapid increase in the airspeed, with the airspeed trend vector likely indicating well above the maximum operating speed (VMO).
Although it is not specifically stated anywhere in the standard operating procedures, it is implied through the definition of roles that only one of the flight crew members is to make control inputs at any one time. The other crew member monitors the pilot flying and assists with other flight management tasks. However, at some stage, it is likely that control may need to be transferred from one pilot to the other. To achieve a coordinated transfer of control, procedures have been developed that provide flight crew with a standard set of calls to use when either taking over control from, or handing control to, the other crew member.
Those procedures were provided by the operator in their Flight Operations Policy and Procedures Manual (FOPPM). To take over control, the captain was required to make the call of ‘I have control’ followed by the pilot flying acknowledging that they understand the transfer with ‘You have control’. The procedure also contained a requirement that the pilot flying was not to relinquish control until the pilot not flying has advised that they have taken control of the aircraft. Thus, it is reasonable to assume that the intention was that at no point should the aircraft not be actively controlled by a flight crew member. So at some point in the transfer, both flight crew members should have their hands on the controls.
The captain reported that he took the controls and disengaged the autopilot when he considered that the first officer’s actions were not going to prevent the aircraft from exceeding VMO. The information recorded on the FDR and CVR indicates that the captain made the ‘I have control’ call about 5 to 6 seconds after the first indications that he had taken hold of the control column, and about 3 seconds after the pitch disconnect. Additionally, the captain made what sounded like an instruction to the first officer to ‘pull it up’, after he had taken hold of the controls and at about the same time that the autopilot was disconnected. Thus, there was no communication to the first officer to alert him to the captain’s intention to take control of the aircraft until after the pitch disconnect. As such, there was no reason for the first officer to have stopped making control inputs to control the aircraft’s speed during that time. Indeed, there was a requirement that he not release the controls until the pilot not flying had advised that he/she had taken control of the aircraft.
The initially low loads in the left control system suggest that the captain had simply taken hold of the controls, possibly in anticipation of taking control, but about 1 second before the pitch disconnect, around the time that the autopilot disengaged, the captain’s side pitch axis effort loads increased. This indicated that the captain started to make a positive nose-up pitch control input. This nose-up input occurred almost simultaneously with the first officer’s third nose‑up input. This was probably coincidental because there was no verbal communication recorded and neither pilot indicated in interview that they were aware of the other pilot making coordinated control inputs.
The ATSB found that: In response to the unexpectedly high airspeed trend indication, and their proximity to VMO, the captain (pilot not flying) perceived aneed to immediately intervene, and made pitch control inputs before following the normal take-over procedure and alerting the first officer (pilot flying).
The ATSB was not able to conclusively determine why the captain took so long to make the standard take-over call. However, as discussed below, there were a couple of aspects that probably occupied the captain’s attentional resources, distracting him from making the appropriate calls at the appropriate time.
There was some concern from the captain regarding a rescheduling of the next flight, resulting in a tight turnaround time. The concern was sufficient enough that the captain spent some time during this flight preparing for the next, rather than actively monitoring the current flight. In addition, the captain was engaged in operationally non‑pertinent conversation in the 2 minutes leading up to the pitch disconnect. The cognitive resources that his concern about the tight turnaround and the non‑pertinent conversation consumed probably degraded the captain’s ability to actively monitor the aircraft’s airspeed. It was not until the aircraft was rapidly approaching VMO that the captain’s attention returned to the task of monitoring the aircraft’s state, at which point his attention was probably captured by the large airspeed trend vector. At this point, there was very little time for the captain to follow the normal support process to escalate the response and instinctively decided that he needed to take immediate action to avoid a VMO exceedance.
The ATSB found that: During the descent, when the sterile flight deck policy was applicable, the crew engaged in non-pertinent conversation. This distracted the crew and probably reduced their ability to monitor and respond to fluctuations of airspeed.
The captain had sufficient experience on the aircraft type to have attained a ‘feel’ for how the aircraft would respond to his control inputs. He reported that he was expecting a ‘slight jolt’ as the autopilot disengaged and a gentle pitch-up. However, when he took the controls and disengaged the autopilot, the aircraft and control column did not feel, or respond, as he expected it to. The rapidly changing situation, and this difference in control feel, possibly distracted the pilot’s attention away from the standard take-over procedure, delaying the standard ‘I have control’ call until after the dual control inputs had resulted in a pitch disconnect. During this time, both flight crew made simultaneous control inputs without any indication of coordination.
The captain reported to the ATSB that he intended taking over control of the aircraft. There was no indication from the captain that his intention was to assist the first officer by adding to his control input. As such, it is unlikely that the captain was expecting the first officer to have been making control inputs after the captain took over. Given he was possibly distracted by the difference in control feel, the captain probably didn’t perceive the changes in the control forces to be related to the first officer’s control inputs.
During the investigation, the ATSB identified that the design of the pitch control system in the ATR 72 results in a degraded tactile feedback between the control columns, diminishing the effectiveness of an important communication channel. This aspect is examined in detail in the section of this analysis titled Control system design effects on pitch control system ‘feel’- Degraded tactile feedback.
The dual control inputs resulted in two distinct safety outcomes; an in-flight upset (limit load exceedance) and the pitch disconnect. These are examined separately, in the following sections.
In-flight upset
The third nose-up control input made by the first officer was only marginally (about 8 per cent) greater than his previous, second, input. The second input resulted in an elevator deflection of about 3.5° and a maximum flight load factor of about 1.7g, about 70 per cent of the limit flight load factor of 2.5g. By comparison, it would be expected that had the third input been purely made by the first officer, the elevator deflection would have been marginally greater than the second, and the subsequent maximum load factor would have been well within the flight load limit.
However, the addition of the captain’s nose-up input to the first officer’s nose-up control input produced a significantly greater elevator deflection, of about 8°. This resulted in a pitching manoeuvre that exceeded the limit load factor by about 34 per cent.
The ATSB found that: The addition of the captain’s and first officer’s nose-up control inputs resulted in a pitching manoeuvre that exceeded the limit load factor for the aircraft.
When assessing the effect of a single 45 daN control input, the manufacturer calculated that the elevator deflection from such an input would be about 4.7°. Noting that neither the first officer’s nor captain’s control column deflections alone should have resulted in the 8° elevator deflection recorded during the event, the ATSB carried out an engineering assessment of the ATR 72’s pitch control system design. The aim of this assessment was to determine why the elevator deflection from dual control inputs was significantly greater than a single control input. Detail of that assessment is contained in the section in this analysis titled Control system design effects on pitch control system ‘feel’-Effects of dual control inputs on elevatorresponse.
Pitch disconnect
Shortly after the captain and first officer made nose-up inputs, the first officer reversed his input, to nose-down. This resulted in a dynamic situation with an interchange of loads between the captain’s (left) and first officer’s (right) control channels over a very short period of time.
Because the FDR only recorded the master warning at 1 second intervals, and latencies within the warning system, it was not possible to determine precisely when the pitch disconnect occurred. As such, the pitch disconnect was deemed to have occurred at the first positive indication that the elevators were no longer moving in unison and were moving in opposite directions. At this time, the pitch control channel loads recorded by the FDR were 67 daN on the captain’s side and ‑8.5 to ‑19 daN on the first officer’s side, a difference of up to 86 daN.
According to the manufacturer, opposing forces of 50 to 55 daN applied simultaneously to each control column is required to activate the pitch uncoupling mechanism (PUM). Thus, the total differential control input loads required to activate the PUM would be 100 to 110 daN (102 to 112 kg force).
In this case, the difference between the pitch axis efforts at the time of the pitch disconnect were below the defined threshold for activation of the PUM, potentially casting some doubt that the pitch disconnect was purely the result of dual control inputs. However, the manufacturer’s analysis of the system found that the actual in-flight PUM activation loads could be less than those indicated by the documentation. Their analysis identified that aerodynamic effects and trim rigging differences could result in activation loads as low as a differential of 87 daN. Additionally, the accuracy of the sensors measuring the control system loads could result in recorded loads lower than the actual loads.
Consequently, the differential forces in the left (captain) and right (first officer) pitch control channels were sufficiently large to activate the PUM, disconnecting the left and right pitch control channels.
The ATSB found that: Shortly after the captain initiated the nose-up control inputs, the first officer reversed his control input. The differential forces in the left (captain) and right (first officer) pitch control systems were sufficiently large to inadvertently activate the pitch uncoupling mechanism, disconnecting the left and right pitch control systems.
Magnitude of the flight crew inputs
Peak control load inputs during the event
During the pitch disconnect event, the FDR recorded the peak pitch axis effort loads as 67 daN nose-up on the captain’s side, and 60 daN nose-down on the first officer’s side. Although these were of similar magnitude, but opposite directions, they occurred at different times.
Both of the flight crew’s pitch axis effort loads were significantly greater than the ‘strength of pilot’ loads specified by the design standard — Joint Airworthiness Requirements Part 25 (JAR-25). These loads were specified as the maximum control input loads that would be considered acceptable to control the aircraft in normal flight. The ATR 72 was certified to those requirements, so there was no indication that loads as high as those observed during the occurrence flight were required to control the aircraft in normal flight.
The maximum of the design standard strength of pilot loads in the pitch axis, 33.4 daN, was for a temporary application using two hands on the control. The pitch axis effort loads recorded during the pitch disconnect event were roughly twice this. Neither of the flight crew reported to the ATSB that they required such large control inputs to control the aircraft. Given such high loads were recorded in the pitch axis systems for both flight crew, albeit in different directions, suggests that there was either some emergency situation to deal with, or the loads do not represent loads that the pilots intentionally applied.
To better understand the origin of the recorded pitch axis effort loads, the ATSB conducted a qualitative engineering assessment of the control inputs, pitch axis efforts and elevator deflections to better understand the pitch disconnect. The assessment, the detail of which can be found in Appendix B, found that the large pitch axis effort loads were the result of a combination of both the intentional crew inputs and aerodynamic forces being transferred back through the system that were not within the flight crew’s control. Therefore, the overall magnitude of these peak loads were not necessarily a reflection of the flight crew’s intended control inputs during the event.
The peak value of 67 daN recorded on the captain’s side occurred before the pitch disconnect and was attributable, in part, to the first officer’s share of the elevator load being transferred to the captain’s side as the first officer moved his control forward. Changes in control column position indicated that the captain was making an input of about 45 daN, prior to the load rapidly increasing to the peak value over a very short period of time. There was no significant movement of the captain’s control column position as the pitch axis effort increased from 45 to 67 daN, indicating that the captain did not intend to increase his nose-up input at this time. This is consistent with report from the captain where he described expecting a ‘little jolt’ through the controls when the autopilot disconnected, but remembered a ‘big jolt’.
At the same time, due to flexibility in the control system, the first officer probably felt the control column returning to the neutral position before a 21 daN nose-down input was made. The peak value of about 60 daN recorded on the first officer’s side occurred after the pitch disconnect and was likely a result of the elevators reaching their maximum deflection as the first officer’s arms straightened. The straightened arms would have resulted in the aerodynamic loads pushing back on the first officer’s arms through the control column. The time taken for the first officer to return his controls to the neutral position, and thereby relieving the load, is consistent with human reaction times to recognise and respond to the situation.
An alternative hypothesis explored by the ATSB, was that the first officer’s 60 daN nose-down control input was a part of his response to lower the nose as the aircraft pitched up. It is reasonable that his nose-down input was part of lowering the nose; however, the magnitude he intended to apply was about 21 daN. No sounds were captured on the CVR that would be associated with exertion to indicate the first officer was pushing with the equivalent of about 61 kg. Nor were there any discussions captured on the CVR regarding control loads, to indicate that he was aware of applying such loads. This would suggest that there was little effort required to sustain 60 daN for about 1 second. Thus, it is more likely that the first officer’s arms were locked straight, preventing the control column from returning under the applied loads than it was that he was intentionally applying 60 daN to hold the control forward.
While acknowledging the pitch disconnect occurred as a result of opposing inputs, the peak loads occurred at different times, and when the captain’s side recorded the peak load, the first officer’s side was relatively low. Additionally, there is no indication that the magnitude of the peak pitch axis effort values recorded during the pitch disconnect were solely the result of intentional flight crew control inputs.
The FDR system did not differentiate between the captain and first officer rudder systems, so it cannot be determined conclusively which pilot made the large rudder input that disconnected the yaw damper. The aircraft attitude and conditions at the time of the occurrence did not indicate that there was any need to apply the rudder, let alone such a large input. The first officer had already made two nose-up inputs without rudder input, and with the third input only marginally larger than the second, indicates that it was not likely to have been the first officer who made the rudder input. Given the size of his control column input, it is more likely that the rudder input was made by the captain. It was not likely to have been a conscious input, probably more related to an instinctive bracing action while pulling back on the controls.
Captain’s initial input of 45 daN
Although it was identified in the previous section that it was unlikely the captain intentionally made the 67 daN control input, the recorded data indicates that before the first officer reversed his control input, the captain did make a 45 daN nose-up input; in response to the increasing airspeed. This control input effort is, in itself, a large input load and well above the strength of pilot values from the design standard. As such, the ATSB examined what factors could have led to such a large input effort and the effect that it may have had on the safety of flight.
The captain reported to the ATSB that he did not remember applying excessive forces during the event. Nor did the CVR capture any discussion between the crew regarding the magnitude of the control loads during or after the event. As such, the captain was probably not aware of the magnitude of the level of his control input effort.
Although the ATSB cannot determine precisely why the captain made such a large input, the lack of recollection of such an input effort could indicate that the captain did not intend to make such a large input. The larger than intended input was probably influenced by his level of stress at the time of the occurrence.
The FDR and CVR showed that the event occurred very quickly, but because the captain had verbalised an expectation of an airspeed increase at the top of descent, and recognised that the speed increase was occurring in the 2 seconds prior to the pitch disconnect (evidenced by his telling the FO to ‘grab it’ and ‘pull it up’), it is not likely that the captain’s response was a ‘startle response’. However, there were indications captured on the CVR that suggest that the captain had an increased level of adrenaline in his system, probably due to stress, in the lead-up to the rapid speed increase.
Although the flight had departed Canberra slightly ahead of schedule, the captain faced a tight turnaround for what was to be the first time he had operated a flight to Narrabri. This would likely have presented a higher than normal level of stress for the captain. During the flight, he was informed that the already short turnaround had been further shortened by another 5 minutes. This would have likely further increased the level of stress. The pre-flight planning undertaken by the captain during the occurrence flight indicates that the captain was sufficiently concerned about the available time to take his attention away from his primary responsibility of monitoring the current flight.
From CVR evidence, it was shown that on a number of occasions during the flight, the flight crew engaged in non-pertinent conversations, some of which included topics that appeared to induce a level of agitation in the captain. This included the non-pertinent conversation that occurred immediately prior to the speed increase and pitch disconnect. In combination with the rapidly changing airspeed, indicated to the flight crew by the size of the speed trend vector movement, the captain’s level of stress may have been sufficiently large enough to result in an elevated level of adrenaline in his system, resulting in a physical control input response that was greater than the captain would otherwise have intended.
The local winds during the event, calculated from the FDR data, indicate that there was a windshear where the tailwind dropped from about 28 kt to about 5 kt over 8 to 9 seconds. Given that there was a small exceedance of VMO with the large response to the dual control inputs, had only one flight crew made a control input, the VMO exceedance would have likely been greater. If left without any input, the VMO exceedance may have been closer to 10 to 20 kt above VMO.
In their assessment of the occurrence, ATR noted that an exceedance of VMO by a couple of knots requires response, but will not threaten safety of flight in the short term, and as a consequence, there is no urge to get below the limit. However, this information had not been conveyed to flight crew of the ATR 72 aircraft.
Even though the aircraft was designed to have a safe speed margin above VMO, there were a number of factors identified that may have influenced the captain in treating a VMO exceedance with more concern than was required. The information provided by the aircraft manufacturer to the flight crew, regarding VMO, is that VMO is the speed that ‘must not be intentionally exceeded in any flight regime’. An aural warning is provided if it is exceeded, and is indicated on the airspeed indicator as a red and white striped region. There is also no procedure provided for the recovery from a VMO exceedance. This could all suggest to a pilot that an overspeed event was an immediate safety of flight issue that needed to be prevented with some urgency. Additionally, if VMO is exceeded, by even a couple of knots, then the aircraft must undergo an inspection, essentially grounding the aircraft until the inspection is completed. This could also add to the perceived seriousness of a VMO exceedance and possibly could have exacerbated the captain’s already elevated stress levels.
The manufacturer’s modelling indicated that if the captain had made the 45 daN alone, that is, without the first officer also making an input, then the aircraft would probably have reached a flight load factor of 2.6 to 2.7g. This is much lower than the flight load factor experienced during the occurrence flight, but is an exceedance of the limit load factor. It would also have required an inspection of the aircraft. Thus, although it may not have been consciously applied at that magnitude, the captain’s input, of itself, would probably have resulted in a limit load exceedance, and was considered to have contributed to the in-flight upset.
The ATSB found that: The magnitude of the captain's nose-up control inputwas probably greater than he intended, due to his response to a high stress level, but increased the probability that the aircraft's limit load factor would be exceeded.
Given that there was no damage identified in the aircraft that was attributable to the 3.34g load factor, it is unlikely that 2.7g would have resulted in any damage to the airframe. However, exceedance of an aircraft’s limitations should be avoided in operation as there are potential ramifications not obvious to the flight crew and operator.
Cabin crew member injury
The Senior Cabin Crew Member (SCCM) reported to the ATSB that during the in-flight upset, she was thrown forward and upward, striking the galley bulkhead before falling back to the floor on her back. During this, she sustained a broken leg.
During the pitching manoeuvre, the FDR recorded a maximum load factor of 3.34g and a minimum of -0.05g. Although this value is negative, it was recorded at, or near, to the aircraft’s centre of gravity, and on its own does not sufficiently explain the reported trajectory of the SCCM. As such, the effect of the SCCM being located in the rear of the aircraft was examined.
When an object is rotated, there is an acceleration as it transitions from no rotation to rotating. This results in a tangential acceleration that is proportional to the rotational acceleration and the distance from the centre of rotation (Figure 50). The further the point is from the centre of rotation, the greater the tangential acceleration.
Figure 50: Diagram showing the relationship between a rotational acceleration and tangential acceleration.
Note: The further a body is from the centre of rotation the greater the tangential acceleration. Source: ATSB
Because the SCCM was located in the rear of the cabin, adjacent to the rear door,[86] and the aircraft rotates about its centre of gravity, there would have been a change to the local load factor (vertical acceleration) that was a combination of the aircraft’s flight load factor and the tangential acceleration from the pitching motion. The ATSB analysed the FDR data to examine the local load factor at the rear door during the pitching manoeuvre that resulted in the limit load exceedance and pitch disconnect. The results of that analysis are shown in Figure 51.
The analysis identified that the local load factor at the rear door reached a maximum of about 3.8g, before reversing direction and reducing to about -0.4g. Within the space of about a second the local load factor returned to 1g. This would be sufficient to explain the SCCM’s reported trajectory during the in-flight upset. It also shows that it was not the pitch up that resulted in the injury, but the pitch down that was part of the recovery from the pitch-up and pitch disconnect.
At the time, the first officer was the pilot flying, and his input alone should have resulted in a pitching manoeuvre that was only marginally greater than the previous two. It was also highly likely that the recovery from that pitch-up would have been similar. It was previously shown that the third, rapid, pitch-up was a result of the dual input. Thus, the recovery that resulted in the significant negative acceleration in the rear cabin was also a result of the dual control input and as such, the dual control input contributed to the SCCM’s injury.
Figure 51: Local vertical acceleration (load factor) at the rear door during the pitch disconnect event.
The figure shows that an unrestrained occupant located at the rear door likely experienced a maximum load factor of about 3.8g followed by a dip to a minimum of about -0.4g, before returning to about 1g. The red dashed line indicates the time of the pitch disconnect. Source: ATSB
Damage to the aircraft from the pitch disconnect
The manufacturer’s preliminary loads analysis identified that the asymmetric ultimate load case for the horizontal stabiliser was exceeded during the pitch disconnect event. That exceedance was in the order of 47 per cent greater than the maximum for which it was designed and was found to be a direct result of the maximum opposing elevator deflections following the pitch disconnect.
By definition, there is no guarantee that the horizontal stabiliser structure will remain undamaged when subjected to loads above its ultimate load. Aircraft structures typically have some strength additional to that required to sustain the ultimate loads. However, the manufacturer’s analysis has shown even that strength was exceeded by a significant amount.
The stress distribution within a structure is rarely uniform, and the material itself is typically not uniform. As such, under load regions of higher stress are formed where cracks initiate if the material strength is exceeded. A crack will then progress through the structure as the stresses are redistributed and locally exceed the material strength. The rate at which cracks progress through the structure depend on many factors including the relative size of the load, the geometry and the material properties (particularly its fracture toughness). This is part of the reason why the certification standard requires that the structure be shown to withstand the ultimate load for 3 seconds without damage. During the event, the ultimate load was exceeded by a significant margin, but was only for about 0.125 seconds.
Neither the ATSB nor the aircraft manufacturer conducted a detailed fracture assessment of the horizontal stabiliser with regard to the post-PUM activation transient loads, but the fact that it did not completely fail may have been due to a combination of the reserve strength, redistribution of stresses and the short time during which the loads exceeded the ultimate load.
The manufacturer’s analysis showed that the asymmetric load was effectively zero while the elevators were connected through the PUM. Also, there was no distinguishable correlation between the flight load factor and the asymmetric loads on the horizontal stabiliser (Figure 43). This indicates that the asymmetric loads on the horizontal stabiliser during the pitch disconnect event were independent of the flight loads from the pitching manoeuvre. As such, the asymmetric loads developed during the pitch disconnect can be examined independently of the loads from the pitching manoeuvre. Similar asymmetric loads could potentially be developed during a pitch disconnect in straight and level flight with no associated pitching manoeuvre.
The ATSB found that: Given the high airspeed, the asymmetric elevator deflections that occurred immediately followingthe pitch disconnect event resulted in aerodynamic loads on the tailplane that exceeded its strength and damaged the horizontal stabiliser.
The design of the pitch control system is such that the flight crew is required to apply a load to the control column in order to separate the left and right pitch control systems in the event of a jam. The ATSB has identified that this has three effects on the controls during a pitch disconnect event:
rebalancing of the loads in the system following activation of the PUM
dynamic transient elevator deflections in the short period after activation of the PUM
unavoidable movement of the control column(s) following activation of the PUM.
The first two of these effects are a consequence of the flexibility within the control system and the PUM being located between the elevators. The third is related to pilot input and the ability to react to sudden changes.
Each of these effects may contribute to elevator deflections greater than the aircraft manufacturer considered during the design and certification of the aircraft.
Effect of the flexibility in the pitch control system
Simplified model of the pitch control system
The flexibility in the pitch control system acts like a spring which stores potential energy within the system. Although the pitch control system consists of a relatively complex arrangement of push-pull rods, bellcranks, pulleys, and cables connecting the control columns to the elevators, the system can be represented as the simplified system shown in Figure 52. The manufacturer advised that the flexibility is primarily within the control cables, so for the purposes of the simplification the flexibility of the entire system is represented as a spring within the control cables.[87]
Figure 52: Simplified model of the pitch control system with the flexibility in each channel being represented as a spring in the control cables
Source: ATSB
In considering the behaviour of this system, this representation can be further simplified to one channel of the pitch control system (Figure 53). In this simplified representation, when the control column is pulled back, an upward deflection of the elevator will result. This elevator deflection generates an aerodynamic load that acts in the direction opposite the deflection. The opposing forces between the control column and the aerodynamic load on the elevator will result in a tension in the system. Because the system acts like a spring, it will stretch under this tension.
Figure 53: Simplified model of one pitch control system channel showing the generalised balance of loads in the system
Source: ATSB
Control deflections from rebalancing of the loads after a pitch disconnect
In normal operation, when there is only one pilot on the controls and there are no jams, the load on the control column is balanced by the resulting aerodynamic load on both elevators. The torque between the elevators required to activate the PUM has been designed to be high enough that the torque generated by one elevator is not sufficient to activate the PUM during standard manoeuvres throughout the flight envelope.
However, if there is a jam in the system or opposing dual control inputs, the load applied to one control column is counteracted by the jam or the input from the other control column. In the case of a jam, the response of the system will differ depending upon where the jam is located.
If the jam is located at, or close to, the elevators, forces applied to the control columns by the flight crew (control inputs) will result in a tension in the system, but there will be effectively no movement of the elevators while the PUM is connected (Figure 54). When the PUM activates, the jammed elevator will remain in the same position, but the elevator of the unjammed side is free to move.
Figure 54: Simplified model of the pitch control system with a jam at, or close to, the right elevator.
Source: ATSB
If the jam is at, or close to, a control column (Figure 55), input to the free control column can result in some elevator deflection because of the flexibility in the system. This deflection will result in an opposing aerodynamic load on the elevators and will also generate a tension in the control system between the elevators and the jammed control column. After the activation of the PUM, the non‑jammed control channel is free to move. However, unlike the case where the jam is at the elevator, the elevator of the jammed channel still has some movement, as a result of the system flexibility, and would also move after the disconnect, but in the opposite direction to the other elevator due to the aerodynamic load and system tension.
Figure 55: Simplified model of the pitch control system with a jam at control column
Source: ATSB
Note also, that the elevator deflection that occurs before activation of the PUM, will result in an aerodynamic load that the pilot will need to overcome in order to activate the PUM. This will effectively increase the input load required to achieve sufficient differential for PUM activation.
In the case of opposing dual control inputs (no jam), the system will act in a manner similar to a jam located at a control column. However, in this case both control channels will retain full movement following PUM activation. The following discussion does not consider the effect of the unavoidable movement of the control columns by the pilots following activation of the PUM. This effect will be examined separately.
When the PUM activates, the position of the elevators will be changed without further movement of the control columns because of the rebalancing of the loads and tensions in the system. This is described in detail below.
Figure 56 represents how one pitch control channel responds to a pitch disconnect. The case examined represents a jam at one control column, or opposing dual control inputs. The behaviour presented assumes that the control column has been moved to the position at which the PUM is activated, but does not move following the pitch disconnect. Only one pitch channel is shown; however, due to the balance in the system, the other channel will behave in a similar manner, but in the opposite direction.
The instant before a pitch disconnect occurs (Figure 56 ①), the PUM has not been activated and the left and right elevators are connected. The control load input through one system is balanced by the aerodynamic load from both the left and right elevators and the tension generated in the other pitch channel (Figure 55). Because of the inherent flexibility, the system between the control column and elevator has been stretched.
At the instant that the PUM activates (Figure 56 ②), the left and right systems separate and each channel is only reacting the aerodynamic load from its corresponding elevator. The loads in the system are no longer balanced, so the tension in the control system will act to reduce the stretch in the system and the elevator will tend to move in a direction consistent with the control input; up for the example illustrated.
The contraction of the system will increase the deflection of the elevator until the aerodynamic load on the elevator balances the load on the control column (Figure 56 ③). The new deflection will be larger than the position just before the pitch disconnect.
Figure 56: Behaviour of the pitch control system during a pitch disconnect shown just before the pitch disconnect ①, the instant of the pitch disconnect ②, and at a time after the pitch disconnect when the loads have balanced ③. Note, this assumes that the control column is held in position following the pitch disconnect.
Source: ATSB
In the case where the jam occurs at, or close to, the elevator, the elevator will not move until the PUM activates, but tension will build up in the control system and it will stretch. When the PUM activates, the control system on the free elevator channel will contract and the elevator will move to a new position where the loads are balanced.
This is the case that the manufacturer assessed during the investigation in response to ATSB questions. The results of the calculations carried out by the manufacturer suggest that the effect of the elevator movement following a pitch disconnect would not be a hazard because the expected difference in elevator deflections at the maximum operating speed is 8.5°, which is less than the ultimate load case of 15.6° at the same speed. However, this is only one effect that results in elevator deflections following a pitch disconnect event. This effect also provides the driving force that results in a dynamic transient behaviour.
Dynamic transient elevator deflections
Because the pitch control system consists of components that contain mass, it is not possible for the elevators to move from one position to another instantaneously. There will a period of time during which the elevator is transitioning from the initial position to the final position. The behaviour of the system during this time period is a complex combination of the system’s mass distribution, stiffness and damping;[88] however, there are certain characteristic responses that can be observed in such transient dynamic systems.
As previously described, the ATR 72 pitch control system has an inherent flexibility that results in it acting like a spring. In addition, the aerodynamic loads on the elevators act in the opposite direction to the deflection and increase in magnitude with an increase in the deflection, thus also acting like a spring.[89]
By design, friction in the flight control system is minimised, hence there may be little damping from system friction. However, the aerodynamics of rapidly deflecting an elevator will provide damping to the system.[90]
Review of the certification flight test data and the data recorded on the occurrence flight indicated that the system had an oscillatory response consistent with an underdamped system.[91] An important characteristic of an underdamped system is that there is an overshooting of the steady‑state, before settling. Thus, when the elevators move to a new position following activation of the PUM, it is likely that they will overshoot the steady-state deflection, generating greater aerodynamic loads on the horizontal stabiliser than the steady-state situation would suggest. The degree of overshoot has not been determined as part of this investigation and would require significant engineering analysis to quantify the effect over the complete operating envelope. In addition, there are likely to be differences between aircraft in the ATR fleet that would require consideration of the worse combination of stiffness, mass and damping characteristics.
Unavoidable control column movement following activation of the pitch uncoupling mechanism
As previously stated, to activate the PUM and separate the left and right pitch control channels, a significant load needs to be applied to the control column(s). The analysis presented in this report has also shown that when the PUM activates, there is a sudden change in the force balance within the system that results in movement of the elevators without any additional control column movement. However, this sudden imbalance will also result in movement of the control column that a pilot would be unable to prevent.
When the PUM activates and the load through the pitch channel decreases to only the aerodynamic load from one elevator, the excess load applied to the control column is no longer balanced and as a result will accelerate in the direction of the greater force. This movement will increase the tendency for the elevator to move from the position it was in before the pitch disconnect, further increasing the aerodynamic loads on the horizontal stabiliser.
The amount of control column movement after activation of the PUM may be affected by a number of factors, including the flight crew’s expectation for a pitch disconnect and the airspeed.
An important factor in the amount of control movement is the expectation that the flight crew has of an impending pitch disconnect. The more that a response to a predictable stimulus is anticipated, the faster the reaction will be to that stimulus.[92] Hence, if the flight crew are not expecting a pitch disconnect, the time to recognise the change in the control column force, and consequently the amount of movement, is likely to be greater than if it is expected.
During the certification flight testing, the aircraft was being operated by professional test personnel with the intention of activating the PUM to separate the left and right pitch control channels. Thus, they were in a situation where they had an expectation of a pitch disconnect, yet the left control column was moved about 5° after the pitch disconnect.
In contrast, during the VH-FVR pitch disconnect occurrence, the flight crew were attempting to prevent an exceedance of the VMO, not separate the left and right control channels. Therefore, the pitch disconnect likely surprised the flight crew. In such a situation, it is reasonable to expect it to take longer to recognise and react to the situation, resulting in greater movement of the control column than had they been anticipating it.
Another factor that may affect the amount of control column movement following a pitch disconnect is the aerodynamic loads on the elevators. At higher airspeeds, the aerodynamic load per degree of elevator deflection is greater. Consequently, the force resisting the control column movement due to the aerodynamic load on the elevators is greater. Therefore, the expected elevator, and corresponding control column movements, would be expected to be less at higher airspeeds. However, at higher airspeeds, the resulting aerodynamic load on the horizontal stabiliser may not be smaller as a result of the reduced elevator deflection. The investigation has not determined the relative effects of these and quantifying this effect would require significant engineering analysis.
Manufacturer’s considerations during certification
Recorded data from the occurrence flight and a certification flight test showed elevator deflections during a pitch disconnect event. As described in the preceding sections, the ATSB’s investigation found that dynamic transient elevator deflections and unavoidable control column movement result in greater elevator deflections than those calculated by the manufacturer. Those deflections increase the aerodynamic loads generated by the horizontal stabiliser, and in turn the potential to overstress the structure.
During the intentional pitch disconnect done in preparation for the certification flight testing, the ultimate load was not exceeded. However, the elevator deflections encountered were only about 2° less than the ultimate load case. According to the manufacturer, a speed increase of only about 7 kt was required to reach the ultimate load with those elevator deflections.
During the VH-FVR occurrence, the resulting elevator deflections were sufficient to exceed the ultimate load by about 47 per cent. This indicates that there is potentially a speed below the VMO at which the ultimate load case can be exceeded during a pitch disconnect event.
The certification documents provided to the ATSB indicated that the aerodynamic loads on the horizontal stabiliser generated by the transient elevator deflections immediately following a pitch disconnect had not been considered during the design and certification of the pitch control system in the ATR 72. Because there has been no detailed engineering to assess the transient elevator deflections and unavoidable control movements, there is no assurance that the aircraft has sufficient strength to sustain the aerodynamic loads generated by a pitch disconnect event at all speeds within the approved operating envelope.
The ATSB found that: The aircraft manufacturer did not account for the transient elevator deflections that occur as a result of the system flexibility and control column input during a pitch disconnect event at all speeds within the flight envelope. As such, there is no assurance that the aircraft has sufficient strength to withstand the loads resulting from a pitch disconnect. (Safety issue)
While it is accepted that dual control inputs are not a normal piloting practice, it is considered by the ATSB to be a foreseeable error. This appears to have been considered by the manufacturer during certification and the resulting effect was categorised as ‘major’. Given the understanding of the effect of a pitch disconnect at that time, this categorisation was considered reasonable. However, an improved understanding of the transient elevator deflections that occur during a pitch disconnect, may conclude that a ‘major’ categorisation may no longer adequately estimate the hazard to the aircraft. For any categorisation more severe than major, neither the predicted nor the reassessed occurrence rate meet the design standard.
Timing of the pitch disconnect warning
The ATSB identified that there is a delay of approximately 0.5 seconds between activation of the PUM and activation of the master warning, and a 1 second delay before the PITCH DISC message is presented on the Engine and Warning Display. However, the manufacturer’s preliminary loads analysis also showed that the maximum asymmetric moment on the horizontal stabiliser occurred about 0.125 seconds after activation of the PUM. Thus, the pitch disconnect warning was not presented to the flight crew until after the maximum asymmetric tailplane loads were encountered and the horizontal stabiliser damaged.
In addition to the timing of any warning system itself, the flight crew will take time to detect, identify and react to any warning. This is normally within the scale of seconds, particularly if such a warning is not expected. However, regardless of the limitations of humans reacting to unexpected warnings, the system itself did not provide a warning until after the damage had occurred. Thus, it was not possible for this, or any, flight crew to take corrective action to prevent the damage based on the pitch disconnect warning.
It was evident that the pitch disconnect warning was not intended as a means for preventing a pitch disconnect, but rather a warning for the flight crew to take extra care when handling the aircraft and abide by the limitations following a pitch disconnect. However, in circumstances where the loads generated by elevator deflections that result from activation of the PUM can damage the aircraft, the pitch disconnect warning system is not an effective means of preventing a hazardous situation. The ATR aircraft does not provide any other alternative means of warning the flight crew of dual control inputs, or an impending pitch disconnect.
Control system design effects on pitch control system ‘feel’
The ATSB has identified two aspects of how the design of the control system affects the feel of the controls when dual control inputs are made. The first is that flexibility in the pitch control system between the left and right control columns results in a degraded tactile feedback between the control columns. The second effect is that the aircraft responds to dual control inputs in a different, and less predictable, way to single control inputs.
Degraded tactile feedback between flight crew
Communication in the cockpit can convey state information (what the aircraft is currently doing) or anticipatory information (what the aircraft will do in the future). Anticipatory information can be further broken down into actions in the immediate or distant future. Communication links on the flight deck can be between the flight crew members and between the aircraft and the flight crew (in either direction). For the flight crew, information can be communicated via the visual, auditory, or tactile channels.
The auditory communication channel was usually provided by the (verbal) pilot flying transfer procedures. However, in this occurrence, the captain was delayed in communicating his intention to take control, so the auditory channel was ineffective for preventing the flight crew making dual control inputs.
In this aircraft, the visual communication channel is provided by the pilots seeing that the other crew member has their hands on the controls. This channel also appeared ineffective in this situation, probably because the flight crew’s visual channel was focused on the airspeed trend vector.
In other situations, the visual channel may not be a particularly strong defence against dual control inputs due to factors preventing pilots from seeing the other’s controls. For example, in dark conditions it may be difficult for the pilots to use their peripheral vision to detect the other pilot’s hands being on the controls. Also, at particular times during flight, such as take-off and landing, the pilot flying’s visual attention would likely be outside the cockpit.
Researchers (Field and Harris, 1998) have reviewed the ergonomic advantages to pilots of the sensory information provided by conventional aircraft control column positioning. Although aimed at examining the differences between conventional and fly-by-wire aircraft, this research is applicable to this occurrence because it shows that the flight crew take important information from the position and movement of the controls.
The researchers claimed that the position and movement of the control column convey aircraft status and pilot handling intention information from one crew member to the other without the need of either verbal or visual guidance. The research also noted that, during certain manoeuvres, a performance advantage was observed as a result of retaining the cross-cockpit linkage between the controls. It was seen to provide an important line of communication between the pilots, providing both state and anticipatory information. Feedback through the control columns was associated with monitoring the actions of the other pilot. Therefore, the last defence against dual control inputs was provided by the feedback between the control columns, via the tactile channel.
As previously discussed in this analysis, there is an inherent flexibility within the ATR 72 pitch control system. In addition to the spring-like effect of this flexibility on the dynamic elevator response during a pitch disconnect, this flexibility has been identified to have an effect on the cross-cockpit linkage between the left and right control columns.
In an aircraft where there is a rigid interconnection between the left and right control columns, there is a one-to-one correspondence between the position of the two control columns. If one control column is moved, the other control column will move by the same amount. That is, neither control column can be moved without the other moving. In the case where both flight crew have hold of the control columns, one will be able to sense the actions of the other by either movement of the control column, or by not being able to move their control if the other is held firmly. This ensures a sensitive tactile cross‑cockpit communication channel.
It was seen in the FDR data that when the first officer made his second nose-up input, at time 05:40:50.0, both elevators moved the same amount, but the first officer’s (right) control column moved more than the captain’s. To deflect the elevators, the first officer applied a load to his control system, which was transmitted through the right pitch control system to move the elevators, and balanced by the aerodynamic load generated by the deflection. Because of the interconnection between the elevators, the elevator deflection then moved the captain’s control column through the left pitch control system. At that point, the captain was yet to take hold of the controls, so his control column was free to move. Thus, there was effectively no load through the left pitch control system.
The flexibility in the control system means that there will be some stretch in the control system when under load. Given that there was load only in the first officer’s control system, there was stretch only in that system and, as such, there was a difference between the left and right control column positions.[93] Thus, because there is flexibility in the system between the control columns, there is not always a one-to-one correspondence between the left and right control column positions in ATR 72 aircraft. As discussed in the next section, the feedback between the control column position and the elevator position is changed by a dual control input.
In the lead-up to the pitch disconnect event, the first officer was able to return his control column to a neutral position while the captain’s was held at about 6° nose-up. The recorded data indicates that a large portion of the first officer’s control column movement during this time was attributable to the first officer relaxing his effort on the controls. This control column movement is similar to normal single control input operation, where the aerodynamic load on the elevators will move the control column back towards the trimmed position as the control input load is relaxed.
In similar circumstances with a rigid interconnection between the control columns, the first officer would need to apply a nose‑down force before his controls would move, providing a clear indication that there was a non‑normal situation and there was either a jam or someone else acting on the controls. In this occurrence there was no jam, so, the control column movement associated with relaxing the first officer’s input did not provide sufficient tactile ques to the first officer that the captain had hold of the controls and was making a nose-up input. Thus, the event demonstrates that the flexibility in the ATR 72 pitch control system does not provide the sensitive tactile feedback between the left and right control columns provided by a rigidly connected system.
Neither of the flight crew reported that they were alerted to the other flight crew member making control inputs. This was likely because all three channels of cross‑cockpit communication were ineffective at alerting the crew members of the other making control inputs.
As discussed above, the auditory and visual cross-cockpit communication channels can be ineffective for a number of foreseeable human-factors related reasons. In the ATR 72 type aircraft, flexibility in the pitch control system degrades the effectiveness of the tactile communication channel, resulting in the potential for all cross-cockpit communication channels to be ineffective, as occurred with this case.
The ATR 72’s pitch control system is not unique in having a degraded tactile feedback. In some fly-by-wire aircraft, such as the Airbus range, there is no tactile feedback between the left and right controls. However, after a number of dual control input occurrences, Airbus recognised the potential ineffectiveness of the procedural defences and implemented a warning system that utilised both the visual and auditory channels to alert flight crew to dual control inputs. The ATR 72 does not have a similar system-implemented backup and, as such, there is no reliable means for a flight crew member to detect the presence of another crew member on the controls when the auditory and visual communication channels are ineffective.
The ATSB found that: The design of the ATR 72 pitch control system resulted in limited tactile feedback between the left and right control columns, reducing the ability of one pilot to detect that the other pilot is making control inputs. In addition, there were no visual or auditory systems to indicate dual control inputs.
Effects of dual control inputs on elevator response
During interview, both crew members remarked that, just prior to the PUM activation, their control columns did not respond as expected and did not correspond to what the aircraft was doing. It was also noted that during the dual control input, the elevator deflected by about 8°, which was significantly more than the expected deflections for either of the individual control inputs.
Noting this, and the amount of differential control column deflection observed during the on-ground testing of the pitch disconnect system, the ATSB analysed the effect that flexibility between the control columns has on the elevator response to dual control inputs. The system analysis, contained in Appendix C, compared two models of a dual control system: one with a rigid interconnection between the control columns and one with a flexible interconnection. The analysis found that the response of the two models differed in the response of the elevator, and hence the aircraft, to single and dual control inputs.
The elevator position in a system with a rigid interconnection between the control columns was directly related to the control column position, which is the same for both pilots by virtue of the rigid interconnection. This means that the elevator will only change position if there is a corresponding change in the control column position. There is no variation in this behaviour between single and dual control inputs. This provides the pilots with a consistent feedback of the elevator position, and consequently provides anticipatory information regarding the expected aircraft response. In the case of a dual input, the pilot will feel the input force from the other pilot, but can anticipate the expected aircraft response through movement of the controls. In a similar manner, the pilot can prevent an aircraft response by preventing the controls from moving.
In systems with a flexible connection between the control columns, such as the ATR 72, the elevator position was found to be more complex and related to both the control column position and control input force on the other pilot’s control column.
For single control inputs, when there is no force on the other pilot’s controls, the system behaves the same as one with a rigid interconnection. That is, there is a direct relationship between the control and elevator positions, providing the normal control feedback and anticipatory information. However, when dual control inputs are made, the relationship no longer applies. The control column no longer provides the pilot with consistent feedback regarding the elevator position, and consequently anticipation of the expected aircraft response is much more difficult and not necessarily intuitive.
For example, one pilot may make a control input, moving the controls to a certain position and the other pilot then makes a control input. The elevators will move as a consequence of the second input, even if the control column of the first pilot is held steady. The magnitude and direction of the subsequent elevator movement will depend upon the magnitude and direction of the second input.
Longitudinal handling qualities
Etkin[94] notes that characteristics of a vehicle’s control system influence the handling qualities of that vehicle. He also notes that ‘an otherwise satisfactory vehicle can be rated as poor due to a control system that does not ‘feel’ right to the pilot.’ The acceptability of the control feel, which is based upon pilot opinion, is influenced by both the stick (control) force and the stick movement required to induce a given flight load factor (g).[95] Shown in Figure 57 is a non-dimensional representation of the information provided by Etkin. It shows that there is only a relatively small region where control feel is considered satisfactory.
Figure 57: Handling quality assessments based upon stick (control column) force and movement
Source: Etkin and ATSB
For a control system with a flexible interconnect between the control columns, dual control inputs change the relationship between the control column movement and the elevator deflection, and hence flight load factor. The effect of this is to shift the location of the aircraft’s handling qualities (‘feel’) within the handling qualities chart (Figure 57) either upward or downward. The direction in which it moves will depend upon the relative control inputs. For example, if the control inputs are in the same direction, the amount of control column movement per g will reduce, moving the location of the ‘feel’ point within the handling qualities chart downwards. Opposing inputs will increase the control column movement per g and move the location in the chart upwards.
Also, given that for each pilot, the control force per g will also change due to the addition of both pilots’ control input forces,[96] the ‘feel’ location on the handling qualities chart will also move horizontally. Again, whether it moves left or right will depend upon the relative directions of the dual inputs.
The combination of these effects will change the aircraft’s feel in a manner not readily predictable by the pilots and could potentially change it to the degree that the handling qualities would be considered to be poor.
By contrast, only the control force effect (left-right movement) applies to control systems with a rigid interconnection. This could also move the handling qualities outside of the acceptable region; however, the flight crew are provided with anticipatory information regarding the aircraft’s response through the feedback from control movement.
During certification, and reinforced by the accepted use of the aircraft by multiple operators, the ATR 72 was likely shown to provide satisfactory handling qualities. However, this was most likely demonstrated using single pilot inputs only as there were no certification requirements to assess the handling qualities associated with dual control inputs, as discussed later. As such, the handling qualities of the ATR 72 with dual control inputs has not likely been assessed and the effects could result in unpredictable handling qualities.
The reports by the flight crew of VH-FVR that their control columns did not respond as expected and did not correspond to what the aircraft was doing, is an indication that the control feel was very different to what they were used to and they could not anticipate the aircraft’s response based upon their control inputs.
Aircraft-pilot coupling
The ratio of the aircraft response to the magnitude of the control input is often described as the system gain and describes how sensitive the aircraft’s response is to control inputs. The system gain, defined here as the ratio of the elevator deflection to control column deflection, is affected by a number of factors, including the aircraft’s speed and altitude. For example, the higher the airspeed the greater is the aircraft’s response for a given input. Although the airspeed changes the system gain, it is a progressive and consistent change and applies to all mechanical control systems. As such, pilots are aware of the airspeed effect and instinctively compensate for it.
For rigidly interconnected systems, the elevator deflection is only a function of the control column deflection, so the system gain is not affected by dual control inputs.[97] However, for systems with a flexible interconnection, the elevator deflection, and hence system gain, is a function of both the control column deflection and the control forces. Thus, when a dual control input is made, there is an unpredictable change in the system gain. Also, this can be quite a sudden and non-linear change when the overall control system, which includes the pilots, changes from single to dual control inputs.
Literature[98] on aircraft-pilot coupling[99] identified that non-linearity in system gain can result in abrupt changes in the aircraft dynamics, referred to as ‘cliff-like’ handling qualities, where ‘sudden, large changes in aircraft motions associated with relatively slight changes in pilot activity.’ These cliff-like qualities can result in a ‘mismatch between the pilot’s control strategy and the effective aircraft dynamics that are being controlled.’
The literature notes that aircraft-pilot coupling events are initiated by triggers that may have origins in the environment, vehicle and/or pilot. Environmental triggers include phenomena such as atmospheric turbulence, but may also include external threats that increase the pilot’s stress level with a resulting increase in the pilot gain (relative magnitude of their control inputs). Vehicle triggers most commonly involve changes in the aircraft’s dynamics and may be due to mismatches between the flight control system and the aircraft configuration, system failures that alter the aircraft dynamics, and flight control system mode changes. Pilot triggers relate to over‑reaction, or an inappropriate reaction, to a situation.
In a pilot-related trigger, task or situation-related stress can result in an increase in the pilot gain. The literature notes that ‘excessive exclusive concentration, called “tunnelling,” can lead to a momentary excessive gain and, subsequently, a pilot-triggered upset.’ It also notes that ‘Experienced pilots may use inappropriate control strategies if they do not fully understand, or appreciate the situation or they are otherwise stressed.’
In the case of this occurrence, it was very unlikely that the captain was intending to induce a load factor that was in excess of the limit value, his intention being to prevent an overspeed. Thus, there was a likely mismatch between the captain’s strategy of slowing the aircraft and the resultant high-load factor, and the incident can be classified as an aircraft-pilot coupling event. In this case, it appears that all three triggers have been involved. The flight crew were reacting to a change in the atmospheric winds that resulted in an increasing airspeed, while the captain was already in a stressed state. The dual control inputs effectively changed the flight control system mode from the single-pilot behaviour to the dual-pilot behaviour, and the captain overreacted to the seriousness of the situation while focussing his attention on the airspeed.
Although better adherence to the standard operating procedures for transfer of control may have reduced the likelihood of dual control from occurring, this analysis has shown that the characteristics of the ATR 72 control system also contributed to the response of the aircraft being considerably different to the intentions of the flight crew. However, because the captain’s input alone was probably sufficient to result in exceedance of the aircraft’s limit load factor, this factor in itself is not sufficient to have been defined as having contributed to the limit load exceedance.
In a more general sense, the changes in system gain due to dual control inputs has potential to result in further aircraft-pilot coupling events, such as pilot-induced oscillations, when flight crew are focused on an accurate flightpath tracking task. Airbus has identified that the pilot may make ‘comfort’ or ‘instinctive’ control inputs without alerting the pilot flying, which previous events have verified. The ATSB also understands that it is not uncommon for flight crew to ‘follow’ the pilot flying on the controls in situations where they assess there may be a need to quickly take-over control, make corrections to the flight path to ensure the aircraft’s safety, or simply to learn from a more experienced pilot. There is potential in such situations to have a period with dual control inputs, which may result in the aircraft responding differently to their experience-based expectation. Even if the pilot monitoring has only a light grip on the controls in order to follow the pilot flying, it may be sufficient to affect the aircraft response. Either or both crew would likely try to correct the response, making larger, or inappropriate control inputs, and triggering an aircraft-pilot coupling event.
A study for the National Aeronautics and Space Administration (NASA) found that human operators were frequently able to adapt to sudden changes in a system’s dynamics and regain control.[100] The study identified that it typically took about 3 seconds for adaptation to the changed system. In relation to the VH-FVR occurrence, the pitch disconnect and inflight upset had all occurred in under 3 seconds, so the pilots had insufficient time to adapt to the change in aircraft dynamics with dual controls. Additionally, in the NASA study, the system dynamics had a sudden change to a different control characteristic, which then remained unchanged. In the case of dual control inputs in an aircraft with a flexible interconnection, it is very unlikely that the change in the system gain will remain stable as both pilots will be actively making control inputs that would likely vary in their coordination. Consequently, it is very unlikely that a pilot would be able to adapt to the change in dynamics brought on by dual control inputs.
The ATSB found that: Flexibility in the ATR 72’s pitch control system between the control columns results in a change in the aircraft’s longitudinal handling qualities and control dynamics when dual control inputs are made. This could result in an aircraft-pilot coupling event where flight crew may find it difficult to control the aircraft.
In addition, it was identified during the course of the investigation, that when training for a jammed control in the flight simulator, the control column moves very little before disconnecting from the opposite channel. Given the size of the difference in control column positions identified when testing the pitch disconnect system on the ground, this description would indicate that the ATR 72 flight simulators do not model the effects of the flexibility between the control columns. This would suggest that the changes in control system gain due to dual control inputs is also not modelled in the simulator. As a consequence, the response to a transfer of controls during a manoeuvre would be different in a simulator to a real aircraft. Thus, the simulator may not be effective for training flight crew to safely transfer control during a manoeuvre.
Certification requirements/design standard
The ATR 72-212A, as with the previous versions of the ATR 72 and 42, was certified to the Joint Aviation Requirements 25 (JAR-25) Large Aeroplanes. JAR-25 contained the minimum requirements that the aircraft design must meet to be accepted for certification as a transport category aircraft.
JAR-25 contained requirements for the handling characteristics, strength of structure, and the design and construction of aircraft systems, including continued safe operation in the case of a control system jam. However, this occurrence highlighted a number of areas where the design standard did not contain requirements or guidance that could have assisted in identifying how the control system design could result in uncontrollable transient dynamic control movements and the effects that dual control inputs could have on control of the aircraft.
Consideration of jammed control system transient conditions
Review of a range of transport category aircraft types of a similar size to the ATR 72 found that the requirement for continued safe flight and landing under JAR 25.671(c) was typically complied with by separating a mechanical control system into two channels that are interconnected (coupled) during normal operation. When the system becomes jammed, the two channels can be separated through some form of mechanical uncoupling mechanism. The ATSB identified that there were two basic methods to activate the uncoupling mechanism to separate the system. One method required the flight crew to operate a separate control, such as a switch or lever. The other required the flight crew to ‘break’ the system out by applying a load on the unjammed control channel of sufficient magnitude to activate the uncoupling mechanism. Several aircraft studied, including the ATR, utilised this ‘forced-breakout’ uncoupling method.
To ensure that the forced-breakout type uncoupling system does not activate during normal operations, the activation threshold load must be designed to a level outside of the control loads encountered in normal operations. Thus, by its nature, when the uncoupling mechanism activates, separating the individual control channels, there is a high load applied through the control system. The analysis of the ATR 72 system identified that these high loads result in uncontrolled elevator movement immediately following activation of the uncoupling mechanism. This was identified as being due to several factors, including rebalancing of the loads in the system, elastic-inertia effects from system flexibility and control column movement due to the time taken for a pilot to react to the sudden change in load on the controls.
By contrast, for systems that require the operation of a separate control to activate the uncoupling mechanism, the control channels can be separated with little or no load applied to them. As such, unless the controls were jammed in an out of trim position, there will be no load on the control system when it is activated. The flight crew have more control over ensuring that the loads are more carefully applied after separation of the control channels.
The requirements for control system jamming were written in an outcome-based, rather than prescriptive, fashion so that it does not matter how it is achieved so long as the aircraft can safely continue the flight and land. It is not practical to specify a particular manner for showing compliance as the most appropriate method will depend upon the design characteristics of the aircraft. For example, a mechanical disconnect system would not be practical for a fly-by-wire type control system. As such, there was no information in the requirement itself to ensure that the designer considered the transient dynamic effects of the means of ensuring continued safe flight and landing.
While the ATSB does not consider there to be an inherent safety issue with this outcome-based approach, for the control system design standard, it does not readily capture the lessons learned from an event such as this.
Material to assist aircraft designers comply with and interpret the requirements was contained in sections 2 and 3 of JAR 25. A review of the advisory circular information in section 2 found that there was no information contained in ACJ 25.671, nor any other part, that would have prompted the designer to consider the transient dynamic effects of activation of the designed means of ensuring continued safe flight and landing. Also, there was no advisory material relating to the flight control systems in section 3 of JAR-25.
JAR-25 has since been replaced as the current design standard for Large Aeroplanes by EASA’s Certification Specification 25 (CS-25). The wording of the requirements in CS 25.671 and the advisory material in AMC 25.671 was found to be essentially identical to JAR 25.671 and ACJ 25.671.
CS-25 now also contains CS 25.302, an additional requirement for consideration of the interaction of systems and structures. However, it was not clear if that requirement covered conventional mechanical control systems that contained design features which can result in transient loads during normal operation and in case of failures. EASA informed the ATSB that CS 25.302 was developed to address modern control systems that provide load alleviation functions and had generally not applied it to mechanical flight control systems. As such, there is no further information in the current design standard to ensure the transient dynamic effects of activation of the designed means of ensuring continued safe flight and landing are considered.
It was noted that both JAR-25 and CS-25 contained requirements for consideration of the effects of flexibility of structure and in the case of CS-25, in the control system as well. However, these requirements were presented in a way that required the effect of the flexibility in terms of transient stresses generated from dynamic loads, rather than consideration of the dynamic loads that could be generated by flexibility in the structure and systems. Also, the requirement for consideration of flexibility in the control systems in CS-25 was applicable to ground gust loads only. There was no consideration of flexibility effects when airborne.
In summary, the ATSB found that: Neither the design standard for large transport aircraft (Joint Aviation Requirements – Part 25), nor the associated advisory material, provided information to prompt the designer or certifying authority to consider the transient dynamic effects of the means used to comply with the control jamming requirements. This increases the risk that the normal operation of the system could result in transient dynamic loads when the system is activated. Similarly, the current certification standard for Large Aeroplanes (CS-25) does not address this issue.
Effects of dual control inputs
Dual control inputs are typically not considered to be acceptable practice in a two-crew cockpit, and should be avoided during normal operations. This occurrence highlighted how dual control inputs can affect the safety of flight. The manufacturer, regulator and operator have advised that civil transport aircraft are designed so that only one pilot makes control inputs, and to prevent dual control inputs from occurring, controls in the form of standard operating procedures and training have been developed and implemented. Although this will reduce the chances of dual control inputs, the occurrence data for the ATR fleet indicates that these procedural controls are not sufficiently effective at preventing them from occurring in normal operations.
ATR’s review of 53,271 operational flights found 5 instances of dual control inputs in the same direction and 25 instances of opposing dual control inputs. This is an occurrence rate of 1 dual control input every 1,776 flights. At an average flight time of 0.93 hours per flight, this is an occurrence rate of about 6.1x10⁻⁴ occurrences per flight hour. Under the guidance provided in ACJ 25.1309, this rate would class a dual control input as a ‘probable’ event. Accordingly, the outcome of such an event should have no worse than a minor effect on flight safety.
Also, investigation of other accidents and incidents has identified that issues from dual control inputs are not specific to ATR aircraft.
In their safety magazine, Airbus identified that the existing operational procedures have not been completely effective in preventing dual control inputs in line operations of Airbus aircraft. They identified that, among other reasons, dual control inputs could be due to an instinctive action from the pilot not flying. They also identified that these type of dual inputs ‘are more significant in terms of stick deflection and duration’ and ‘may lead to over control’ of the aircraft. Recognising the potential ineffectiveness of operational procedures, Airbus introduced an additional defence by providing both aural and visual feedback to the flight crew when dual control inputs are made. This appears to have been implemented at the manufacturer’s discretion, not as a result of a regulatory requirement.
This occurrence also highlights how aspects of the control system design can reduce the feedback between the control columns and change how the aircraft responds to control inputs. Given the demonstrated occurrence rate of dual control inputs, how the existing procedural controls do not appear to be preventing them, and that it is not specific to the one aircraft type, consideration should be made into how the aircraft can be made more tolerant to dual control inputs so that they are less likely to result in an unsafe condition.
At some stage in the development of JAR-25, the writers have identified the possibility of dual control inputs and considered them to be sufficiently likely so as to include a requirement that the control system itself have sufficient strength to safely tolerate their application (JAR 25.399). However, this was the only instance in the design standard where dual control inputs were to be considered. There was no requirement for assessment of the aircraft’s handling qualities when subjected to dual control inputs. Nor was there any consideration of the human factors associated with the non-verbal communication channels between flight crew used for coordination of flight crew activities and the shared understanding of the aircraft’s current and future state. Neither was there any advisory material in sections 2 and 3 of JAR-25 that would prompt the designers and certification authorities to consider these aspects associated with the dual control inputs.
A review of the current design standard, CS 25, found that there have been no changes since JAR-25 that would ensure that the effects of dual control inputs on control of the aircraft are properly considered during certification of a new aircraft type.
Thus, the ATSB found that: Although the design standard for the aircraft (JAR-25) required the control system to be of sufficient strength to withstand dual control inputs, it did not require consideration of the effect that dual control inputs may have on control of the aircraft. Similarly, the current design standard (CS-25) does not address this issue.
Although JAR 25.1309, mentioned above, was aimed at the assessment of aircraft system failures, flight crew form a major part of the overall flight operation system, so there is an argument that flight crew errors should be considered in a similar fashion to aircraft system failures. James Reason defined human error as ‘the failure of planned actions to achieve their desired outcomes – without the intervention of some unforeseeable event’.[101] In terms of controlling the aircraft, the pilot may have a planned outcome to their actions, which is highly unlikely to be an unsafe outcome, but for some reason their actions fail to achieve the planned outcome. This is analogous to a system having a planned operational outcome, but it fails to achieve that outcome due to something going wrong within the system.
In May 2011, Skywest Airlines (Skywest) and Toll Aviation Engineering (TAE) entered into a four‑year agreement by which TAE would provide maintenance services at Brisbane in support of the operation of ATR 72 aircraft by Skywest on behalf of Virgin Blue (predecessor of Virgin Australia Airlines). Later in 2011, this was extended to include line maintenance at other sites including Sydney. The practical arrangements between Skywest and TAE were outlined in a joint Interface Procedures Manual.
As an approved maintenance organisation (AMO), TAE held a Civil Aviation Safety Authority (CASA) approval to conduct aircraft line and base maintenance in accordance with Part 145 of the Civil Aviation Safety Regulations (CASR) (1998). The CASA approval related to the maintenance organisation exposition (MOE) and persons appointed to designated roles. TAE’s head office was at Brisbane Airport, Queensland where a hangar was utilised for base and line maintenance on a variety of aircraft for a number of customers. Line maintenance stations for the maintenance of Skywest ATR 72 aircraft were located at Adelaide, Canberra, and Sydney airports.
As an aircraft operator conducting regular public transport flights, the successor to Skywest—Virgin Australia Regional Airlines (VARA)—was required to manage the continuing airworthiness of their aircraft in accordance with CASR Part 42. Essentially, this involved the formation of a Continuing Airworthiness Management Organisation (CAMO) with designated ‘responsible managers’ reporting to an ‘accountable manager’ and publication of an MOE, all subject to approval by the CASA.
Personnel information
Senior base engineer
The senior base engineer at the Sydney line station, who attended the aircraft (VH-FVR) when it arrived in Sydney, held an aircraft maintenance engineer licence issued by CASA in accordance with CASR Part 66. This licence was endorsed with subcategory B1.1 and ATR 42/72 type ratings, which allowed for certification of maintenance performed on specified structural, powerplant, and mechanical systems of the ATR 72-500/600 series aircraft.
The senior base engineer had held an aircraft maintenance engineer licence since 1987 and had experience in the maintenance of Airbus A319/320/321, Bombardier CRJ100/200, Fairchild Metro, and Saab 340 airframes and powerplants. In January 2012, he was employed by TAE to be senior base engineer of the Sydney line station to maintain Skywest ATR 72 aircraft.
In March 2012, the senior base engineer completed CASA-approved ATR 42/72 type training courses at the ATR Training Center. Other training courses and qualification processes provided by TAE or Skywest included:
TAE Compliance Induction – February 2012
Skywest Engineering Documentation and Procedures – February 2012
PW100 (ATR 72 powerplant) Line and Base Maintenance – April 2012
Skywest Safety Management Systems training – April 2012
Skywest ATR 72-500 Batch1/Batch 2 Differences – April 2012
TAE Maintenance Authorisation – ATR 72 line maintenance – May 2012
TAE Human factors assessment (CAR 30) – August 2012
Skywest ATR 72-500 & 600 Differences – August 2012
TAE CASR Part 145 – June 2013
VARA CASR Part 42 – June 2013
TAE CAR 214 refresher – January 2014
TAE Maintenance Authorisation reissue – January 2014
There was no training course or qualification process for a licenced aircraft maintenance engineer (LAME) appointed as senior base engineer and the role was not subject to regulatory specification or approval.
LAME 1
The other engineer at the Sydney line station, who also attended the aircraft when it arrived in Sydney, held an aircraft maintenance engineer licence issued by CASA in accordance with CASR Part 66. This licence was endorsed with subcategory B1.1 and B2 with ATR 42/72 type ratings, which allowed for certification of maintenance performed on specified structural, powerplant, electrical and mechanical systems of ATR 72‑500/600 series aircraft.
LAME 1 had been involved in aircraft maintenance in Europe since 2000. From 2005, he worked as a licenced aircraft maintenance engineer in line and base maintenance of a fleet of ATR 42/72 aircraft.
In March 2012, LAME 1 was employed by TAE to be a line maintenance engineer at the Sydney line station to maintain Skywest ATR 72 aircraft. As LAME 1 already held a European aircraft maintenance engineer licence and ATR 42/72 type ratings, CASA issued an equivalent Australian licence without further type training or experience. Training courses and qualification processes provided by TAE or Skywest included:
TAE Compliance Induction – March 2012
TAE CAR 214 examination – March 2012
Skywest Engineering Documentation and Procedures – March 2012
Skywest Safety Management Systems training – April 2012
TAE Maintenance Authorisation – ATR 72 line maintenance – May 2012
TAE Human factors assessment (CAR 30) – September 2012
VARA CASR Part 42 – June 2013
Other than a series of briefing sheets issued by TAE in the first half of 2013, there was no record of TAE CASR Part 145 training.
LAME 2
The engineer who was not rostered for duty, but was called in to conduct the post occurrence turbulence inspection, held an aircraft maintenance engineer licence issued by CASA in accordance with CASR Part 66. This licence was endorsed with subcategory B1.1 and ATR 42/72 type ratings, which allowed for certification of maintenance performed on specified structural, powerplant, and mechanical systems of the ATR 72-500/600 series aircraft.
LAME 2 had held an aircraft maintenance engineer licence since 2003 and had experience in the maintenance of Beechcraft/Raytheon turboprops and light jet, and Saab 340 airframes and powerplants. In February 2012, he was employed by TAE to be a line maintenance engineer of the Sydney line station to maintain Skywest ATR 72 aircraft.
In March 2012, LAME 2 completed CASA-approved ATR 42/72 type training courses at the ATR Training Center. Other training courses and qualification processes provided by TAE or Skywest included:
TAE Compliance Induction – February 2012
Skywest Engineering Documentation and Procedures – February 2012
PW100 (ATR 72 powerplant) Line and Base Maintenance – April 2012
Skywest Safety Management Systems training – April 2012
Skywest ATR 72-500 Batch1/Batch 2 Differences – April 2012
TAE Maintenance Authorisation – ATR 72 line maintenance – May 2012
TAE Human factors assessment (CAR 30) – September 2012
Skywest ATR 72-500 & 600 Differences – August 2012
TAE CAR 214 – April 2013
VARA CASR Part 42 – June 2013
Other than a series of briefing sheets issued by TAE in the first half of 2013, there was no record of TAE CASR Part 145 training.
Maintenance watch engineer
The duty engineer, who handled the initial maintenance watch response for the VARA CAMO on 20 February 2014, held an aircraft maintenance engineer licence issued by CASA in accordance with CASR Part 66. This licence was endorsed with subcategory B1.1 with ATR 42/72 type ratings, which allowed for certification of maintenance performed on specified structural, powerplant, and mechanical systems of the ATR 72-500/600 series aircraft.
The maintenance watch engineer had held an Australian aircraft maintenance engineer licence since 2007 and had experience in the maintenance of Airbus A319/320/321, ATR 42/72, Boeing 737, Bombardier Dash-8, and Fokker F50 airframes and powerplants.
In September 2012, the maintenance watch engineer completed a CASA-approved ATR 42/72 differences maintenance course conducted by the ATR Training Center to extend his qualifications to include the ATR 72-600 variant. Other training courses and qualification processes provided by Skywest included:
Skywest Engineering Documentation and Procedures – November 2011
Skywest ATR 72 Procedures and Documentation – August 2012
The line station environment
Sydney line station
The TAE line station at Sydney Airport provided line maintenance services to VARA in support of locally‑based ATR 72 operations. This comprised routine maintenance such as daily inspections and weekly checks as well as defect rectification. TAE provided an office, utility vehicle, tools, and basic ground support equipment along with access to manuals and data. This facility did not include a hangar or a high-access work platform. A senior base engineer and five other licenced aircraft maintenance engineers staffed the line station.
The role of senior base engineer was not defined in the TAE MOE and there was no evidence that the company had formally or explicitly communicated their expectations to the Sydney senior base engineer since he was appointed in 2012. In broad terms, TAE expected that the senior base engineer would be involved in reviewing maintenance instructions, coordinating maintenance and supervising maintenance activity, in addition to any administrative tasks. The senior base engineer, however, described the role as primarily administrative with no responsibility for the coordination of maintenance or the performance of other Sydney-based engineers.
In relation to the authorisation and control of line maintenance, the TAE exposition and the Interface Procedures Manual did not elaborate beyond the generally applicable policy and procedure. The practice around the time of the occurrence was for VARA maintenance watch to contact the Sydney line station to authorise maintenance. If additional personnel, equipment or hangar space was required by the Sydney engineers, they applied to the TAE production and planning section in Brisbane which could provide purchase orders during their normal working hours of that section.
The Sydney-based engineers were nominally rostered for four consecutive days of duty followed by four consecutive days free of duty. This pattern, however, was often modified to accommodate engineer unavailability and unscheduled maintenance. In February 2014, two of the Sydney engineers were unavailable for rostered duty between 12 and 14 February and one of those engineers remained unavailable after 15 February.
When engineers were rostered for duty they were assigned to a morning or afternoon shift of one or two LAMEs each. The rostering created a shift overlap as the morning shift was nominally from 0600 to 1650 and the afternoon shift was from 1300 to 2230.
For the day of the occurrence, the senior base engineer was rostered for an afternoon shift, which was the fourth consecutive afternoon shift of a five-day series. However, the senior base engineer decided to start early to observe a propeller blade change on one of the ATR 72 aircraft then continued into the afternoon shift.
The senior base engineer stated that he started at 0600 having finished 2230-2300 the previous evening. He stated that due to a long commute to work, when finishing work at 2230, he would get to bed at midnight. Therefore, the senior base engineer had a 4 hours 30 minutes to 5-hour sleep opportunity the night prior to the occurrence.
The other engineer (LAME 1) who attended the aircraft after the occurrence was also rostered for an afternoon shift, as the last of a five-day series, but in consultation with the senior base engineer began early at 0530 to perform the propeller blade change. He also continued into the afternoon shift. Given the duty finish at 2200 the night before and relatively short commuting time, the engineer had a sleep opportunity of 5 hours 30 minutes before the early start on the day of the occurrence.
The engineer (LAME 2) called in to conduct the post occurrence turbulence inspection was rostered to be free of duty on the day of the occurrence, which was the fourth consecutive day off. He was due to start another series of shifts with a morning shift the next day.
Maintenance watch
Operating within the VARA CAMO were maintenance watch personnel who were tasked to coordinate the rectification or deferral of defects, provide technical support to line maintenance personnel, and brief management as required. For ATR 72 operations, a duty maintenance watch engineer based in Brisbane performed this function except for an early-morning period when the role was handed over to a Perth-based duty engineer. Maintenance watch engineers reported to a supervisor who in turn reported to the ATR fleet manager.
In consultation with the CAMO manager or fleet manager, the maintenance watch engineer was to decide on the appropriate action to ensure any disrupted aircraft were safely returned to service. Part of the coordination role was liaison with each engineering port (TAE personnel) to ensure adequate resources were available to perform the assigned work.
If an aircraft was involved in an incident or accident, the duty maintenance watch engineer was to collate all known data about the event including technical log entries, written reports, and information from other VARA departments. In some cases, the engineer would be expected to communicate with the ATR AOG[102] response centre to obtain advice or information. The engineer was to brief the CAMO manager or fleet manager about the event and coordinate any flight data download.
For any significant line maintenance events, the Aircraft Line Maintenance Event Consideration Worksheet was to be used. This form was intended as a management and coordination guide for capturing essential data and provided notification protocols to ensure that a standard approach to control and coordination was applied to aircraft recovery.
The primary system and source used to manage aircraft defects was the Computerised Maintenance Management System. The Defect Action List was the mechanism by which maintenance watch could formally request defect clearance action.
Information was communicated to key internal stakeholders by a daily status report and all significant events were to be recorded in a diary/handover book. The maintenance watch supervisor was expected to review the daily diary and daily status report.
Line maintenance procedures and practices
Maintenance procedures
The TAE MOE required that all work be performed in accordance with the applicable CASA‑approved system (or program) of maintenance, the MOE itself, and approved data. Licensed aircraft maintenance engineers were required to ensure the accurate recording of work and certification of maintenance, and to apply human factor principles. In addition to CASA licence requirements, engineers required company approval to certify for maintenance.
According to the MOE, LAMEs were only permitted to certify for maintenance that they themselves had carried out or had directly supervised, and for maintenance that was carried out in accordance with approved data.
In general, maintenance was to be recorded on customer-supplied worksheets or TAE worksheets generated from the intranet. For an extensive job, maintenance planners and aircraft supervisors would break it down to tasks and list them on a maintenance task control list to facilitate progressive sign-off and effective handover.
The MOE provided additional procedures applicable to the line maintenance function. If line stations had to carry out complex work using worksheets, this was to be generated by the aircraft operator and passed to the TAE planners who would assign a job number and direct the package to the applicable line station. All other work was contained in the aircraft operational log.
ATSB observation
The term ‘complex work’ was not defined in the MOE. Given that VARA CAMO and the TAE AMO did not issue any worksheets for the work on the occurrence aircraft, it is apparent that the turbulence/VMO exceedance inspection was not treated as complex work. In that context, each LAME was required to record/certify their maintenance activities in the aircraft log.
Shift/task handover procedures
To manage the risks of shift/task handovers, the AMO specified the use of a shift changeover task list, overlapping shifts where possible, human factors training, and a work pack diary. In addition, each shift was to have a nominated aircraft supervisor/leading hand to coordinate maintenance for the particular aircraft and shift.
According to the MOE, effective task and shift handover depended on four basic elements:
The outgoing person’s ability to understand and communicate the important elements of the job or task being passed over to the incoming person.
The incoming person’s ability to understand and assimilate the information being provided by the outgoing person.
A formalised process for exchanging information between outgoing and incoming persons and a planned shift overlap with a place for such exchanges to take place.
A documented safety management and risk minimisation process whereby maintenance actions progressed during one shift are documented and the next shift is briefed on the progress and any outstanding requirements.
In the MOE, one of the additional procedures for line stations was a requirement to maintain a station diary that was to be passed from one shift to another with accompanying signatures from the outgoing and incoming leading hands. If possible, the outgoing certifying engineers were to physically brief the incoming certifying engineers on any outstanding work to be completed and the stage at which work was to be recommenced.
The ATSB requested a copy of the Sydney line station diary entries for January and February 2014 but TAE advised they were unable to locate them. Instead, TAE was able to provide some shift changeover task lists completed in October 2014. These forms, in use since May 2013, demonstrated a capability for engineers to communicate the status of maintenance where there was no shift overlap.
ATSB observation
None of the engineers at the Sydney line station were nominated as leading hands and these positions were typically associated with team-based and complex maintenance activity in a hangar environment. Given all of the engineers at the Sydney line station were licenced and rostered in one or two person shifts to conduct line maintenance, there was no apparent need for leading hands.
Fatigue management procedures
The TAE MOE contained guidance and procedures to minimise human error during maintenance, including the management of fatigue. Management personnel were responsible for implementation of the procedures and ensuring compliance. Employees were expected to get the appropriate amount of sleep or rest and to self-monitor their overtime and fatigue levels.
A key element of fatigue management was roster design with daily duty time limits and minimum rest periods that included the following:
maximum of 13 hours duty in a 24-hour period, extendable to 16 hours with supervisor/manager approval
minimum rest period of 10 hours.
There were other elements of the fatigue management process to identify and mitigate fatigue risks, including training.
In March 2015, TAE amended the daily hours of work criteria to be:
no scheduled shift to exceed 12 hours
maximum of 13 hours duty in a 24-hour period, extendable with supervisor/manager approval
minimum rest period of 11 hours
In addition, prior to approval of overtime, the shift supervisor/leading hand was to utilise a form developed to assess the risk of fatigue from overtime.
Interface Procedures Manual
The joint Interface Procedures Manual detailed how the Skywest maintenance control manual functions would be performed by TAE when they were providing maintenance support to the Skywest ATR 72 fleet. At the time of the occurrence, the manual was as revised on 27 June 2012.
The manual was managed by TAE and jointly owned with Skywest. It was compiled to ensure that Skywest continued to meet its obligations under the Civil Aviation Act, Regulations (CARs), and Orders (Civil Aviation Orders (CAOs)) and TAE continued to meet its obligations under the CAR 30 certificate of approval.
According to the manual, before TAE engineers could certify for maintenance on Skywest aircraft, they were required to undergo Skywest-specific training coordinated by the TAE training department. This training covered Skywest maintenance control manual requirements, use of Skywest documentation, relevant CAR 214 differences, and use of the Interface Procedures Manual. Following successful completion of any training, the TAE quality and compliance department could issue the company authorisation required for a TAE engineer to certify work on Skywest aircraft.
For maintenance to be conducted, TAE procedures required a Skywest work pack or repair order covering all requested work items. Once a TAE job number was allocated, work was allowed to proceed.
The manual was subject to an annual review process but there was no evidence of a review within the 12 months before the occurrence. It was noted that the manual referred to particular Civil Aviation Regulations (1988) that at the time of the occurrence had been superseded by Civil Aviation Safety Regulations (1998) for regular public transport operations.
ATSB observation
The manual had not been revised to reflect the change of operating entity from Skywest to Virgin Australia Regional Airlines. This was not considered to be a contributing factor in the occurrence.
Maintenance data
Approved maintenance program for VARA ATR 72s
The stated purpose of the VARA approved maintenance program (AMP) for the ATR 72 was to maintain the inherent safety and reliability of the aircraft and its components. It was based on the instructions for continued airworthiness produced by the aircraft manufacturer, and airworthiness directives issued by the relevant national airworthiness authorities.
Scheduled maintenance events, outlined in Table 2, were designed to be consistent with ATR specifications.
Both forms of check – carried out by the captain – include walk-around external inspection with attention given to stabilisers, elevators and trims, among others
Line Check
2 calendar days
Review of aircraft maintenance log and brief visual check during a walk-around for obvious discrepancies such as damage and missing or loose parts
Weekly Check
7 calendar days
Visual check of specific areas during a walk-around for discrepancies, replenishment of fluids, and operational checks
Inspections, operational and functional tests of aircraft systems
Specific component tasks
Specified flight hours, cycles or years
Inspection, restoration or discard of specific components
In the Weekly Check worksheet provided to the maintenance engineers, the visual check requirements included a visual check during a walk-around of the rear fuselage and stabilisers for general condition including for damage to the elevators and fin/rudder. A visual check was defined in the AMP as an observation to determine that an item was fulfilling its intended purpose. As such, it was a failure-finding task that did not require quantitative tolerances. ‘Walk-around’ was not defined.
The weekly check requirements were consistent with the ATR 72 maintenance planning document that specified walk-around inspections of the key parts of the aircraft, including the tail fuselage and empennage. The task reference for each walk-around inspection was an alphanumeric that included the term GVI (general visual inspection). An equivalent term, ‘inspection - general visual’ was defined in the AMP as it was in the ATR 72 maintenance review board report.
The aircraft manufacturer advised the ATSB that a check of structural integrity was only required after a flight crew report of an abnormal condition. If the abnormal condition correlated to one of the listed maintenance checks, the applicable check in the maintenance manual was to be carried out and certified prior to further flight.
The next scheduled maintenance that required an engineer to use a high-access platform to work in the vicinity of the tail was either application of deicer boot conductive solution or a pre-cold-weather inspection. Both inspections were expected to be done in April 2014.
A detailed inspection of the horizontal stabiliser was scheduled for 3,000 hours of total time in service or 8 years from entry to service. At the time of the occurrence, the aircraft had been operated for a total of 2,005 hours over a 2-year period. If the aircraft was operated at the same average rate of 1,000 hours per year, a detailed inspection would be conducted about 12 months after the occurrence.
ATSB observation
The VARA approved maintenance program (AMP) was consistent with ATR instructions for continuing airworthiness. Given this document was primarily for maintenance control and scheduling purposes, it was unlikely to be considered as a necessary reference for line maintenance engineers tasked with an inspection.
Manufacturer’s instructions for continued airworthiness
As the aircraft manufacturer and type certificate holder, ATR produced specifications and instructions for continued airworthiness of the ATR72 aircraft type such as:
maintenance review board report (MRBR)
airworthiness limitations
maintenance planning document (MPD)
aircraft maintenance manual (AMM).
The ATR 72 AMM contained system descriptions, troubleshooting information, and job instruction cards (JICs). These documents were available in electronic form from the VARA maintenance control centre (maintenance watch), TAE intranet, and electronic data discs.
The aircraft manufacturer advised the ATSB that terms used in the AMM and JICs, such as the turbulence/VMO exceedance inspection, were defined in the ATR 72 MRBR and ATR 72 MPD. These definitions were consistent with the international standard for maintenance program development (MSG-3).
According to the MRBR, a general visual inspection (GVI) was a visual examination of an interior or exterior area, installation or assembly, to detect obvious damage, failure, or irregularity. It was stated that this level of inspection was made from within touching distance, unless otherwise specified, and made under normally available lighting conditions such as daylight, hangar lighting, flashlight or drop-light. In addition, it could require removal or opening of access panels or doors and involve stands, ladders or platforms to gain proximity to the area being checked.
A detailed visual inspection (DVI) was defined as an intensive visual examination of a specified detail, assembly or installation for irregularities. Elaborate access procedures and surface cleaning could be required in adequate lighting conditions and, where necessary, with the use of inspection aids such as mirrors and hand lens.
The ATR 72 MPD defined a ‘general visual inspection’ as a visual check of an installation or structure for obvious unsatisfactory conditions/discrepancies. This inspection may require the use of access equipment (such as platforms and workstands), removal of fairings and access panels, and the use of inspections aids such as a flashlight and mirror.
A ‘visual check’ was defined in the MPD as an observation to determine that an item was fulfilling its intended purpose. As such, it was a failure-finding task that did not require quantitative tolerances. Another term defined in the MPD, ‘walkaround inspection’, was defined as a visual inspection conducted from ground level to detect obvious discrepancies.
ATSB observation
The definition of general visual inspection (GVI) in the ATR 72 maintenance planning document (MPD) did not specify proximity from the subject, which was part of the definition in the maintenance review board report (MRBR).
Given these documents were primarily for maintenance specification and planning purposes and as such were unlikely to be considered as a necessary reference for line maintenance engineers tasked with an inspection, this variation was not considered to be significant.
Inspection after exceeding aircraft limitations
The job instruction card ‘Inspection after exceeding aircraft limitations’ was essentially an index of the JIC that addressed various abnormal aircraft operations. This listing included an inspection after flight in turbulence and/or exceeding VMO.
ATSB observation
Before the occurrence, there was no inspection specifically provided for a pitch disconnect in-flight. After the occurrence, in September 2015, ATR issued job instruction card JIC 55-10-00 DVI 10000 ‘Detailed inspection of horizontal to vertical junction’ to be complied with following an in-flight pitch disconnect. This was followed in February 2016, by an All Operators Message (AOM: 42/72/2016/03 issue 1) to advise of the release of new maintenance documentation related to in-flight pitch disconnect occurrences.
Later, in July 2016, ATR issued an All Operators Message (AOM: 42/72/2016/13 issue 1) to advise of stabiliser damage found during a scheduled maintenance check. ATR recommended in the AOM that operators perform a one-time inspection of the horizontal to vertical stabilizer junction as per the instructions in SB ATR42-55-0015 or ATR 72-55-1008 at the next convenient opportunity, no later than 6 months from release of the AOM.
Inspection after flight in turbulence and/or exceeding VMO
The job instruction card ‘Inspection after flight in turbulence and/or exceeding VMO’ was a nine-page document last revised on 1 December 2013. It specified that the aircraft must be inspected to detect any deformation or damage associated with the turbulence or exceedance and referred to 22 other JICs that could be used as supporting technical data. If, after the first inspection level, no anomalies were found the aircraft could be returned to service. Alternatively, if anomalies were found the next level of inspection was to be performed.
For preparation, the job instruction card advised engineers to ‘position access platforms as necessary for the inspection’. There was no guidance as to ground support equipment and no other detail about the type or positioning of platforms.
Embedded in the document was a ‘restricted inspection’ item and a later ‘extended inspection’ item. Between those two items were the specifications for a GVI, and DVI of the wing attach fitting area. The GVI was divided into four zones: wings, fuselage, stabilisers, and control surfaces. In regard to stabilisers, the instruction was:
Check that skin panels are free from wrinkling and loose rivets. Check that fairings (7) are not damaged, especially at horizontal stabilizer-to-vertical stabilizer and vertical stabilizer-to-fuselage.
The DVI for the wing attach fitting area was subject to two job inspection cards, one of which required an access platform and removal of external panels to allow inspection of the skin panels around the wing attachment fittings. The other inspection involved the removal and installation of passenger compartment sidewall panels to allow a detailed visual inspection of the skin and structure.
Listed after the extended inspection item were a series of items that addressed aircraft measurement, DVI (general), detailed inspection of the wing structure, detailed inspection of the stabilisers, and functional checks.
ATSB observation
Although ATR did not provide a maintenance inspection to specifically assess the effect of a pitch disconnect, the turbulence/VMO exceedance inspection was applicable. However, most of the time and effort required to carry out the ‘Inspection after flight in turbulence and/or exceeding VMO’ was associated with detailed visual inspection (DVI) of the wing attachment area. There was no DVI specified for the tail.
Re-connection of pitch uncoupling mechanism
Re-connection of the pitch uncoupling mechanism could be carried out on the ground by flight crew or engineering personnel. In the maintenance instruction, the gust lock was used to lock the elevator controls in place while the elevator clutch/rearm switch in the cockpit was pushed and held until re‑connection was complete. This was confirmed by absence of a warning indication and both elevator controls moving in unison.
Although the flight crew reconnected the pitch disconnect system after shutdown at the arrival bay, an engineer later certified, prior to release of the aircraft, that the reconnection was checked in accordance with the applicable job instruction card.
Operational test of pitch uncoupling mechanism re-engagement system
The job instruction card ‘Operational test of the pitch uncoupling mechanism re-engagement system’ described the process by which the elevator controls were disengaged, the re-connection system inhibitions checked, and the re-connection performed with a check of warning indications.
An engineer certified, prior to release of the aircraft, that this operational test was carried out and found to be satisfactory.
Functional test of pitch uncoupling mechanism and indication system
The job instruction card for functional test of the pitch uncoupling mechanism and indication system described the procedure for verifying the differential control column force required to activate the pitch uncoupling mechanism. A dynamometer was used to measure the rearward force applied to the left control column while the right control column was held, until the two control systems disengaged. If the measured load at the point of disengagement was not between 51 and 56 kg the pitch uncoupling mechanism required adjustment.
The ATSB noted that this job instruction card specified various ground support equipment including an access platform.
In the VARA approved maintenance program this functional test was scheduled to be performed at a 2C check, which occurred every 10,000 hours of operation. There was no requirement for this functional test to be carried out after an inadvertent pitch disconnect and it was not performed as part of the post-occurrence maintenance on 20-21 February 2014.
Local history of maintenance inspections following ATR 72 VMO exceedances
As indicated in Operator’s history of VMO exceedances, there were seven reports of VMO exceedance identified in the search of the VARA reporting database. At the request of the ATSB, VARA was able to provide copies of the maintenance log pages for the associated maintenance, except for one event.
A search was also carried out of the VARA defect tracking system, which identified eight VMO exceedances, three of which were not identified in the occurrence database search. Overall, the ATSB had access to the maintenance log entries associated with nine ATR 72 VMO exceedances – seven of which occurred before the occurrence and two afterwards.
The maintenance log entries showed that five of the inspections for VMO exceedance were carried out by Sydney-based engineers, including four that had been certified by one or other of the two engineers on duty for the occurrence aircraft’s arrival. There was no record of any inspections having been conducted by the engineer (LAME 2) who certified for the post-occurrence maintenance.
At the request of the ATSB, TAE searched for maintenance documentation associated with the nine identified ATR 72 VMO exceedances. This produced copies of the aircraft maintenance log entries for all of the inspections and evidence that an elevated platform such as a scissor lift had been used on some occasions.
In the aircraft maintenance log records the only documented reference to use of an elevated platform prior to the occurrence was in relation to a VMO exceedance inspection at Emerald, Queensland, on 6 February 2014. After the occurrence, TAE engineers carried out two VMO exceedance inspections at Sydney and Canberra respectively. On both occasions, TAE issued a purchase order for hire of a scissor or boom lift.
As further context, on the day before the occurrence one of the TAE engineers at Sydney (who was involved in the post-occurrence certification of VH-FVR) requested a purchase order from TAE stores department for the hire of an elevated platform (cherry picker) from a major airline. This request was forwarded to TAE planning personnel who issued a purchase order.
From the email records, it was apparent that the engineer requested the cherry picker to enable repair of an elevator. After further inspection of the aircraft (without use of the cherry picker), the engineer discovered that more parts would be required and the purchase order would be unused that day. Maintenance planning advised the Sydney engineer that the order could be used until it expired at the end of the month.
In summary, the TAE engineers did not have access to a high-access platform unless TAE maintenance planning issued a purchase order, and there is no evidence of such orders for six of the seven VMO exceedance inspections pre-occurrence.
Training and Assessment
Training provided by the approved maintenance organisation
According to the TAE maintenance organisation exposition, in-house training was not accredited but was consistent with registered training organisation guidelines and in conformance with CASR Part 145. The exposition defined the roles of accountable/responsible managers such as the training manager and detailed the policy and procedures for administration of the training management system. Aircraft-type training was not within the scope of the training capabilities and a policy existed for sourcing and approving external training providers.
TAE specified that an employee could not be authorised to certify for maintenance if they had not carried out human factors training in the previous two years. The stated aims and objectives of TAE human factor training was to make employees aware of the techniques for the control and avoidance of human error through possible countermeasures and interventions. It was intended to reduce the probability of aviation accidents and incidents due to human errors made during maintenance. Fatigue risk management was covered in the human factors training.
In 2012, TAE personnel provided company engineers with human factors training to comply with CAR 30. The nine learning outcomes for this training addressed the need for human factors to be considered in the aircraft maintenance environment, human capabilities and limitations, and the various factors affecting human performance. These factors included:
organisational culture
communication
workload
fatigue
physical environment
task characteristics
human error types.
In preparation for transition of part of their maintenance organisation to a CASR 145 approved maintenance organisation, the head of engineering and maintenance for the AMO issued a series of briefing sheets between February and June 2013 to highlight different aspects of the new regulations. In addition to the briefs, in June 2013, the AMO produced a training presentation that covered the basic requirements of CASR 145 and an overview of the TAE exposition. The presentation identified the part of the exposition that addressed additional line maintenance procedures and defect control with completion of the operator’s technical log.
Training related to the aircraft operator
In 2012, the LAMEs involved in maintenance of ATR 72 aircraft were given an outline of the objectives and elements of the Skywest safety management system. The ATSB noted that since 2012 there had been significant changes to the Skywest-VARA safety management system but no evidence that further training in the design and use of that system was provided to TAE engineers.
The VARA CASR Part 42 self-guided training presentation produced in June 2013 was intended to provide VARA staff (and contractors such as TAE) with an overview of the new requirements that applied to the continuing airworthiness of VARA aircraft and aeronautical products. It described the structure and operation of the CAMO and requirements such as the issue of a certificate of release after maintenance action/deferral to indicate that all maintenance was complete and that the aircraft was airworthy. For scheduled maintenance, the VARA maintenance planner prepared the work package for submission to the Part 145 approved maintenance organisation. In the case of unscheduled maintenance, the fleet type manager was tasked with managing the rectification of defects in accordance with instructions for continued airworthiness.
Training provided by the aircraft manufacturer
The ATR Training Center based at Blagnac, France, provided a number of ATR 72 type-specific maintenance training courses that were approved by CASA in accordance with CASR Part 147. These included courses that addressed the theory and practical experience required for mechanically-related maintenance on ATR aircraft.
The ATSB reviewed the ATR Training Center records for the senior base engineer and LAME 2 and noted that the theoretical training covered a number of topics including flight controls but did not specifically address scheduled/unscheduled inspections or stabiliser structure. The practical training covered a walk-around, standard practice/documentation, flight control system, and human factors and safety rules, among other topics.
Summary
Based on the information provided to the ATSB, there was no evidence that the training provided to the LAMEs maintaining the VARA ATR 72 aircraft was deficient.
Continuing airworthiness management
At the time of the occurrence, VARA operated a CAMO approved by CASA in accordance with CASR Part 42. The main function of the CAMO was to ensure that the operator’s aircraft were maintained by an AMO in accordance with the approved maintenance program for the aircraft type and as directed by the CAMO MOE.
In carrying out that function, the CAMO was required to conduct a formal assessment of the capability of suppliers such as TAE on an annual basis. At the time of the occurrence, in February 2014, the CAMO had been operating for about 8 months but there was no evidence that it had formally assessed TAE as an approved supplier or considered the risk of not conducting a formal assessment. (In the Air Operation Certificate (AOC) audit of VARA in October 2013, CASA found that the approved supplier verification process was not effective.)
While this has possible conformance implications, TAE was a legacy supplier that the aircraft operator had assessed through quality assurance audits conducted in August 2011 and May/December 2013. Then, in January 2014, the CAMO arranged for a quality assurance audit of TAE maintenance activity at Brisbane and Sydney with a follow-up audit after the occurrence.
In general, these audits of TAE did not identify any serious deficiencies or risks that warranted immediate action by the aircraft operator or CAMO. It is noted, however, that the auditors identified under-resourcing of the TAE quality assurance system and out-of-date interface procedures, which were recurring findings.
As a further and more direct means to ensure the operator’s aircraft were being maintained properly, maintenance watch engineers specified maintenance inspections and coordinated defect rectification. While these roles were performed as required in relation to this occurrence, it was not clear if other parts of the maintenance watch role were performed to the intended extent. That is, to provide technical support to line maintenance personnel and liaise with line stations to ensure they had adequate resources.
In the context of a maintenance watch engineer in Brisbane assigning a maintenance inspection to contracted engineers in Sydney, it would seem to be impractical for the maintenance watch engineer to proactively provide technical support and monitor resourcing at the Sydney line station. As was standard practice, maintenance watch expected that the Sydney engineers would be able to conduct the maintenance inspection as per the job instruction card and determine if the aircraft was unairworthy.
As the ATSB later established, there was a lack of assurance that the previous turbulence inspections conducted at Sydney had been carried out as the aircraft manufacturer intended. This was not something that maintenance watch or the CAMO in general could readily identify during routine operation.
Given this was a reportable incident to the ATSB, the maintenance watch engineer passed on information to the ATR AOG response centre and aircraft operator/CAMO personnel, as per maintenance watch procedures.
ATSB observation
The response of the CAMO/maintenance watch to the in-flight pitch disconnect event was consistent with the applicable procedures to collect information, advise affected parties, and specify maintenance. In the immediate aftermath of this occurrence, maintenance watch relied on the results of the turbulence/VMO exceedance inspection to establish the aircraft’s airworthiness. Certification of the inspection with a nil-defect result did not raise any concerns from maintenance watch, or any of the other involved parties, of how critical the occurrence was and the potential for undetected damage.
While the CAMO could have done more to assess the ongoing capability of TAE to conduct ATR 72 line maintenance, it is not clear that this would have altered the outcome of this occurrence.
3b. Safety analysis
Introduction
Following the in-flight upset and pitch disconnect on 20 February 2014, at the request of Virgin Australia Regional Airlines (VARA), Licenced Aircraft Maintenance Engineers (LAMEs) looked at the aircraft and carried out an inspection with reference to the assigned job inspection card (JIC) on behalf of Toll Aviation Engineering. No defects were identified and one of the LAMEs certified the aircraft log accordingly. On that basis, along with certifications for other tasks, the aircraft was issued with a certificate of release to service.
As described in Part 2 of this report, the horizontal stabiliser had sustained substantial structural damage during the in-flight upset and pitch disconnect, which rendered the aircraft unairworthy. However, the aircraft was operated in this condition for 13 flights over a 5-day period until the stabiliser damage was found during an inspection that followed a suspected bird strike. During this period, LAMEs carried out routine line maintenance and pilots conducted pre-flight inspections without noticing the damage.
The ATSB acknowledges that due to the continued operation of the aircraft for an additional 13 flights, the exact extent of damage at the time of the pitch disconnect event could not be conclusively determined. Given the distortion of the horizontal stabiliser that was visible on the CCTV footage of the aircraft before and after the maintenance was conducted, the ATSB considers that external indications of structural deformation would have been visible when the aircraft was inspected after the occurrence.
In the following analysis, the ATSB identifies the critical points in the post-event maintenance activities and their associated systemic elements.
Maintenance events and actions
The LAMEs (senior base engineer and LAME 1) who attended the aircraft on arrival at Sydney after the in-flight upset and pitch disconnect consulted with the flight crew and accessed data from the aircraft system computer. From this process, the LAMEs ascertained the following information:
the pitch disconnected (left and right elevator control systems uncoupled) during descent
the flight crew were uncertain about the circumstances
the flight crew associated the event with moderate turbulence
the maximum airspeed reached was just short of maximum operating speed (VMO)
the maximum vertical loading was 3.34 g
a No-1 engine oil pressure warning was recorded
a cabin crew member was injured
the flight crew successfully re-connected the left and right elevator systems on the ground.
Based on this information, the LAMEs correctly identified that the maximum vertical loading had exceeded the acceptable limits for the aircraft and the applicable maintenance was job instruction card JIC 05-51-11 DVI 10000Inspection after flight in turbulence and/or exceeding VMO (abbreviated in this report as ‘turbulence/VMO exceedance inspection’). The only other maintenance arising from the in-flight events was in response to the engine oil pressure warning and to maintenance watch’s request for a download of the on-board recorders.
The LAMEs consulted with the duty maintenance watch engineer by phone who confirmed the applicable maintenance and arranged for the LAMEs to carry out the turbulence/VMO exceedance inspection before the next scheduled flight at 0800 the next morning. This tasking was accepted by the LAMEs without any request to maintenance watch for technical advice or logistical support. As such, maintenance watch could expect that the LAMEs had the capability to carry out the task in accordance with the applicable job instruction card and within the allocated time.
The ATSB notes that maintenance watch became aware (as recorded in the notification to ATR) that the pitch disconnect was due to dual control inputs but did not pass that information to the LAMEs carrying out the turbulence/VMO exceedance inspection. As a matter of principle, the capability of maintenance personnel to evaluate airworthiness is enhanced by access to all of the contextual information. Although the LAMEs were not aware of all the available information, they had the information relevant to the turbulence/VMO exceedance inspection and it is unlikely that an awareness of dual control inputs would have altered the outcome.
When LAME 2 arrived at the TAE Sydney Airport office (between 1830 and 1900), there was a discussion involving the three LAMEs about the in-flight event, the initial engineering response, and interactions with maintenance watch. From the recollections of the LAMEs, it appears that all of the key information about the event and maintenance-related actions was communicated effectively to LAME 2, except for two maintenance aspects.
The turbulence/VMO exceedance job instruction card stipulated a General Visual Inspection (GVI) of various exterior surfaces including the stabiliser skins and that this term had a specific meaning that was not defined in the card. Essentially, a person tasked with a GVI was required to be in close proximity (touching distance) of the nominated surface when conducting the visual inspection. On that basis, a conforming GVI of the high-mounted horizontal stabilisers required the use of an elevated platform of some type.The first aspect related to the works that would satisfy the GVI requirements (item 009) of the turbulence/VMO exceedance inspection. According to the senior base engineer, he had advised LAME 2 of his walk-around look at the aircraft and its nil-defect result. This walk-around was not intended to be a conforming GVI and the senior base engineer recalled that he did not advise or certify that to be the case.
According to LAME 2, however, his understanding at the time was that the GVIs had effectively been carried out by the senior base engineer and that he was only required to carry out the detailed visual inspections (DVI) (items 010-012) of the JIC. (LAME 1 was not able to recall the specifics of the discussion.)
Based on those recollections, it appears that the GVI of the stabilisers was not carried out because the LAMEs believed that one of the other engineers had conducted the inspection or would be doing so. Assuming that the LAMEs clearly understood the JIC and intended to conform, the ATSB noted some inconsistencies between their recollections and their expected roles.
In relation to the role played by the senior base engineer, while on duty it was common practice for him to make the arrangements for access to equipment such as elevated platforms. Although the senior base engineer had agreed to the maintenance watch request for completion of the inspection that night, he did not make any arrangements for access to an elevated platform or discuss the subject with LAME 2.
The ATSB noted that the senior base engineer finished work that night at about 2230. LAME 2 continued working for another hour before certifying the aircraft maintenance complete, then signing off from work at about 2345. Considering the time available between the senior base engineer finishing work and LAME 2 completing maintenance, it was implausible that LAME 2 would be able to arrange access to an elevated platform within the limited time available, especially considering LAME 2 was rostered for an early start the next day.
According to the senior base engineer, he was not required to provide any technical or logistical support to LAME 2, who was authorised to certify for the turbulence/VMO exceedance inspection and able to arrange purchase orders for equipment hire. This was not consistent with the expectations that TAE management had for their senior base engineers to coordinate and oversight as required. Given the context, LAME 2 could interpret the disengagement of the senior base engineer as tacit confirmation that an elevated platform was not required.
In relation to the role played by LAME 2, his understanding was that the senior base engineer had carried out the GVIs, yet there was no suggestion that the senior base engineer had hired or borrowed an elevated platform to inspect the stabilisers. Assuming a clear understanding of the requirements, it might be expected that LAME 2 would have doubted the suitability of the senior base engineer’s walk‑around look at the aircraft as a means to satisfy the GVI requirement, especially of the upper surfaces of the wings and stabilisers. The ATSB also noted that LAME 2 borrowed a stand to inspect the wing upper surface with a glancing look at the tailplane from a distance, which suggests some doubt about the adequacy of the earlier walk-around inspection by the senior base engineer.
An aspect of the pre-inspection LAME discussion that was problematic was an apparent lack of clarity as to the ongoing roles and responsibilities for the conduct of the inspection. The senior base engineer believed that he called in LAME 2 to take over the inspection with full responsibility for completion of all the tasks and that this was supported by subsequent certification for the whole task by LAME 2. From the perspective of LAME 2, this was not articulated to him at the time.
After the initial discussion involving the three LAMEs, there were further opportunities for the LAMEs to coordinate the inspection and clarify the completion status of tasks. This was not done effectively and LAME 2 certified that the inspection had been completed and no defects were identified.
By certifying for the inspection, LAME 2 was asserting that each applicable element of the JIC had been carried out in accordance with those instructions, either personally or by someone under direct supervision. This was not the case, however, as LAME 2 certified for work carried out by the senior base engineer at the arrival bay and/or for his own quick look at the stabilisers from the stand at the wing root. The senior base engineer advised the ATSB that LAME 2 was not entitled to certify on his behalf and it was not standard practice for that to occur.
Given the regulatory framework in which aircraft maintenance takes place, certification provided a high level of assurance to all parties that the finding of nil defects was valid and confirmed the aircraft to be airworthy, despite the recorded aerodynamic loads. Critically, however, this was not the case. The inspection had not been carried out in full conformance to the JIC and stabiliser damage was not detected. Consequently, the aircraft was released to service with a damaged tailplane.
The ATSB found that: The licenced aircraft maintenance engineers involved in the ‘Inspection after flight in turbulence and/or exceeding VMO’ did not carry out the general visual inspection of the stabilisers as specified probably because of a breakdown in the coordination and certification of the inspection tasks. As a result, the damage was not detected and the aircraft was released to service.
The ATSB notes that while maintenance watch reported to ATR that the pitch disconnect was due to dual control inputs, this information was not passed to the LAMEs.
It was common and accepted practice for VARA maintenance watch to liaise directly with the Sydney engineers for the tasking and confirmation of line maintenance activity. By default, this was consistent with the TAE Maintenance Organisation Exposition (MOE) manual and the Interface Procedures Manual, provided the maintenance was not complex. However, for complex work using worksheets, the TAE exposition required the involvement of TAE maintenance planners to assign a job number and direct the aircraft operator’s worksheets to the applicable line station.
Complex tasks were not defined in the TAE MOE and it was not clear if a turbulence/VMO exceedance inspection would generally be classified as such. In any event, maintenance watch did not provide any worksheets and relied on verbal communication with the Sydney LAMEs as per standard practice. Given the Sydney LAMEs were involved in the information gathering and selection of the inspection, the ATSB considered that the outcome was unlikely to be have been different if the task requirement had been documented.
When maintenance watch arranged with the duty engineers to carry out the turbulence/VMO exceedance inspection, it was communicated that the aircraft’s next flight was at 0800 the following morning. This placed additional strain on the resources of the Sydney line station, prompting a modified roster for that day. Since there was no established process for liaison between Sydney line station and TAE workforce managers in Brisbane, there was a reduced opportunity to address the resource and aircraft availability issues.
Although the Approved Maintenance Organisation (AMO) stipulated the use of a diary at line stations, it was not clear if this form of inter‑shift communication was being used at the Sydney line station at the time of the occurrence. The ATSB noted that the diary was intended for use by leading hands but these positions were not assigned to LAMEs at the Sydney line station. If the diary was not being used at the Sydney line station at the time of the occurrence, it was a missed opportunity to coordinate the maintenance activities being conducted at the station.
There was also an opportunity for the senior base engineer to be more proactive in the preparation for and conduct of the turbulence/VMO exceedance inspection. However, contrary to the expectations of AMO management, the senior base engineer did not consider their role to include the coordination and supervision of maintenance tasks. The senior base engineer operated as a line engineer with some additional administrative duties and was not present for every shift. The reduced level of coordination also reduced the opportunity to address local conditions that might affect the maintenance task. This situation existed in part because the AMO did not clearly define or document the role and responsibilities of the senior base engineer.
The ATSB noted that there was no documentary record of the completion of each item of the turbulence/VMO exceedance inspection. A record of who completed each item of the inspection would assist in the coordination of the inspection as a whole. For example, this could be achieved by printing the JIC with sign-off fields for each item or by listing each item on a separate worksheet.
The ATSB found that: the AMO did not define, document, or otherwise assure the intended arrangements for coordination of maintenance at line maintenance stations, which allowed for the development of local operating practices that were not consistent with the expectations of AMO management.
Certification of maintenance
In the CASR Part 145 framework, there were two types of certification made in the aircraft log to provide assurance that an aircraft was airworthy. The first was certification of specific maintenance tasks carried out and the second was issue of a Certificate of Release to Service to certify that all of the required maintenance had been carried out or approved measures were in place to address any unrectified items.
In addition to certification of the aircraft log, there were additional requirements for formal recording of complex maintenance. The AMO addressed the CASR Part 145 requirements for recording maintenance by tasking the AMO maintenance planners and supervisors with the breaking down of complex jobs and the production of task control lists. For line stations carrying out complex jobs, this process was to be supplemented by the provision of worksheets by the aircraft operator. It appeared from the MOE that for all other (non-complex) work, line stations were only required to record it in the aircraft log.
As already discussed, in the absence of a definition of complex maintenance, it was not clear if the turbulence/VMO exceedance inspection should have been treated as such. Given the inspection could conceivably be completed by a single LAME within a single shift (in this case, LAME 2 undertook much of the task in about 4 hours), there was limited argument that the inspection required division into stages for recording/certification purposes. In the context of this occurrence, even if the inspection had been divided into stages to enable itemised sign-offs, the breakdown in coordination and certification of the inspection may still have occurred.
Equipment availability
The AMO did not provide the Sydney line station with a high-access stand such as a scissor lift but the engineers could arrange to hire one, as required, from a major airline. These hire arrangements depended on purchase orders issued by Brisbane-based stores and planning personnel, so the hiring of equipment was generally limited to their hours-of-work. The ATSB was advised that the Sydney LAMEs would also draw on their local contacts to borrow equipment including high-access stands.
As it happened, this constraint on the availability of equipment was not a factor on the day of the occurrence because a purchase order for a cherry picker issued the day before had not been used. At least one of the engineers involved in the post-occurrence maintenance response was aware that the purchase order was still valid until the end of the month.
If the engineer carrying out the inspection had identified a need for a scissor lift but was unaware of the extant purchase order, the GVI of the horizontal stabiliser could have been deferred until a scissor lift was hired the next day. As it turned out, there was a delay in changing the cockpit voice recorder and flight data recorder so there was an opportunity the next day to hire or borrow a scissor lift if the need had been recognised.
The ATSB noted there was no regulatory requirement for the AMO to equip a line station with all of the equipment that they might require and no one had identified the need for the AMO to provide a high-access stand. As such, and given there were arrangements in place for LAMEs to hire equipment, the ATSB did not consider lack of equipment to be safety factor.
Turbulence/VMO Exceedance Job Instruction Card
Documentation such as JICs and maintenance procedures typically drive maintenance tasks. They not only convey task performance instructions but can provide the means by which engineers will communicate task completion and the extent of system disruption to one another. Given the importance of maintenance instructions, it is not surprising that poorly designed documentation becomes a factor in many incidents (Reason and Hobbs, 2003).[106] Wordy, repetitive procedures can promote errors while unworkable or unrealistic procedures can promote violations.
For the LAMEs involved in the maintenance following the in-flight upset and pitch disconnect, the primary reference document was JIC 05-51-11 DVI 10000Inspection after flight in turbulence and/or exceeding VMO. As such, the ATSB examined the form and content of the JIC.
From the text of the JIC, it is clear that the GVI involved a check of stabiliser skin panels and fairings. However, the JIC did not specifically state or imply a requirement to inspect from an elevated position. For example, it was not detailed to the extent that the inspection specifically included the upper surface of the stabilisers.
Although a GVI was not defined in the JIC, the approved maintenance program for the ATR 72 defined a GVI as a visual examination made from touching distance, unless otherwise specified. When that definition is applied to the JIC, it is apparent that the prescribed method to inspect the horizontal stabiliser was from an elevated position within touching distance of the upper and lower surfaces.
Given the approved maintenance program was not a required reference document for line maintenance engineers, it is possible that engineers might be unfamiliar with the definition of a GVI. Other factors that may adversely influence understanding of a GVI is the connotation of non‑specificity associated with the term and that the term was also used in references for the walk-around inspections included in the weekly check.
On the other hand, the ATR definition of a GVI was an industry standard and familiarity from maintenance in other contexts might be expected. Either way, there was potential for individual variability in comprehension of the specific intent of the stabiliser GVI.
The ATSB reviewed the records associated with previous turbulence/VMO exceedance inspections carried out on ATR 72 aircraft by TAE. There was no evidence of purchase orders being issued for hire of high-access platforms in six out of the seven inspections pre-occurrence. Although platforms could have been borrowed and used for the inspection, the ATSB was unable to verify that the LAMEs who conducted the previous turbulence/VMO exceedance inspections conducted the GVI of the stabilisers as intended by the manufacturer.
The ATSB found that: Inthe JIC 05-51-11 DVI 10000 Inspection after flight in turbulence and/or exceeding VMO, the aircraft manufacturer did not specify the ground support equipment required or clearly state that the GVI of the stabilisers included a close examination of the upper surface. Given engineers tasked with the inspection may not be awarethat ATR referred to the standard definition of a GVI, there was a risk that engineers tasked with the inspection would not interpret the card correctly.
Maintenance following an in-flight pitch disconnect
To facilitate assessment of airworthiness following abnormal conditions, the aircraft manufacturer provided a JIC that listed the available inspections. As described in the previous section, the turbulence/VMO exceedance was the most appropriate inspection available to VARA maintenance watch and the LAMEs.
Although this JIC included a GVI of the stabiliser, the majority of engineer effort was expended on gaining access to the wing attachment areas and conducting a DVI. As such, the JIC was fit for the nominated purpose but not optimised to detect the damage that could result from a pitch disconnect in-flight.
Expectancy and relevance tend to guide human attention while, at the same time, salient events in the environment attract attention. Research has demonstrated that people are more likely to detect targets when expected and less likely to detect targets that are not expected (Wickens and McCarley 2008).[107] This occurs even when the targets are salient, potentially important and in an area to which the person is looking.
The factors that could have led to non-detection errors in terms of conducting the turbulence/VMO exceedance inspection pertinent to this investigation are:
The LAMEs did not expect to find a problem with the stabilisers.
Unsatisfactory access to the inspection area.
The senior base engineer stated that in his experience with overspeeds, a visual inspection can detect signs of damage. He conducted a walk around and visually inspected the aircraft. The senior base engineer stated that he looked at all the areas that his years of experience have taught him are the likely areas for damage from over stress. During his walk-around the senior base engineer looked at the stabiliser structures but did not see any damage.
Later, the certifying engineer (LAME 2) borrowed a stand to inspect the wing upper surface with the glancing look back to the tailplane. The earlier indications from the senior base engineer that he did not identify any issues with the horizontal stabiliser, probably led LAME 2 to not expect to see any issues, and therefore, only perform a rudimentary examination of the horizontal stabiliser.
Similarly, each engineer and flight crew member who conducted inspections and walk-arounds between that night and 25 February, had no expectation of finding any damage as the aircraft had been deemed serviceable. Therefore, they did not inspect the horizontal stabiliser to the level of detail whereby they may have been able to see the damage.
In this occurrence, the pitch disconnect was accompanied by abnormal g-loading that triggered the turbulence/VMO exceedance inspection. However, it is conceivable that a pitch disconnect could occur without exceedance of the parameters that would be identified as an abnormal condition. In such a case having not triggered an inspection, an aircraft might continue in operation with undetected damage sustained during a pitch disconnect.
As already established in Part 2 of this report, the aircraft manufacturer and certification authorities were not aware of the criticality of an in-flight pitch disconnect in the ATR 72 aircraft type. One of the consequences of this was the absence of a maintenance inspection optimised to identify stabiliser damage. As illustrated in this case, the LAMEs involved in the maintenance following the in-flight upset and pitch disconnect (reported as a result of turbulence) did not have any cues as to the potential for stabiliser damage from asymmetric loading at high speed. The absence of a JIC that directed attention to the stabiliser surfaces and attachments with a DVI, reduced the likelihood that the damage could be detected and increased the risk of an unairworthy aircraft being released to service.
The ATSB found that: The aircraft manufacturer, ATR, did not provide a maintenance inspection to specifically assess the effect of an in-flight pitch disconnect on the structural integrity of the horizontal stabilisers. As a result, if an in-flight pitch disconnect occurred, the aircraft may not be inspected at a level commensurate with the criticality of the event.
One of the previous ATR in-flight pitch disconnect occurrences occurred in 2002 as the result of a mechanical failure within the pitch uncoupling mechanism. The defect was rectified and the aircraft was returned to service. In 2014, during a scheduled inspection of the horizontal stabiliser, loose fasteners and wear was found. These defects were found to be associated with the in-flight pitch disconnect in 2002.
In June 2016, the ATSB was advised that during a scheduled inspection of an ATR 72 significant damage to the horizontal stabiliser was detected. This damage was similar to the damage sustained by VH-FVR. A search of the operational and maintenance history of the aircraft did not identify any events that would have resulted in such damage. In the absence of any other plausible causal mechanism, the ATSB considered that the damage was consistent with an in-flight disconnect.
The VH-FVR occurrence and the two other instances of damage just described demonstrate the principle that damage could have been sustained during an in-flight pitch disconnect in the past. In the absence of a specific maintenance inspection, these aircraft may continue to operate until the damage is found during scheduled maintenance or incidental inspections.
The ATSB found that: As a legacy of there being no inspection specific to an in-flight pitch disconnect, there is potential for other ATR aircraft to have sustained an in-flight pitch disconnect in the past and be operating with undetected horizontal stabiliser damage.
Fatigue management
The International Civil Aviation Organization (ICAO 2011)[108] defined fatigue as:
A physiological state of reduced mental or physical performance capability resulting from sleep loss or extended wakefulness, circadian phase, or workload (mental and/or physical activity) that can impair a crew member’s alertness and ability to safely operate an aircraft or perform safety related duties.
Fatigue can have a range of adverse influences on human performance, such as slowed reaction time, decreased work efficiency, reduced motivational drive, increased variability in work performance, and more lapses or errors of omission (Battelle Memorial Institute 1998).[109] In addition, most people generally underestimate their level of fatigue.
Sleep is vital for recovery from fatigue, with both the quantity and quality of sleep being important. It is generally agreed that most people need at least 7–8 hours of sleep each day to achieve maximum levels of alertness and performance. A review of relevant research (Dawson and McCulloch 2005)[110] concluded:
…we can make broad assumptions from existing literature that obtaining less than 5 hours’ sleep in the prior 24 hours, and 12 hours’ sleep in the prior 48 hours would be inconsistent with a safe system of work.
Other research has indicated that less than 6 hours sleep in the previous 24 hours can increase risk. Thomas and Ferguson (2010)[111] examined the effects of different amounts of sleep on the performance of Australian airline flight crews. The average amount of sleep in the previous 24 hours was 7 hours for captains and just over 7 hours for first officers. Crew errors were higher, and performance at managing threats was poorer, during flights when the crew included a captain with less than 6 hours sleep or a first officer with less than 5 hours sleep.
Road safety research has also shown that the risk of a fatigue-related accident increases as the driver’s amount of sleep in the previous 24 hours decreases. Several studies show that less than 6 hours sleep has significantly more risk of an accident than 7-8 hours’ sleep (Williamson and others, 2011).[112]
For aircraft maintenance engineers, ICAO has also stated that excessive hours of work, poor planning, insufficient staff, bad shift scheduling and a working environment with no proper control of temperature, humidity or noise are all known to contribute to fatigue in the aviation maintenance environment (ICAO, 2003;[113] CASA, 2011[114]). CASA’s guidance material for Part 145 AMO cites a UK Civil Aviation Authority paper (Folkard, 2003)[115] when making recommendations of guidelines for ‘good practice’ in fatigue and impairment management. Established trends in risk derived from a review of large-scale studies of accidents and/or injury investigations from a wide variety of industries and countries form the basis of the recommendations in the guidelines.
In terms of guidance on daily limits for maintenance engineers, evidence exists that fatigue risk increases over the course of a shift in an approximately exponential manner. Therefore, risk increases substantially once a shift becomes greater in length than 8 hours. The risk of a roster of 12-hour shifts is some 27.6 per cent higher than a roster of 8-hour shifts. Thus, shifts longer than 12 hours are clearly undesirable and the guidelines recommend that the extent to which an overtime shift should be lengthened is limited to 13 hours.
In addition, the CASA guidelines recommend that the break between two successive shifts is to be sufficient to allow appropriate travel, rest, sleep, and sustenance. The European Union’s Working Time Directive sets this limit to 11 hours and the CASA guidance material adopted this limit.
The two rostered engineers (LAME 1 and the senior base engineer) were on-duty early and thus were at the end of a long duty day by the time of the initial inspection of VH-FVR’s horizontal stabiliser at around 1730 and the commencement of the turbulence/VMO exceedance inspection. Both had exceeded the duty time limit for a day’s work and had less than the minimum 10 hours recommended rest period the night before commencing work. The senior base engineer appeared to have had less than half the recommended rest period.
The senior base engineer had a 4 hours 30 minutes to 5-hour sleep opportunity the night prior to the occurrence then worked a 17-hour day. LAME 1 started work on the day of the incident at 0530 after approximately a 5 hour and 30 minutes to hour sleep opportunity.
The two duty engineers did recognise that they were becoming fatigued and called in LAME 2 so the more complex/critical tasks could be allocated to a maintenance engineer likely to be more alert. The two duty engineers stated in interview that such a long duty day was a very rare occurrence and their day had not been arduous between the time of the propeller change and the arrival of VH-FVR, but did believe that they were becoming fatigued by the time they called in the certifying engineer.
LAME 2 completed inspection tasks, certified for the turbulence/VMO exceedance inspection, then left work at 2330. He was back on duty at 0600 the next day, meaning he had a five-hour sleep opportunity between getting home and the commencement of his shift the following day. He stated in interview that his alertness was lower than the previous night’s (self-rated 7-8/10) but not to a dangerous extent—but he had had less than half the recommended rest period.
All three engineers involved in this occurrence were seen to have had limited rest breaks and sleep opportunities. The certifying engineer was not fatigued at the time the turbulence/VMO exceedance inspections were carried out, therefore fatigue cannot be seen as a contributing safety factor in the maintenance event related to this occurrence.
The two duty engineers were fatigued at the end of a very long duty day and a good decision was taken to bring in a fresh engineer. There was an adverse flow-on effect, however, because LAME 2 was rostered to start early the next day and the senior base engineer did not make further adjustments to the roster. Similarly, the senior base engineer had varied the shift patterns of himself and LAME 1 to start early that morning but did not make further adjustments to provide normal hours of work for himself and LAME 1. This arrangement exposed the senior base engineer and LAME 1 to the risk of fatigue in the latter part of the rostered shift.
The long duty day of the two rostered engineers plus the restricted sleep and rest opportunities for all three engineers indicates that the fatigue management system that TAE had in place at the time was not being followed. TAE management stated that they expected the senior base engineer to have better managed and made better decisions with regards the fatigue of the Sydney-based engineers. However, there was no evidence that the senior base engineer had received any training on managing the fatigue of a team of engineers.
The ATSB found that: Although Toll Aviation Engineering (approved maintenance organisation) specified fatigue management procedures, the licenced aircraft maintenance engineers (LAMEs) who were involved in the inspection after flight in turbulence and/or exceeding VMO operated outside the nominated hours of work. As such, the LAMEs were at risk of fatigue on the day of the inspectionand/or the day following.
From the evidence available, the following findings are made regarding the in-flight upset and inadvertent pitch disconnect involving ATR 72 aircraft, VH-FVR on 20 February 2014 resulting in cabin crew injury and serious aircraft damage. A post-event maintenance inspection was carried out but the aircraft damage was not detected. Consequently, the aircraft was operated for another 13 flights over 5 days before the damage was identified. These findings should not be read as apportioning blame or liability to any particular organisation or individual.
Safety issues, or system problems, are highlighted in bold to emphasise their importance. A safety issue is an event or condition that increases safety risk and (a) can reasonably be regarded as having the potential to adversely affect the safety of future operations, and (b) is a characteristic of an organisation or a system, rather than a characteristic of a specific individual, or characteristic of an operating environment at a specific point in time.
In-flight upset and pitch disconnect
Contributing factors
During the descent, when the sterile flight deck policy was applicable, the flight crew engaged in non-pertinent conversation. This distracted the crew and probably reduced their ability to monitor and respond to fluctuations of airspeed.
While passing through about 8,500 ft on descent into Sydney, the aircraft encountered a significant windshear that resulted in a rapidly decreasing tailwind. This led to a rapid increase in the airspeed, with the airspeed trend vector likely indicating well above the maximum operating speed (VMO).
Although the first officer (pilot flying) was in the process of attempting to control the airspeed, in response to the unexpectedly high airspeed trend indication, and their proximity to VMO, the captain (pilot not flying) perceived a need to immediately intervene, and made pitch control inputs before following the normal take-over procedure and alerting the first officer.
Inflight upset
The addition of the captain’s and first officer’s nose-up control inputs resulted in a pitching manoeuvre that exceeded the limit load factor for the aircraft of 2.5 g.
The magnitude of the captain's nose-up control input was probably greater than he intended, due to his response to a high stress level, but increased the probability that the aircraft's limit load factor would be exceeded.
Pitch disconnect
Shortly after the captain initiated the nose-up control inputs, the first officer reversed his control input. The differential forces in the left (captain) and right (first officer) pitch control systems were sufficiently large to inadvertently activate the pitch uncoupling mechanism, disconnecting the left and right pitch control systems.
Given the high airspeed, the asymmetric elevator deflections that occurred immediately following the pitch disconnect event resulted in aerodynamic loads on the tailplane that exceeded its strength and damaged the horizontal stabiliser.
The design of the ATR 72 pitch control system resulted in limited tactile feedback between the left and right control columns, reducing the ability of one pilot to detect that the other pilot is making control inputs. In addition, there were no visual or auditory systems to indicate dual control inputs. (Safety issue)
Other factors that increased risk
Inadvertent application of opposing pitch control inputs by flight crew on ATR aircraft can activate the pitch uncoupling mechanism which, in certain high-energy situations, can result in catastrophic damage to the aircraft structure before crews are able to react. (Safety issue)
The aircraft manufacturer did not account for the transient elevator deflections that occur as a result of the system flexibility and control column input during a pitch disconnect event at all speeds within the flight envelope. As such, there is no assurance that the aircraft has sufficient strength to withstand the loads resulting from a pitch disconnect. (Safety issue)
Flexibility in the ATR 72’s pitch control system between the control columns results in a change in the aircraft’s longitudinal handling qualities and control dynamics when dual control inputs are made. This could result in an aircraft-pilot coupling event where flight crew may find it difficult to control the aircraft. (Safety issue)
The design standard for large transport aircraft, Joint Aviation Requirements - Part 25 (JAR‑25), did not require that the demonstrated potential for flexibility in the control system to develop transient dynamic loads, be considered during certification. Similarly, the current certification standard for Large Aeroplanes (CS-25) does not address this issue. (Safety issue)
Although the design standard for the aircraft (JAR-25) required the control system to be of sufficient strength to withstand dual control inputs, it did not require consideration of the effect that dual control inputs may have on control of the aircraft. Similarly, the current design standard (CS-25) does not address this issue. (Safety issue)
Other findings
The pitch disconnect warning system in the ATR 72 did not alert the flight crew to the pitch disconnect until after the resulting aerodynamic loads had exceeded the strength of the horizontal stabiliser.
The aircraft manufacturer and aircraft operator provided limited guidance to flight crew regarding the management of airspeed on descent and appropriate handling for recovery from an imminent VMO exceedance.
Senior Cabin Crew Member received serious injuries as a result of the recovery manoeuvre from the in-flight upset.
Inspection and continued operation
Contributing factors
The licenced aircraft maintenance engineers involved in the Inspection after flight in turbulence and/or exceeding VMO did not carry out the specified general visual inspection of the stabilisers probably because of a breakdown in the coordination and certification of the inspection tasks. As a result, the damage was not detected and the aircraft was released to service.
Other factors that increased risk
The aircraft manufacturer, ATR, did not provide a maintenance inspection to specifically assess the effect of an in-flight pitch disconnect on the structural integrity of the horizontal stabilisers. As a result, if an in-flight pitch disconnect occurred, the aircraft may not be inspected at a level commensurate with the criticality of the event. (Safety issue)
As a legacy of there being no inspection specific to an in-flight pitch disconnect, there is potential for other ATR aircraft to have sustained an in-flight pitch disconnect in the past and be operating with undetected horizontal stabiliser damage. (Safety issue)
In the job instruction card JIC 05-51-11 DVI 10000Inspection after flight in turbulence and/or exceeding VMO, the aircraft manufacturer did not specify the ground support equipment required or clearly state that the general visual inspection (GVI) of the stabilisers included a close examination of the upper surface. Given engineers tasked with the inspection may not be aware that ATR referred to the standard definition of a GVI, there was a risk that engineers tasked with the inspection would not interpret the card correctly.
Toll Aviation Engineering did not define, document, or otherwise assure the intended arrangements for coordination of maintenance at line maintenance stations, which allowed for the development of local operating practices that were not consistent with the expectations of AMO management.
Although Toll Aviation Engineering (approved maintenance organisation) specified fatigue management procedures, the licenced aircraft maintenance engineers (LAMEs) who were involved in the inspection after flight in turbulence and/or exceeding VMO operated outside the nominated hours of work. As such, the LAMEs were at risk of fatigue on the day of the inspection and/or the day following.
Other findings
Maintenance engineers carried out line maintenance and flight crew carried out pre-flight inspections in the 5 days after the in-flight upset and inadvertent pitch disconnect without detecting the damage to the tailplane.
The captain of the thirteenth flight of VH-FVR since the flight control event was diligent in the post-flight inspection of the aircraft following a suspected bird strike and having detected some damage to the tailplane prompted an effective engineering examination that identified the serious structural damage.
Safety issues and actions
The safety issues identified during this investigation existed at the time of the occurrence and are listed in the Findings and Safety issues and actions sections of this report. The Australian Transport Safety Bureau (ATSB) expects that all safety issues identified by the investigation should be addressed by the relevant organisation(s). In addressing those issues, the ATSB prefers to encourage relevant organisation(s) to proactively initiate safety action, rather than to issue formal safety recommendations or safety advisory notices.
Depending on the level of risk of the safety issue, the extent of corrective action taken by the relevant organisation, or the desirability of directing a broad safety message to the aviation industry, the ATSB may issue safety recommendations or safety advisory notices as part of the final report.
The initial public version of these safety issues and actions are repeated separately on the ATSB website to facilitate monitoring by interested parties. Where relevant the safety issues and actions will be updated on the ATSB website as information comes to hand.
Inadvertent activation of the elevator control system – pitch uncoupling mechanism
Safety issue description: Inadvertent application of opposing pitch control inputs by flight crew can activate the pitch uncoupling mechanism which, in certain high-energy situations, can result in catastrophic damage to the aircraft structure before crews are able to react.
Consideration of transient elevator deflections from a pitch disconnect
Safety issue description: The aircraft manufacturer did not account for the transient elevator deflections that occur as a result of the system flexibility and control column input during a pitch disconnect event at all speeds within the flight envelope. As such, there is no assurance that the aircraft has sufficient strength to withstand the loads resulting from a pitch disconnect.
Safety issue description: The design of the ATR 72 pitch control system resulted in limited tactile feedback between the left and right control columns, reducing the ability of one pilot to detect that the other pilot is making control inputs. In addition, there were no visual or auditory systems to indicate dual control inputs.
Effect of dual control inputs on elevator response
Safety issue description: Flexibility in the ATR 72’s pitch control system between the control columns results in a change in the aircraft’s longitudinal handling qualities and control dynamics when dual control inputs are made. This could result in an aircraft-pilot coupling event where flight crew may find it difficult to control the aircraft.
No consideration of transient control loads in the design standard
Safety issue description: The design standard for large transport aircraft, Joint Aviation Requirements - Part 25 (JAR-25), did not require that the demonstrated potential for flexibility in the control system to develop transient dynamic loads, be considered during certification. Similarly, the current certification standard for Large Aeroplanes (CS-25) does not address this issue.
No consideration of dual control inputs on aircraft response in the design standard
Safety issue description: Although the design standard for the aircraft (JAR-25) required the control system to be of sufficient strength to withstand dual control inputs, it did not require consideration of the effect that dual control inputs may have on control of the aircraft. Similarly, the current design standard (CS-25) does not address this issue.
Maintenance requirements following an in-flight pitch disconnect
Safety issue description: The aircraft manufacturer, ATR, did not provide a maintenance inspection to specifically assess the effect of an in-flight pitch disconnect on the structural integrity of the horizontal stabilisers. As a result, if an in-flight pitch disconnect occurred, the aircraft may not be inspected at a level commensurate with the criticality of the event.
Undetected horizontal stabiliser damage in world fleet
Safety issue description: As a legacy of there being no inspection specific to an in-flight pitch disconnect, there is potential for other ATR aircraft to have sustained an in-flight pitch disconnect in the past and be operating with undetected horizontal stabiliser damage.
Additional safety action
Whether or not the ATSB identifies safety issues in the course of an investigation, relevant organisations may proactively initiate safety action in order to reduce their safety risk. The ATSB has been advised of the following proactive safety action in response to this occurrence.
ATR
In September 2018, ATR reported to the ATSB that they have:
… improved the aircraft protection against low and high speed. Since New Avionic Standard (NAS) 3, available since Q1 2018, the aircraft is protected from VMO exceedance with Autopilot engaged. Caution is triggered on PFD and Autopilot adjust the pitch to contain speed acceleration and to maintain speed below VMO, even with high-speed trend. With further development of next NAS (Standard 4), the same protection will also be available with Autopilot disengaged (flying FD only).
Sources and submissions
Sources of information
The sources of information during the investigation included:
Airbus, ‘Dual Side Stick Inputs’, Safety First, #03, December 2006, pages 3-6
Australian Transport Safety Bureau, Aviation Occurrence Report 200505311 Crosswind Landing Event, Melbourne Airport, Vic. – 26 October 2005, HS-TNA, Airbus A34-642, June 2007
Bureau d'Enquêtes et d'Analyses pour la sécurité de l'aviation civile report into the Serious Incident Unstabilised approach, triggering of GPWS and MSAW warnings, dual input, missed approach, at night under instruction. Airbus A320 SX-BHV, March 2015
Committee on the Effects of Aircraft-Pilot Coupling on Flight Safety, Aeronautics and Space Engineering Board, Commission on Engineering and Technical Systems, National Research Council 1997, Aviation Safety and Pilot Control – Understanding and Preventing Unfavourable Pilot-Vehicle Interactions, National Academy of Sciences, Washington DC
Dismukes, R. K. and Berman, B. (2010). Checklists and monitoring in the cockpit: Why crucial defences sometimes fail. NASA/TM-2010-216396. NASA Ames Research Centre: Moffett Field, CA.
Endsley, M.R. (1988). Situation awareness global assessment technique (SAGAT). Proceedings of the National Aerospace and Electronics Conference (NAECON), 789–795.
Etkin, B 1972, Dynamics of Atmospheric Flight, John Wiley & Sons, New York.
Field, E. and Harris, D. (1998) A comparative survey of the utility of cross-cockpit linkages and autoflight systems’ backfeed to the control inceptors of commercial aircraft, Ergonomics, 41:10, 1462-1477
Kahneman, D. (2011). Thinking, fast and slow. New York: Farrar, Strauss and Giroux.
Klein, G. (1999). Sources of power: How people make decisions. Cambridge, MA: MIT Press.
NTSB investigation report AAR-07-05, Attempted Takeoff From Wrong Runway Comair Flight 5191 Bombardier CL-600-2B19, N431CA. 26 July 2007. Available on the NTSB website at: www.ntsb.gov
NTSB investigation report AAR-10-01, Loss of Control on Approach, Colgan Air, Inc., Operating as Continental Connection Flight 3407, Bombardier DHC 8 400, N200WQ. 2 February 2010. Available on the NTSB website at: www.ntsb.gov
Patterson, R., Fournier, L., Pierce, B., Winterbottom, M., and Tripp, L. (2009). Modelling the dynamics of recognition-primed decision making. Proceedings of NDM9, the 9th International Conference on Naturalistic Decision Making, London, UK, June 2009.
Reason, J 1997 Managing the Risks of Organisational Accidents. Ashgate Publishing Limited, Aldershot.
Stefanics, G., Hangya, B., Hernadi, I., Winkler, I., Lakatos, P., & Ulbert, I. (2010). Phase entrainment of human delta oscillations can mediate the effects of expectation on reaction speed. Journal of Neuroscience. 2010 October 13; 30(41): 13578-13585. Doi:10.1523/JNEUROSCI.0703-10.2010.
United Kingdom Civil Aviation Authority. (2013). Monitoring matters: Guidance on the development of pilot monitoring skills. Loss of control action group. CAA Paper 2013/02. p.9
United States National Transportation Safety Board investigation into the 25 December 2009 jamming of pitch control in ATR 72-212A, N494AE, operated by Executive Airlines, Inc. as Eagle Flight 4756. Available on www.ntsb.gov, reference CEN10IA084.
Weir, D & Phatak, A 1967, Model of Human Operator Response to Step Transitions in Controlled Element Dynamics, National Aeronautics and Space Administration
Under Part 4, Division 2 (Investigation Reports), Section 26 of the Transport Safety Investigation Act 2003 (the Act), the Australian Transport Safety Bureau (ATSB) may provide a draft report, on a confidential basis, to any person whom the ATSB considers appropriate. Section 26 (1) (a) of the Act allows a person receiving a draft report to make submissions to the ATSB about the draft report.
A draft of this report was provided to Virgin Australia Regional Airlines, Virgin Australia, the captain of VH-FVR, the first officer of VH-FVR, Toll Aviation, the senior base engineer and two LAMEs, ATR Aircraft, the Civil Aviation Safety Authority, the European Aviation Safety Agency, and the French Bureau d’Enquêtes et d’Analyses (BEA).
Submissions were received from Virgin Australia (incorporating Virgin Australia Regional Airlines), Toll Aviation, the senior base engineer, ATR Aircraft, the Civil Aviation Safety Authority, the European Aviation Safety Agency, and the BEA. The ATSB considered these submissions and amended the text of the draft report according to the evidence referenced in the submissions.
Given the complexity and implications of the technical issues discussed in the report, the ATSB provided the Bureau d’Enquêtes et d’Analyses and ATR Aircraft with opportunities for further review and comment of the final report. The ATSB received and considered comments on the final report, including a request by the BEA for comments to be appended to the final report in accordance with section 6.3 of Annex 13 to the Convention on International Civil Aviation. In response, the ATSB made minor amendments to the text of the final report and included BEA comments in Appendix D.
Appendices
Appendix A – Transient response of a simple dynamic system
This appendix provides a brief overview of the characteristic transient responses of a simple dynamic system. Although the pitch control system in the ATR 72 is more complex than the example presented, the characteristic responses of the systems are qualitatively applicable to more complex systems.
A simple mechanical system consisting of the mass supported by a spring is shown below (Figure A1). If no force is applied, the position that the mass is at will be considered the normal resting position. However, if a force is applied to the mass, the position of the mass will change, albeit not instantaneously. There will also be a period of time that the mass will be in motion. The motion of the mass during this time is referred to as the transient response of the system.
Figure A1: Simple mass supported from a spring that is acted upon by a force
The final condition of the mass after the transient movement has ceased is referred to as the ‘steady-state’ condition.
The manner in which the system responds before reaching the steady-state condition depends on the input force, the mass, the spring stiffness and the damping in the system. Damping is a force that resists motion and is typically proportional to the speed. Damping can be either specially designed as part of the system, such as a shock absorber in a car’s suspension, or may be from characteristics inherent in the system, such as friction or aerodynamic drag.
A common way of examining the system response is to determine how the system will respond to specific simple inputs. A typical input used in the study of dynamic systems is the step input.[117] The relative magnitude of the damping in the system results in characteristic transient responses to the step input.
If there is no damping, the mass will endlessly oscillate without ever settling to a steady-state, as shown in Figure A2. The magnitude and frequency of the oscillation are functions of the mass and spring stiffness.
Figure A2: Response of a simple mass-spring system (green trace) to a step input (black trace) with no damping. Note that the system will continue to oscillate without settling to a steady-state.
Source: ATSB
When some damping is added to the system, the oscillation reduces over time and the mass will eventually settle to a new steady-state position as shown in Figure A3. This characteristic response is referred to as an under‑damped system. A key feature of this response is that the system will initially overshoot the steady‑state value.
Figure A3: Characteristic response of an underdamped simple mass-spring system (green trace) to a step input (black trace). Note that the system will oscillate, but the magnitude of the oscillation will decrease over time until the system reaches a steady state value.
Source: ATSB
Increasing the damping will reduce the amount of overshoot and oscillation before reaching the steady-state; however, the initial response will be slower. If the damping is sufficiently large, there will be a point where there is no oscillation within the system. The minimum amount of damping that results in no overshoot is called the critical damping. Further damping will display a similar response, but will slow the response and increase the time that it takes to reach the steady-state position. The characteristic response of a critically, or overdamped system is shown in Figure A4.
Figure A4: Characteristic response of an overdamped simple mass-spring system (green trace) to a step input (black trace). Note that there is no oscillation and the system does not overshoot the steady‑state value.
Source: ATSB
Appendix B – Qualitative assessment of the pitch disconnect event
In order to assess the flight crew’s control inputs, the following qualitative engineering assessment of the pitch control system loads during the short time period around the pitch disconnect is presented.
This assessment is based upon the data retrieved from the flight data recorder on VH-FVR. The parameters examined in detail include the control column position, the elevator position and the pitch axis effort for both the captain’s (left) and first officer’s (right) sides. Of particular importance in this analysis, is the pitch axis effort parameter. This parameter was calculated from the force measured in a dynamometric rod, located between the base of the control column and the control cables in the pitch control system[118] and, as such, the parameter recorded the force being transmitted through the pitch axis control system.
As a result of the location of the pitch axis effort measurement, the parameter does not differentiate between a force intentionally applied by a pilot in order to alter the pitch angle of the aircraft and an external force, such as a gust, being applied to the pilot through the pitch control system. For example, if a pilot pulled back on the control column in order to pitch the aircraft up, a pitch axis effort would be recorded and it would be considered as an intentional pilot input (Figure B1). However, if an external load occurred at the same time as that pilot input, the recorded pitch axis effort measurement would be different due to the addition of the external load (Figure B2). The ATSB does not consider that the additional pitch axis effort measurement to be an intentional ‘pilot input’. Consequently, for this analysis, the ATSB considered ‘pilot input’ to be the intentional application of a force into the control column to change the state of the aircraft. These are forces that are within the control of the pilot.[119]
In addition, in highly dynamic situations, the load measured within the pitch control system may not accurately reflect the load at the control column grips due to the inertia of control system elements such as the control column. When there is a rapid change in the control system loads, this inertia will resist the movement of control elements with significant mass, resulting in a system tension that is higher than in a static, or quasistatic situation. The loads observed during the pitch disconnect event were changing quite rapidly, so there would have been an inertial effect included in the measured pitch axis effort loads. Without detailed knowledge of the system masses, the magnitude of the inertial effect cannot be calculated and are not included in this assessment.
Figure B1: Definition of pilot input. The pilot makes an intentional control input by applying a force to the control column and changing its position in order to move the control surface. This results in a pitch axis effort being measured by the dynamometric rod.
Source: ATSB
Figure B2: An example of a load in the control system from an environmental source such as a gust. This will add to the pitch axis effort reading from the dynamometric rod, which no longer represents the intended pilot input
Source: ATSB
About 2.5 seconds before the pitch disconnect event, a small pitch axis effort was recorded on the captain’s side. The captain’s pitch axis effort remained fairly low until about 1 second before the pitch disconnect when both the captain and first officer made nose-up pitch inputs. The following examines the recorded data over a 2-second timeframe, which contains the pitch disconnect, in order to analyse the crew’s inputs.
Within that 2-seconds, the ATSB identified five distinct periods that help to describe what occurred and how the dual control inputs influenced the occurrence. Those periods, identified as A, B, C, D and E are examined in detail below.
Period A
The highlighted area in Figure B3 shows the recorded pitch axis effort, elevator deflection and control column deflection for both the captain and first officer over this period. The duration of this period is about 0.5 seconds.
Figure B3: Period A – The graph shows that the recorded pitch axis effort on both the captain and the first officer sides was from nose-up control column inputs by both pilots.
Source: ATSB
The maximum effort on the captain’s side during this period was about 45 daN (450 N, or 46 kg of force) and the first officer’s side was about 27 daN. The respective nose-up control column movement indicates that the pitch axis effort was a result of both flight crew making inputs into the pitch system in order to raise the nose and slow the aircraft.
At this stage, the elevators were still coupled together, so the aerodynamic load generated by the elevator deflections was shared between the relative inputs made by the captain and the first officer.
Period B
This period covers the time from when the first officer reversed their control input to the captain’s pitch axis effort reaching a maximum value and had a duration of about 0.2 seconds (Figure B4).
Figure B4: Period B – The captain’s side pitch axis effort increased while the first officer’s decreased. The captain’s control column movement was relatively small during this large increase in pitch axis effort.
Source: ATSB
The first officer reduced the nose-up input on their control column, while the captain control column moved slightly further back. The increased control position was only slightly more than the position that resulted in a peak pitch axis effort of about 45 daN; however, the pitch axis effort continued to rise, even after the control column position remained steady. This was likely because, as the first officer reduced their input, the elevators remained deflected and the first officer’s share of the aerodynamic loads was transferred to the captain’s side.
Thus, although the pitch axis effort recorded on the captain’s side reached a maximum of about 67 daN, the captain did not make an intentional control input that, in itself, should have resulted in such a load. It is difficult to determine exactly what level of control input effort the captain intended to make; however, given that the control column position remained effectively constant during this period,[120] the intended input was probably that which resulted in a pitch axis effort of about 45 daN. The rapid increase in the recorded pitch axis effort up to 67 daN was likely felt as a short duration (less than 0.2 seconds) increase in the resistance on the controls. This corresponds to the ‘jolt’ through the controls reported by the captain, rather than something that the captain had to intentionally restrain.
Period C
This period covers the time from when the captain’s pitch axis effort reached its maximum value until there were the first definite signs that the PUM had activated, separating the left and right pitch channels and has a duration of about 0.15 seconds (Figure B5).
Figure B5: Period C – During activation of the PUM, the elevators start to diverge, while the captain’s input remained constant and the first officer’s input became nose-down.
Source: ATSB
The pitch axis effort recorded on the captain’s side plateaued at about 67 daN and the first officer’s changed from positive to negative, indicating that he had started to apply a nose-down load on the controls.
As the difference between the captain’s and the first officer’s pitch axis effort values increased, the left and right elevators began to diverge.[121] When the pitch uncoupling mechanism (PUM) activated, the left and right elevators deflected in opposite directions at a significant rate.
In the instant following separation of the controls, both elevators were positioned trailing edge upwards, generating an aerodynamic load on the surfaces that acted in a manner to reduce the deflection. At that time, the captain was applying a nose-up input, which was in opposition to the aerodynamic load, whereas the nose-down control input from the first officer added to the aerodynamic force on the left elevator.
Initially, the change in the left elevator load increased the restoring aerodynamic force, whereas on the right, the initial movement reduced the restoring force. As such, there was an increase in the resistance to movement on the left elevator, whereas there was a lessening resistance to movement on the right side. The unbalanced loads on the elevators resulted in them accelerating away from their pre‑separation positions.
Period D
This period covered the time from separation of the controls until the elevator reached their maximum deflections and has a duration of about 0.125 seconds (Figure B6).
Figure B6: Period D – After activation of the PUM, the elevators moved in opposite directions. The captain’s and first officer’s controls also moved in response to the change in the loads resisting the flight crew’s input.
Source: ATSB
When the PUM activated, the aerodynamic load from the elevators acting through the left control channel would have been halved. Consequently, the pitch axis effort on the captain’s side decreased during this period, even though there was a small increase in the control column position.
However, the pitch axis effort on the first officer’s side levelled off at about -21 daN while the control column and right elevator deflections continued to increase. This was likely because while the first officer continued to push on the control column with the same force, the elevator was accelerating away from the pre-disconnect position due to the combined control and aerodynamic loads. The control column was essentially following the elevator as it moved, rather than driving the elevator to a new position.
At some point during the movement of the right elevator, the aerodynamic loads changed direction and opposed the continued movement. As the elevator deflected further, those loads increased until they were of such a magnitude that they overcame the control input and the elevator’s inertia.[122] When the maximum elevator deflection was reached, the right elevator was at about 10° and the first officer’s control column at about 8°.
Given that the normal maximum nose-down control column position is 6.75° and the control column stop is at 8.75°, the first officer’s control column could be considered to be fully forward at this point. During the ground testing carried out by the ATSB following the occurrence, it was noted that the arms of the person actioning the controls in the first officer’s position had their arms fully outstretched when they were holding the controls in the forward position (refer to still image in Figure 47 taken from the video of that testing). Thus it is likely that the first officer’s arms were also fully outstretched when the control column reached its maximum deflection.
Period E
This period covers the time from the elevators reaching their maximum deflection until the captain and first officer returned their controls to a neutral position and has a duration of about 1.2 seconds (Figure B7).
Figure B7: Period E – After the elevators reached their maximum deflections, the captain’s control is returned to neutral and the first officer’s was held at the position reached after the pitch disconnect.
Source: ATSB
Within about 0.2 seconds after the pitch disconnect, the captain’s control column is moved forward, reducing the commanded input. Given how quickly this occurred in the context of human reaction time, it is unlikely to have been a conscious reaction to an unexpected pitch disconnect. It may have been an unconscious response to the change in the control feel, or an action that the captain was already in the process of performing, such as reducing the load factor, when the pitch disconnect occurred.
When the right elevator reached the maximum deflection, there was no inertia remaining, so the only loads were the aerodynamic load and the loads through the control column. The near linear increase in the pitch axis effort after the maximum control column deflection was reached is consistent with the aerodynamic load on the elevators being taken up by the flexibility in the system while the control column was held in position. This is consistent with the first officer’s arms being outstretched, momentarily preventing the control column from returning to a neutral position, that would otherwise have relieved the load in the system.
Once the maximum control column deflection was reached, it was held in that position for approximately 1 second before the first officer allowed the control column to return to a more neutral position. A 1-second delay is not inconsistent with normal human reaction times.
Conclusions
Although large pitch axis effort values were recorded during the pitch disconnect event, those values represented the result from both aerodynamic and crew input forces. Therefore, they were not necessarily a reflection of the flight crew control inputs during the event.
The peak value of 67 daN recorded on the captain’s side occurred before the pitch disconnect and was attributable to the first officer’s share of the elevator load being transferred to the captain’s side as the first officer moved their control forward. Changes in control column position indicated that the captain was making an input of about 45 daN, prior to the load rapidly increasing to the peak value over a very short period of time. This was probably felt as a jolt through the controls, not unlike the effect of a sharp gust load on the elevator.
At the same time, due to flexibility in the control system, the first officer probably felt the control column returning to the neutral position before a 21 daN nose-down input was made. The peak value of about 60 daN recorded on the first officer’s side occurred after the pitch disconnect and was likely a result of the elevators reaching their maximum deflection as the first officer’s arms straightened. The straightened arms would have resulted in the aerodynamic loads pushing back on the first officer’s arms through the control column. The time taken for the first officer to return their controls to the neutral position, and thereby relieving the load, is consistent with him recognising the situation and reacting.
An alternative hypothesis was that the load though the first officer’s controls was an instinctive response to lower the nose as the aircraft pitched up, reaching the peak load factor at about the same time that his nose-down load was applied. However, no sounds were captured on the CVR that would be associated with exertion to indicate the first officer was pushing with the equivalent of about 61 kg. Nor were there any discussions regarding control loads captured on the CVR, to indicate that he was aware of applying such loads. This would suggest that there was little effort required to sustain 60 daN for about 1 second. Thus, it is more likely that the first officer’s arms were locked straight, preventing the control column from returning under the applied loads.
While acknowledging the pitch disconnect occurred as a result of opposing dual inputs, the peak loads occurred at different times, and when the captain’s side recorded the peak load, the first officer’s side was relatively low. Additionally, there is no indication that the magnitude of the peak pitch axis effort values recorded during the pitch disconnect were solely the result of intentional flight crew control inputs.
Appendix C – Assessment of flexibility on the relationship between the control column position and elevator deflection
Appendix D – Comments from French Accredited Representative
The French Accredited Representative, Bureau d'Enquêtes et d'Analyses (BEA) has made the following comments on the investigation conducted by the Australian Transport Safety Bureau. The following document is appended to the report in accordance with section 6.3 of Annex 13 to the Convention on International Civil Aviation.
Purpose of safety investigations & publishing information
Purpose of safety investigations
The objective of a safety investigation is to enhance transport safety. This is done through:
identifying safety issues and facilitating safety action to address those issues
providing information about occurrences and their associated safety factors to facilitate learning within the transport industry.
It is not a function of the ATSB to apportion blame or provide a means for determining liability. At the same time, an investigation report must include factual material of sufficient weight to support the analysis and findings. At all times the ATSB endeavours to balance the use of material that could imply adverse comment with the need to properly explain what happened, and why, in a fair and unbiased manner. The ATSB does not investigate for the purpose of taking administrative, regulatory or criminal action.
Terminology
An explanation of terminology used in ATSB investigation reports is available here. This includes terms such as occurrence, contributing factor, other factor that increased risk, and safety issue.
Publishing information
Released in accordance with section 25 of the Transport Safety Investigation Act 2003
Ownership of intellectual property rights in this publication
Unless otherwise noted, copyright (and any other intellectual property rights, if any) in this report publication is owned by the Commonwealth of Australia.
Creative Commons licence
With the exception of the Coat of Arms, ATSB logo, and photos and graphics in which a third party holds copyright, this publication is licensed under a Creative Commons Attribution 3.0 Australia licence.
Creative Commons Attribution 3.0 Australia Licence is a standard form licence agreement that allows you to copy, distribute, transmit and adapt this publication provided that you attribute the work.
The ATSB’s preference is that you attribute this publication (and any material sourced from it) using the following wording: Source: Australian Transport Safety Bureau
Copyright in material obtained from other agencies, private individuals or organisations, belongs to those agencies, individuals or organisations. Where you wish to use their material, you will need to contact them directly.
Interim report 2
Second interim report released 5 May 2017
This interim report details factual information established in the investigation’s evidence collection phase and has been prepared to provide timely information to the industry and public. Interim reports contain no analysis or findings, which will be detailed in the investigation’s final report. The information contained in this interim report is released in accordance with section 25 of the Transport Safety Investigation Act 2003.
On 20 February 2014, a Virgin Australia Regional Airlines (VARA) ATR 72 aircraft, registered VH‑FVR, operating on a scheduled passenger flight from Canberra, Australian Capital Territory to Sydney, New South Wales sustained a pitch disconnect while on descent into Sydney. The pitch disconnect occurred while the crew were attempting to prevent the airspeed from exceeding the maximum permitted airspeed (VMO). The aircraft was significantly damaged during the occurrence.
In accordance with the Transport Safety Investigation Act 2003 (the Act), the ATSB initiated an investigation into the occurrence. On 15 June 2016 the ATSB released its first interim investigation report that contained the following safety issue:
Inadvertent[1] application of opposing pitch control inputs by flight crew can activate the pitch uncoupling mechanism which, in certain high-energy situations, can result in catastrophic damage to the aircraft structure before crews are able to react.
In the interest of transport safety, this safety issue was brought to the attention of the aircraft manufacturer (ATR) and the wider aviation industry prior to completion of the investigation.
During the continued investigation of the occurrence, the ATSB has obtained an increased understanding of the factors behind this previously identified safety issue. This increased understanding has identified that there are transient elevator deflections during a pitch disconnect event that could lead to aerodynamic loads that could exceed the strength of the aircraft structure.
The ATSB also found that these transient elevator deflections were not identified, and therefore not considered in the engineering justification documents completed during the aircraft type’s original certification process. The ATSB considers that the potential consequences are sufficiently important to release a further interim report prior to completion of the final investigation report.
This second interim report expands on information already provided in, and should be read in conjunction with, the interim report released on 15 June 2016 report and an update on the ATSB website on 10 June 2014.[2] It is released in accordance with section 25 of the Act and relates to the ongoing investigation of the occurrence.
Readers are cautioned that the factual information and analysis presented in this interim report pertains only to the safety issue discussed herein. The final report will contain information on many other facets of the investigation, including the operational, maintenance, training and regulatory aspects.
Readers are also cautioned that new evidence may become available as the investigation progresses that will enhance the ATSB’s understanding of the occurrence. However, in order to ensure the veracity of the analysis of the evidence leading to the identified safety issue, the ATSB engaged the UK Air Accidents Investigation Branch (AAIB) to conduct a peer review. The AAIB conducted an analysis of the evidence relating to the safety issue and concluded that their findings were consistent with those provided by the ATSB.
Purpose of safety investigations
The objective of a safety investigation is to enhance transport safety. This is done through:
identifying safety issues and facilitating safety action to address those issues
providing information about occurrences and their associated safety factors to facilitate learning within the transport industry.
It is not a function of the ATSB to apportion blame or provide a means for determining liability. At the same time, an investigation report must include factual material of sufficient weight to support the analysis and findings. At all times the ATSB endeavours to balance the use of material that could imply adverse comment with the need to properly explain what happened, and why, in a fair and unbiased manner. The ATSB does not investigate for the purpose of taking administrative, regulatory or criminal action.
Terminology
An explanation of terminology used in ATSB investigation reports is available here. This includes terms such as occurrence, contributing factor, other factor that increased risk, and safety issue.
Publishing information
Released in accordance with section 25 of the Transport Safety Investigation Act 2003
Ownership of intellectual property rights in this publication
Unless otherwise noted, copyright (and any other intellectual property rights, if any) in this report publication is owned by the Commonwealth of Australia.
Creative Commons licence
With the exception of the Coat of Arms, ATSB logo, and photos and graphics in which a third party holds copyright, this publication is licensed under a Creative Commons Attribution 3.0 Australia licence.
Creative Commons Attribution 3.0 Australia Licence is a standard form licence agreement that allows you to copy, distribute, transmit and adapt this publication provided that you attribute the work.
The ATSB’s preference is that you attribute this publication (and any material sourced from it) using the following wording: Source: Australian Transport Safety Bureau
Copyright in material obtained from other agencies, private individuals or organisations, belongs to those agencies, individuals or organisations. Where you wish to use their material, you will need to contact them directly.
It has previously been identified that the pitch disconnect event on VH-FVR was a result of simultaneous uncoordinated control inputs that led to opposing loads on the controls. It was also identified that such inputs, although not part of normal procedures, could be hazardous to the operation of the aircraft. In the interim report released on 15 June 2016, the ATSB indicated that the existing procedural risk controls alone may not be sufficient to prevent this type of occurrence and as such, the ATSB were:
…investigating whether the design of the pitch control and associated warning systems increases the likelihood of potentially catastrophic damage occurring when flight crew inadvertently make opposing control inputs.
As a result of that further investigation, the ATSB has obtained an enhanced understanding of the dynamics of the pitch control system during a pitch disconnect event and identified an additional safety factor that relates to the potential loads generated during such an event.
The design of the pitch control system is such that the crew is required to apply a load to the control column in order to separate the left and right pitch control systems in the event of a jam. The ATSB has identified that this has three effects on the controls during a pitch disconnect event,
rebalancing of the loads in the system following activation of the pitch uncoupling mechanism (PUM)
dynamic transient elevator deflections in the short period after activation of the PUM
unavoidable movement of the control column(s) following activation of the PUM.
The first two of these effects are a consequence of the flexibility within the control system and the PUM being located between the elevators.
Each of these effects may contribute to elevator deflections greater than the aircraft manufacturer considered during the design and certification of the aircraft.
Effect of the flexibility in the pitch control system
Simplified model of the pitch control system
The flexibility in the pitch control system acts like a spring which stores potential energy within the system when a tension load is applied. Although the pitch control system consists of a relatively complex arrangement of push-pull rods, bellcranks, pulleys and cables connecting the control columns to the elevators, the system can be represented as the simplified system shown in Figure 4. Although not detailed in the figure, the design of the system is such that a tension is generated within the control cables regardless of whether the controls are pushed or pulled. The manufacturer advised that the flexibility is primarily within the control cables, so for the purposes of the simplification the flexibility of the entire system is represented as a spring within the control cables.
Figure 4: Simplified model of the pitch control system with the flexibility in each channel being represented as a spring in the control cables
Source: ATSB
In considering the behaviour of this system, this representation can be further simplified to one channel of the pitch control system (Figure 5). In this simplified representation, when the control column is pulled back an upward deflection of the elevator will result. This elevator deflection generates an aerodynamic load that acts in the direction opposite the deflection. The opposing forces between the control column and the aerodynamic load on the elevator will result in a tension in the system. Because the system acts like a spring, it will stretch under this tension.
Figure 5: Simplified model of one pitch control system channel showing the generalised balance of loads in the system
Source: ATSB
Control deflections from rebalancing of the loads after a pitch disconnect
In normal operation, when there is only one pilot on the controls and there are no jams, the load on the control column is balanced by the resulting aerodynamic load on both elevators. The torque between the elevators required to activate the PUM has been designed to be high enough that the torque generated by one elevator is not sufficient to activate the PUM during standard manoeuvres throughout the flight envelope. However, if there is a jam in the system, or there are opposing dual control inputs, the load applied to the control column is also counteracted by the jam, or the load from the other control column input. In the case of a jam, the response of the system will differ depending upon where the jam is located.
If the jam is located at, or close to, the elevators, forces applied to the control columns (control input) will result in a tension in the system, but there will be effectively no movement of the elevators while the pitch uncoupling mechanism (PUM) is connected (Figure 6). When the PUM activates, the jammed elevator will remain in the same position, but the elevator of the unjammed side is free to move.
Figure 6: Simplified model of the pitch control system with a jam at, or close to, the right elevator.
Source: ATSB
If the jam is at, or close to, a control column (Figure 7), input to the free control column can result in some elevator deflection because of the flexibility in the system. This deflection will result in an aerodynamic load in a direction opposite to the deflection, but it will also generate a tension in the control system between the elevators and the jammed control column. After the activation of the PUM, the non-jammed control channel is free to move. However, unlike the case where the jam is at the elevator, the elevator of the jammed channel still has some movement as a result of the system flexibility.
Figure 7: Simplified model of the pitch control system with a jam at control column
Source: ATSB
In the case of no jam, but opposing dual control inputs, the system will act in a manner similar to a jam at a control column; however, both control channels have full movement following PUM activation. The following discussion does not consider the effect of the unavoidable movement of the control columns following activation of the PUM. This effect will be examined separately.
When the PUM activates, the position of the elevators will be changed without further movement of the control columns because of the rebalancing of the loads and tensions in the system. This is described in detail below.
Figure 8 represents how one pitch control channel changes in response to a pitch disconnect. The case examined represents the case of a jam at one control column, or opposing dual control inputs. The behaviour presented assumes that the control column has been moved to the position at which the PUM is activated, but does not move following the pitch disconnect. Only one pitch channel is shown; however, due to the balance in the system, the other channel will behave in a similar manner, but in the opposite direction.
The instant before a pitch disconnect occurs ①, the PUM has not been activated and the left and right elevators are connected. The control load input through one system is balanced by the aerodynamic load from both the left and right elevators and the tension generated in the other pitch channel (Figure 7). Because of the inherent flexibility, the system between the control column and elevator has been stretched.
At the instant that the PUM activates ②, the left and right systems separate and each channel is only reacting the aerodynamic load from one elevator. The loads in the system are no longer balanced, so the tension in the control system will act to reduce the stretch in the system and the elevator will tend to move up.
The contraction of the system will increase the deflection of the elevator until the aerodynamic load on the elevator balances the load on the control column ③. The new deflection will be larger than the position just before the pitch disconnect.
Figure 8: Behaviour of the pitch control system during a pitch disconnect shown just before the pitch disconnect ①, the instant of the pitch disconnect ②, and at a time after the pitch disconnect when the loads have balanced ③. Note, this assumes that the control column is held in position following the pitch disconnect.
Source: ATSB
In the case where the jam occurs at, or close to, the elevator, the elevator will not move until the PUM activates, but tension will build up in the control system and it will stretch. When the PUM activates, the control system on the free elevator channel will contract and the elevator will move to a new position where the loads are balanced.
This is the case that the manufacturer assessed during the investigation in response to ATSB questions. The results of the calculations carried out by the manufacturer suggest that the effect of the elevator movement following a pitch disconnect would not be a hazard because the expected difference in elevator deflections at the maximum operating speed is 8.5°, which is less than the ultimate load case of 15.6° at the same speed. However, this is only one effect that results in elevator deflections following a pitch disconnect event. This effect also provides the driving force that results in a dynamic transient behaviour.
Dynamic transient elevator deflections
Because the pitch control system is made up of components that contain mass, it is not possible for the elevators to move from one position to another instantaneously. There will a period of time during which the elevator is transitioning from the initial position to the final position. The behaviour of the system during this time period is a complex combination of the system’s mass distribution, stiffness and damping;[11] however, there are certain characteristic responses that can be observed in such transient dynamic systems.
As previously described, the ATR 72 pitch control system has an inherent flexibility that results in it acting like a spring. In addition, the aerodynamic loads on the elevators act in the opposite direction to the deflection and increase in magnitude with an increase in the deflection, thus also acting like a spring.[12]
By design, friction in the flight control system is minimised, hence there may be little damping from system friction. However, the aerodynamics of rapidly deflecting an elevator will provide damping to the system.[13]
Review of the certification flight test data and the data recorded on the occurrence flight indicated that the system had an oscillatory response consistent with an underdamped system.[14] An important characteristic of an underdamped system is that there is an overshooting of the steady‑state, before settling to the final value. Thus, when the elevators move to a new position following activation of the PUM, it is likely that they will overshoot the steady-state deflection, generating greater aerodynamic loads on the horizontal stabiliser than the steady-state situation would suggest. The degree of overshoot has not been determined as part of this investigation and would require significant engineering analysis to quantify the effect over the complete operating envelope.
Unavoidable control column movement following activation of the pitch uncoupling mechanism
As previously stated, to activate the PUM and separate the left and right pitch control channels, a significant load needs to be applied to the control column(s). The analysis presented in this report has also shown that when the PUM activates, there is a sudden change in the force balance within the system that results in movement of the elevators without any additional control column movement. However, this sudden imbalance will also result in unavoidable movement of the control column.
When the PUM activates and the load through the pitch channel decreases to only the aerodynamic load from one elevator, the excess load applied to the control column is no longer balanced and as a result will accelerate in the direction of the applied force. This movement will increase the tendency for the elevator to move from the position it was in before the pitch disconnect, further increasing the aerodynamic loads on the horizontal stabiliser.
The amount of control column movement after activation of the PUM may be affected by a number of factors, including the flight crew’s expectation for a pitch disconnect and the airspeed.
An important factor in the amount of control movement is the expectation that the flight crew has of an impending pitch disconnect. The more that a response to a predictable stimulus is anticipated, the faster the reaction will be to that stimulus.[15] Hence, if the flight crew are not expecting a pitch disconnect, the time to recognise the change in the control column force and consequently movement may be greater than if it is expected.
During the certification flight testing, the aircraft was being operated by professional test personnel with the intention of activating the PUM to separate the left and right pitch control channels. Thus, they were in a situation where they had an expectation of a pitch disconnect, yet the left control column was moved about 5° after the pitch disconnect.
However, during the VH-FVR pitch disconnect occurrence, the flight crew were attempting to prevent an exceedance of the maximum operating speed. Therefore, it is very unlikely that they were expecting a pitch disconnect and, as such, it is reasonable to expect greater movement of the control column than had they been anticipating it.
Another factor that may affect the amount of control column movement following a pitch disconnect is the aerodynamic loads on the elevators. At higher airspeeds, the aerodynamic load per degree of elevator deflection is greater. Consequently, the force resisting the control column movement due to the aerodynamic load on the elevators is greater. Therefore, the expected elevator and corresponding control column movements, would be expected to be less at higher airspeeds. However, at higher airspeeds, the resulting aerodynamic load on the horizontal stabiliser may not be smaller as a result of the reduced elevator deflection. The investigation has not determined the relative effects of these and quantifying this effect would require significant engineering analysis.
Manufacturer’s considerations during certification
The certification documents provided to the ATSB indicated that the aerodynamic loads on the horizontal stabiliser generated by the elevator deflections from a pitch disconnect had not been considered during the design and certification of the pitch control system in the ATR 72. However, the recorded data from the occurrence flight and a certification flight test show that there are elevator deflections during a pitch disconnect event. The only indication that the aircraft manufacturer had considered the effect of elevator deflections during a pitch disconnect event was in answer to questions posed by the ATSB; however, those calculations did not consider all the factors that affect the elevator deflections. There was no indication in the certification data that the manufacturer had identified the transient effects in the elevator system that result from a pitch disconnect and, as such, they were not considered.
The ATSB’s investigation identified that the dynamic transient elevator deflections and unavoidable control column movement will result in greater elevator deflections than those calculated by the manufacturer. Those deflections increase the aerodynamic loads generated by the horizontal stabiliser, and in turn the potential to overstress the structure.
During the intentional pitch disconnect done in preparation for the certification flight testing, the ultimate load was not exceeded. However, the elevator deflections encountered were only about 2° less than the ultimate load case. According to the manufacturer, a speed increase of only about 7 knots was required to reach the ultimate load with those elevator deflections.
During the VH-FVR occurrence, the resulting elevator deflections were sufficient to exceed the ultimate load by about 47 per cent. This indicates that there is potentially a speed below the maximum operating speed at which the ultimate load case can be exceeded during a pitch disconnect event.
Because there has been no detailed engineering to assess the transient elevator deflections and unavoidable control movements, there is no assurance that the aircraft has sufficient strength to sustain the aerodynamic loads generated by a pitch disconnect event at all speeds within the approved operating envelope.
While it is accepted that dual control inputs are not a normal piloting practice, it is considered by the ATSB to be a foreseeable error. Indeed this appears to have been considered by the manufacturer during certification; however, the resulting effect was categorised as ‘major’. Given the understanding of the effect of a pitch disconnect at that time, this categorisation was considered reasonable. However, an improved understanding of the transient elevator deflections that occur during a pitch disconnect, may conclude that a ‘major’ categorisation may no longer adequately estimate the hazard to the aircraft. For any categorisation more severe than major, neither the predicted nor the reassessed occurrence rate meet the accepted standard.
Appendix A – Transient response of a simple dynamic system
This appendix provides a brief overview of the characteristic transient responses of a simple dynamic system. Although the pitch control system in the ATR 72 is more complex than the example presented, the characteristic responses of the systems are qualitatively applicable to more complex systems.
A simple mechanical system consisting of the mass supported by a spring is shown below (Figure 9). If no force applied, the position that the mass is at will be considered the normal resting position. However, if a force is applied to the mass, the position of the mass will change, albeit not instantaneously. There will also be a period of time that the mass will be in motion. The motion of the mass during this time is referred to as the transient response of the system.
Figure 9: Simple mass supported from a spring that is acted upon by a force
The final condition of the mass after the transient movement has ceased is referred to as the ‘steady-state’ condition.
The manner in which the system responds before reaching the steady-state condition depends on the input force, the mass, the spring stiffness and the damping in the system. Damping is a force that resists motion and is typically proportional to the speed. Damping can be either specially designed as part of the system, such as a shock absorber in a car’s suspension, or may be from characteristics inherent in the system, such as friction or aerodynamic drag.
A common way of examining the system response is to determine how the system will respond to specific simple inputs. A typical input used in the study of dynamic systems is the step input.[16] The relative magnitude of the damping in the system results in characteristic transient responses to the step input.
If there is no damping, the mass will endlessly oscillate without ever settling to a steady-state, as shown in Figure 10. The magnitude and frequency of the oscillation are functions of the mass and spring stiffness.
Figure 10: Response of a simple mass-spring system (green trace) to a step input (black trace) with no damping. Note that the system will continue to oscillate without settling to a steady-state.
Source: ATSB
When some damping is added to the system, the oscillation reduces over time and the mass will eventually settle to a new steady-state position as shown in Figure 11. This characteristic response is referred to as an under‑damped system. A key feature of this response is that the system will initially overshoot the steady‑state value.
Figure 11: Characteristic response of an underdamped simple mass-spring system (green trace) to a step input (black trace). Note that the system will oscillate, but the magnitude of the oscillation will decrease over time until the system reaches a steady state value.
Source: ATSB
Increasing the damping will reduce the amount of overshoot and oscillation before reaching the steady-state; however, the initial response will be slower. If the damping is sufficiently large, there will be a point where there is no oscillation within the system. The minimum amount of damping that results in no overshoot is called the critical damping. Further damping will display a similar response, but will slow the response and increase the time that it takes to reach the steady-state position. The characteristic response of a critically, or overdamped system is shown in Figure 12.
Figure 12: Characteristic response of an overdamped simple mass-spring system (green trace) to a step input (black trace). Note that there is no oscillation and the system does not overshoot the steady‑state value.
On 15 June 2016 the ATSB released an interim investigation report that contained the following safety issue:
Inadvertent application of opposing pitch control inputs by flight crew can activate the pitch uncoupling mechanism which, in certain high-energy situations, can result in catastrophic damage to the aircraft structure before crews are able to react. [Safety issue]
While this issue focussed on the potential for catastrophic damage during inadvertent activation of the pitch uncoupling mechanism (PUM) from opposing dual control inputs, additional investigation has identified that the inherent behaviour of the elevator control system design could potentially result in an ultimate load exceedance from the deliberate activation of the PUM to overcome a jam. Based on the results of this additional investigation, the ATSB makes the following finding:
The aircraft manufacturer did not account for the transient elevator deflections that occur as a result of the system flexibility and control column input during a pitch disconnect event at all speeds within the flight envelope. As such, there is no assurance that the aircraft has sufficient strength to withstand the loads resulting from a pitch disconnect. [Safety issue]
Safety issue and actions
The safety issues identified during this investigation are listed in the Findings section of this report. The Australian Transport Safety Bureau (ATSB) expects that all safety issues identified by the investigation should be addressed by the relevant organisation(s). In addressing those issues, the ATSB prefers to encourage relevant organisation(s) to proactively initiate safety action, rather than to issue formal safety recommendations or safety advisory notices.
In this case, the ATSB has assessed that the risk posed by the safety issue is of sufficient magnitude to warrant the release of an additional interim report. This action provides the earliest opportunity for the relevant organisation to initiate proactive safety action, rather than wait for the final investigation report.
The safety actions presented in this section are only those that are directly related to the safety issue identified in this report. A number of other safety actions have been taken in response to the safety issue identified in the interim report released on 15 June 2016. The initial public version of these safety issues and actions are repeated separately on the ATSB website to facilitate monitoring by interested parties. Where relevant the safety issues and actions will be updated on the ATSB website as information comes to hand.
Consideration of transient elevator deflections from a pitch disconnect
Safety issue description:
The aircraft manufacturer did not account for the transient elevator deflections that occur as a result of the system flexibility and control column input during a pitch disconnect event at all speeds within the flight envelope. As such, there is no assurance that the aircraft has sufficient strength to withstand the loads resulting from a pitch disconnect.
Application of the safety issue to both ATR 42 and 72 models
Although the flight control system in the ATR 72 has been assessed in this report, the ATR 72 is a longer version of the ATR 42 and the design of the flight control system is common to both models. The different length of the control runs is likely to have an effect on the flexibility, but the uncertainty that results from the lack of detailed engineering assessment means that the safety issue also applies to the ATR 42 model.
Initial safety action taken by the ATSB
On 11 November 2016, the ATSB notified ATR of the concerns identified in this report. The ATSB also notified the Australian operator of the aircraft, the Civil Aviation Safety Authority and the Federal Department of Infrastructure and Regional Development.
The issue was further discussed with ATR at meetings on 18 November 2016 and 1 December 2016. The European Aviation Safety Agency was also present during those meetings.
Proactive safety action taken by ATR
On 1 December 2016, in response to the identified safety issue, ATR advised the ATSB that they intended to:
perform a risk assessment to determine the short term risks associated with continued operation
conduct a detailed engineering analysis of the transient elevator loads during a pitch disconnect.
Short term risk assessment
On 15 December 2016, ATR provided the ATSB with the results of their assessment of the short term risks of continued operation awaiting the complete engineering work associated with the issue. Their assessment concluded that:
ATR considers that continued safe operation is ensured by considering
• In the jamming situation, the ultimate loads cannot be exceeded through the control column input (excessive effort and mechanical stops). At high speed, the differential elevator deflection has margin to accommodate the transient load.
• The probability of a repeat occurrence of the MSN1058 [VH-FVR] event defeating all the barriers inherent in the design and standard operating procedures.
• The quantitative analysis results showing no immediate action is required.
Detailed engineering analysis of transient elevator deflections
On 11 April 2017, ATR provided the ATSB with an update on the detailed engineering analysis of the transient elevator loads. The briefing included an overview of the analysis methodology and preliminary results.
The analysis being conducted is based upon an analytical model supported by both ground and flight testing. The analytical model represents the ATR pitch control system and has system component masses and stiffness represented as group blocks. This includes a block representing the pitch uncoupling mechanism (PUM), which was modelled to represent the behaviour of the PUM before, during and after activation.
ATR has compared the model to the behaviour of the system recorded during ground test and has identified a favourable correlation. The results of the model showed that, following activation of the PUM on the ground, without aerodynamic loads, the flight control system responded in an underdamped oscillatory manner.
For analysis of the inflight situation, ATR has used the aerodynamic model that was developed during certification. Preliminary results for the jamming scenarios was provided. Those results showed that the inflight system response is also that of an underdamped oscillatory system. It also indicates that the magnitude of the system response is dependent upon the pilot input to the control column, and how quickly the flight crew respond to PUM activation. The system has margin for jams at the elevator. ATR are continuing the analysis of jams at the control column.
ATR are continuing with the detailed analysis. Further work includes:
Flight testing to determine a suitably realistic pilot response to activation of the PUM
Verification of the analytical model with data recorded during the flight tests
Modelling of the dual input case
Modelling of other cases required by the European Aviation Safety Agency.
ATSB comment/action in response
The ATSB acknowledges the efforts of ATR to resolve the safety issue. The ATSB also notes that, while the short‑term risk assessment does not account for the transient elevator deflections associated with a pitch disconnect, until the results of the detailed engineering analysis are available it is not possible to accurately quantify the transient elevator loads. Consequently, it is not possible to fully determine the magnitude of the risk associated with continued operation of ATR42/72 aircraft until the engineering analysis is complete.
Noting the above, the ATSB’s retains a level of ongoing concern as to whether the aircraft has sufficient strength to withstand the loads resulting from a pitch disconnect. Consequently, while the ATSB accepts that the current level of safety action partially addresses the safety issue; the ATSB makes the following safety recommendations.
According to the aircraft documentation, the elevator deflection limits are 23° nose up to 13° nose down and the corresponding control column deflections are 11.25° nose up to 6.75° nose down.[3] Thus, the control column deflections are amplified by the pitch control system to result in elevator deflections about twice that of the control columns (a control column to elevator deflection ratio of about 1 to 2). That is, when the flight control column is deflected by 1°, the elevators deflect by 2°. However, it was noted that this control deflection ratio varied from this value during the flight. This was particularly noticeable in the immediate lead-up to the pitch disconnect event, where the ratio dropped below 1 to 1.
This change in the control deflection ratio was identified as being due to inherent flexibility in the control system. This flexibility means that the relationship between the elevator position and the control column position is modified by the force on the control column (the ‘pitch axis effort’) and the stiffness of the system. The result is, that the higher the force required to move the controls, the less that the elevators will move for a given control column movement.
The manufacturer reported that the cables in the pitch control system were primarily responsible for the flexibility. The cables extend from the control columns to the rear fuselage at the base of the vertical stabiliser. The remainder of the pitch control system running up the vertical stabiliser and back to the elevators is made up of push-pull rods, which are much stiffer.
In addition to the effect on the control column-elevator relationship, the control system flexibility also results in differences between the left and right control columns. This can be observed in the differences in the left and right control column positions before the pitch disconnect in the recorded data from the flight (Figure 1).
Figure 1: Excerpt from the flight data recorder information around the time of the pitch disconnect. The circled area highlights a difference in the left and right control column positions (red arrows) during an input from the first officer on the right control column. Note, there is no corresponding difference between the position of the left and right elevators. For the complete image, refer to the previous interim report.
Source: ATSB
This flexibility was also noted during the on-ground testing of the pitch disconnect system after the occurrence, where there was a noticeable difference between the left and right control column positions just before the pitch uncoupling mechanism activated (Figure 2).
Figure 2: Still image from video of on-ground pitch disconnect testing carried out on VH‑FVR following the occurrence. The right control column was held fully forward while the left control was pulled back. The image is just before the pitch uncoupling mechanism activated. Note the difference between the left and right control column positions. The left control column is about halfway through its full travel, while the right control column is at the forward limit.
Source: ATSB
Although the control columns are physically located about 1 m apart, because the connection between the left and right systems is located between the elevators, the left and right control columns are mechanically separated from each other by approximately 60 m.
Calculation of the expected elevator deflections at the maximum operating speed
As detailed in the analysis of this interim report, flexibility in the system results in a change to the elevator deflection following a pitch disconnect. In response to questions from the ATSB, the manufacturer calculated the expected differential in control column position and elevator deflection following a pitch disconnect at the maximum operating speed, VMO. Their calculations were based upon the variable control column-to-elevator deflection ratio, due to the system flexibility, and the aerodynamic model for the aircraft. It was assumed that the control columns maintained their position following the pitch disconnect. Those calculations determined that the difference between the left and right:
During the certification of an aircraft type, the applicant (in this case the aircraft manufacturer) and the certifying authority[5] negotiate an agreed design standard and common interpretation of those standards. To obtain certification of the aircraft type, the applicant must satisfy the certifying authority that compliance has been demonstrated for all applicable sections of the agreed design standard.
Design standard
The ATR 72 was designed and certified to the Joint Airworthiness Requirements Part 25 (JAR 25). The applicable change status of JAR 25 used for the certification was change 13. The ATSB identified that the following requirements are of particular relevance to this investigation.
JAR 25.671 Control systems – General
This section details a number of general requirements regarding the design of control systems. Of particular note is subsection (c) which states:
The aeroplane must be shown by analysis, test, or both, to be capable of continued safe flight and landing after any of the following failures or jamming in the flight control system and surfaces (including trim, lift, drag and feel systems) within the normal flight envelope, without requiring exceptional piloting skill or strength. …
The applicable failure case listed was case (3):
Any jam in a control position normally encountered during take-off, climb, cruise, normal turns, descent and landing unless the jam is shown to be extremely improbable, or can be alleviated. A runaway of a flight control to an adverse position and jam must be accounted for if such runaway and subsequent jamming is not extremely improbable.
JAR 25.1309 Equipment, systems and installations
This section applies to the safe functioning of equipment, systems and installations. The parts applicable to this investigation are:
a) The equipment, systems and installations whose functioning is required by the JAR and normal operating regulations must be designed to ensure that they perform their intended functions under any foreseeable operating conditions. (See ACJ Nos. 1 and 2 to JAR 25.1309.) …
b) The aeroplane system and associated components, considered separately and in relation to other systems, must be designed so that (see ACJ Nos. 1 and 3 to JAR 25.1309) –
1) The occurrence of any failure condition which would prevent the continued safe flight and landing of the aeroplane is extremely improbable, and
2) The occurrence of any other failure condition which would reduce the capability of the aeroplane or the ability of the crew to cope adverse operating conditions is improbable.
…
d) Compliance with the requirements of subparagraph (b) of this paragraph must be shown by analysis, and where necessary, by appropriate ground flight or simulator tests. The analysis must consider (See ACJ No. 1 to JAR 25.1309) –
1) Possible modes of failure, including malfunctions and damage from external sources.
2) The probability of multiple failures and undetected failures.
3) The resulting effects on the aeroplane and occupants, considering the stage of flight and operating conditions, and
4) The crew warning cues, corrective action required, and the capacity of detecting faults.
To assist the designer in meeting the requirements of JAR 25.1309, additional guidance for ‘acceptable means of compliance and interpretations’ was provided in an associated ACJ (Advisory Circular - Joint). ACJ No. 1 to JAR 25.1309 was applicable as it provided the guidance material for assessment of the risks of failures and events on the safety of the aircraft.
The guidance stated that the objectives of JAR 25.1309 (a) to (d) were that,
Systems, considered separately and in relation to other systems, should be designed with the objective that there is an inverse relationship between the maximum acceptable probability of an occurrence and the severity of its Effect, such that a Catastrophe from all system causes is Extremely Remote.
The effects were categorised from minor through to catastrophic, where a:
Minor Effect results in a slight reduction in safety margins such that the airworthiness is not significantly affected and any actions are well within the capability of the crew
Major Effect results in a significant reduction in safety margins and there is a reduction in the ability of flight crew to cope with adverse operating conditions as a result of an increase in workload or as a result of conditions impairing their efficiency. There may be injuries to occupants.
Hazardous Effect results in a large reduction in safety margins. There may be physical distress to the flight crew and they cannot be relied upon to perform their tasks accurately or completely. Serious injury, or death, of a relatively small proportion of occupants may occur.
Catastrophic Effect is one which results in the loss of the aeroplane and/or fatalities.
The associated probabilities for major, hazardous and catastrophic effects were defined as:
Remote – unlikely to occur to each aeroplane during its total operational life but which may occur several times when considering the total operational life of a number of aeroplanes of the type. (10-5 to 10-7 occurrences per flight hour[6])
Extremely Remote – unlikely to occur when considering the total operational life of all aeroplanes of the type, but nevertheless, has to be considered as being possible. (10-7 to 10-9 occurrences per flight hour)
Extremely Improbable – So Extremely Remote that it does not have to be considered as possible to occur. (less than 10-9 occurrences per flight hour)
Although JAR 25.1309 and the associated ACJ are concerned primarily with failure conditions, the ACJ contains a section on operation without failure conditions which states:
Systems, considered separately and in relation to other systems, should be designed that, when they are operating within their specifications, it is Extremely Improbable that an Event will occur such as to cause a Catastrophe.
Where, an ‘Event’ was defined as an occurrence which has its origin distinct from the aeroplane.
Flight control system safety assessment
In showing compliance with the design standard during certification, in particular JAR 25.1309 and 25.671(c), the manufacturer completed a system safety assessment (SSA) for the flight control system. The ATSB was supplied with an extract of that SSA for items pertaining to the jamming of the flight control system and untimely operation of the pitch uncoupling mechanism.
The flight control SSA extract showed that the manufacturer’s assessment included structural studies, simulation and flight test. Examination of the assessments made within the SSA extract found that the manufacturer had considered that if the system became jammed the pitch uncoupling mechanism (PUM) allowed the left and right channels to be separated, permitting continued safe flight on one channel alone. There was also consideration of an untimely disconnect due to inadvertent activation, or mechanical failure of the PUM, that resulted in the separation of the two systems.
To demonstrate continued safe flight and landing, the manufacturer considered conditions that occur after the left and right channels had been separated. This included consideration of both the aircraft’s handling qualities and the loads associated with manoeuvring the aircraft. They considered 6 jamming scenarios, including a jam during cruise at VMO. For each of those scenarios, flight loads were computed for the expected manoeuvres, including those leading to load factors between -1g and 2.5g, and gust loads. There was no indication that the effects on the aircraft from any loads generated during activation of the PUM were considered.
The basic premise for a pitch disconnect at high airspeed, was that the aircraft could be safely slowed[7] to an airspeed below the limits that the manufacturer imposed for flight with a pitch disconnect. Those speed limitations were presented in the flight crew operating manual. The maximum of those aircraft limitations was 180 kts (70 knots below VMO) and there was no requirement to slow the aircraft to a speed below that limitation before disconnecting the controls.
Overall, the manufacturer assessed that the effect resulting from a jam or inadvertent operation of the PUM was ‘major’, when the correct procedure was applied. The probability was assessed as ranging from 2.0x10⁻⁷ to 3.9x10⁻⁷ occurrences per flight hour. Thus, the objective that major consequences occur at a rate no greater than ‘remote’ was shown for the cases studied. Associated with the SSA were the results from a flight test that was carried out to show compliance with JAR 25.671(c). The results also noted that the failure case was classified as major, but added that it was due to ‘operational constraints’.
During the investigation, the aircraft manufacturer reassessed the likelihood of an untimely pitch disconnect due to inadvertent opposing dual control inputs. The reassessment was based upon the number of incidents reported to the manufacturer and the number of hours flown by the world‑wide fleet of ATR aircraft. This reassessment determined that the occurrence rate was 4.23x10⁻⁷ occurrences per flight hour.
Flight testing
The flight test carried out during certification of the ATR 72 to demonstrate that the aircraft was ‘capable of continued safe flight and landing without requiring exceptional piloting skill and strength following jamming of one pitch control channel’ was done to demonstrate what the manufacturer considered was the most adverse case with regards to aircraft controllability. The case examined during the flight test involved manually holding the right control column such that the elevator was maintained at 11° nose up for a go-around and landing.
As a result of the testing, the manufacturer and certifying authority accepted that ‘Approach and landing with one pitch channel jammed do not require exceptional skill or pilot strength when relevant procedure is applied’.
The flight test results provided to the ATSB included an 11 second section of data around the time that the flight crew intentionally activated the PUM and separated the pitch control channels in flight.
The flight test data showed that when the flight crew initiated the control inputs to separate the left and right pitch channels, the airspeed was at about 154 kt (96 kt below the aircraft’s VMO) and the elevators were at about 4° nose up. As such, the pitch disconnect was carried out in preparation for the test, rather than being considered as part of the test to show compliance.
The flight test data also indicated that the pitch disconnect was achieved by the right seat occupant holding the control column in a fixed position while the test pilot in the left seat pulled back on the control column with sufficient force to activate the PUM.
An ATSB review of the recorded flight test data identified that the:
maximum recorded pitch axis efforts were 62 daN and 56 daN on the left and right pitch channels, respectively
maximum difference between the elevator positions during the test was 34° (left elevator at ‑23° and right elevator at 11°)[8]
left control column moved a further 5° nose up following activation of the PUM while the recorded pitch axis effort dropped from 62 to 20 daN.
elevator movement following activation of the PUM was characteristic of a transient underdamped oscillatory behaviour (refer to appendix A).
A similar transient oscillatory characteristic, was identified in the FDR data during the pitch disconnect occurrence on VH‑FVR (Figure 3).
Figure 3: Excerpt from the FDR data from VH‑FVR during the pitch disconnect event. The underdamped oscillatory characteristic response of the elevator movement following pitch disconnect is circled in yellow.
Source: ATSB
Design load
The manufacturer advised that, having considered a number of load cases, the maximum ultimate load[9] condition for unsymmetrical elevator deflection was the loads generated by the following conditions, plus an additional 10 per cent margin:
154 kt airspeed
elevator nose down (as a result of jammed 8° the stick pusher jamming at full extension)
one the other elevator at full nose up position, leading to a difference of 33° between both elevators[10]
The manufacturer further advised that the ultimate load was also equivalent to the following conditions, without any margin:
the above condition at 161 kt
differential elevator deflections of 36° (full opposing deflections) at 154 kt
differential elevator deflection of 15.6° at 250 kt (VMO).
This interim report details factual information established in the investigation’s evidence collection phase and has been prepared to provide timely information to the industry and public. Interim reports contain no analysis or findings, which will be detailed in the investigation’s final report. The information contained in this interim report is released in accordance with section 25 of the Transport Safety Investigation Act 2003.
Background
On 20 February 2014, a Virgin Australia Regional Airlines (VARA) ATR 72 aircraft, registered VH‑FVR, operating on a scheduled passenger flight from Canberra, Australian Capital Territory to Sydney, New South Wales sustained a pitch disconnect while on descent into Sydney. The aircraft was significantly damaged during the occurrence.
In accordance with the Transport Safety Investigation Act 2003, the ATSB initiated an investigation into the occurrence. Although the investigation is not yet complete and covers a range of areas, a safety issue has been identified that, in the interests of safety, needs to be brought to the attention of the industry before the investigation is completed. This interim report provides only the factual information and analysis associated with the identified safety issue.
This interim report complements information already provided on an update on the ATSB website on 10 June 2014.[1] It is released in accordance with section 25 of the Transport Safety Investigation Act 2003 and is derived from the ongoing investigation of the occurrence. Readers are cautioned that new evidence may become available as the investigation progresses that will enhance the ATSB’s understanding of the occurrence.
Occurrence summary
The flight departed Canberra at 1612 Eastern Daylight-saving Time[2] with the first officer (FO) as the pilot flying[3]. A steeper-than-usual climb was carried out to reduce exposure to turbulence. However, other than the expected turbulence during the first 1,500 ft, there was nothing significant during the climb to flight level (FL) 170.[4]
During cruise, the crew conducted a routine brief for the anticipated arrival to runway 16 Right, which was expected to be standard except for commencement of descent 5 NM (9 km) earlier than normal to compensate for a tailwind. The captain noted the need to be cognisant of managing airspeed during the descent as the anticipated decreasing tailwind would result in a temporary increase in the indicated airspeed.
The FO commenced descent into Sydney with the autopilot engaged in vertical speed mode and a target airspeed of 235 kt (15 kt less than the maximum operating speed of 250 kt).[5] The descent was reported to have been initially stable and smooth.
On first contact with Sydney Approach the crew were assigned runway 16 Left. This was different to the expected runway and required the crew to re‑brief the approach and change the instrument approach diagrams and navigational aid frequencies.
Passing 8,500 ft above mean sea level (AMSL), the crew noticed a rapid airspeed increase. The FO reported that the airspeed trend indicator was ‘off the chart’, indicating a very rapid increase in airspeed. The FO reduced engine power and used touch control steering[6] to temporarily disconnect the autopilot before manually raising the aircraft’s nose to control the speed. The FO expected that, in combination, the pitch correction and power reduction would be sufficient to arrest the speed trend.
The FO reported that the aircraft felt ‘heavy’, as was normal for this aircraft at that speed, requiring two hands on the controls to move from the then -4° pitch angle. [7]
The captain reported being unsure if the FO’s control inputs would be sufficient to avoid exceeding the maximum operating speed limitation, so put one of his hands on the controls and disconnected the autopilot to raise the nose further.
Shortly after, with both flight crew making simultaneous nose up pitch inputs on the controls, the aircraft rapidly pitched up with an associated increase in the g load.[8] The FO responded by immediately reversing the control input to nose down. Both flight crew noticed that the controls suddenly felt different and ‘spongy’. At about the same time, aural and visual cockpit warnings activated. The crew verified that the aircraft was under control at a stable attitude and speed, observing that it was level or in a slight descent at an airspeed of about 230 kt.
One of the cockpit warnings was ‘pitch disconnect’, indicating that the left and right elevator control systems had uncoupled from each other. This allowed for independent movement of the left and right elevators via the captain’s and FO’s control columns respectively.
The crew consulted the pitch disconnect checklist and worked to identify which control column was free and working normally. After determining that both controls were free, it was decided that the captain would be pilot flying for the remainder of the approach and landing at Sydney Airport. The aerodynamic loads generated during the pitch disconnect resulted in serious injury to the senior cabin crew member and significant damage to the aircraft’s horizontal stabiliser (Figure 1). Although the aircraft was inspected after the pitch disconnect, the damage was not identified until 25 February 2014.
Figure 1: VH-FVR (circled) taxiing inbound at Sydney Airport on 20 February 2014 following the in-flight pitch disconnect (still image copied from closed-circuit television footage). Note the angle of the horizontal stabiliser relative to the wings
Source: Sydney Airport, modified by the ATSB
Airspeed indication
ATR 72-212A ‘600-series’ aircraft have a ‘glass cockpit’ consisting of a suite of electronic displays on the instrument panel. The instrument display suite includes two primary flight displays (PFDs); one located directly in front of each pilot (Figure 2). The PFDs display information about the aircraft’s flight mode (such as autopilot status), airspeed, attitude, altitude, vertical speed and some navigation information.
Figure 2: View of the ATR 72-212A glass cockpit showing the electronic displays. The PFDs for the captain and FO are indicated on the left and right of the instrument panel in front of the control columns
Source: ATSB
Airspeed information is provided on the left of the PFD in a vertical moving tape–style representation that is centred on the current computed airspeed. The airspeed tape covers a range of 42 kt either side of the current computed speed and has markings at 10 kt increments. The current computed airspeed is also shown in cyan figures immediately above the airspeed tape.
Important references on the airspeed indicator are shown in Figure 3, including:
Current computed airspeed
Airspeed trend Indicates the predicted airspeed in 10 seconds if the acceleration remains constant. The trend indication is represented as a yellow arrow that extends from the current airspeed reference line to the predicted airspeed.
Target speed bug Provides the target airspeed and can be either computed by the aircraft’s systems, or selected by the flight crew.
Maximum airspeed – speed limit band Indicates the maximum speed not to be exceeded in the current configuration. The example shown shows the maximum operating speed of 250 kt.
Figure 3: Representation of the airspeed indicator on the PFD. The example shows a current computed airspeed of 232 kt (represented by a yellow horizontal line) with an increasing speed trend that is shown in this case as a vertical yellow arrow and is approaching the maximum speed in the current configuration of 250 kt. Note: the airspeed information shown in the figure is for information only and does not represent actual values from the occurrence flight
Source: ATSB
Flight control system
The ATR 72 primary flight controls essentially consist of an aileron and spoiler on each wing, two elevators and a rudder. All of the controls except the spoilers are mechanically actuated.
Pitch control system
The pitch control system is used to position the elevators to control the direction and magnitude of the aerodynamic loads generated by the horizontal stabiliser. The system consists of left and right control columns in the cockpit connected to the elevators via a system of cables, pulleys, push‑pull rods and bell cranks (Figure 4). The left (captain’s) and right (FO’s) control systems are basically a copy of each other, where the left system connects directly to the left elevator and the right system connects directly to the right elevator.[9]
In normal operation, the left and right systems are connected such that moving one control column moves the other control column in unison. However, to permit continued control of the aircraft in the event of a jam within the pitch control system, a pitch uncoupling mechanism is incorporated into the aircraft design that allows the left and right control systems to disconnect and operate independently.[10] That mechanism comprises a spring-loaded system located between the left and right elevators.
The forces applied on one side of the pitch control system are transmitted to the opposite side as a torque or twisting force through the pitch uncoupling mechanism. The pitch uncoupling mechanism activates automatically when this torque reaches a preset level, separating the left and right control systems. When set correctly, the activation torque is equivalent to opposing forces of 50 to 55 daN (about 51 to 56 kg force) being simultaneously applied to each control column.
Figure 4: ATR 72 elevator/pitch control system with the pitch uncoupling mechanism circled in red
Source: ATR, annotated by the ATSB
Activation of the pitch uncoupling mechanism is signalled in the cockpit by the master warning light flashing red, a continuous repetitive chime aural alert and a flashing red PITCH DISC message on the engine and warning display (Figure 5).[11] The associated procedure to be followed in response to activation of the pitch uncoupling mechanism is presented to the right of the warning message.
Figure 5: Pitch disconnect warning presentation on the engine and warning display. The red PITCH DISC warning message, indicated by the thick yellow arrow, is located on the lower left of the screen. The pitch disconnect procedure is displayed to the right of the warning message
Source: ATSB
The pitch uncoupling mechanism can be reset by the flight crew, reconnecting the left and right elevator systems. However, this can only be achieved when the aircraft is on the ground.
ATR advised that, because a jammed pitch control channel[12] can occur in any phase of flight, a spring-loaded pitch uncoupling mechanism was selected over a directly controlled mechanism. The logic of this approach was that this type of mechanism provides an intuitive way to uncouple the two pitch channels and recover control through either channel. ATR also advised that a directly‑controlled uncoupling mechanism increased the time necessary for a pilot to identify the failure, apply the procedure and recover pitch authority during a potentially high pilot workload phase (such as take-off or the landing flare).
System testing
During examination of the aircraft by the ATSB, the pitch uncoupling mechanism was tested in accordance with the aircraft’s maintenance instructions. The load applied to the control column to activate the pitch uncoupling mechanism was found to be at a value marginally greater than the manufacturer’s required value. The reason for this greater value was not determined, but may be related to the damage sustained during the pitch disconnect event.
Aircraft damage
Examination of the aircraft by the ATSB and the aircraft manufacturer identified significant structural damage to the horizontal stabiliser. This included:
external damage to the left and right horizontal stabilisers (tailplanes) (Figure 6)
fracture of the composite structure around the rear horizontal-to-vertical stabiliser attachment points (Figure 7)
fracture of the front spar web (Figure 8)
cracking of the horizontal-to-vertical stabiliser attachment support ribs
cracking of the attachment support structure
cracking and delamination of the skin panels at the rear spar (Figure 9).
Following assessment of the damage, the manufacturer required replacement of the horizontal and vertical stabilisers before further flight.
Figure 6: Tailplane external damage (indicated by marks and stickers) with the aerodynamic fairings installed
Source: ATSB
Figure 7: Horizontal-to-vertical stabiliser attachment with the aerodynamic fairings removed. View looking upwards at the underside of the horizontal stabiliser. The thick yellow arrow indicates cracking in the composite structure around the rear attachment point
Source: ATSB
Figure 8: Crack in the horizontal stabiliser front spar. The diagonal crack in the spar web is identified by a yellow arrow
Source: ATR, modified by the ATSB
Figure 9: Cracking and delamination of the upper skin on the horizontal stabiliser at the rear spar. View looking forward at the rear face of the rear spar. Damage identified by yellow arrows
Source: ATSB
Recorded data
The ATSB obtained recorded information from the aircraft’s flight data recorder (FDR) and cockpit voice recorder (CVR). Graphical representations of selected parameters from the FDR are shown in Figures 10 and 11 as follows:
Figure 10 shows selected data for a 60-second time period within which the occurrence took place. This includes a shaded, 6-second period that shows the pitch disconnect itself.
Figure 11 shows an expanded view of the 6-second period in which the pitch disconnect took place.
Figure10: FDR information showing the relevant pitch parameters for a period spanning about 30 seconds before and after the pitch disconnect
Source: ATSB
Figure 11: FDR information showing the relevant pitch parameters for the shaded 6‑second period in Figure 10during which the pitch disconnect took place. The estimated time of the pitch disconnect is shown with a black dashed line at time 05:40:52.6
Source: ATSB
In summary, the recorded data shows that:
leading up to the occurrence, there was no indication of turbulence
the autopilot was engaged and controlling the aircraft
leading up to the uncoupling, both elevators moved in unison
in the seconds leading up to the occurrence, there were a number of rapid increases in the recorded airspeed
the FO made three nose up control inputs correlating with the use of the touch control steering
at about time 05:40:50.1, or about 2.5 seconds before the pitch disconnect, a small load (pitch axis effort) was registered on the captain’s pitch control
the captain started to make a nose up pitch input shortly before the FO made the third nose up input
when the FO started moving the control column forward (nose down) at about 05:40:52.3, the load on the captain’s control increased (nose up) at about the same rate that the first officer’s decreased
at 05:40:52.6 the elevators uncoupled. At that time:
the load on the captain’s control column was 67 daN and on the FO’s -8.5 daN
the aircraft pitch angle was increasing
the vertical acceleration was about +2.8g and increasing
after this time, the elevators no longer moved in unison
peak elevator deflections of +10.4° and -9.3° were recorded about 0.2 seconds after the pitch disconnect
about 0.25 seconds after the peak deflections, the captain moved the control forward until both elevators were in similar positions
a maximum vertical acceleration of 3.34g was recorded at about 05:40:53.0
the master warning activated after the pitch disconnect.[13]
A number of features in the recorded data were used to identify the most likely time the pitch uncoupling mechanism activated, resulting in the pitch disconnect (black dashed line in Figure 11). This included when the elevator positions show separation from each other and reversal of the left elevator position while the left control column position remained relatively constant.
Although not shown in the previous figures, the yaw axis effort (pilot load applied to the rudder pedals), indicated that the applied load exceeded the value that would result in the automatic disconnection of the autopilot.[14] That load exceedance occurred at 05:40:51.9, about the time that the autopilot disconnected. However, due to the data resolution and lack of a parameter that monitored the pilot’s disconnect button, it could not be determined if the autopilot disconnection was due to the load exceedance or the manual disconnection reported by the captain.
The CVR captured auditory tones consistent with the autopilot disconnection and the master warning. The first verbal indication on the CVR of flight crew awareness of the pitch disconnect was about 6 seconds after the master warning activated.
Manufacturer’s load analysis
ATR performed a load analysis based on data from the aircraft’s quick access recorder that was supplied by the operator. That analysis showed that during the pitch disconnect occurrence:
vertical load on the horizontal stabiliser was exceeded
vertical load on the wing was reached
bending moment on the wing was exceeded
engine mounts were exceeded.
the ultimate load,[16] in terms of the asymmetric moment[17] on the horizontal stabiliser, was exceeded.
ATR’s analysis found that the maximum load on the horizontal stabiliser coincided with the maximum elevator deflection that occurred 0.125 seconds after the elevators uncoupled. At that point, the ultimate load was exceeded by about 47 per cent, and the exceedance lasted about 0.125 second.
History of ATR 42/72 pitch disconnect occurrences
On the ground
The ATR42/72 aircraft type had a history of occasional pitch disconnects on the ground. ATR analysed these occurrences and established that in certain conditions, applying reverse thrust on landing could lead to excitation of a structural vibration mode close to the elevators’ anti-symmetric vibration mode. This could result in a disconnection between the pitch control channels. These type of on-ground events have not resulted in aircraft damage.
Tests were performed by ATR to determine the conditions in which those events occur. It appeared that the conditions include a combination of several factors: reverse thrust application, wind conditions and crew action on the control column.
In-flight
The ATSB requested occurrence data on recorded in-flight pitch disconnections from ATR in late 2014 and received that data in late 2015. ATR provided occurrence details and short summaries for 11 in-flight pitch disconnect occurrences based on operator reports. The summaries indicated a number of factors that resulted in the pitch disconnects, including encounters with strong turbulence, mechanical failure and some where the origin of the pitch disconnect could not be established. However, for the purposes of this investigation, the ATSB has focussed on those occurrences where opposite pitch inputs (simultaneous nose down/nose up) were identified as primarily contributing to the occurrences.
Opposite efforts applied on both control columns
Three occurrences were identified where a pitch disconnect occurred as a result of the flight crew simultaneously applying opposite pitch control inputs. At the time of this interim report, two of the three occurrences are under investigation by other international agencies, so verified details of the occurrences are not available.
In the occurrence that is not being investigated, the operator reported to ATR that during an approach, severe turbulence was encountered and the pitch channels disconnected. Although the recorded flight data did not contain a direct record of the load applied by each pilot, ATR’s analysis determined that the pitch disconnect was most likely due to opposing pitch inputs made by the flight crew.
In addition, there were two occurrences where a pitch disconnect occurred due to opposing crew pitch inputs; however, the primary factor was a loss of control after experiencing in-flight icing. The pitch disconnects occurred while the flight crew were attempting to regain control of the aircraft. In one of these occurrences, the horizontal stabiliser separated from the aircraft before it impacted with the terrain. In the other, the flight crew regained control of the aircraft.
Jammed flight controls
ATR reported that they were not aware of any pitch disconnects associated with a jammed pitch control system.
A review of past occurrences by the ATSB identified one partial jammed pitch control that occurred in the United States on 25 December 2009. According to the United States National Transportation Safety Board investigation into the occurrence ‘The flight crew twice attempted the Jammed Elevator procedure in an effort to uncouple the elevators. Despite their attempts they did not succeed in uncoupling the elevators.’ [18]
Investigation activities to date
To date, the ATSB has collected information about, and analysed the following:
the sequence of events before and after the pitch disconnect, including the post-occurrence maintenance and initial investigation by Virgin Australia Regional Airlines (VARA) and ATR
flight and cabin crew training, qualifications, and experience
the meteorological conditions
VARA policy and procedures
VARA training courses
VARA’s safety management system
VARA’s maintenance program
the aircraft’s systems
the relationship between VARA and the maintenance organisation
maintenance engineer training, qualifications, and experience
the maintenance organisation’s policy and procedures
the maintenance organisation’s training courses
the maintenance organisation’s quality and safety management
the Civil Aviation Safety Authority’s (CASA) surveillance of VARA
CASA’s approvals granted to VARA
CASA’s surveillance of the maintenance organisation
CASA’s approvals granted to the maintenance organisation
ATR’s flight crew type training
ATR’s maintenance engineer type training
ATR’s maintenance instructions for continuing airworthiness
known worldwide in-flight pitch disconnect occurrences involving ATR 42/72 aircraft.
Purpose of safety investigations
The objective of a safety investigation is to enhance transport safety. This is done through:
identifying safety issues and facilitating safety action to address those issues
providing information about occurrences and their associated safety factors to facilitate learning within the transport industry.
It is not a function of the ATSB to apportion blame or provide a means for determining liability. At the same time, an investigation report must include factual material of sufficient weight to support the analysis and findings. At all times the ATSB endeavours to balance the use of material that could imply adverse comment with the need to properly explain what happened, and why, in a fair and unbiased manner. The ATSB does not investigate for the purpose of taking administrative, regulatory or criminal action.
Terminology
An explanation of terminology used in ATSB investigation reports is available here. This includes terms such as occurrence, contributing factor, other factor that increased risk, and safety issue.
Publishing information
Released in accordance with section 25 of the Transport Safety Investigation Act 2003
Ownership of intellectual property rights in this publication
Unless otherwise noted, copyright (and any other intellectual property rights, if any) in this report publication is owned by the Commonwealth of Australia.
Creative Commons licence
With the exception of the Coat of Arms, ATSB logo, and photos and graphics in which a third party holds copyright, this publication is licensed under a Creative Commons Attribution 3.0 Australia licence.
Creative Commons Attribution 3.0 Australia Licence is a standard form licence agreement that allows you to copy, distribute, transmit and adapt this publication provided that you attribute the work.
The ATSB’s preference is that you attribute this publication (and any material sourced from it) using the following wording: Source: Australian Transport Safety Bureau
Copyright in material obtained from other agencies, private individuals or organisations, belongs to those agencies, individuals or organisations. Where you wish to use their material, you will need to contact them directly.
The ATSB expects that all safety issues identified by the investigation should be addressed by the relevant organisation(s). In addressing those issues, the ATSB prefers to encourage relevant organisation(s) to proactively initiate safety action, rather than to issue formal safety recommendations or safety advisory notices.
In this case, the ATSB has assessed that the risk posed by the safety issue is of sufficient magnitude to warrant the release of an interim report. This action provides the earliest opportunity for the relevant organisation to initiate proactive safety action, rather than to wait for the final investigation report to be published.
All of the directly involved parties were provided with a draft report and invited to provide submissions. As part of that process, each organisation was asked to communicate what safety actions, if any, they had carried out or were planning to carry out in relation to each safety issue relevant to their organisation.
The initial public version of this and any other safety issues and actions identified by the ATSB are repeated separately on the ATSB website to facilitate monitoring by interested parties. Where relevant the safety issues and actions will be updated on the ATSB website as information comes to hand.
Inadvertent activation of the elevator control system - pitch uncoupling mechanism
Inadvertent application of opposing pitch control inputs by flight crew can activate the pitch uncoupling mechanism which, in certain high-energy situations, can result in catastrophic damage to the aircraft structure before crews are able to react.
The actions taken by the flight crew were consistent with an attempt to prevent an increase in the aircraft’s speed. It was not consistent with a conscious attempt to disconnect the left and right elevator systems due to a control jam.
The force differential between the captain’s and first officer’s pitch control inputs when the pitch uncoupling mechanism activated was about 75 daN. This was less than the expected combined load of about 50 to 55 daN each (that is, a total differential of about 100 to 110 daN), and would initially suggest that the pitch uncoupling mechanism may have activated below the designed force differential. However, post‑occurrence testing conducted for the ATSB identified that the pitch uncoupling force exceeded the requirement. It is therefore unlikely that the pitch disconnect was due to a pitch uncoupling mechanism malfunction or incorrect activation setting. The difference in activation loads will be examined further in the final report.
The recorded data from the flight showed that both flight crew made simultaneous but opposite direction control inputs at the time of the pitch disconnect. Thus, it is most likely that the pitch disconnect was a result of an inadvertent application of opposing control inputs by the flight crew while attempting to prevent an exceedance of the aircraft’s maximum operating speed. The factors that led to both flight crew members making those control inputs will be examined in detail in the final report.
At the time of the pitch disconnect, the aircraft was near its maximum permitted operating speed. Because of this high speed, the resulting asymmetric elevator deflections resulted in a large asymmetric aerodynamic load being generated on the horizontal stabiliser. That load exceeded the design strength requirements for the stabiliser structure, resulting in significant damage. Such a large exceedance has the potential to result in catastrophic damage to the stabiliser and a subsequent loss of control.
Despite pre-existing, well-established and trained procedural risk controls to prevent dual control inputs in normal operation, the risk controls were readily, but inadvertently, bypassed by the crew on this occasion. The factors that led to this situation will be examined in detail in the final report. However, it shows that the aircraft was in a situation where inadvertent control inputs could lead to catastrophic failure of the horizontal stabiliser.
In normal operation, flight crew should not be making uncoordinated simultaneous control inputs. However this, and a number of other in-flight pitch disconnect occurrences, indicate that the pre‑existing procedural risk controls alone may not be sufficient to prevent this type of occurrence. Also, on this occasion, significant structural damage was done to the aircraft before the crew were alerted to, and able to react to the disconnection of the left and right pitch systems. Consequently, the ATSB is investigating whether the design of the pitch control and associated warning systems increases the likelihood of potentially catastrophic damage occurring when flight crew inadvertently make opposing pitch control inputs. The final report will contain a detailed assessment of this aspect of the investigation.
Finding
Based on the circumstances of this and a number of similar occurrences, the ATSB makes the following finding:
Inadvertent application of opposing pitch control inputs by flight crew can activate the pitch uncoupling mechanism which, in certain high-energy situations, can result in catastrophic damage to the aircraft structure before crews are able to react. [Safety issue]
Preliminary report
Preliminary report released 10 June 2014
This preliminary report details factual information established in the investigation’s early evidence collection phase and has been prepared to provide timely information to the industry and public. Preliminary reports contain no analysis or findings, which will be detailed in the investigation’s final report. The information contained in this preliminary report is released in accordance with section 25 of the Transport Safety Investigation Act 2003.
The occurrences
Flight control occurrence
On 20 February 2014, Virgin Australia Regional Airlines was operating an ATR 72 aircraft, registered VH-FVR, on two scheduled passenger flights from Sydney, New South Wales (NSW) to Canberra, Australian Capital Territory and return. This was to be followed by a charter flight to Narrabri, NSW and return.
The applicable forecasts and reports did not anticipate any significant weather with the only concern to the flight crew being an expected crosswind of up to 30 kt for landing at Canberra. This was taken into account when the captain decided to be pilot flying for the first sector.
Pushback at Sydney was on time at about 1435 Eastern Daylight-saving Time[1] but take‑off was later than planned due to a long taxi and holding for traffic. The departure, climb and cruise were normal. For the descent into Canberra the crew selected a slower airspeed due to the possibility of turbulence. No significant turbulence was encountered until the normally-expected amount of mechanical turbulence on late final approach into Canberra.
The turnaround was conducted within the allocated time and the return flight to Sydney departed Canberra at 1612 with the first officer as the pilot flying. A steeper-than-usual climb was carried out to reduce exposure to turbulence. Other than expected turbulence during the first 1,500 ft, there was nothing significant during the climb to flight level (FL) 170[2].
During cruise the captain was in radio contact with the operator’s personnel who requested that departure from Sydney for the next sector be brought forward by 5 minutes. The captain expressed his concerns about the limited time available for the turnaround to the first officer.
The crew conducted a routine brief for the anticipated arrival to runway 16 Right, which was expected to be standard except for commencement of descent 5 NM (9 km) earlier to compensate for a tailwind. The captain noted that they needed to be cognisant of managing airspeed during the descent as a result of the anticipated decreasing tailwind.
The first officer commenced descent with the autopilot engaged in vertical speed mode and a target airspeed of 235 kt (15 kt less than the maximum operating speed of 250 kt). The descent was stable and smooth.
On first contact with Sydney Approach the crew were assigned runway 16 Left. This was different to the briefed runway and required a change of instrument approach diagrams and navigational aid frequencies.
At the appropriate points the seatbelt sign was turned on and the transition-down checklist carried out. The checklist was held at the last item awaiting a report from the cabin that it was secure.
At 1640 and about 8,500 ft, the crew noticed the airspeed going up quickly and the speed trend excessively high. The first officer reduced engine power and used touch control steering to temporarily disconnect the autopilot before manually raising the nose to control the speed. The aircraft felt ‘heavy’, requiring the first officer’s two hands on the controls to move from the then -4° pitch angle (aircraft nose-up/down). The first officer expected that the pitch correction would be sufficient to arrest the speed trend.
The captain was unsure if the first officer’s control inputs were sufficient to avoid an overspeed so put one of his hands on the controls and disconnected the autopilot to raise the nose further. The captain believed he indicated his intention to take over control and while the first officer could not recall it being verbalised he was aware of the captain’s actions. The first officer recalled that he took his hands off the controls, releasing touch control steering in the process. Shortly after, concerned about a high nose-up attitude, the first officer put his hands back on the controls. To both crew members, what happened next was unexpected and unclear.
Suddenly, the crew felt high positive g,[3] the controls felt different and spongy, and cockpit warnings activated. The crew then verified that the aircraft was under control at a stable attitude and speed. It was level or in a slight descent at an airspeed of about 230 kt.
One of the cockpit warnings was ‘pitch disconnect’, indicating the left and right elevator control systems had been decoupled. This allowed for independent movement of the elevators via the captain and first officer control columns.
The crew consulted the pitch disconnect checklist and worked to identify which control column was free and working normally. Although both controls were free, it was decided that the captain would be pilot flying. During this process an intermediate airspeed around 200‑210 kt was selected before reducing the airspeed to below the 180 kt specified in the checklist.
At some point the cabin crew called the cockpit and advised that the senior cabin crew member had injured her leg and that it might be broken. In the next contact with air traffic control the crew asked for an ambulance to be available after landing. The crew also made a PAN[4] call and requested runway 16 Right to minimise taxi time on the ground. Air traffic control agreed to that request.
The captain flew the approach to runway 16 Right manually with airspeeds, power settings and configurations that were typical of any day-visual approach and landing. After landing and a slight delay the crew taxied the aircraft to the assigned bay (Figure 1).
Figure 1: Aircraft taxiing onto the bay (still image copied from closed circuit TV footage)
Source: Sydney Airport (edited by the ATSB)
After shutdown the crew completed cockpit tasks including reconnection of the two elevator control systems and the captain checked on the condition of the cabin crew member. Airport firefighters provided first aid until an ambulance arrived at the bay 10 minutes after the aircraft parked. The cabin crew member was transported by ambulance to a hospital. The Australian Transport Safety Bureau (ATSB) was advised initially of a turbulence-related event and, based on the nature of the injuries sustained by the flight attendant, commenced an investigation.
Post-occurrence maintenance
Two aircraft maintenance engineers working for the company that provided contract maintenance services to the operator were in attendance at the aircraft. The crew advised the engineers that they weren’t sure what had happened but that the pitch controls had disconnected, with a possible overspeed. From the onboard equipment, the engineers were able to establish that there had not been an overspeed but a vertical load factor of 3.34 g was recorded that exceeded the acceptable limit for the aircraft weight. One of the engineers took the opportunity to conduct a preliminary walk-around visual inspection and did not observe any aircraft damage. The flight crew entered the pitch disconnect in the aircraft’s technical log and, after a request from the engineers for more information, added that the aircraft had sustained moderate turbulence.
The aircraft was removed from further service that day and towed to a distant parking area to allow for the resulting maintenance inspection to be carried out. The two engineers on duty, one of whom was the senior base engineer, had come in early at 0600 to work on a grounded aircraft. Given this start time and the resulting already long day, the engineers considered that they needed assistance to complete their remaining tasks, which now included an inspection of VH-FVR. An engineer on his rostered day off agreed to come into work to assist with the inspection.
This engineer arrived at work at about 1900 and, after a discussion with the duty engineers, understood that the aircraft operator (maintenance watch) had received the data from the aircraft’s quick access recorder and requested a turbulence inspection after a pitch disconnect in moderate turbulence. He also understood at the time that one of the duty engineers had done quite a detailed walk-around of the aircraft in daylight and found no signs of defects.
The aircraft manufacturer’s job card for a turbulence inspection specified a general visual inspection of the fuselage, stabilisers and wings with more detailed inspections if any anomalies were found. A detailed inspection of the wing attachment fittings was also required irrespective of the results of the general visual inspection.
Over the course of the evening the non-rostered engineer and one of the duty engineers worked on disassembling some of the aircraft interior to access the wing attachment fittings. The duty engineers left at 2200, leaving the non-rostered engineer to complete the task. At about 2300 the engineer borrowed a nearby stand to provide a platform at about wing height. While on the stand positioned behind the left wing near the fuselage, the engineer inspected the upper surface of the wing, rear fuselage and tail by torchlight. The engineer finished work shortly after and returned to work at 0600 the next morning.
No defects were identified from any of the inspections and the aircraft was returned to service the next day.
Suspected birdstrike
Subsequent to the occurrence on 20 February, the aircraft was operated on 13 sectors, the last of which was a scheduled passenger flight from Sydney to Albury, NSW on 25 February 2014. On descent into Albury the aircraft passed in close proximity to birds, which alerted the captain to the possibility of a birdstrike. There were no indications that a bird had struck the aircraft but on the ground, the aircraft’s pitch trim system fluctuated abnormally.
The captain conducted a walk-around inspection with an expectation of bird damage to the left side of the aircraft. The only abnormality found was a deformity to a fairing at the top leading edge of the vertical stabiliser, which might have been the result of a birdstrike. The captain advised maintenance watch who dispatched an engineer to inspect the aircraft.
The engineer used scissor lift equipment to inspect the tailplane and confirmed that the fairing might have been damaged by a bird but that there was also significant structural damage on top of the tailplane. The aircraft was grounded and the ATSB advised.
Later information from the operator suggested that the damage to the tailplane might have been a result of the occurrence involving VH-FVR on 20 February 2014. On this basis, the ATSB combined its investigation into the aircraft damage identified in Albury with its investigation into the earlier flight control occurrence.
The flight crew of the earlier pitch‑disconnect flight and the engineers involved in the post-flight maintenance were interviewed and the damage to the aircraft was inspected at Albury. The ATSB downloaded data for the pitch-disconnect flight and subsequent flights from the flight data recorder and data for the pitch‑disconnect flight and last flight from the cockpit voice recorders that were installed in the aircraft for those flights.
Initial examination
An initial examination of the recorded data showed that when the airspeed approached 240 kt, at about 8,500 ft during the descent into Sydney on 20 February, the first officer used touch control steering and manually pitched the aircraft up. The airspeed increased again and then both the first officer and captain pulled on the control column. Shortly after, when the vertical load factor was increasing through 1.8 g, the first officer began to push the control column. The differential force on the control column that resulted from the captain and first officer applying an opposing force exceeded the differential force required to generate a pitch disconnect. Each pilot was then controlling the elevator on their side of the aircraft in opposite directions for a brief period before the first officer released his control column.
The aircraft manufacturer inspected the aircraft and found broken carbon plies, cracked joint sealant, and deformation in and around the area where the horizontal stabiliser attaches to the vertical stabiliser (Figures 2 and 3). There was also some minor damage to the rudder. The damage was assessed as being consistent with an overstress condition. Subject to further assessment and non-destructive testing, the aircraft manufacturer recommended replacement of the horizontal stabiliser, elevators, and vertical stabiliser.
Figure 2: Tailplane external damage (indicated by marks and stickers)
Source: ATSB
Figure 3: Left tailplane attachments (fairing removed)
Source: ATSB
____________________
The information contained in this web update is released in accordance with section 25 of the Transport Safety Investigation Act 2003 and is derived from the initial investigation of the occurrence. Readers are cautioned that new evidence will become available as the investigation progresses that will enhance the ATSB's understanding of the accident as outlined in this web update. As such, no analysis or findings are included in this update.
Purpose of safety investigations
The objective of a safety investigation is to enhance transport safety. This is done through:
identifying safety issues and facilitating safety action to address those issues
providing information about occurrences and their associated safety factors to facilitate learning within the transport industry.
It is not a function of the ATSB to apportion blame or provide a means for determining liability. At the same time, an investigation report must include factual material of sufficient weight to support the analysis and findings. At all times the ATSB endeavours to balance the use of material that could imply adverse comment with the need to properly explain what happened, and why, in a fair and unbiased manner. The ATSB does not investigate for the purpose of taking administrative, regulatory or criminal action.
Terminology
An explanation of terminology used in ATSB investigation reports is available here. This includes terms such as occurrence, contributing factor, other factor that increased risk, and safety issue.
Publishing information
Released in accordance with section 25 of the Transport Safety Investigation Act 2003
Ownership of intellectual property rights in this publication
Unless otherwise noted, copyright (and any other intellectual property rights, if any) in this report publication is owned by the Commonwealth of Australia.
Creative Commons licence
With the exception of the Coat of Arms, ATSB logo, and photos and graphics in which a third party holds copyright, this publication is licensed under a Creative Commons Attribution 3.0 Australia licence.
Creative Commons Attribution 3.0 Australia Licence is a standard form licence agreement that allows you to copy, distribute, transmit and adapt this publication provided that you attribute the work.
The ATSB’s preference is that you attribute this publication (and any material sourced from it) using the following wording: Source: Australian Transport Safety Bureau
Copyright in material obtained from other agencies, private individuals or organisations, belongs to those agencies, individuals or organisations. Where you wish to use their material, you will need to contact them directly.
[1] Eastern Daylight-saving Time (EDT) was Coordinated Universal Time (UTC) + 11.0 hours.
[2] At altitudes above 10,000 ft in Australia, an aircraft’s height above mean sea level is referred to as a flight level (FL). FL 170 equates to 17,000 ft.
[3] G Load is the nominal value for acceleration. In flight, g load values represent the combined effects of flight manoeuvring loads and turbulence. This can be a positive or negative value.
[4] An internationally recognised radio call announcing an urgency condition which concerns the safety of an aircraft or its occupants but where the flight crew does not require immediate assistance.
On 28 October 2012, at about 1410 Eastern Daylight-saving Time, an unmanned airship (callsign Airship 11) departed Keysborough, Victoria on a 30 minute test flight to assess the airship’s centre of gravity and manoeuvrability characteristics. The airship was controlled via a portable radio-controlled transmitter.
The crew planned to operate the flight below 200 ft above ground level and within 100-200 m of their location, with the airship remaining clear of the Moorabbin Class D control area.
Shortly after takeoff, the crew noticed that the airship’s centre of gravity was rearward, resulting in a nose-up attitude. About one minute later, when it was at about 130 ft, the pilot realised that he could not turn the airship to the left. The crew had lost control of the airship although the data link was still functioning.
Attempts to contact the Moorabbin control tower were unsuccessful. At about 1428, the air traffic controllers at Moorabbin observed the airship about 2 NM to the south-east at about 1,000 ft. At about 1500, the airship landed on the roof of a commercial building, sustaining minor damage.
As a result of this occurrence, the airship operator is taking the following safety actions:
source an airship from another manufacturer;
develop a safe method for tethered air testing;
develop a simulator for a small X-tail airship;
locate a suitable site for flight testing away from populated areas;
install the ground control station in the support vehicle;
On 29 December 2007, a Boeing Company 737-229 aircraft, registered VH-OBN, was being operated on a scheduled passenger service from Brisbane, Qld to Norfolk Island. At 0352 Coordinated Universal Time, the flight crew conducted a missed approach at Norfolk Island due to poor weather.
During the flap retraction, the flight crew felt a high frequency vibration through the airframe, while observing control yoke deflection to the left. Due to the vibration, the aircraft's autopilot system could not be engaged and controlled flight was manually maintained with difficulty. The flight crew elected to continue to the designated alternate airport at Nouméa, New Caledonia. During that diversion flight, the cabin crew prepared the passengers for a possible ditching.
An engineering inspection determined that the number 4 leading edge slat, inboard main track had failed. An examination of the failed track identified fatigue cracking that originated at the intersection of diverging machining marks at the fracture site. Further inspection of the number 4 slat found corrosion damage on the outboard auxiliary track, with the inboard auxiliary track adjacent to the failed main track having failed in overload at the slat attachment.
The investigation also identified a number of cabin safety issues during the diversion flight, and poor passenger handling after the subsequent landing at Nouméa. As a result of this investigation, the aircraft operator advised the Australian Transport Safety Bureau of the implementation of a number of safety actions, including:
the revision of flight crew flight planning - alternate fuel load provisions
the revision of cabin crew equipment and procedures
a review of company emergency response procedures.
At the time of finalising this report, the original operator's air operator's certificate had been taken over by a different organisation. The new organisation does not use the aircraft type involved in this occurrence. It has, however, reviewed its operations to ensure that hazards identified in this investigation are mitigated appropriately.
On 1 September 2005, the crew of an Embraer EMB110-P2 (Bandeirante) aircraft, registered VH-OZF, was conducting a private flight under the visual flight rules from Bankstown Airport to Camden, NSW. At 1343 Eastern Standard Time, on the initial climb from runway 11 Left (11L), the pilot in command (PIC) experienced excessive nose down pitch control forces.
The PIC attempted to correct the pitch force with the manual elevator trim wheel and electric trim, but the trim did not move. The copilot assisted by applying back pressure to his control column and observed that the elevator trim wheel was in the full nose down position. The pilots were unable to maintain altitude and the aircraft descended from approximately 470 to 150 ft.
The PIC reduced engine power and the airspeed reduced. The copilot applied significant force to the elevator trim wheel and the wheel released from the full nose down position. The pilots regained control and landed.
The investigation found that the left yoke-mounted trim switch did not to return to the neutral position, when operated and released, due to a sticky substance binding the levers. It also found that the elevator electric trim servo mechanical clutch did not release at the specified setting due to a lack of maintenance.
The circumstances of this event were consistent with an electric trim runaway occurring during or shortly after take-off. The investigation established that the trim runaway was probably due to the non return of the switch from the nose down position or an unidentified electrical fault.
The pilots reported that they were unable to pull the electric trim circuit breaker, in accordance with the manufacturer’s procedure, because they were unable to release the control column.
As a result of the investigation the operator and manufacturer initiated a number of safety actions.
The ATSB investigation determined that the increase in computed airspeed recorded at the time of the lateral acceleration was likely due to an atmospheric disturbance, which resulted in the aircraft veering unexpectedly. The ambient wind recorded at the time of the occurrence did not indicate if the crosswind increased, or decreased, during the event. Wake turbulence was considered unlikely, as the reported landing of the other passenger aircraft was downwind of the departure runway.
Factaul Information
An inspection of the aircraft by maintenance engineers on arrival in Brisbane did not find any fault with the main or standby rudder power control unit (PCU). The B737 PCU is a hydraulic mechanism that moves the rudder in response to inputs from either the pilot or the yaw damper. The aircraft operator has not reported any further rudder occurrences with the aircraft.
The aerodrome terminal information service that was valid at the time of the indicated that the surface wind was 190 degrees magnetic at 12 to 15 kts. Wind data that was recorded at the airport at the approximate time of the event indicated a varying, but generally south-south-easterly wind at a speed of 4 to 10 kts. The crew reported that another passenger aircraft had landed on the crossing runway prior to their departure.
The airport operator's inspection report included morning and midday inspections of the airport runway surfaces. The morning inspection was at 0727 and the midday inspection was carried out at 1450. Neither inspection identified any problems with the runway 27 surface.
The Flight Data Recorder (FDR) information was recovered for examination by the ATSB. The examination revealed that a right lateral acceleration, with a peak of approximately 0.17g had occurred at 125 kts, (refer Figure 1).
The ATSB referred the FDR information to the aircraft manufacturer for review.
The manufacturer reported that the recorded rudder and yaw damper inputs were in response to the acceleration, and did not initiate it. The recorded rudder data indicated that all rudder movements were commanded by the crew and/or the yaw damper. The PIC reported that he felt the rudder pedal move under his feet. The FDR recorded a 5 kt headwind increase during the take-off roll that may have been the result of an increasing crosswind.
The manufacturer conducted additional analysis with a flight simulator, to better understand the rudder pedal movements, lateral acceleration and heading data recorded during the occurrence. The simulation results indicated that a 7 kt right quartering headwind gust, followed by a 13 kt left quartering gust, would be needed to match the FDR lateral acceleration data.
Summary
Factual Information
On 4 March 2005, at 1405 Eastern Daylight-saving Time, a Boeing Company 737-86N aircraft, registered VH-VOG, was being operated on a scheduled passenger service from Melbourne to Brisbane. The pilot in command (PIC) reported that during the take-off roll, the aircraft unexpectedly deviated to the right of the runway 27 centreline and the nosewheel felt as though it ‘had been caught in a groove’. The PIC applied left rudder to regain directional control and continued the take-off and flight to Brisbane. The circumstances of this incident were similar to those identified in a previous Australian Transport Safety Bureau (ATSB) investigation, (see investigation report 199703237).