

Report summary
Why the ATSB undertook this research
During July and August 2026, the ATSB recorded an increased rate in reported runway and taxiway confliction occurrences at Sydney Airport. A runway or taxiway confliction occurs when aircraft come into proximity with other aircraft, vehicles or people on the movement area of an aerodrome in circumstances where safety margins are reduced.
Eleven such occurrences were reported to the ATSB during this period, 6 of which are currently under investigation. One of these occurrences involved a near collision of a Boeing 737 and a Bombardier DHC-8 resulting from a runway incursion. This occurrence received the highest Runway Incursion Severity Classification (RISC) (A), the first recorded at Sydney Airport, and only the third at a major Australian airport since the ATSB began recording incursion severity in 2003.1
This report reviewed ground-based aircraft confliction occurrences from 2016 to 2026, covering both the pre- and post-COVID periods, to identify trends and compare occurrence numbers and rates across the 5 busiest major Australian airports: Adelaide, Brisbane, Melbourne, Perth and Sydney.
Operating environment post-COVID
The increase in reported ground confliction occurrences at Sydney Airport in mid-2026 drew public attention to air traffic control capability as aircraft movements continued to recover from the COVID-related downturn that began in 2022. Public interest has also focused on the ongoing operational aviation effects of staffing-related traffic flow restrictions at Sydney, notably instances where aircraft movement spacing was increased, resulting in diversions, flight delays and cancellations due to reduced tower staffing capacity.
There were also periods since 2022 where controller shortages affected the ability of Sydney Airport to provide normal controlled services, requiring a fallback arrangement in which aircraft broadcast traffic information to each other, known as Traffic Information Broadcasts by Aircraft (TIBA).
The ATSB had also received multiple confidential reports (REPCON) post-COVID concerning air traffic control staff shortages and training requirements in the Sydney tower that have been claimed by reporters to increase safety risk.2 More recently, REPCON concerns have been raised regarding controller training, experience levels and overall preparation for the Sydney Basin airspace changes associated with the opening of the new Western Sydney International Airport in the context of an already-reported excessive pressure on the current system within the Sydney Terminal Control unit due to ATC workload as a result of staff shortages, training and experience levels.3
The 6 active investigations4 into the July–August 2026 confliction occurrences at Sydney Airport will examine circumstances specific to each confliction occurrence, as well as Sydney tower staffing matters where relevant to and/or common across the occurrences.
The ATSB recognises that whilst instructions from air traffic control are a crucial and first line safety defence at airports, safety outcomes associated with runway conflictions are also a shared responsibility involving a range of stakeholders including pilots, aircraft and airport operators, ground handling organisations and air traffic control services.
What the ATSB found
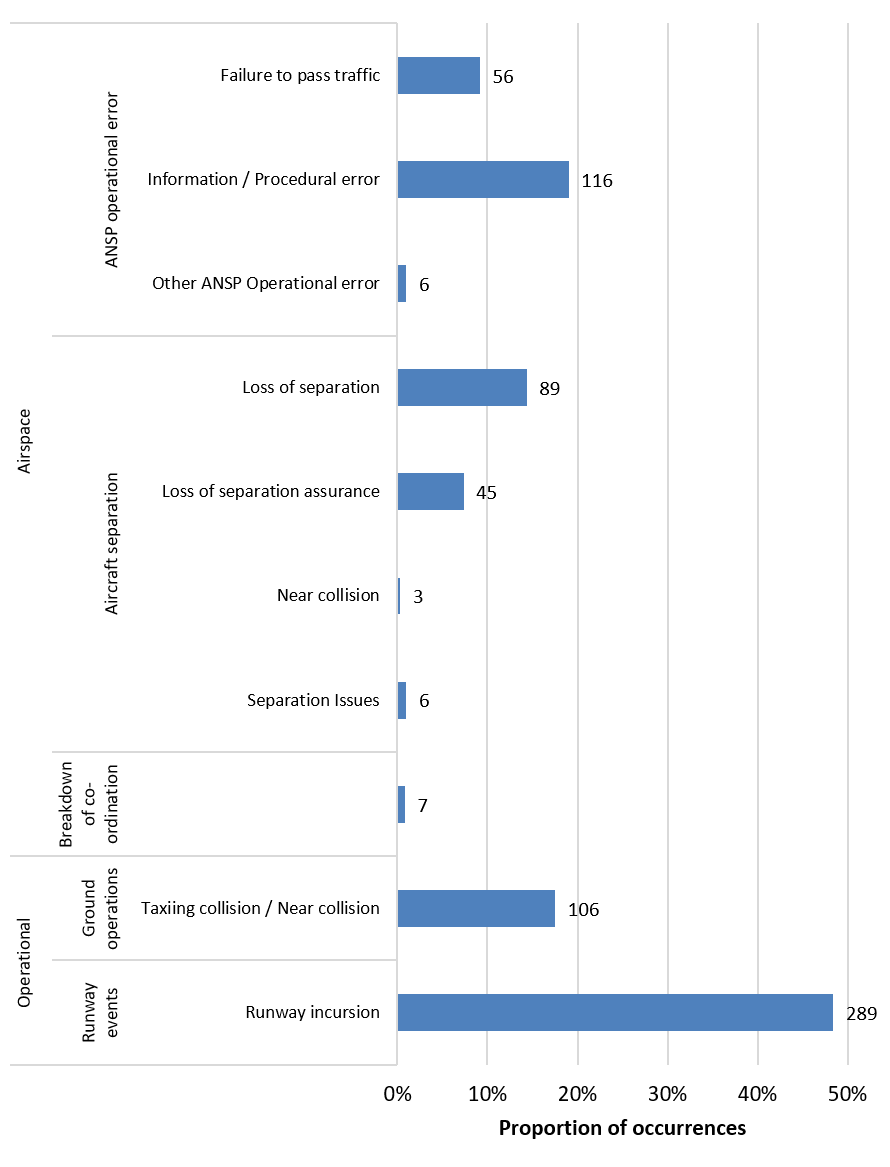
There were 599 reported runway or taxiway conflictions at the 5 major Australian airports between January 2016 and August 2026. Almost half of these occurrences were runway incursions. Other common types of occurrences were taxiway near collisions, losses of separation on the ground, and air traffic control information and procedural errors.
Across all airports for the 10-year period, the data does not suggest more occurrences since the COVID-recovery. Pre-COVID there was a spike in runway incursions following the introduction of runway stop bars at Perth (see Appendix B). Excluding stop bar related occurrences, the number of occurrences nationally has remained steady between the pre- and post-COVID periods.
In the post-COVID period, Sydney had the highest rate (occurrences per 100,000 aircraft movements) of overall ground confliction occurrences of the major airports, driven by the July–August spike in occurrences (11 occurrences in 2 months). The data has confirmed that a similar spike has only happened once before (in 2022) in the study period, whereas around 3 occurrences in a 2-month period would be expected based on the last 10 years of occurrences at Sydney. Excluding July–August 2026, overall occurrences at Sydney were relatively consistent across the 10-year period. However, when including July–August 2026, the data shows a peak in occurrences at Sydney in 2026.
However, the data also shows that some specific types of occurrences at Sydney increased post-COVID. While aircraft movements at Sydney accounted for about one‑third of all movements across the 5 airports, Sydney had half of the taxiway near collisions. Further, average annual taxiway near collisions increased at Sydney after COVID compared to before COVID, and those which involved avoiding actions by aircraft also increased, suggesting both potential severity and numbers have increased.
Further, runway incursions and losses of separation per year on the ground at Sydney involving ATC actions have increased since the COVID recovery compared to before. Also in this period, Sydney had double the annual average number of air traffic control information and procedural errors compared to the other airports.
Sydney is Australia’s busiest and most complex aerodrome for domestic and international operations, taking into consideration factors such as the runway configuration and higher levels of taxiing across live runways is required. In addition to high traffic numbers, Airservices has noted that this complexity influences the rate of occurrences.
Aircraft confliction occurrences across Australia
A runway or taxiway confliction occurs when aircraft come into proximity with other aircraft, vehicles or people on the movement area of an aerodrome in circumstances where safety margins are reduced. These include runway incursions, in which an aircraft or vehicle is present on a runway or its protected area without authorisation; conflicts on taxiways; losses of separation on the ground; and errors by air navigation service providers (ANSP) that place aircraft on the ground in close proximity.
Over the 2016–2026 period, runway incursions contributed to almost half of the aircraft confliction occurrences on the ground at Australia’s 5 major airports (Adelaide, Brisbane, Melbourne, Perth and Sydney). This was followed by ANSP information/procedural errors and taxiing collisions/near collisions, followed by taxiing collisions/near collisions (Figure 1). Of all runway conflictions, around 12% resulted from operational non-compliance by pilots, and around 6% from communication issues. Around 12% resulted in a consequential event (9% missed approach/go-around and 3% in a rejected take‑off).
Aircraft confliction occurrences on the ground movement areas involve aircraft that operate in close proximity to one another and to ground vehicles, sometimes at speed, and where the consequences of a collision can be severe. Most of these occurrences are resolved without harm. A small proportion are not, and the most serious have historically been among some of the highest-consequence occurrences in aviation worldwide.
This report is a statistical description. It details how many ground confliction occurrences were reported to the ATSB,5 at which airports and in which years, and how those figures compare once differences in the amount of traffic each airport handles are taken into account. Because busier airports generally have more occurrences simply by virtue of handling more aircraft, comparisons between airports are expressed as rates (the number of events for every 100,000 aircraft movements6) to show risk per movement, as well as the number of occurrences to show overall risk by location.
Between 2016 and August 2026 the 5 major airports handled around 9.93 million (9.66 million to May 2026 and with an additional 270,000 movements projected from June to August 2026) aircraft movements between them, and 599 confliction occurrences were reported during that period.
The first section presents a time series of confliction occurrences at the 5 major airports including a comparison of the pre- and post-COVID years. The second compares confliction occurrence rates between the 5 major airports. The next section examines the 2026 figures for Sydney in July and August. This is followed by sections regarding the attribution of runway incursions and loss of separation occurrences. Finally, the report examines the severity of runway incursions and loss of separation occurrences.
Figure 1: Proportion of occurrence categories contributing to confliction occurrences (where at least one aircraft was on the ground) at major Australian airports 2016–2026
Comparison of occurrences and rates
Between January 2016 and August 2026, 599 confliction occurrences involving ground operations or where at least one aircraft was on the ground were reported across the 5 major airports over around 9.93 million movements7, an overall rate of 6.05 per 100,000 movements. While there was a significant decrease in the number of occurrences during the COVID period (2020 and 2021), the occurrence rate remained relatively steady over the study period (Figure 2 and Table 2) apart from 2018 (see Appendix B – 2018 increase for an explanation of the 2018 increase, which mostly involves runway incursions at Perth associated with the introduction of stop bars).
Figure 2: Number of confliction occurrences and occurrence rate 2016–2026
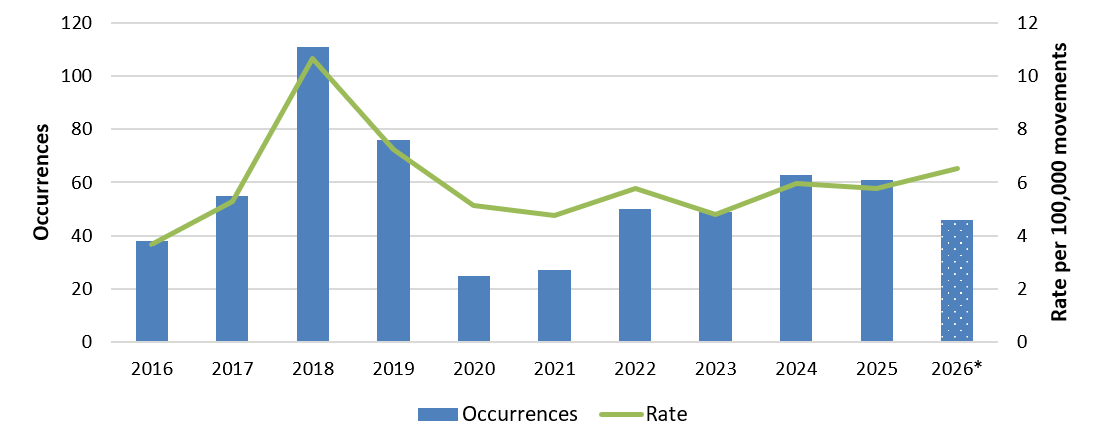
Table 1: Occurrences, movements, and rates by year, 2016–2026
| Year | Occurrences | Movements | Rate per 100,000 |
| 2016 | 38 | 1,038,542 | 3.7 |
| 2017 | 55 | 1,038,206 | 5.3 |
| 2018 | 111 | 1,041,382 | 10.7 |
| 2019 | 76 | 1,050,276 | 7.2 |
| 2020 | 25 | 486,682 | 5.1 |
| 2021 | 27 | 569,240 | 4.7 |
| 2022 | 50 | 867,972 | 5.8 |
| 2023 | 49 | 1,021,326 | 4.8 |
| 2024 | 63 | 1,054,336 | 6.0 |
| 2025 | 61 | 1,057,164 | 5.8 |
| 2026 | 44 (Jan-Aug) | 438,480 (Jan-May) 705,414 (Jan-Aug)* | 6.2* |
* Note: Occurrence data was available to end of August 2026 however movement data was only available until end of May 2026. Due to this, movement data was extrapolated until August, and rate calculations were extrapolated using these figures.
The number of occurrences more than doubled between 2021 and 2024, from 27 to 63 (Table 1). However, over the same period, aircraft movements rose from 569,240 to 1,054,336, an increase of 85% as traffic recovered following the restrictions in place during the 2020 and 2021 COVID years. Combining these, the occurrence rate from 2021 to 2024 rose by around one-quarter from 4.7 to 6.0 per 100,000 movements.
Pre-COVID vs post-COVID
The COVID period of 2020 and 2021 saw reduced movements and subsequent decrease in confliction occurrences. Aviation traffic gradually returned to normal pre‑pandemic levels during the first few months of 2022 (Table 2).
Table 2: Occurrence count, movements, and rates by COVID period
| Period | Occurrences | Movements | Rate per 100k movements |
| 2016–2019 (pre-COVID) | 280 | 4,168,406 | 6.7 |
| 2020–2021 (during COVID) | 52 | 1,055,922 | 4.9 |
| 2022–Aug 2026 (post-COVID) | 267 | 4,706,213* | 5.7* |
Note: movements and rate for 2022-2026 is projected to end August 2026
The rate from 2022 to August 2026 was lower than the pre-COVID rate from 2016 to 2019 by around 16%; this was found to be statistically significant (p = 0.022). Most of this difference was due to a higher than usual number of occurrences in 2018 (Appendix B). Excluding that year as an outlier, the pre-COVID rate dropped to 5.4 per 100,000 movements which was comparable to 5.6 post-COVID (p = 0.67).
Comparison of major airports
The 5 major airports had a total of 599 occurrences during the study period (to end of August 2026) (Table 3).
Table 3: Occurrence and movement data by location, 2016–2026
| Airport | Occurrences | Movements | Rate per 100,000 | Expected* | Ratio* | Adjusted Residual* |
| Perth | 148 | 1,471,078 | 10.1 | 89 | 1.7 | +6.8 |
| Sydney | 204 | 3,137,370 | 6.5 | 189 | 1.1 | +1.3 |
| Adelaide | 62 | 1,039,735 | 6.0 | 63 | 1.0 | -0.1 |
| Brisbane | 97 | 2,55,123 | 4.7 | 124 | 0.8 | -2.7 |
| Melbourne | 88 | 2,227,235 | 4.0 | 134 | 0.7 | -4.5 |
| * See Appendix A | ||||||
The 5 airports did differ statistically when examined as a group (𝑥2 = 63.73, p < 0.001), however Sydney was not the main contributor to the difference. Sydney recorded 204 occurrences against 189 expected based on its movements, a difference well within normal variation. Sydney handles by far the most movements of all the 5 major airports and consequently records the largest number of occurrences. Measured against its movements, Sydney’s occurrence rate is close to the average.
The airport that stands out in these data is Perth, at 1.7 times its expected occurrence count. Appendix B shows that this is attributable to spikes in 2018 and (to a lesser extent) 2019 rather than to a sustained pattern.
Post-COVID occurrences
Since aviation movements started to return to normal volumes from 2022, the difference between the 5 major airports was found to be statistically significant as a group (𝑥2 = 11.03, p = 0.03). Sydney had the highest rate of 6.7 per 100,000 movements (around 20% above the average), however the main difference was Adelaide with 3.7, which was more than a third below the average,
Annual comparison
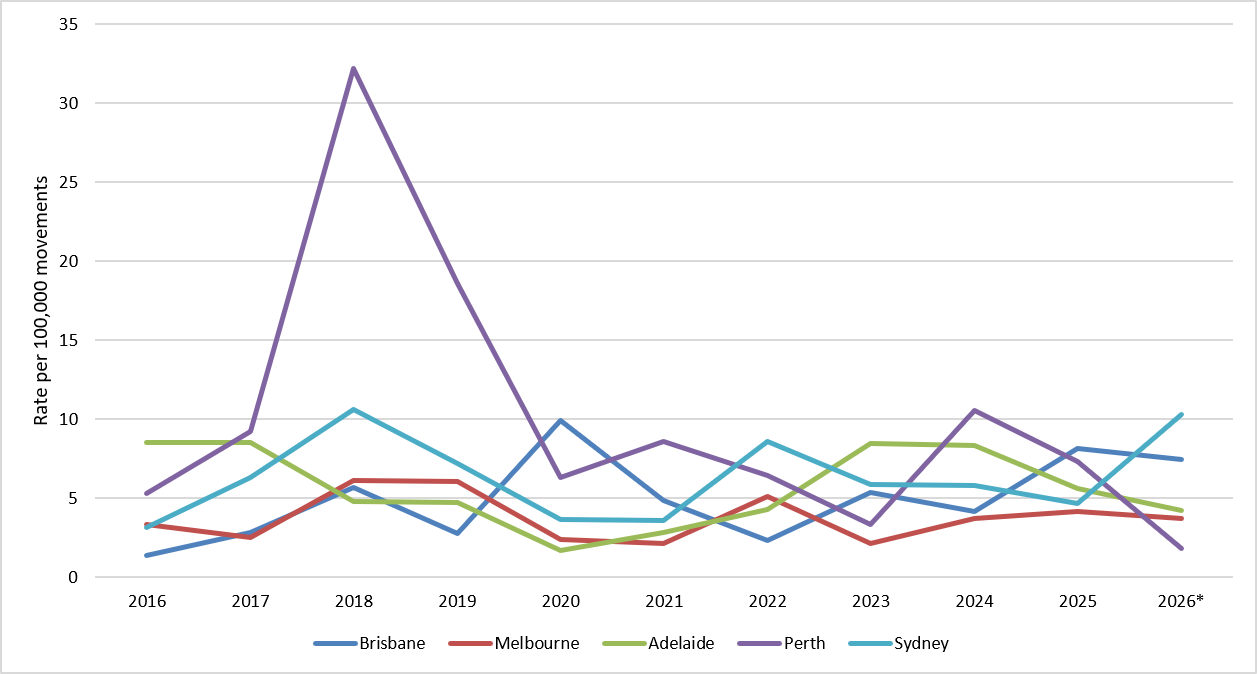
Sydney recorded the highest occurrence rate for 2 years of the 11 examined (2022 and 2026) (Figure 3).
In 2026 (to August), the projected occurrence rate at Sydney was significantly greater (around 1.7 times) than average for the 2022 to 2025 post-COVID period; this was found to be statistically significant (p = 0.014).
Figure 3: Occurrence rates per 100,000 movements by location annually, 2016–2026
Published movement data is not available beyond 31 May 2026, and movements at the major airports have been stable across recent years, so occurrence counts between periods at the same airport are relatively comparable.
Attribution
This and the following section (Severity) analyse the types of occurrences experienced at the major airports pre- and post-COVID. While sections above used occurrence rates as a proxy for the relative safety risk to flight when operating at the airports, these sections use the average number of occurrences per year instead as an indicator of the relative stress the systems at the major airports experienced over the study period. Busier airports (like Sydney) are expected to have more occurrences per year, comparing rates alone can mask the exposure the airport systems have to certain risks compared to other airports. As the data are presented as an average number per year, pre- and post‑COVID occurrence numbers are directly comparable.
Of the 581 confliction occurrences reported across the 5 major airports, 396 were classified as a runway incursion, a loss of separation, or both. Of those, 24 were classified as both.
Each occurrence is attributed to the action of air traffic control, a pilot or driver, both, or neither. Attribution indicates where the action that led to the occurrence originated but does not assign fault or indicate that any action taken was contrary to procedure.
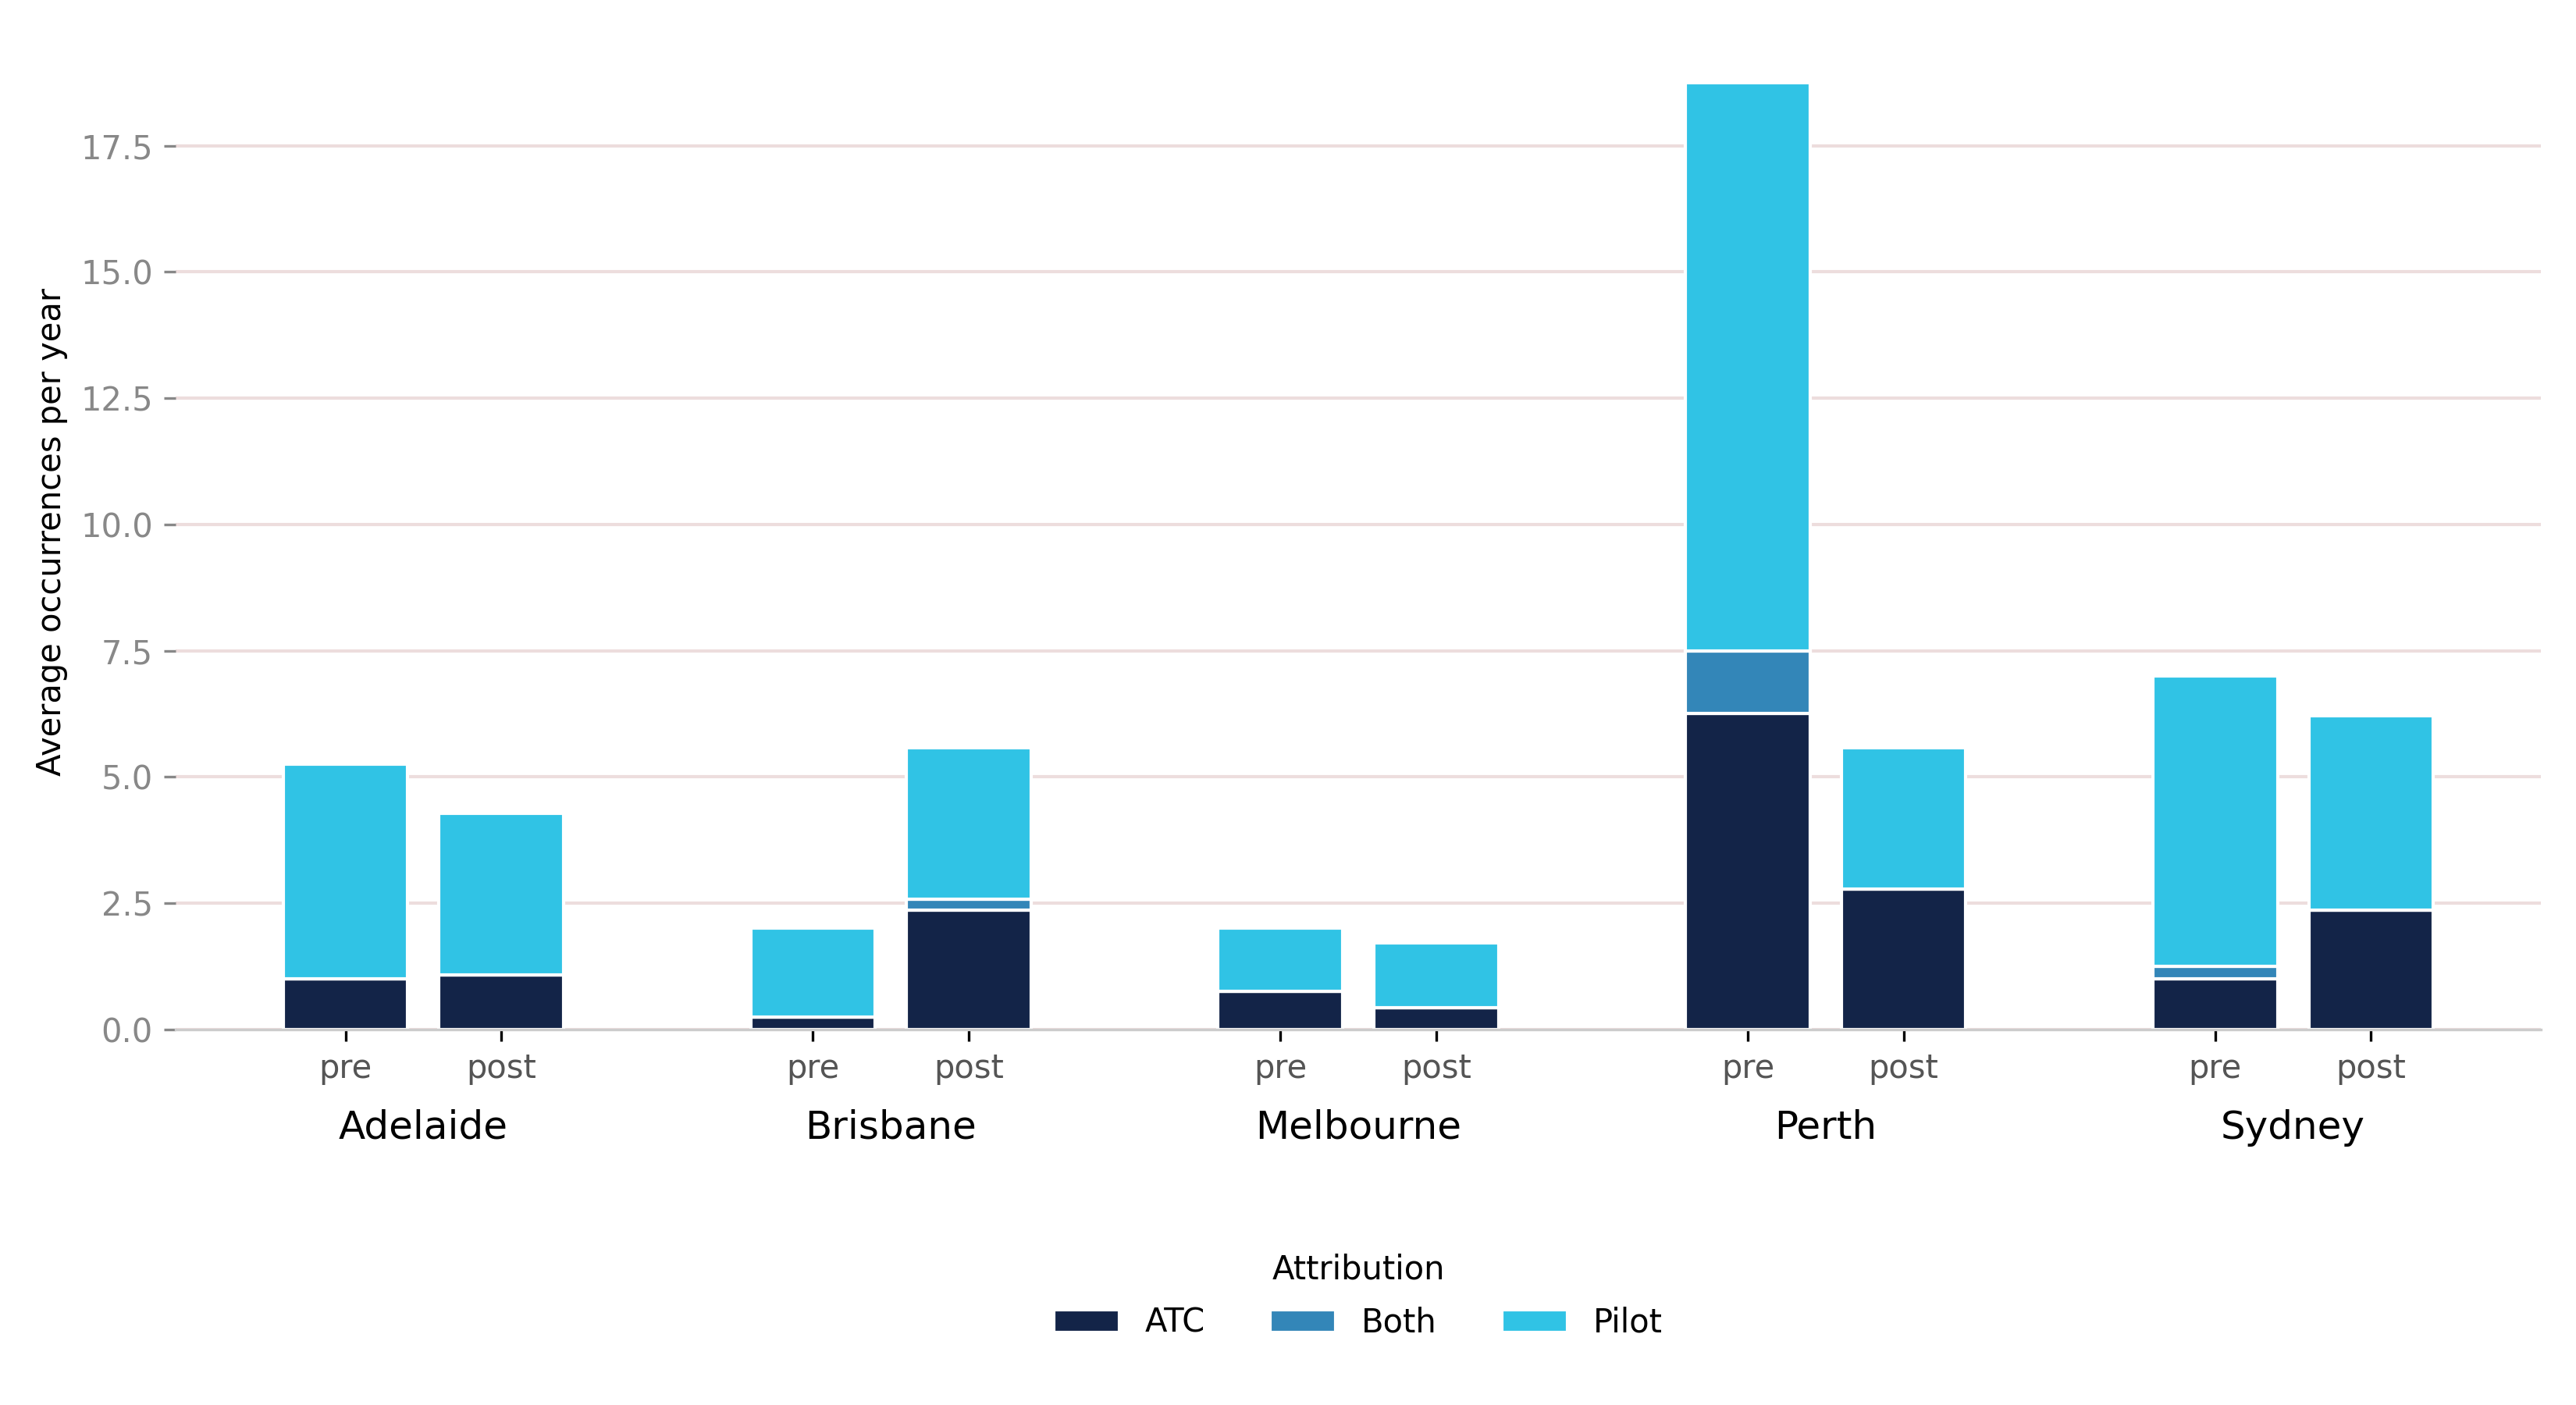
There were 43 runway incursions attributed wholly or partially to air traffic control in both the pre- and post-COVID periods, however at Sydney these were around double, increasing from 5 to 11 (1.0 to 2.4 per year on average). Nationally 8 of these occurred in 2026, of which 2 were reported at Sydney.
Across the 5 major airports runway incursions attributable to pilot or driver actions decreased by almost a third from 103 to 67, and Sydney also reported a decrease from 23 to 18 (Figure 4). Of these, 9 occurred in 2026 with over half (5) reported at Sydney. The high number of pre-COVID pilot attributable runway incursions at Perth relate to the introduction of stop bars (Appendix B).
Figure 4: Average annual runway incursion occurrences by location pre- and post-COVID by attribution, 2016–2026
Loss of separation occurrences attributed wholly or partially to air traffic control increased from 40 pre-COVID to 52 post-COVID. At Sydney Airport there was a minor increase from 15 to 16 (Figure 5). During 2026, 8 ATC-attributable runway incursions were reported, of which 2 occurred in Sydney, both in August.
Pilot or driver‑attributable loss of separation occurrences remained stable with a slight increase from 17 to 19 occurrences post-COVID. There was also a small increase pre- to post-COVID at Sydney Airport, with 9 pre-COVID increasing to 12 post-COVID. The only reported pilot or driver‑attributable runway incursion reported during 2026 occurred at Sydney Airport.
Figure 5: Average annual loss of separation occurrences by location pre- and post-COVID by attribution, 2016–2026
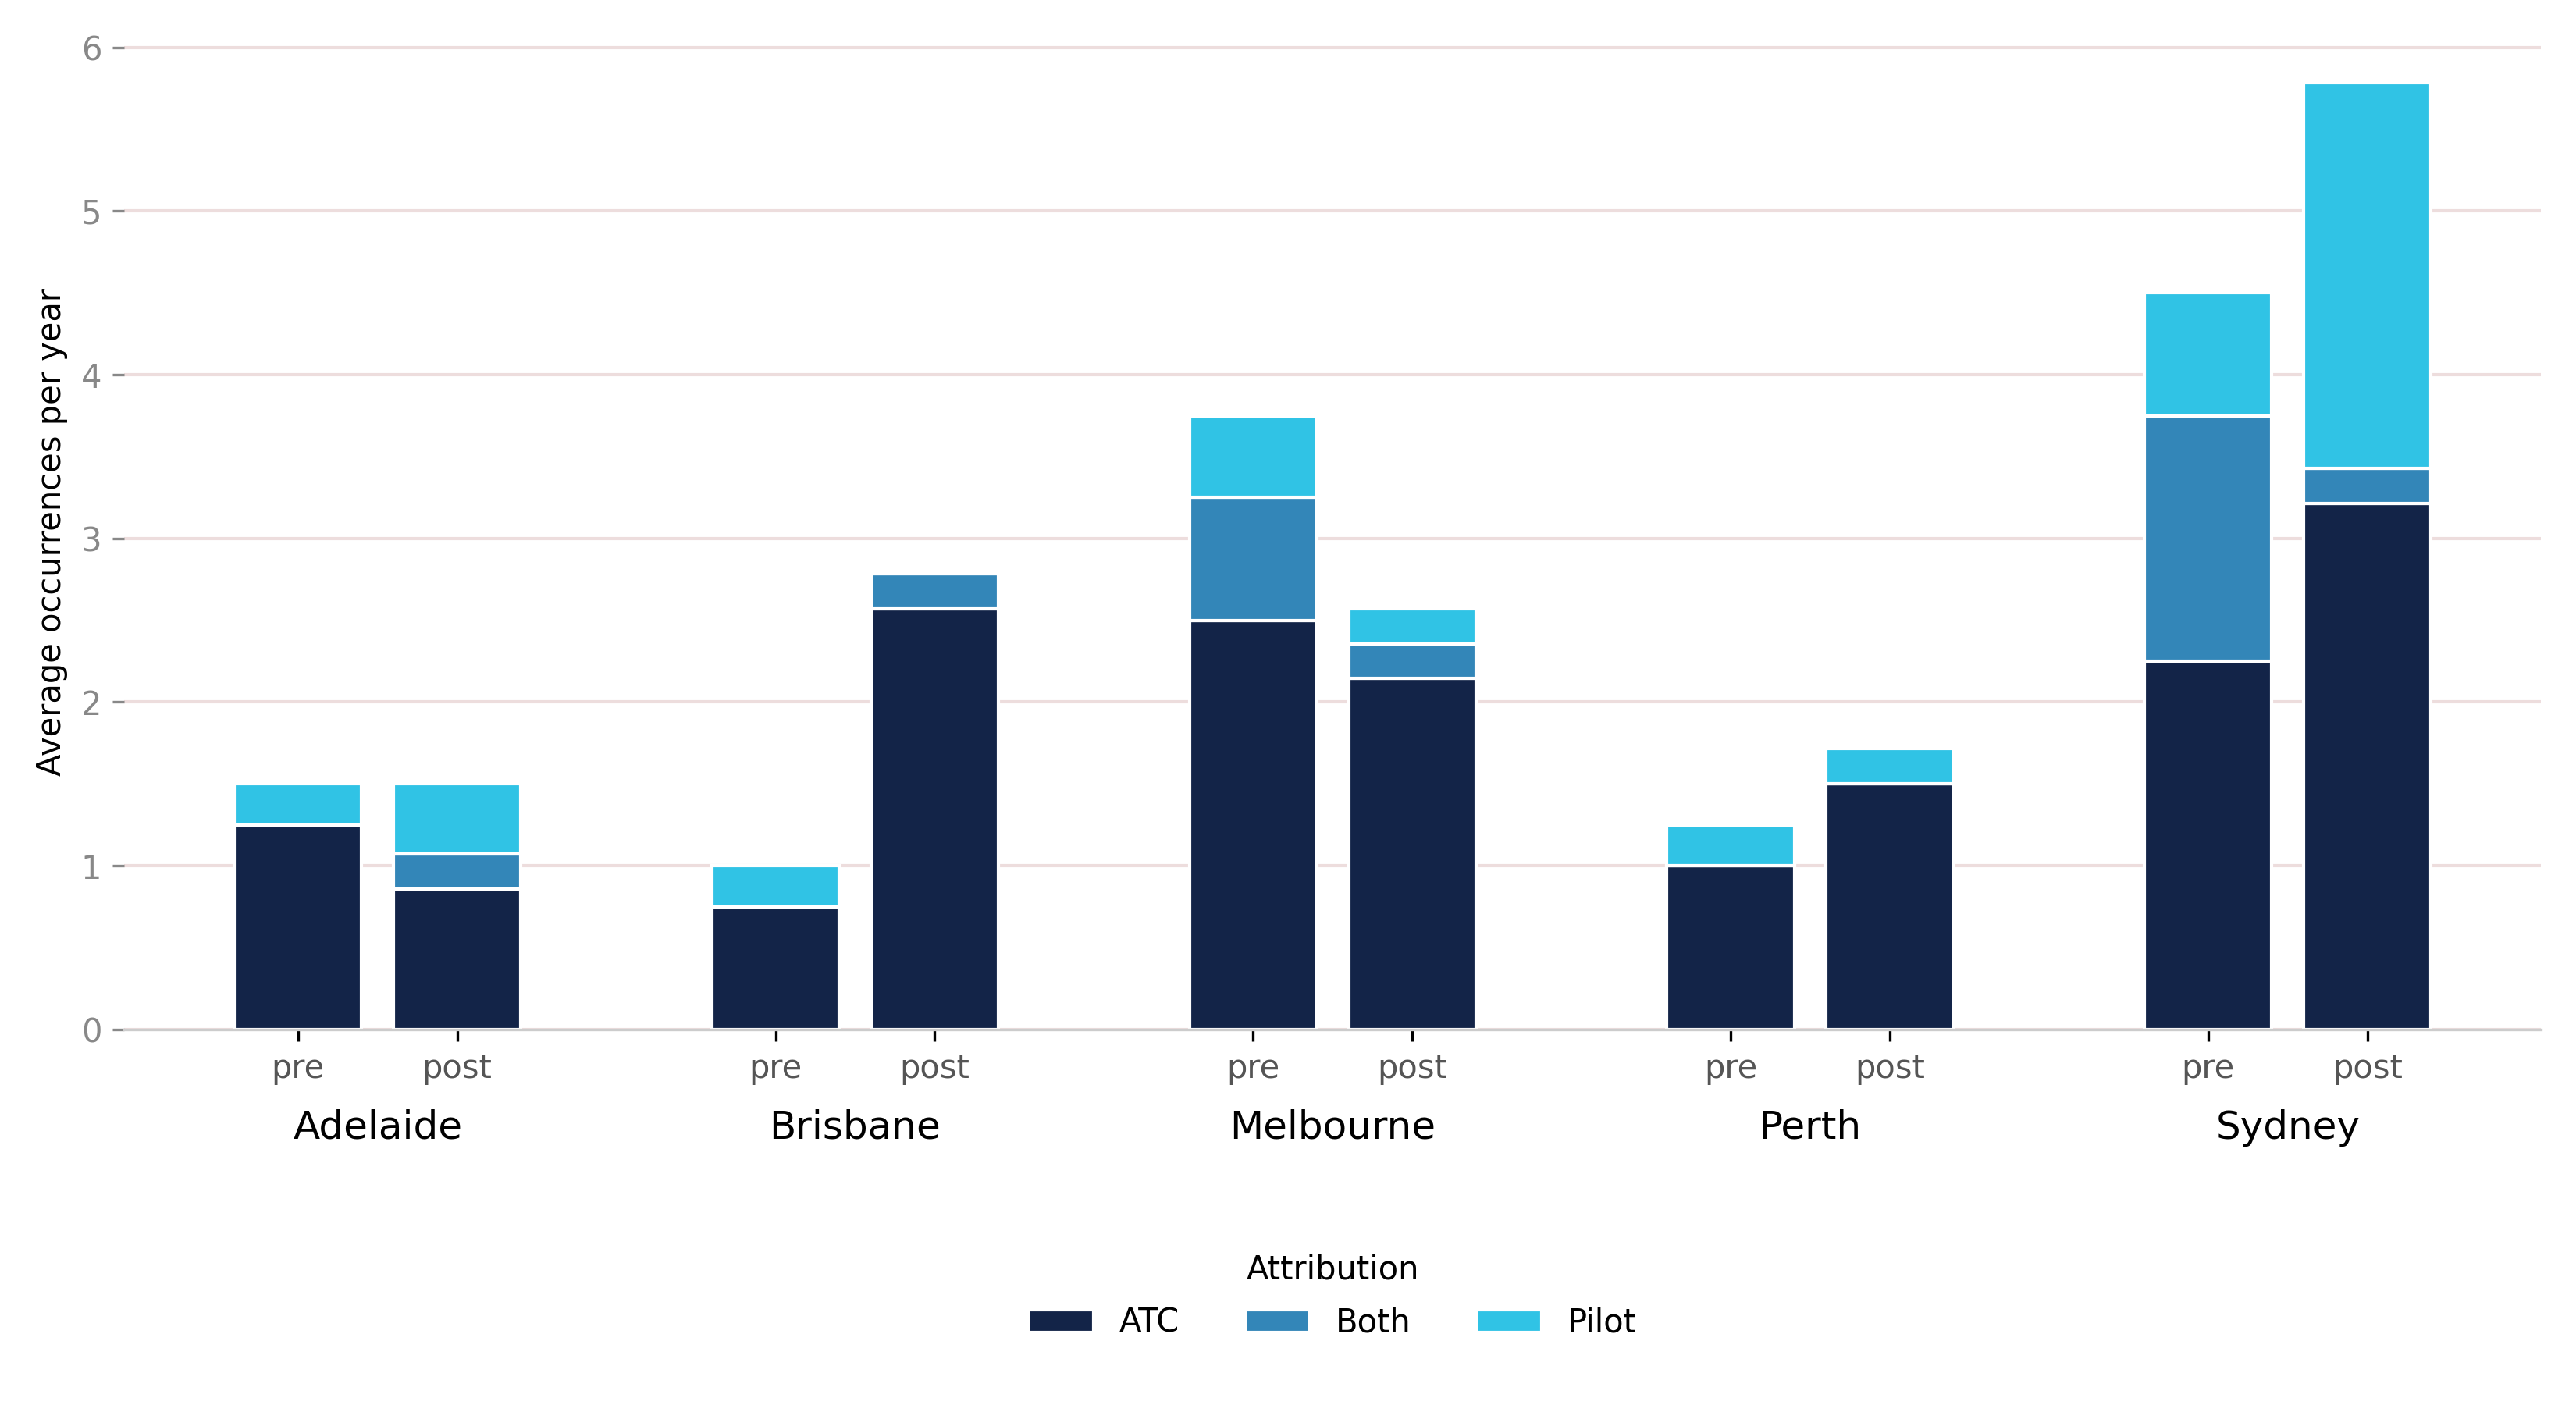
While the proportion of ATC‑attributable runway incursions and loss of separation occurrences increased post-COVID at both the 5 major airports and at Sydney individually, neither was found to be statistically significant.
Severity
Of the 599 confliction occurrences in Australia between 2016 and 31 August 2026, 106 had a category of taxiing collision/near collision associated with them. Around 33% occurred in the pre-COVID period with around 66% post-COVID. During the 10-year period, nearly 80% of taxiing collisions/near collisions required avoiding action from at least one of the aircraft involved.
Just over half (51%) of the 106 reported taxiing collisions/near collisions occurred at Sydney Airport. Of those that required avoiding action, Sydney Airport reported over half (52%). In total, 40% of all taxiing collisions/near collisions occurred at Sydney Airport and required avoiding action (Figure 6).
Figure 6: Average annual taxiing collision/near collision occurrences by location pre- and post-COVID, 2016–2026
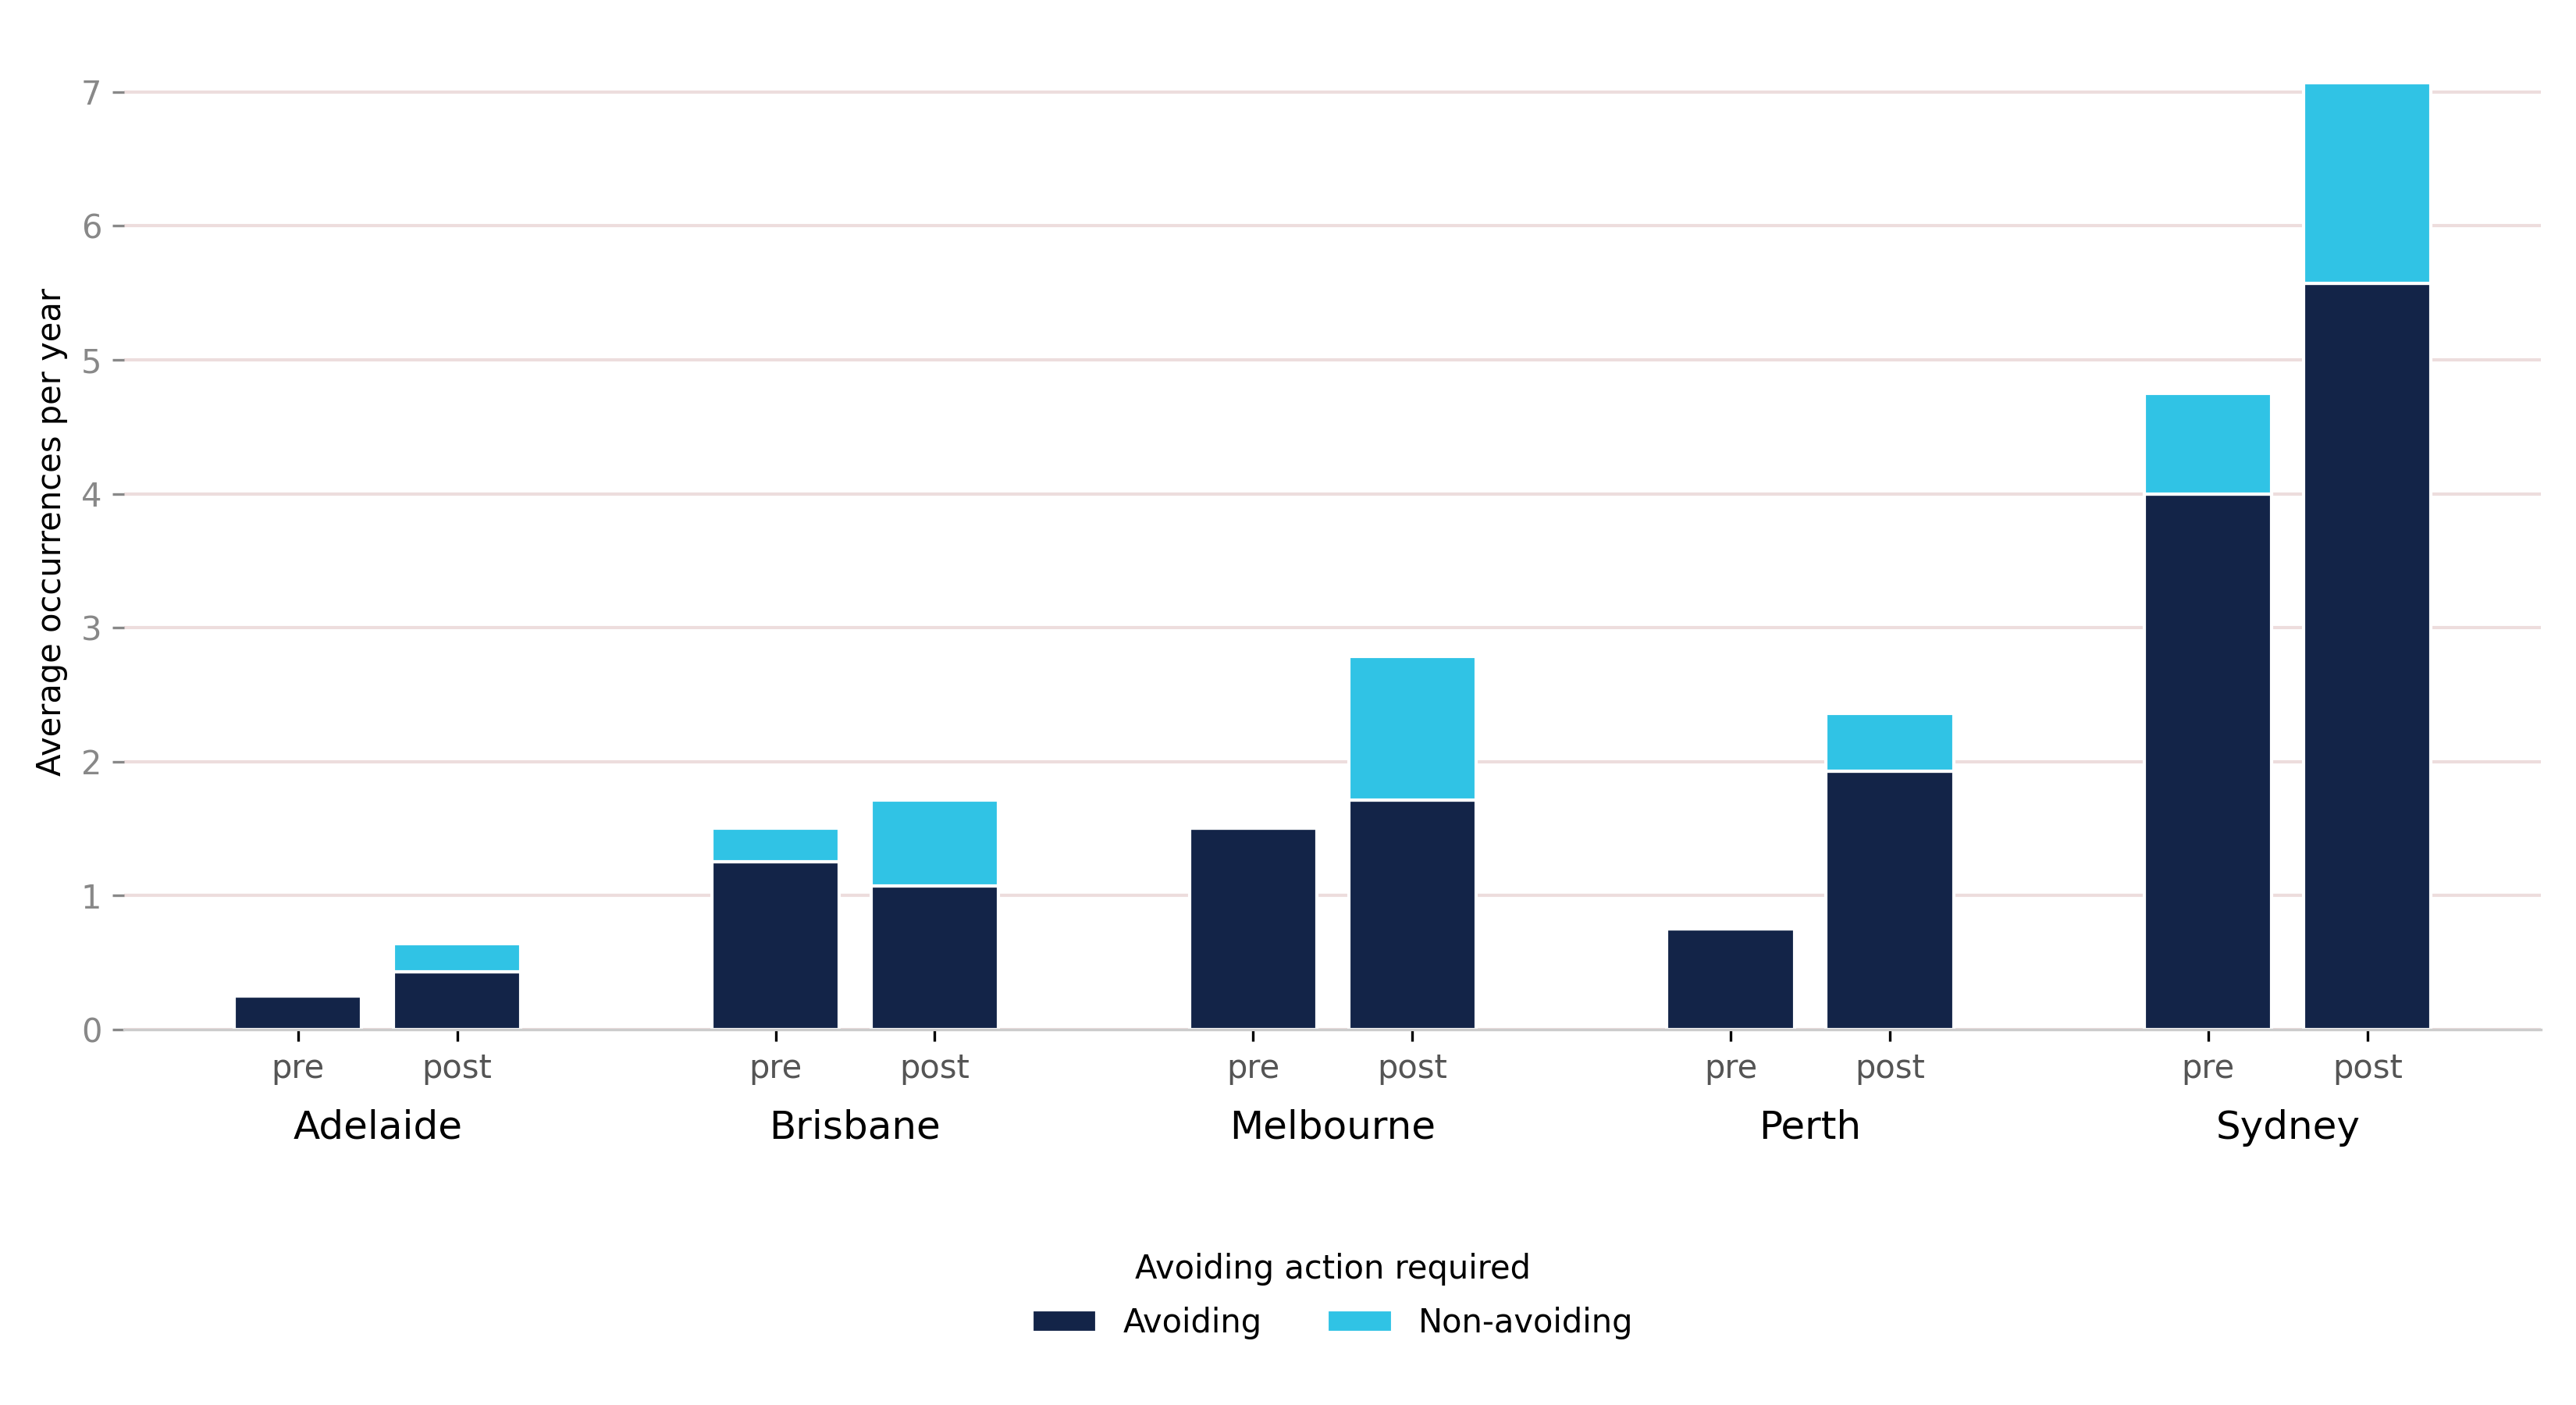
Average annual rate is calculated by dividing the total occurrences for the period by the number of months in the period, then multiplying by 12 (months).
Runway incursion severity
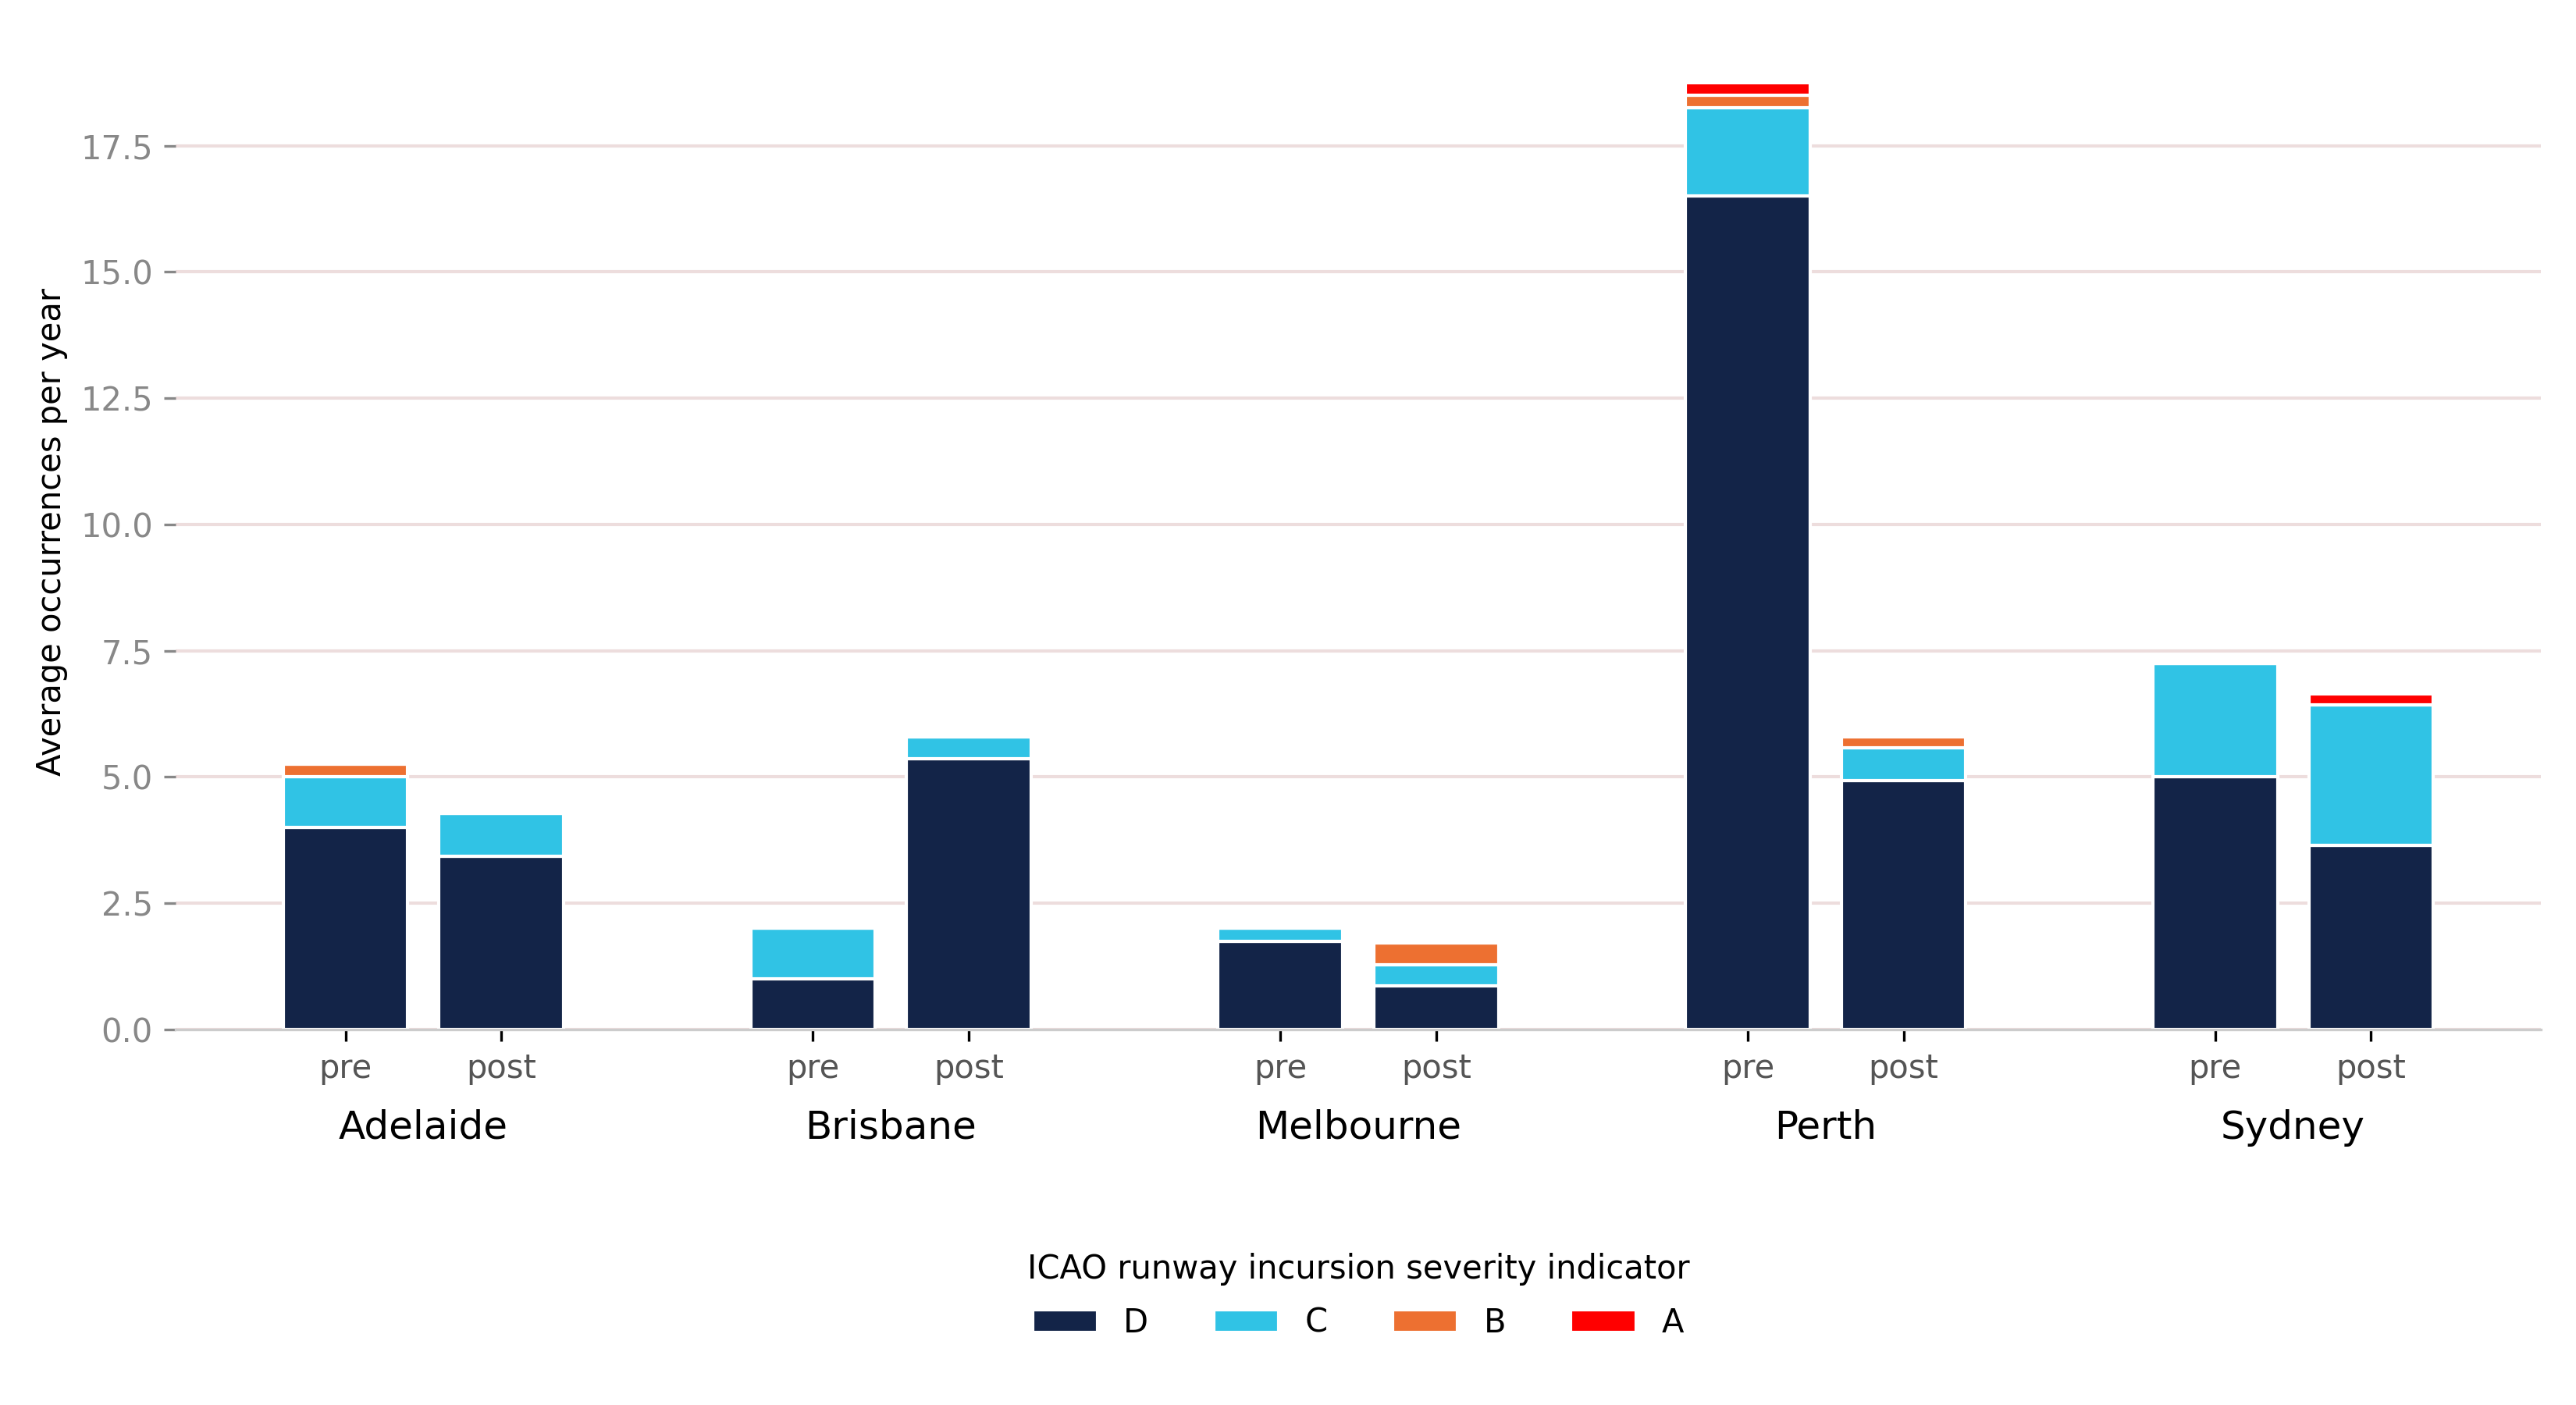
The ICAO runway incursion severity indicator is used to assign a value to runway incursion occurrences which describes how impactful the incursion was (Appendix A, Incursion severity).8 Perth’s pre-COVID occurrences were elevated due to the commissioning of stop bars in 2018 (Appendix B). Sydney’s runway incursion occurrence counts did not change significantly pre- to post-COVID (a decrease from 20 to 17), although the proportion of category C severity occurrences increased slightly from 9 to 13, and the airport recorded its first category A severity occurrence (Figure 7).9
Figure 7: Average annual runway incursion occurrences by severity for each location pre- and post-COVID, 2016–2026
Collision risk
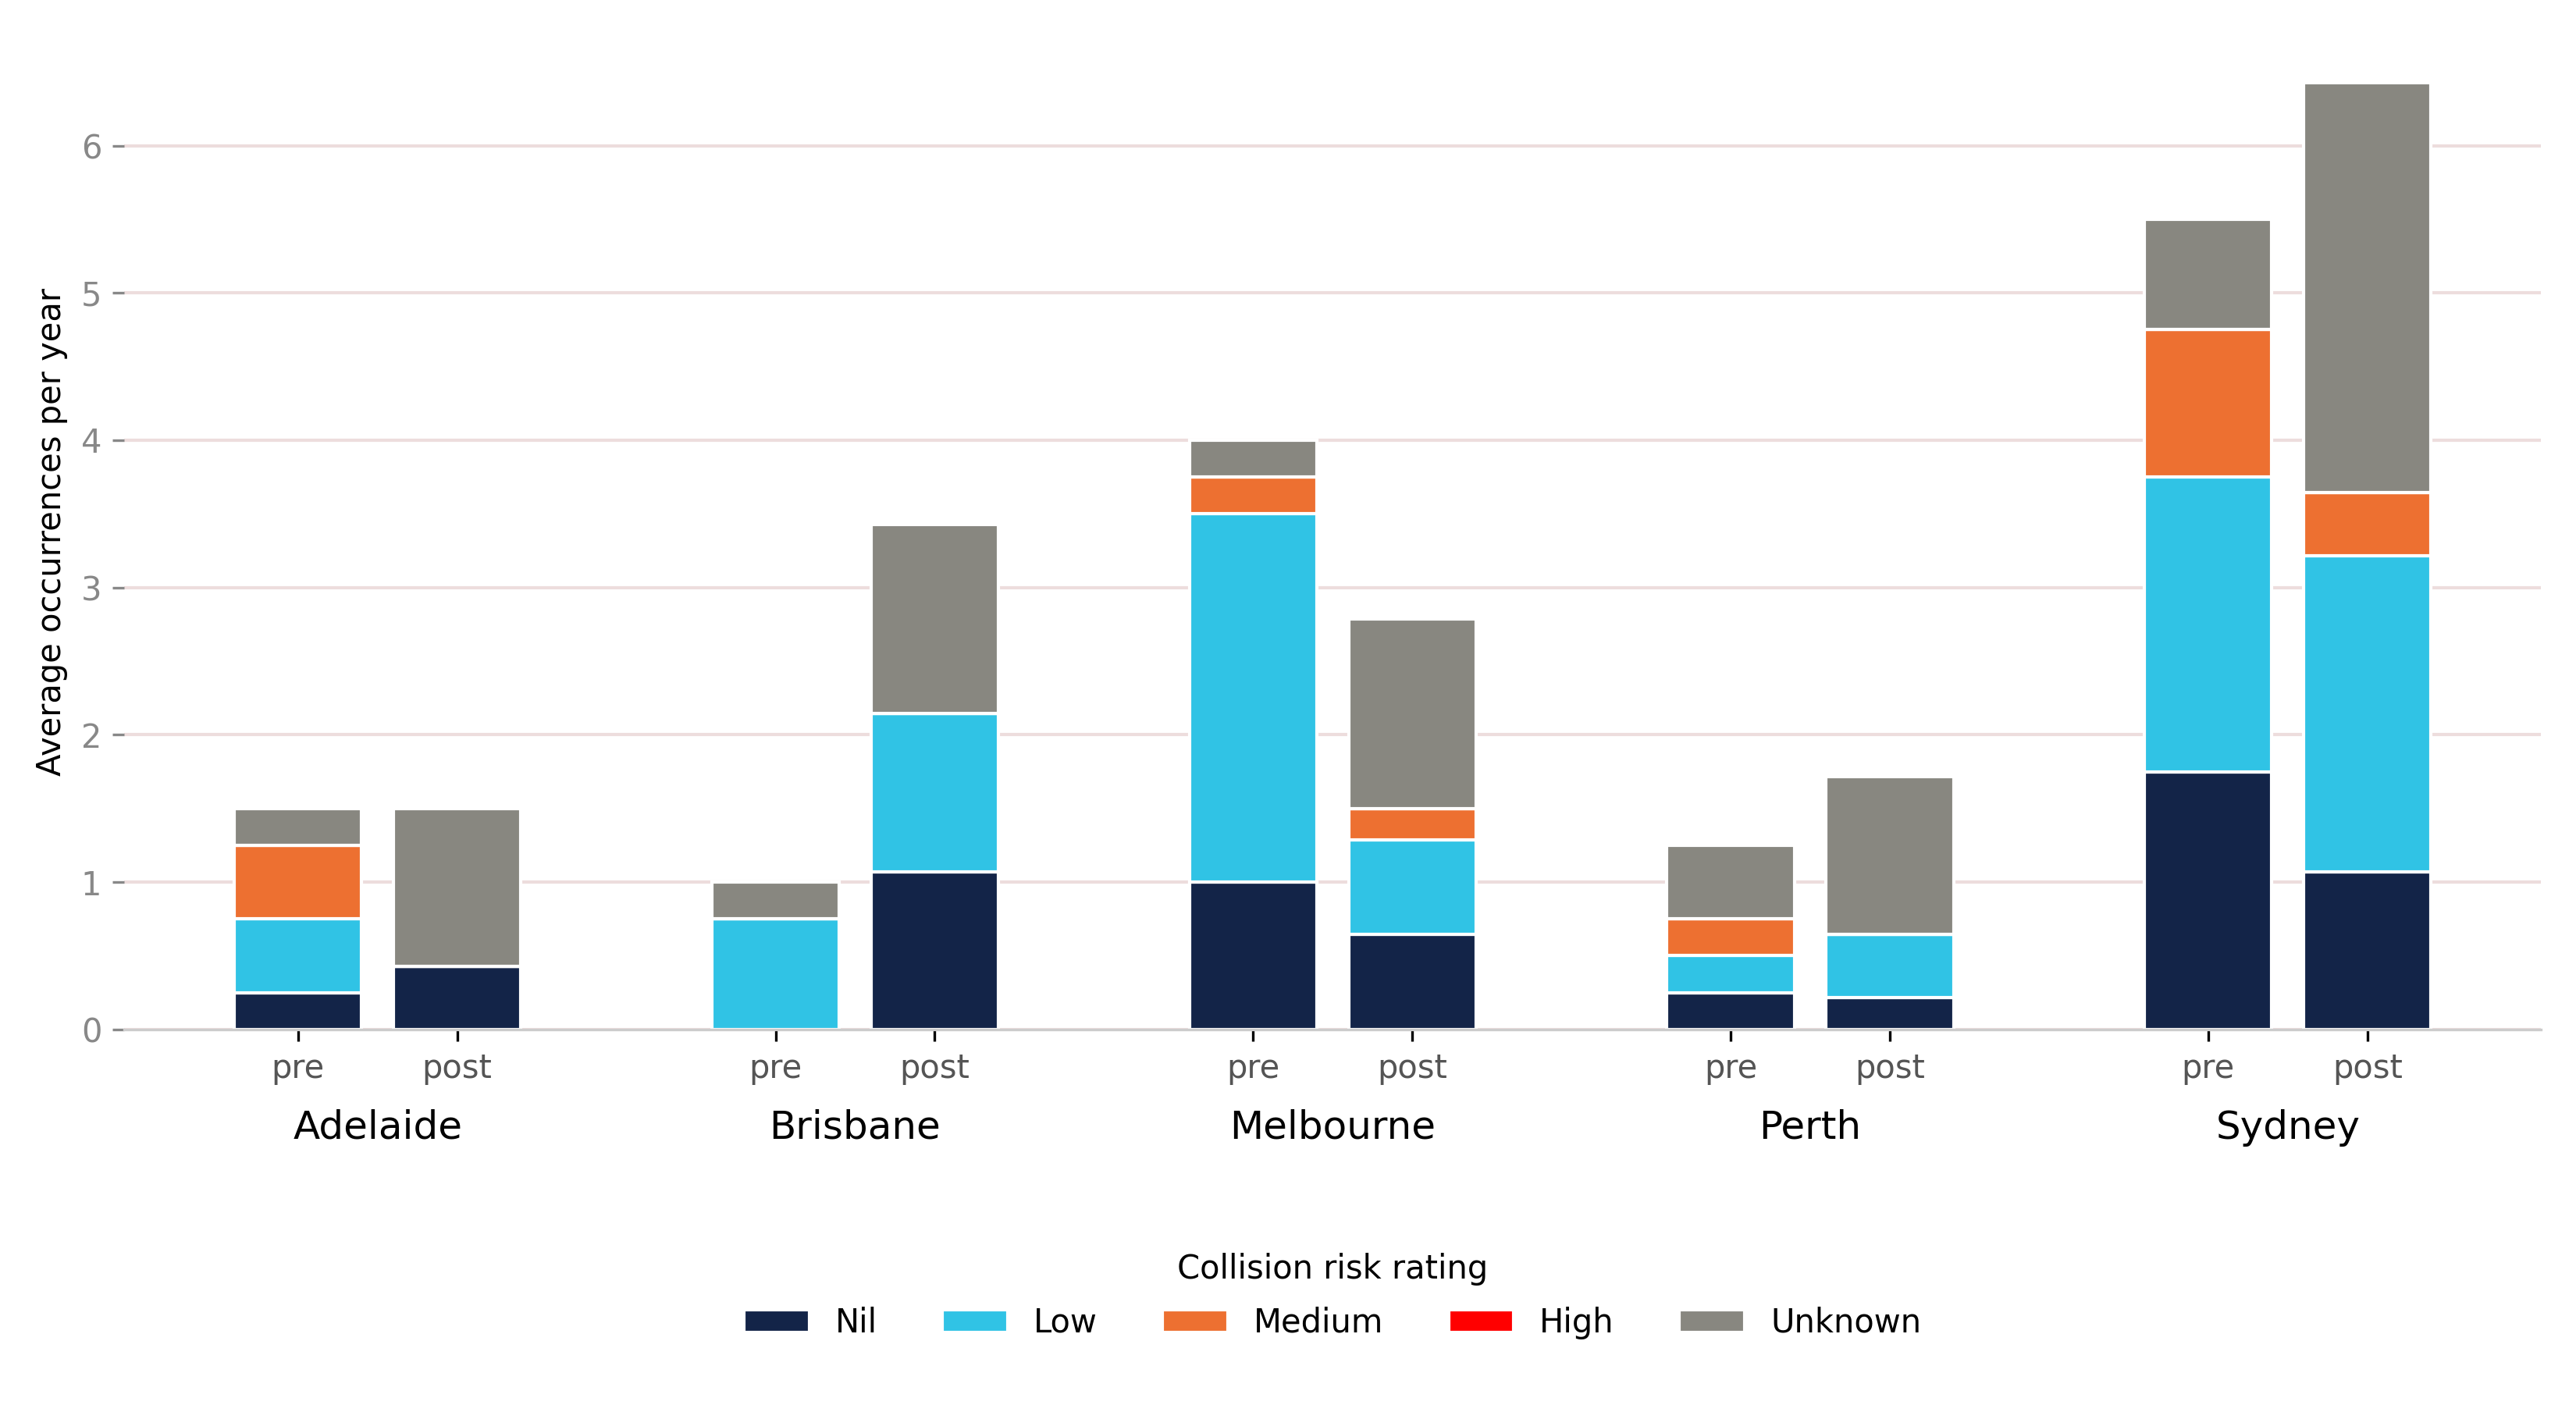
Loss of separation occurrences are coded in the ATSB occurrence database with a collision risk rating (where it is known).10 Collision risk ratings are nil, low, medium and high. There were no loss of separation occurrences with a collision risk rating of ‘high’ reported at any of the major airports during the 2016 to 2026 period. While the average number of loss of separation occurrences per year has increased in Sydney from pre- to post-COVID, occurrences with a known collision risk rating have decreased, including a noticeable decrease in medium risk loss of separation collision risks (Figure 8).
Figure 8: Average annual collision risk rating for loss of separation occurrences at each location pre- and post-COVID, 2016–2026
Information and procedural errors
Information and procedural error categories are recorded on occurrences where the delivery or display of operational information by air traffic service officers is erroneous. These categories are typically recorded with another category indicating the occurrence outcome, such as runway incursion or loss of separation.
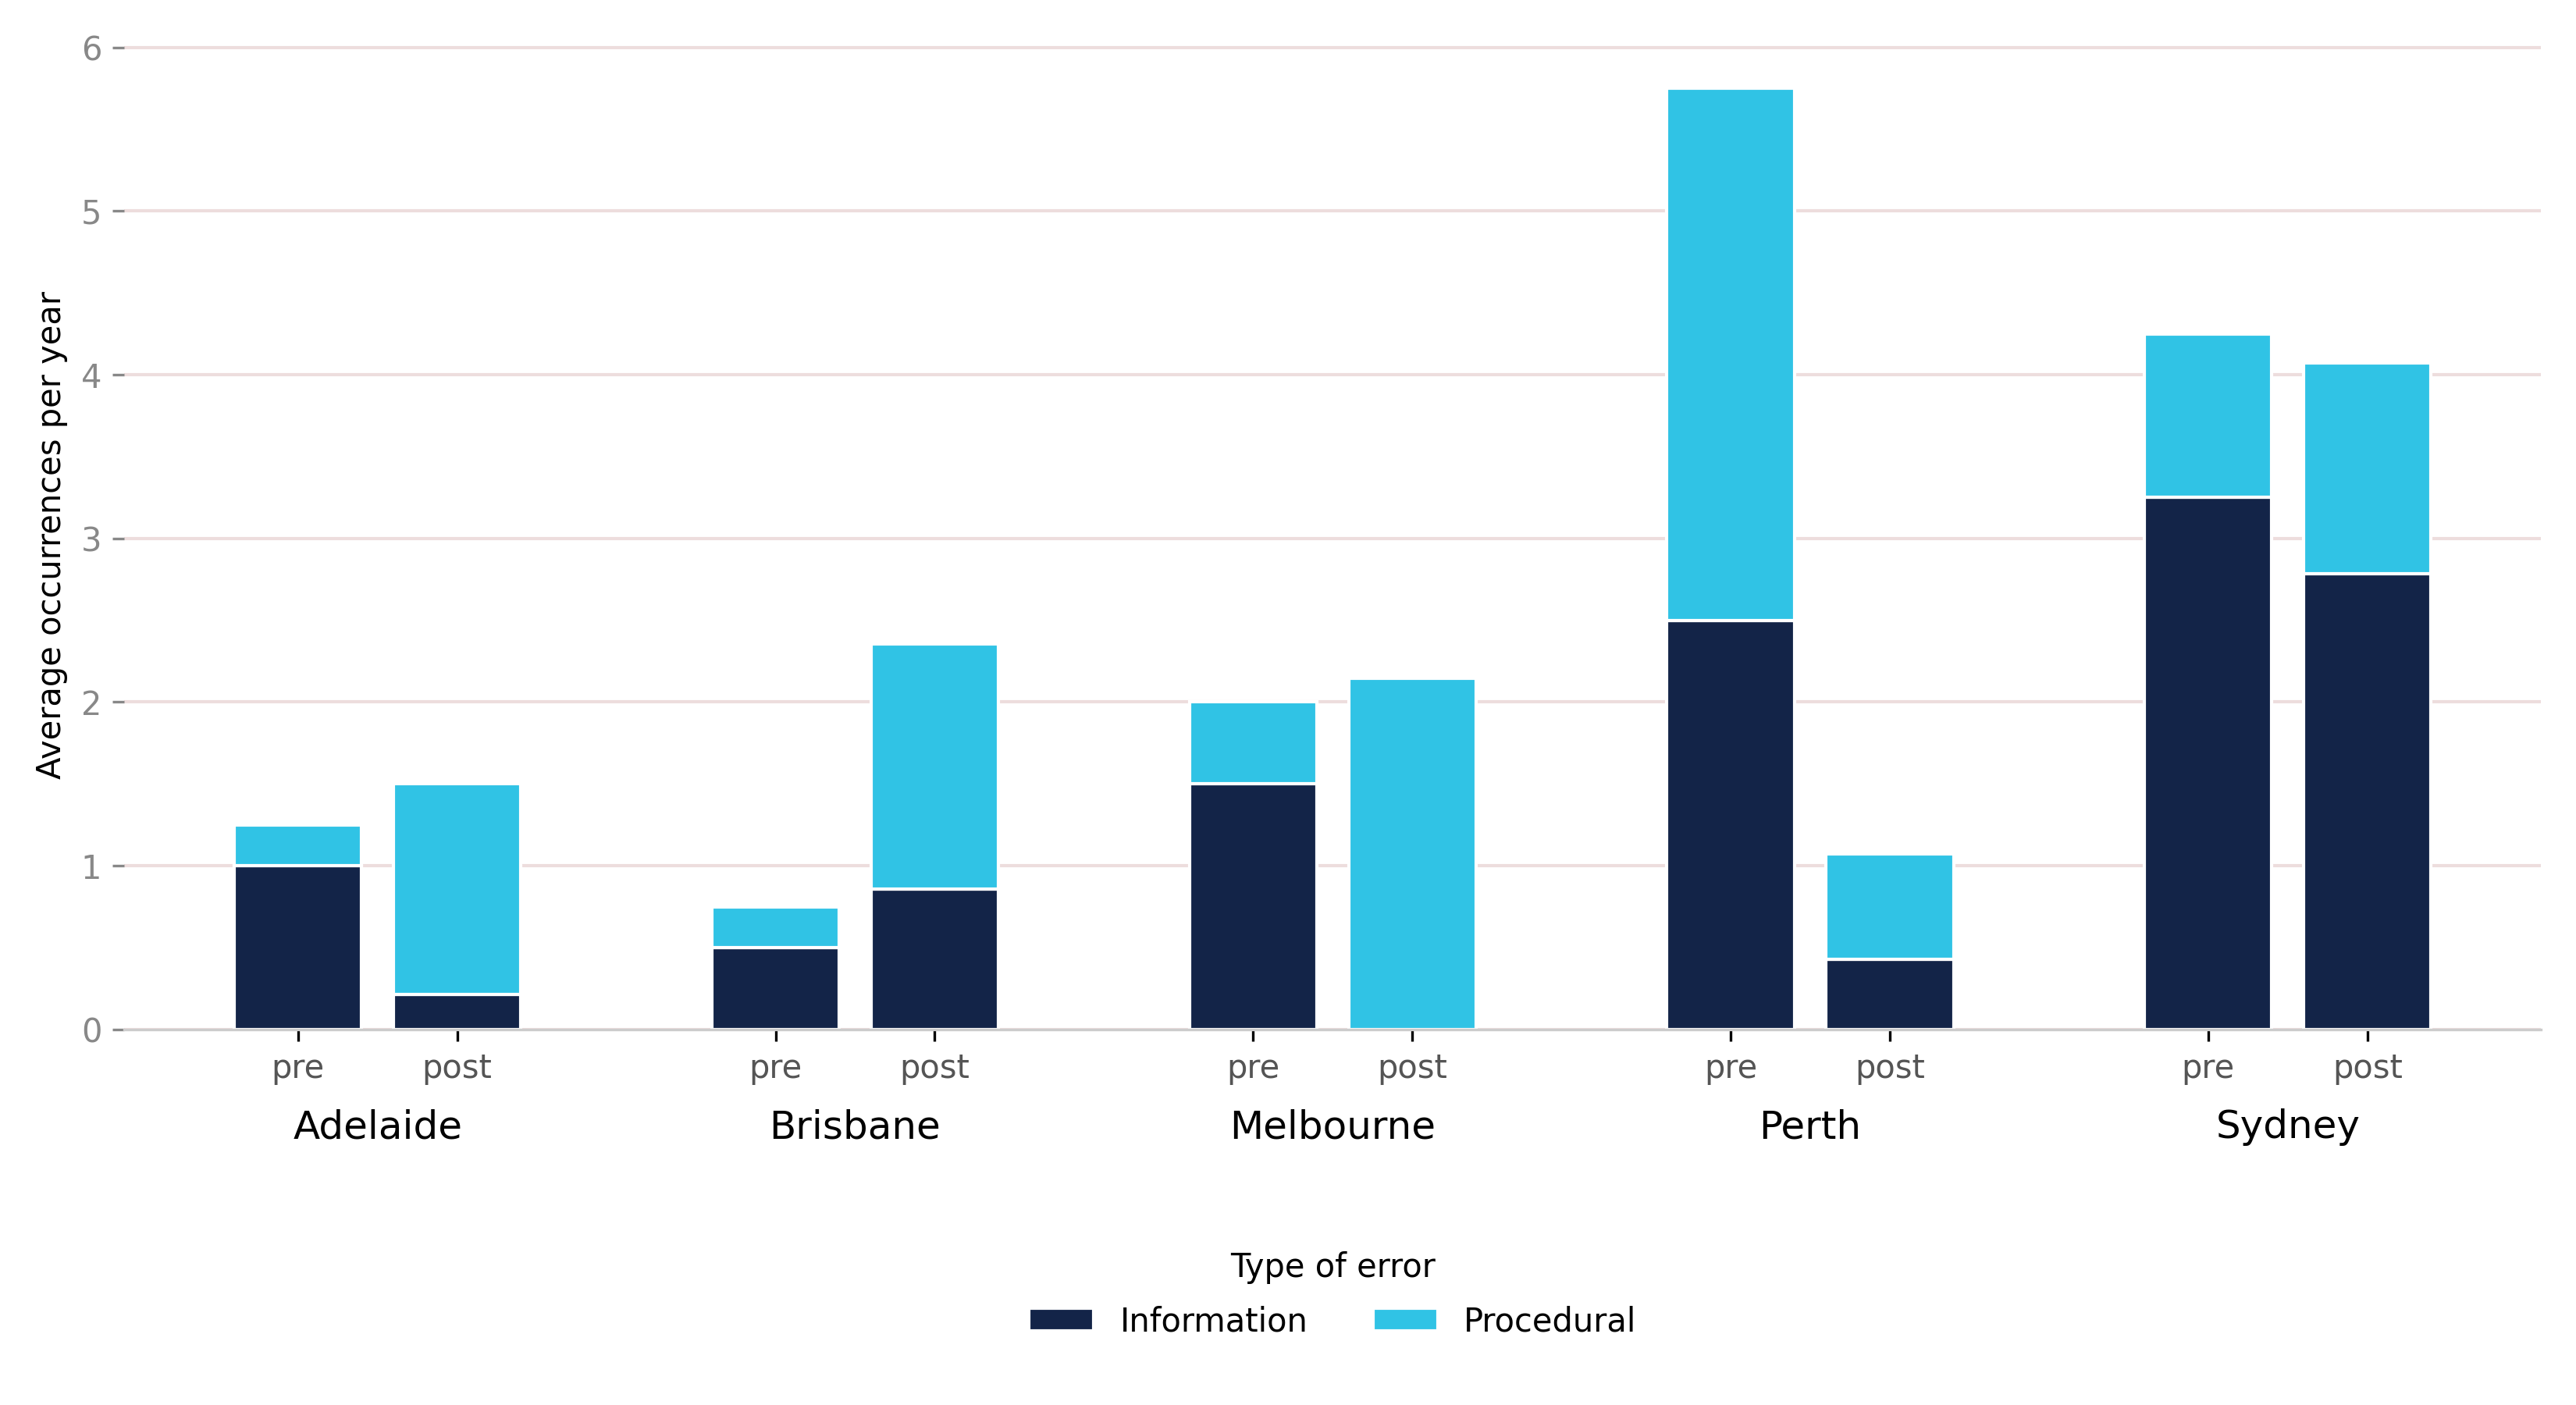
The high rate of pre-COVID occurrences in Perth was due to the installation and commissioning of stop bars, as discussed in Appendix B. Excluding these Perth occurrences, there were double the number of ANSP information and procedural errors at Sydney compared to the other airports. While the average annual occurrence rate in Sydney decreased post-COVID, the decrease was in the rate of information errors, with a similar increase in the rate of procedural errors (Figure 9).
Figure 9: Average annual ANSP information/procedural error occurrences at each location pre- and post-COVID, 2016–2026
Occurrences at Sydney Airport in 2026
The analysis in the Comparison of major airports section did not identify Sydney as an outlier compared to the other major airports across the study period. This section concerns the more recent period at Sydney for which movement data was unavailable, examined after an increase in confliction occurrences was identified.
Occurrence count
During July and August 2026, 11 confliction occurrences were reported at Sydney Airport, compared with around 3 expected based on movements. These 11 comprise half of the 21 occurrences at Sydney between January and August 2026.
This section reports occurrence counts rather than rates.
Against Sydney’s own history of occurrences, 11 occurrences was well outside its normal range (Figure 10). Across the 127 overlapping 2-month periods between January 2016 and August 2026, Sydney averaged 3.1 occurrences per 2-month period.
Figure 10: Number of 2-month periods with specified occurrence count at Sydney Airport, 2016–2026
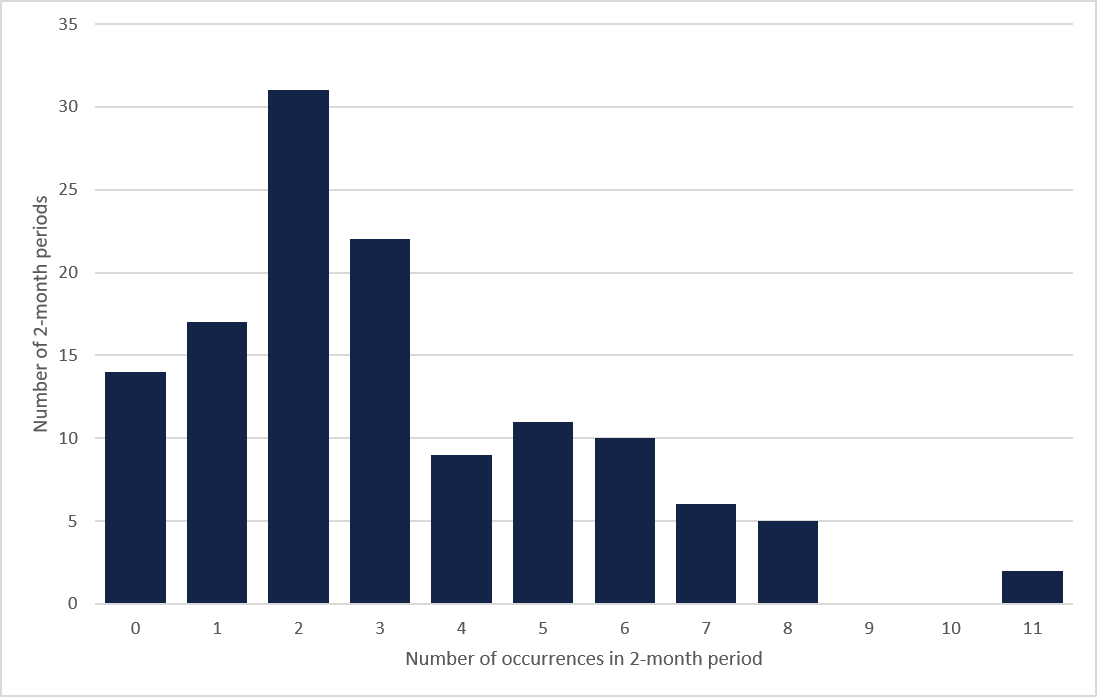
Measured against the 2 years immediately preceding, when Sydney averaged 1.5 occurrences per month, 3 would have been expected in a 2-month period.
Two periods in the dataset reached above 8, both with 11 occurrences – July–August 2026, and June–July 2022. The July–August 2026 2-month total is comprised of 4 occurrences in July and 7 in August (Figure 11).
Figure 11: Number of months with specified occurrence counts at Sydney, 2016–2026
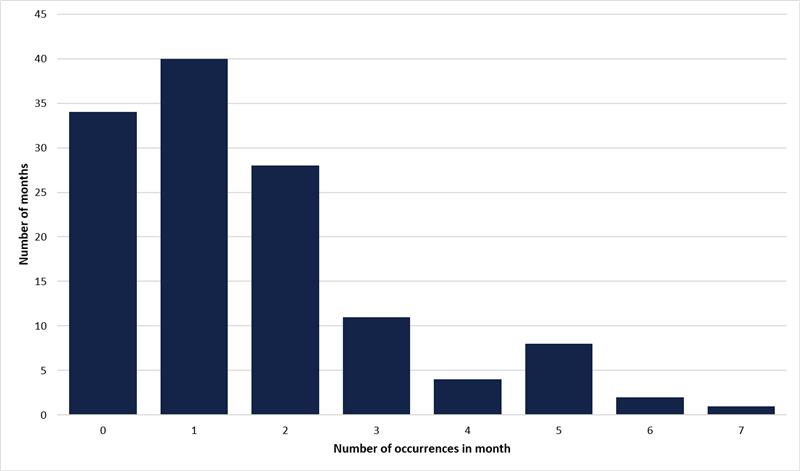
Across the 128 months from January 2016 to August 2026, Sydney averaged 1.6 occurrences a month. In 15 of those months, 4 or more occurrences were reported, or about 1 month in 8. Five or more were reported in 11 of the months.
The highest monthly total recorded is 7 in August 2026. Two other months recorded 6 occurrences (June 2022 and August 2023). July 2026, at 4 occurrences, falls within the range recorded in 1 month in 8.
What distinguishes July–August 2026 is that 2 elevated months fell consecutively. That has also occurred once before. June 2022 recorded 6 occurrences, and July 2022 recorded 5. April 2026 was also elevated individually, recording 5 occurrences.
Severity
Three of the 11 July–August 2026 occurrences were runway incursions, which are classified for severity (Appendix A, Incursion severity). One occurrence was rated as category A – a serious incident in which a collision was narrowly avoided.1111 The other 2 occurrences were category C and D, denoting occurrences with ample time or distance to avoid a collision, and those with no immediate safety consequences.
The category A occurrence recorded in July 202612 was the first in that category recorded at Sydney since severity began to be measured in 2003. There were no occurrences with a runway incursion severity category A or B recorded at Sydney between January 2016 and June 2026. The remaining 8 occurrences were non-runway incursion conflictions. Pilot or driver action was identified as a factor in the 3 taxiing collision/near collision occurrences, requiring braking or manoeuvring to avoid collision. ANSP operational errors accounted for 4 confliction occurrences, 3 of which required the pilots to bring their aircraft to a stop; the fourth was a confliction on pushback with an aircraft taxiing behind. In the eleventh reported confliction occurrence, the pilot declined take-off clearance due to concerns that the wake turbulence clearance would not be met.
Other airports
Across the 5 major Australian airports, 15 confliction occurrences were reported in July–August 2026; 11 of these were at Sydney. Two of the other 4 airports had no reported confliction occurrences in these 2 months. Brisbane had 3, and Adelaide 1.
Sources and submissions
Sources of information
The sources of information during the investigation included:
- ATSB occurrence database
- Airservices Australia Movements at Australian airports(Opens in a new tab/window) publications.
Appendices
Appendix A – Data and methodology
This report examines runway and taxiway confliction occurrences reported to the ATSB at 5 major Australian airports between 1 January 2016 and 31 August 2026. Occurrence data was extracted from the ATSB occurrence database. Traffic volume data is provided by Airservices Australia and extracted from the monthly Movements at Australian Airports reports13.
Airport selection
The airports examined in this analysis were selected because they comprise the 5 largest towered major Australian airports in terms of aircraft movements.
Occurrence counts
Each occurrence was counted once, on the date it took place, at the airport where it took place. Most occurrences involved more than one aircraft by the nature of the occurrence categories, and many involved more than one occurrence category; both were considered and corrected for in occurrence counts.
Rates and counts
Busier airports such as Sydney frequently record more occurrences simply because more aircraft use them. Additionally, traffic at all 5 major airports dropped significantly during the COVID-based travel restrictions in 2020 and 2021 before recovering during 2022.
When comparing all conflictions at the airports, this report expresses occurrences as a rate occurrences per 100,000 movements. A movement is an arrival or departure, so an aircraft that lands and later departs would register 2 movements. Movement figures exclude military traffic.
This report also refers to the expected number of occurrences, which is the number of occurrences that would have been recorded if the occurrences had been proportional to the movements involved. Comparing observed occurrences against expected is a clear way to see what stands out.
Overall rates for all 5 airports together were calculated by dividing total occurrences by total movements, not by averaging individual rates. This ensures that each airport’s contribution to the rate is proportional to its traffic.
When comparing types of occurrences (including the attribution and severity) at the major airports and over different periods, this report used the average number of occurrences per year, as this was considered a better indicator for the relative level of stress of the airport systems.
2026 movement data
Published monthly movements data was available to the end May 2026. Occurrence data was available to the most recent occurrence and was extracted to the end of August 2026 to ensure capture of the most recent confliction occurrences.
Projected movement counts for June to August 2026 were estimated by first calculating the proportion of January–May movements to January–August movements for each year unaffected by COVID travel restrictions (2016–2019 and 2023–2025). If all months recorded equal movements, the expected proportion would 0.625, or 5 months (January–May) divided by 8 months (January–August). The pooled result for all years at each location was within 1% of the expected proportion. Next, the total movements for January–May were divided by the calculated proportion to estimate the total movements for the June–August period. Individual months were then calculated using a similar method. The proportion of each month in the available data was calculated, then multiplied by the projected total for the June–August period.
Occurrences at Sydney Airport in 2026 examines July and August 2026 at a single airport. Because published movement figures were not available for those months, that section reports occurrence counts rather than rates. Traffic at Sydney has been stable across recent years so comparing counts between 2-month periods at the same airport is reasonable without adjusting for movements.
Because 2026 is a part year with respect to occurrence and movement data it was excluded from annual tables and shown separately where relevant.
Incursion severity
Runway incursions were classified for severity using the ICAO standard scale (Table 4):14
Table 4: ICAO Runway incursion severity indicator definitions
| Category | Definition |
| A | A serious incident in which a collision is narrowly avoided |
| B | An incident in which separation decreases and there is significant potential for collision, which may result in a time-critical corrective/evasive response to avoid a collision |
| C | An incident characterised by ample time and/or distance to avoid a collision |
| D | An incident that meets the definition of runway incursion such as the incorrect presence of a single vehicle, person or aircraft on the protected area of a surface designated for the landing and take-off of aircraft but with no immediate safety consequences |
| E | Insufficient information or insufficient or conflicting evidence precludes a severity assessment |
Category E is not considered a level of severity, only an indicator of a lack of information necessary to classify severity. No reported runway incursion occurrences during the study period had an E indicator.
Severity classifications for all category A, B, and C runway incursions across the study period were reviewed during preparation of this report. The review was applied uniformly across the whole period, including recent occurrences.
This classification system applies to runway incursions only. Other confliction events (including taxiing collisions/near collisions, loss of separation, and air navigation service provider (ANSP) errors) do not carry a comparable severity rating in the available data and are reported by frequency alone.
Confliction occurrences
Confliction occurrences extracted from the ATSB database include collisions and near collisions, loss of separation (where at least one aircraft is on the ground), loss of separation assurance, taxiing collision or near collision (involving an aircraft and/or vehicle and excluding collisions with buildings, fences, and other immobile structural or natural objects), runway incursions, air navigation service provider errors (including failure to pass traffic and information and procedural errors), breakdown of coordination, and general separation issues involving one or more aircraft on the ground. Consequential events arising from conflictions include missed approach and go-arounds and rejected take-offs.
Statistical methods
Occurrence counts were treated as following a Poisson distribution, which describes counts of relatively rare events.
Comparisons between years or periods use the ratio of the 2 rates using the Fisher exact test. Comparisons between airports use a chi-squared test to establish whether the airports differ overall, followed by adjusted residuals to identify which location(s) account for any difference. An adjusted residual expresses how far an observed total sits from its expected total in units of the variation expected by chance. Values beyond plus or minus 2 are conventionally considered notable. Comparison of runway incursion occurrence attribution was conducted using a Fisher’s exact test. The test compared ATC-attributed with pilot-only attributed occurrences at a 0.05 significance level.
A difference is statistically significant when the probability of seeing a difference at least that large (assuming no changes) is below 1 in 20 (conventionally represented as p < 0.05). A result that is not statistically significant means that the data cannot confirm a real difference; it does not prove that none exists.
Where several comparisons were made at once, such as 5 airports or 10 years, a stricter threshold was applied because testing many things at once increases the possibility of a chance result appearing meaningful.
Occurrence counts vary more between years than a Poisson distribution alone predicts. Across the pre-2020 period, the variance was 2.8 times the mean, against approximately 1 for a Poisson process. Almost all of this was attributable to 2018. When excluding 2018 from the results the variance fell to 1.2, which is within the range expected by chance. Where a comparison in this report spans 2018, results are reported both with and without an allowance for this additional variation.
Limitations
Detection capability differs between airports and over time. Some runway incursions are detected because equipment makes them visible. Stop bars are a clear example – an aircraft crossing an illuminated stop bar produces a discrete and attributable event, whereas the same aircraft crossing an unmarked holding position depends on being observed and reported. The 5 airports in this study acquired this equipment at different times, and Appendix B describes the effect at Perth where recorded occurrences rose sharply following installation in 2018. Recorded rates therefore reflect detection capability alongside safety performance, and the 2 cannot be separated from occurrence data. This applies most strongly to comparisons between airports.
This report describes what was reported and where; it does not establish why. A higher rate at one airport may be a reason to conduct further analysis, not a finding about that airport’s safety management.
Rates are shown to 2 decimal places; totals may not sum exactly due to rounding.
Appendix B – 2018 increase
The 2018 year had the highest rate of ground confliction occurrences, at 10.7 occurrences per 100,000 movements (111 occurrences recorded against around 57 expected based on movements), almost twice the expected number (p < 0.001) (Table 5).
Table 5: 2018 occurrences, movements, and rates for all major airports
| Location | Occurrences | Movements | Rate | Ratio |
| Brisbane | 12 | 211,344 | 5.7 | 1.3 |
| Melbourne | 15 | 245,526 | 6.1 | 1.7 |
| Adelaide | 5 | 105,018 | 4.8 | 0.8 |
| Perth | 42 | 130,482 | 32.2 | 3.8 |
| Sydney | 37 | 349,012 | 10.6 | 1.9 |
Perth had 42 occurrences in 2018 at 32.2 occurrences per 100,000 movements (nearly 4 times what its own history would predict), and the highest figure recorded by any airport in any year examined. Its elevated period continued into 2019 at 18.6 per 100,000 movements. By 2020 it returned to within its usual range, and since 2022 it has been comparable to the other major airports.
Measured against their own records, 4 of the 5 airports recorded an elevated year in 2018 (Perth at 3.8 times, Sydney at 1.9, Melbourne at 1.6, and Brisbane at 1.3). Only Adelaide was lower than expected. The 2018 increase was not confined to Perth, although Perth accounts for the largest component of the increase.
Stop bars
Part of the increase at Perth can be accounted for by the installation of stop bars (lighting systems at runway hold positions switchable by air traffic control) which became operational at the airport during 2018. Stop bars require aircraft and vehicles holding adjacent to a runway to only enter the runway when they both receive a verbal instruction from ATC and the stop bar red light is switched off.15 Before the introduction of stop bars, a verbal instruction by itself allowed an aircraft or vehicle to enter the runway.
At Perth airport in 2018 and 2019, 53 of the 67 occurrences reported mentioned stop bars (31 and 22 respectively). The figure then fell to between 2 and 7 a year and has remained there. Almost all were behavioural in nature (an aircraft or vehicle crossing an illuminated stop bar after verbal clearance was received) with a small number indicating unanticipated equipment operation such as malfunction. It has been identified that stop bars are on a timer, and when turned off by air traffic control, may reactivate before the aircraft arrives, despite having verbal clearance to proceed.16
One explanation is that the capacity to detect these events changed, rather than the frequency with which they occurred. Occurrences at Perth that did not involve stop bars did not rise during 2018 and 2019, they fell slightly. Before installation, an aircraft crossing a holding position without clearance depended on being observed and reported, whereas crossing an illuminated stop bar is a discrete and attributable event. The elevated period lasted 2 years and then ended, which is consistent with a new and initially unfamiliar system rather than with a deterioration that reversed itself.
This does not account for the elevated figures at Sydney and Melbourne in 2018, both of which had stop bar systems in place well before the study period.
About the ATSBThe Australian Transport Safety Bureau is Australia’s national transport safety investigator. Established by the Transport Safety Investigation Act 2003 (TSI Act), the ATSB is an independent statutory agency of the Australian Government and is governed by a Commission. The ATSB is entirely separate from transport regulators, policy makers and service providers. The ATSB’s function is to improve transport safety and public confidence, in aviation, marine and rail, through:
The ATSB’s sole focus is the prevention of future accidents and the improvement of transport safety, and prioritises investigations that have the potential to deliver the greatest public benefit. The ATSB performs its functions in accordance with the provisions of the TSI Act and Regulations and, where applicable, international agreements. About ATSB reportsATSB data and statistics reports are developed in accordance with ATSB procedures and guidelines, and with regard to applicable international standards and instruments. Reports must include factual material of sufficient weight to support the investigation’s analysis and findings. At all times the ATSB endeavours to balance the use of material that could imply adverse comment with the need to properly explain what happened, and why, in a fair and unbiased manner. An explanation of ATSB terminology used in this report is available on the ATSB website. |
- ^ Runway incursion severity classification based on information known at the time of publication.
^ REPCON RA2022-00045 - Sydney TCU staffing and operational concerns (multiple reporters).
REPCON RA2023-00003 - Staffing levels at Sydney TCU (multiple reporters).
REPCON RA2023-00192 - Proposed Restricted En Route Conditional Endorsement as a solution to Traffic Information Broadcast by Aircraft and controller staff shortages.
REPCON RA2026-00057 - Airservices Australia's Fatigue Risk Management System (FRMS) adherence.
^ REPCON RA2026-00093 Sydney Terminal Control Unit (TCU) underprepared to safely manage complex airspace changes effective 9 July 2026.
REPCON RA2026-00071 - Sydney Terminal Control Unit training concerns.
REPCON RA2026-00087 - Western Sydney International Airport - training and airspace design concerns.
^ Investigation AO-2026-086 Air traffic control procedural error and serious runway incursion involving Bombardier DHC‑8, VH-QOC, and Boeing 737-800, VH‑XZG, at Sydney Airport, New South Wales, on 27 July 2026.
Investigation AO-2026-087 Taxiing proximity event involving Airbus A320, VH-VQJ, and Boeing 777, A7-BEU, at Sydney Airport, New South Wales, on 09/08/2026.
Investigation AO-2026-090 Air traffic control procedural error and runway incursion involving Boeing 737-8SA, VH‑IJQ, and Boeing 737-838, VH‑XZH at Sydney Airport, New South Wales, on 9 August 2026.
Investigation AO-2026-091 Taxiing conflict involving Airbus A321, VH-OGA and Boeing 737, VH-VXL, at Sydney Airport, New South Wales, on 18 August 2026.
Investigation AO-2026-092 Failure to pass traffic involving Airbus A320, VH-VFX, at Sydney Airport, New South Wales, on 25 August 2026.
Investigation AO-2026-093 Taxiing conflict involving Boeing 737, VH-IXJ, and Boeing 737, VH-VZV, at Sydney Airport, New South Wales, on 17 August 2026.
- ^ The types of safety occurrences that are required to be reported to the ATSB are prescribed by the Transport Safety Investigation Regulations 2003, as described on the ATSB website - Aviation reporting requirements.
- ^ A movement is defined as a take-off or landing.
- ^ Movement data was available until end of May and projected to end of August based on movements from previous years.
- ^ A means a collision was narrowly avoided; B means there was significant potential for collision, which may result in a time-critical corrective/evasive response to avoid a collision; C means there was ample time and/or distance to avoid a collision; D means there was no immediate safety consequences, and E is unknown.
- ^ Runway incursion severity classification based on information known at the time of publication.
- ^ Collision risk is calculated by the ATSB based on notifications from operators, air traffic control, or other parties. Sometimes, when these occurrences are not investigated by the ATSB, the collision risk rating may remain unknown.
- ^ Runway incursion severity classification based on information known at the time of publication.
- ^ See ATSB investigation AO-2026-086 Breakdown of coordination involving Bombardier DHC-8, VH-QOC, and Boeing 737, VH-XZG, at Sydney Airport, New South Wales, on 27 July 2026.
- ^ See https://www.airservicesaustralia.com/aviation-reporting/movements-at-australian-airports/(Opens in a new tab/window)
- ^ The International Civil Aviation Organization (ICAO) runway incursion severity classification scheme is defined in Chapter 6 and Appendix H of Manual on the Prevention of Runway Incursions (Doc 9870).
- ^ Airservices Australia – A guide to runway stop bars(Opens in a new tab/window).
- ^ See, for example, Yan, Y., Boufous, S., & Molesworth, B. R. C. (2025). Speaking of human factors: an interview study on the causes and prevention of runway incursions with aviation professionals. Safety Science, 190, https://doi.org/10.1016/j.ssci.2025.106913(Opens in a new tab/window)
Publication details
| Investigation number | AD-2026-005 |
|---|---|
| Publication type | Research and Analysis Report |
| Publication mode | Aviation |
| Publication date | 30/09/2026 |