

Final report
Report release date: 19/11/2026
Investigation summary
What happened
On 24 January 2023, at about 1839 local time, a Virgin Australia Airlines Boeing 737-800 aircraft, registered VH-YQM, was landing on runway 32 at Gold Coast Airport, Queensland, after conducting the required navigation performance authorisation required (RNP X RWY 32 (AR)) instrument approach. A thunderstorm was passing through the area, with reported heavy rain and dark conditions. The first officer was the pilot flying and the captain was the pilot monitoring.
The flight crew became visual with the runway at about 500 ft, which was above the decision altitude of 360 ft. As planned by the flight crew, the autopilot remained engaged below the decision altitude, and was subsequently disengaged when about 190 ft above ground level. When on late final approach, the flight crew recalled seeing the runway markings, but once in the flare they were unable to see the markings due to the runway being wet. They also noted that the aircraft floated during the landing.
Seconds after touching down, the thrust reversers and spoilers deployed, and autobraking activated. Almost immediately, the captain took over control and applied maximum manual braking and reverse thrust. The aircraft slowed within the confines of the runway with the reversers being stowed as it exited via the taxiway at the northern end of runway 32.
The flight crew suspected they had a long landing but were not sure as they were unable to see the touchdown zone markings during the landing. The captain submitted a report of a potential long landing, which was later confirmed by the operator from recorded flight data.
What the ATSB found
The ATSB found that, about 11 minutes before the aircraft landed, the local QNH changed, but the automatic terminal information service was not updated, nor was the change communicated to the flight crew by air traffic control. This resulted in the aircraft being about 35 ft higher than indicated. Although it was found that the ground-based precision approach path indicator (PAPI) was likely indicating that the aircraft was above the glidepath, the flight crew were very likely monitoring the glidepath information presented on the aircraft instruments below the decision altitude, rather than the PAPI. As a result, the flight crew did not correct the flightpath and the aircraft passed over the runway threshold about 37 ft above the PAPI indicated flightpath. This additional height added about 215 m to the distance travelled before touching down. However, this additional distance was not enough on its own to result in a long landing.
At a height of about 44 ft, the first officer initiated the flare manoeuvre. As this was about 24 ft above the recommended height of 20 ft, the aircraft floated rather than touching down at the end of the manoeuvre. This resulted in the aircraft travelling an additional 635 m before touching down. Combined with the distance from the aircraft being high on the approach, the aircraft touched down about 1,175 m beyond the displaced threshold, about 550 m beyond the latest point of touchdown, significantly reducing the available stopping distance.
The flight crew were unaware during the float that they had passed their last nominated touchdown point as they were unable to see the touchdown zone markers, the only visual aid to identify the touchdown zone. It was likely that the runway was covered by a film of water that made the surface reflective. Combined with the dark night conditions, this likely obscured the painted runway markings. It was likely that, when they touched down, the captain identified that there was insufficient runway remaining for the autobrake setting, so took manual control. Taking immediate control and applying maximum braking likely prevented a runway overrun.
It was also found that there were 2 opportunities for the flight crew to identify the potential for a long landing and conduct a go-around. However, the combination of conditions experienced on this and earlier flights resulted in a prolonged high workload that likely had an adverse effect on their performance. This was compounded for the captain who was also likely experiencing fatigue.
While the difference between the actual QNH and that transmitted on the ATIS did not directly contribute to the long landing, it was identified that the procedures and systems used by Airservices Australia did not ensure that the change was brought to the attention of the flight crew before or during the approach. Those procedures and systems relied on the controller identifying a change and updating the ATIS if that change was less than 2 hPa. However, the required navigation performance authorisation required approach was designed with a maximum error of less than 1 hPa. In this case, the change meant that the aircraft was high on the approach, but it could result in an aircraft being lower than indicated, leading to a reduced terrain clearance that was outside of the approach design tolerances.
The ATSB established that the runway markings at Gold Coast Airport did not contain any reflective material to enhance their conspicuity in dark wet conditions, nor were they required to do so. The International Civil Aviation Organization recommended that runway markings at aerodromes where operations take place at night should be made with reflective materials. However, the Civil Aviation Safety Authority did not include it in Civil Aviation Safety Regulations, or the associated guidance material to ensure that airport operators appropriately considered the safety benefit of the enhanced visibility in dark and/or wet conditions.
What has been done as a result
The ATSB has released a safety advisory notice encouraging operators of Australian aerodromes to consider including reflective materials in visual aid markings on runways that are used for night operations, particularly those where there is a reasonable likelihood of the runway also becoming wet.
Safety message
This incident highlights the critical role that visual aids, such as runway markings and visual glideslope indicator systems, play in the safe completion of a landing, particularly in adverse weather conditions. The guidance they can provide is ineffective if they are not visible, or not used appropriately.
It is also an important reminder that, below minimum prescribed altitudes, the vertical guidance from an instrument approach may not necessarily provide adequate precision on its own to ensure terrain clearance or tracking to the aiming point. Flight crew should take advantage of all the information that is available to them, particularly those that are providing the most accurate information for the phase of flight.
Also, although it did not contribute to the long landing, this incident highlights the importance of being provided with, and using, accurate QNH when conducting a 3‑dimensional instrument approach using barometric altitude for the vertical path reference. In this case, the error was such that the aircraft was high but could potentially have resulted in the aircraft being low, reducing the terrain clearance.
Finally, runway overruns are a significant threat to aviation safety, with long landings and not conducting a go-around the primary contributors. To reduce the likelihood of these factors, flight crews should maintain a ‘go-around mindset’ and should be ready to abort the landing and go around, should there be any doubts or concerns arise.
The occurrence
On 24 January 2023, a Virgin Australia Airlines Boeing 737-800 aircraft, registered VH‑YQM, was being operated on a scheduled passenger flight from Sydney Airport, New South Wales, to Gold Coast Airport, Queensland. The aircraft had departed Sydney at 1838 Eastern Daylight saving Time (1738 Eastern Standard Time).1 It was the third of 4 sectors that the flight crew operated on the day, the first 2 being completed on a Sydney–Ballina/Byron Bay–Sydney flight. For this sector, the first officer was the pilot flying and the captain was pilot monitoring.2 The cockpit jump seat was also occupied by a recently employed ex-Airbus A320 pilot, who was observing the flight in preparation for commencement of Boeing 737 conversion training.
On the day, most of the east coast of Australia was affected by rain and storms, but the flight crew reported that the climb and cruise were uneventful.
At 1752, while the aircraft was still climbing, the flight crew obtained the automatic terminal information service (ATIS)3 for Gold Coast Airport through the aircraft communications addressing and reporting system (ACARS).4 At that time, the ATIS was at ‘Romeo’ and indicated there were thunderstorms in the area.
A minute later, the flight crew again requested the ATIS through the ACARS, but this time also requested the ATIS for Brisbane Airport. The ATIS for Gold Coast had changed to ‘Sierra’ but still indicated thunderstorms in the area. The ATIS for Brisbane, which was at status ‘India’, did not include any significant weather issues, but did indicate delays for some departures. At 1801, the flight crew checked the ATIS for Gold Coast Airport on the ACARS again, finding that it had not changed and was still at ‘Sierra’.
Prior to the descent, in preparation for their arrival at the Gold Coast, the flight crew selected the approach they would use and completed the landing performance calculations on the Boeing Onboard Performance Tool.5 Given the conditions and the active runway at Gold Coast, the flight crew chose to use the Gold Coast runway 326 RNP X (AR) (required navigation performance – authorisation required)7 0.2 approach, rather than the 0.3 approach as it gave a lower decision altitude8 (360 ft versus 560 ft above mean sea level).
The landing performance calculations showed the flight crew that the landing distance available permitted the option of an autobrake 3, maximum autobrake,9 or maximum manual braking (in order of decreasing braking distance) landing. The flight crew selected autobrake 3, but due to the braking distance it required, they identified the second last touchdown zone marker as the latest point of touchdown. During the descent, the Gold Coast Airport ATIS changed to ‘Tango’. The flight crew became aware of the ATIS change through radio communications with air traffic control. It was not known if this resulted in a recalculation of the landing performance.
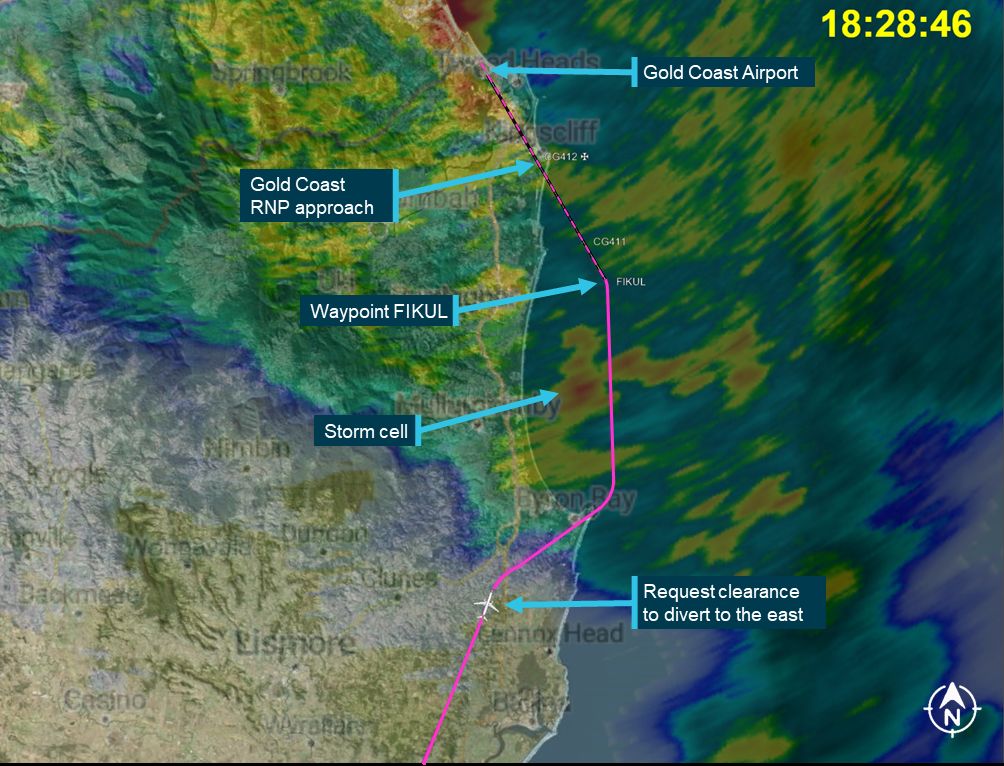
While descending and tracking towards the initial approach fix, waypoint ‘FIKUL’, the flight crew observed a Gold Coast bound Airbus A320 ahead of them divert to the right (eastward). Soon after, they identified on their weather radar a storm cell located between them and FIKUL and obtained a clearance from air traffic control to also divert around the storm (Figure 1). At 1832, air traffic control cleared the flight crew for the runway 32 RNP approach.
At 1834, the aircraft joined the RNP approach at FIKUL and was fully configured (landing gear down and landing flaps set) by 1836:38, when 7.5 NM (about 14 km) from Gold Coast Airport. At this point, the aircraft was in cloud with rain falling.
At 1838:23, while passing through about 950 ft, the Gold Coast tower controller cleared the aircraft to land, informing the flight crew that the wind was from 240° at 5 kt.
Figure 1: VH-YQM en route to waypoint FIKUL with weather radar overlay from 1829 showing storms between aircraft and FIKUL
The flight crew reported that they became visual with the runway at about 500 ft but were in heavy rain, with the windshield wipers set on high. They also noted that it was dark and that the runway lights were on. Both flight crew observed the preceding A320 taxi off the runway after landing ahead of them.
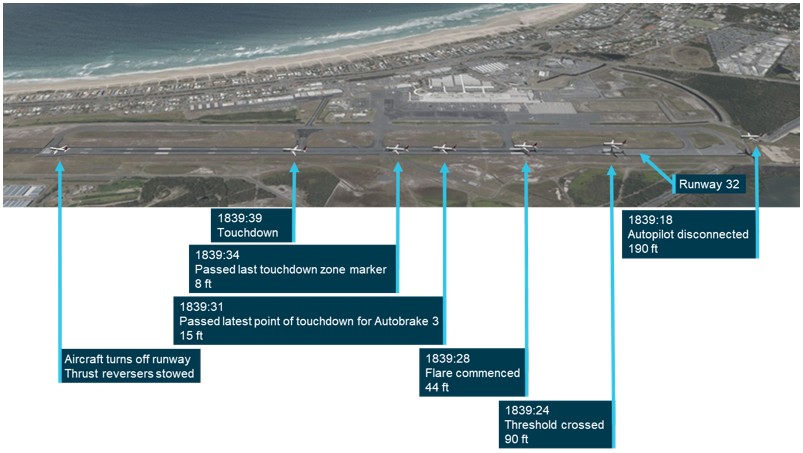
At 1839:18, as the aircraft was passing over the airport boundary, about 190 ft above ground level,10 the first officer disengaged the autopilot and autothrottle, and took manual control of the aircraft (Figure 2). Six seconds later, the aircraft passed over the runway threshold11 at about 90 ft.
At 1839:28, as the aircraft passed over the aiming point12 at a height of about 44 ft above the runway, the first officer commenced the flare manoeuvre.13 The aircraft nose pitched up to about 6°, but the aircraft floated along the runway rather than touching down as expected. The flight crew reported that, during this time they could not see the runway centreline or touchdown zone markings.
About 3 seconds after commencing the flare and at 15 ft, the aircraft passed the designated latest point of touchdown, then after another 3 seconds, passed the last touchdown zone marker at 8 ft.
After travelling approximately another 400 m over the next 5 seconds, the aircraft touched down on the runway. About a second later, the thrust reversers and spoilers deployed, and autobraking activated. Almost immediately, the captain took over control and applied maximum manual braking and reverse thrust. The aircraft slowed to about 13 kt, the thrust reversers were stowed and the aircraft turned off the runway onto taxiway C, the last available taxiway. The flight crew then had to wait about 30 minutes before the passengers could disembark as the apron was closed due to thunderstorms in the area.
Figure 2: Key events during the landing
After the return flight to Sydney, unsure if the aircraft landed within the touchdown zone, the captain reported the landing to the operator as a potential long landing. Analysis of the data by the operator confirmed that the aircraft landed outside of the touchdown zone.
Context
Flight crew information
Qualifications and experience
Captain
The captain held a valid Air Transport Pilot (Aeroplane) Licence, with the appropriate ratings and endorsements for the operation and a class 1 aviation medical certificate. They had been in that role on the Boeing 737 with Virgin Australia since 2011 and had previously held a training captain role within the company.
In the 90 days prior to the occurrence, the captain had flown 248.49 hours, completing 3 sectors on the previous day. The captain had undergone a recurrent simulator check on 13 November 2022 and an annual line check on 27 December 2022, 72 and 28 days before the occurrence, respectively.
First officer
The first officer (FO) held a valid Air Transport Pilot (Aeroplane) Licence, with the appropriate ratings and endorsements for the operation and a class 1 aviation medical certificate. The FO started with Virgin Australia as a cruise relief FO on the Boeing 777 in 2016, transitioning to the Boeing 737 in 2019 as an FO. After being checked to line on the Boeing 737, the FO was stood down due to the reduced operations resulting from the COVID-19 pandemic. The FO did not return to regular flying until 2022.
In the 90 days prior to the occurrence, the FO had flown 134.47 hours, completing 4 sectors on the previous day. The FO had undergone an annual line check on 19 August 2022, and a recurrent simulator check on 10 January 2023, 158 and 14 days prior to the occurrence, respectively.
Recent history
Captain
In the 14 days prior to the incident, the captain had operated a Sydney–Denpasar (Indonesia) return flight, where the flight back to Sydney was overnight. Two days later, they operated 3 Sydney–Perth, Western Australia return flights, with the last Perth–Sydney flight operated overnight. After these flights, the captain reported difficulties re‑adjusting to a regular sleep routine and were experiencing fatigue.
On 22 January 2023 (2 days prior to the incident), the captain reported waking up at 0700, and that the sleep obtained was broken due to the heat and sunlight shining through the window in the morning. They signed on at 1335 in Hobart, Tasmania, for a 4‑sector duty, finishing at 2230 in Adelaide, South Australia, and went to sleep at midnight.
The day prior to the incident, the captain reported waking up at 0700, and that the sleep obtained was broken due to noise in the hotel. They were using earplugs but found they provided limited assistance. Sign‑on was at 1330 for a 3‑sector duty, finishing at 2142, at their home base in Sydney. They reported going to sleep at midnight.
On the day of the incident, the captain indicated that they woke at 0715, having had sleep that was disrupted due to the heat and humidity. They signed on at 1325 in Sydney for a 4‑sector duty. Overall, the captain had obtained 7 hours of sleep in the previous 24 hours and 14 hours in the previous 48 hours, during night-time.
The captain’s duty hours and sleep obtained was assessed by the ATSB using biomathematical modelling and was not found to be indicative of fatigue. However, there are known limitations of bio-mathematical modelling.
In summary, the quality of the captain’s sleep was reported as being poor and during interview, they indicated that they were likely affected by fatigue at the time of the incident. They also stated that their workload, not only on the incident approach, but for the entire day, was high due to the weather they were operating in.
First officer
The FO did not report fatigue and a review of their roster, and sleep and wake history, found a low likelihood they were experiencing fatigue. In addition, like the captain, the FO indicated that their workload for the entire day was high due to the weather conditions.
Key flight crew recollections
Both the captain and FO were interviewed by the ATSB following the event. The below section is a summary of the flight crew’s key recollections of the occurrence and related aspects:
- Both flight crew reported that the weather along the eastern seaboard of Australia had resulted in multiple diversions and a higher workload than normal on all 4 sectors flown that day.
- Prior to leaving Sydney, they examined the weather radar14 and noted storms to the north‑west of Gold Coast Airport heading in a south‑easterly direction. They were also expecting a runway 32 approach and landing based on the current and forecast weather at the Gold Coast.
- During the flight, and in preparation for the landing, the flight crew considered a number of alternative aerodromes in Queensland, New South Wales, and the Australian Capital Territory, including Brisbane, Sunshine Coast, Wellcamp, Ballina, Sydney, Williamtown, and Canberra. They considered that they had sufficient fuel for all aerodromes under normal conditions, but weather at those locations had either closed them, or required them to carry more fuel. The captain reported that this made them feel anxious as they did not have a good alternative.
- Both flight crew reported that they had discussed keeping the autopilot engaged as long as possible due to the weather conditions.
- The captain reported that, early in the approach they needed to prompt the FO a couple of times for configuration changes, but once configured, they were stabilised on the approach with plenty of margin.
- The captain recalled that during the approach, the aircraft’s weather radar showed storms to the north of Gold Coast Airport.
- Although the observer in the jump seat did not distract the flight crew during the critical stages of the flight, the captain remarked that having them in the cockpit did increase their workload as they were interested in learning and had lots of questions about the operation.
- The FO reported that there was no pressure from the organisation to complete an approach and that they did not have ‘get-home-itis’ (more formally known as ‘plan continuation bias’).15
- Both flight crew described the conditions at Gold Coast Airport as being ‘dark night’ with heavy rain.
- The captain reported that the visibility through the windscreen of the Boeing 737 was very difficult in heavy rain.
- The captain recalled that at some point on the final approach the precision approach path indicator (PAPI)16 indicated that they were a ‘little high’. They could not recall where in the approach they observed it, nor how many lights high it was indicating, however, they placed it in the context of the FO disengaging the autopilot. They could not recall if they alerted the FO to being high on the approach.
- The FO did not recall observing the PAPI during the final approach and landing. However, they did recall transitioning from instruments to visual when they disengaged the autopilot.
- The FO commented that the required navigation precision (RNP) approach gave them guidance all the way down to the runway.
- Both flight crew observed the runway markings during the late final approach, but once in the flare were unable to see the markings due to the runway being wet. The FO described the runway surface as being ‘glassy reflective’.
- The FO described a preference for using their vision as the primary cue for commencing the flare rather than the altitude callouts from the enhanced ground proximity warning system.17
- Both flight crew identified that the aircraft floated during the landing. The captain commenting that there was an expectation that it was about to ‘touch down any minute’.
- The captain recalled that there was a taxiway just past the last touchdown zone marker, but could not recall seeing the taxiway go past during the landing.
- After touching down, both flight crew felt that the landing was long, but were not certain and could not say by how much, as they did not see the touchdown zone markings.
- The FO asked the captain if they had called for a long landing as they thought they may have missed the call, being so focused on the landing. The captain told them they had not.
- The FO reported that they have a reliance on the pilot monitoring to call a long landing as their focus is elsewhere.
- The captain reported that the workload was very high and felt they had become ‘task saturated’ during the flare, to the point that they did not act on concerns they had regarding the situation.
- The flight crew reported that the aircraft’s deceleration during the landing felt normal.
Aircraft information
The Boeing 737-800 aircraft is a twin turbine-engine, narrow-body, transport category aircraft. It is certified for operations in instrument meteorological conditions.18 Visibility of the runway through the cockpit during landing is assisted by landing lights for dark conditions, and windshield wipers and a repellent coating for rain removal.
The landing lights are located in the wing/body intersection and consist of 4 forward‑facing lights: 2 fixed lights embedded in the wing leading edge and 2 retractable lights in the lower fuselage.
Wipers on the left and right main windshield panels can be individually controlled by switches in the cockpit overhead panel. The wipers have 4 settings: park, intermittent, low and high.
Meteorological information
General weather conditions
On the day of the occurrence, the weather on the east coast of Australia was dominated by low pressure systems off the coast of northern Australia, with an associated trough from the north. The rainfall was concentrated along the coastal regions of New South Wales and south-east Queensland, the areas into which the flight crew operated.
Weather information provided to the flight crew by the operator
In preparation for the flight, the flight crew were provided with weather information as part of the operational flight plan. This included an aerodrome meteorological report (METAR)19 and a terminal area forecast (TAF)20 for Gold Coast Airport, issued at 1530 EST and 1516 EST, respectively.
The METAR was automatically generated and reported the conditions at Gold Coast as wind at 13 kt from 020°, visibility 10 km or greater, air temperature 28°C, QNH 1009 hPa, and zero rainfall in the last 10 minutes.
The TAF, valid from 1600 on 24 January 2023 to 1600 on 25 January 2023, provided the average conditions forecast as winds of 12 kt from 020°, visibility 10 km or greater, scattered cloud21 at 3,500 ft above the aerodrome. There was also a PROB3022 TEMPO23 for the period 1600 to 2000 forecasting variable winds at 25 kt gusting to 35 kt, visibility 1,000 m, rain in thunderstorms, broken cloud at 1,000 ft and scattered cumulonimbus cloud at 4,000 ft. The temperature and QNH were forecast to change over the period 1600 to 0000 as shown in Table 1.
Table 1: Forecast air temperature and QNH changes for Gold Coast Airport
| Time (EST) | Air temperature (°C) | QNH (hPa) |
| 1600 | 28 | 1009 |
| 1900 | 25 | 1011 |
| 2100 | 23 | 1012 |
| 0000 | 23 | 1011 |
Airport specific weather information
During the flight, the flight crew obtained updated weather information for the Gold Coast Airport from the automatic terminal information service (ATIS) via the aircraft communications addressing and reporting system (ACARS).24 At 1752, Gold Coast Airport ATIS ‘Romeo’ was requested and received. Then, at 1753, they requested the ATIS for both Gold Coast Airport and Brisbane Airport. From this second request, the flight crew received Gold Coast Airport ATIS ‘Sierra’, which had just been issued at 1754, and Brisbane Airport ATIS ‘India’, issued at 1746. The information included in these ATIS messages are shown in Table 2.
Table 2: ATIS messages received via ACARS during flight
Gold Coast Airport ATIS ‘Romeo’ | Gold Coast Airport ATIS ‘Sierra’ | Brisbane Airport ATIS ‘India’ | |
| Time issued | 1739 | 1754 | 1746 |
| Approach | Expect instrument approach | Expect instrument approach | Expect instrument approach |
| Runway | 32 | 32 | 01L (left) and 01R (right) |
| Surface condition | Wet | Wet | - |
| Wind (direction(°)/speed(kt)) | 350/15 maximum crosswind of 10 kt | 350/15 maximum crosswind of 10 kt | 360/10 |
| Visibility | 10 km, reducing to 6 km in rain | 10 km, reducing to 6 km in rain | Greater than 10 km |
| Weather | Thunderstorms in area | Thunderstorms in area | - |
| Cloud | Broken at 3,000 ft | Broken at 2,000 ft | Few at 2,200 ft |
| Temperature (°C) | 25 | 25 | 26 |
| QNH (hPa) | 1010 | 1011 | 1010 |
At 1801, the flight crew again requested the ATIS for Gold Coast Airport through the ACARS and received ATIS ‘Sierra’. However, at 1819, Brisbane Centre air traffic control (ATC), who they were communicating with at the time, broadcast a change in the Gold Coast ATIS to ‘Tango’ noting the following 3 changes:
- Wind: 350°/10 kt
- Visibility: 6 km
- Temperature: 24°C
When transferring to Brisbane Approach ATC, the flight crew confirmed receipt of ‘Tango’. At 1825:47, when clearing the flight crew for the standard terminal approach route, ATC advised the flight crew that the QNH for the Gold Coast was 1011 hPa. The flight crew included this value on the landing data card. The only further weather information received by the flight crew was at 1838 from Gold Coast Tower ATC when they were cleared to land. At that time, the controller reported winds 240° at 5 kt.
At 1849:30, the Gold Coast Airport ATIS was updated to ‘Uniform’. The only change in the information was the QNH, which had changed from 1011 to 1012 hPa.
Weather from the Bureau of Meteorology
The ATSB obtained information from the Bureau of Meteorology (BoM) regarding the weather at Gold Coast Airport. This included:
- TAFs issued before and during the flight
- automatic weather information service (AWIS)25 data from 1825 to 1855 at 1‑minute intervals
- weather radar images between 1739 and 1909.
At 1715, before the aircraft had departed Sydney, the BoM issued an amendment to the TAF. There were some small changes to the forecast, but the PROB30 TEMPO had been changed to a TEMPO, indicating the probability of those conditions had increased above 50%, the wind gust speed increased to 40 kt, and forecast to occur between 1800 and 2200. The TAF was then reissued at 1807, when the aircraft was approaching the top of descent, with the primary change being the TEMPO period revised to 1900 to 2200.
The AWIS data showed:
- thunderstorms with heavy rain were present
- 4 mm of rain had fallen at Gold Coast Airport in the 10 minutes prior to the landing
- the wind was from 220° to 230° at 6–7 kt
- visibility was 1,400 m
- multiple layers of cloud present, including overcast conditions at 2,500 to 2,700 ft. Other than overcast conditions remaining, the distribution of the lower-level clouds varied over time.
- at 1828, 11 minutes before the landing, the QNH changed from 1011 to 1012 hPa.
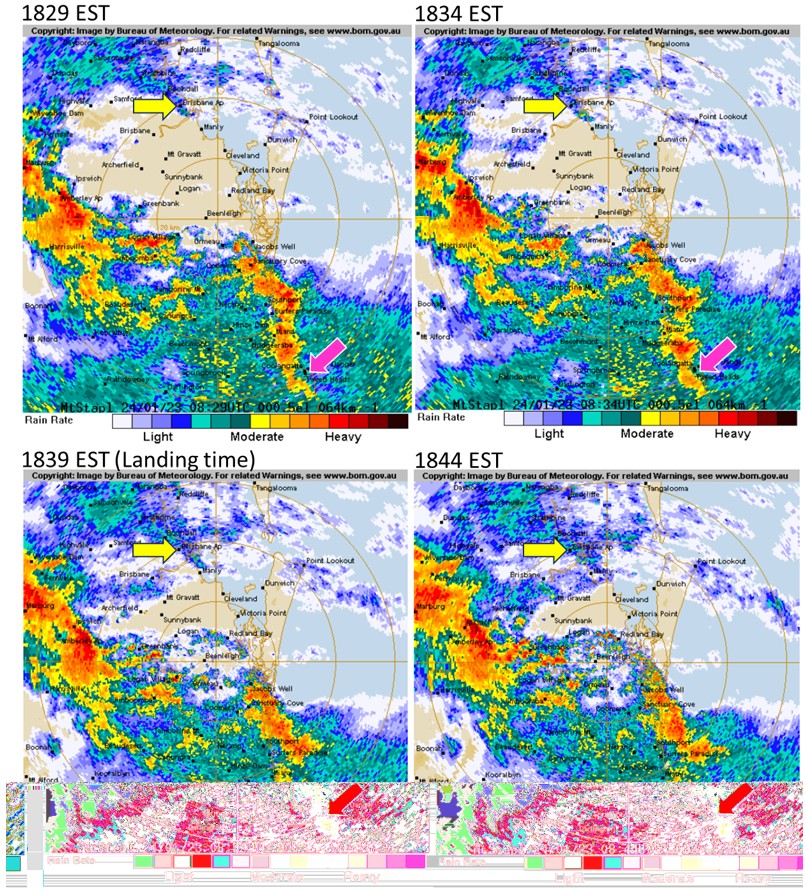
At about the time of the incident (between 1829 and 1844), the BoM radar showed moderate to heavy rain passing through the Gold Coast Airport area, with moderate rain behind (Figure 3). It also showed light rain at Brisbane Airport, but heavy rain between the aircraft and Brisbane Airport, and heavy rain moving towards Brisbane Airport.
Figure 3: Brisbane weather radar images 1829–1844 EST, with Gold Coast Airport identified by the pink arrow and Brisbane Airport identified by the yellow arrow
Provision of weather information from air traffic control
The Gold Coast Airport ATIS system was operated by Airservices Australia and accessible via a designated radio frequency, for a spoken version of the ATIS, or ACARS for a written format.
During tower operating hours, the ATIS was updated by the Gold Coast tower controller. Outside of those hours, the ATIS was set to ‘Zulu’, which provided unchanging general information regarding tower operating hours, local frequencies for communication and infrastructure operation, and any essential information for operating outside tower opening hours. ATIS Zulu also referred to a second frequency, which provided AWIS data. During tower hours, this second frequency included a copy of the ATIS. So, during tower operating hours, AWIS information was only available by phone.
The requirements for revising the ATIS were provided in the Manual of Air Traffic Services (MATS). MATS required that the ATIS be revised when there were changes in various aspects of the ATIS message. This included when ‘current values of the meteorological information vary by, or exceed, the values in the table below [Table 3] and are expected to remain that way for at least 15 minutes’. Of particular note, was that a revision of ATIS was required for a QNH change of only 1 hPa.
Table 3: Table showing the meteorological changes requiring ATIS revision from MATS
| MET information | Variation |
| Wind | Direction 10° Speed 5 kt |
| QNH | 1 HPA |
| Temperature | 1° |
| Cloud (below 5000 FT AGL) | Base 200 FT Amount changes from one descriptor to another |
| Visibility | Between 1500 m and 10 km – 1000 m (1 km) Less than 1500 m – as required |
| Source: Manual of Air Traffic Services | |
Gold Coast tower was equipped with an integrated tower automatic suite (INTAS)26 system, which provided the controller with, among other details, weather information from the AWIS. This included the current QNH. INTAS also incorporated an alerting system to bring to the attention of the controller any changes that were outside a predefined threshold. Airservices Australia advised that, for QNH to activate an alert, a change of greater than 2 hPa was required. This alert was in the form of a message adjacent to the weather information with a yellow background.
INTAS also contained a feature termed the ‘Automated Trigger for New ATIS Message’, which highlighted the ATIS fields that were out of tolerance when creating a new ATIS message. It did not automatically create a new ATIS, nor trigger an alert that a revision to the ATIS was required. Like the above alert, the threshold value for QNH was 2 hPa.
The MATS also noted that tower controllers were ‘responsible for ensuring aircraft under their control are advised of sudden and unexpected changes to the aerodrome information, pending an amended ATIS’.
Recordings of the Gold Coast tower from the period 1800 to 1900 found that the controller was contacted twice regarding weather information prior to clearing VH-YQM to land. The first was at 1828, about the time that the QNH changed, from a pilot checking on storm activity at Gold Coast before commencing their flight. The second was at about 1833, from the preceding A320 that had been cleared to land at the Gold Coast, checking on the visibility. Although these were both weather‑related, neither of the requests necessarily required the controller to check the AWIS data.
Airport information
General
Gold Coast Airport is located at Coolangatta in South East Queensland, situated on the coastal plain adjacent to the coastline. Approximately 20 km to the west of the airport, the terrain begins to rise into the Great Dividing Range, to a maximum height of about 1,200 m (3,937 ft). The airport is a non-military aerodrome that services both regular public transport (domestic and international) and general aviation operations.
Runway information
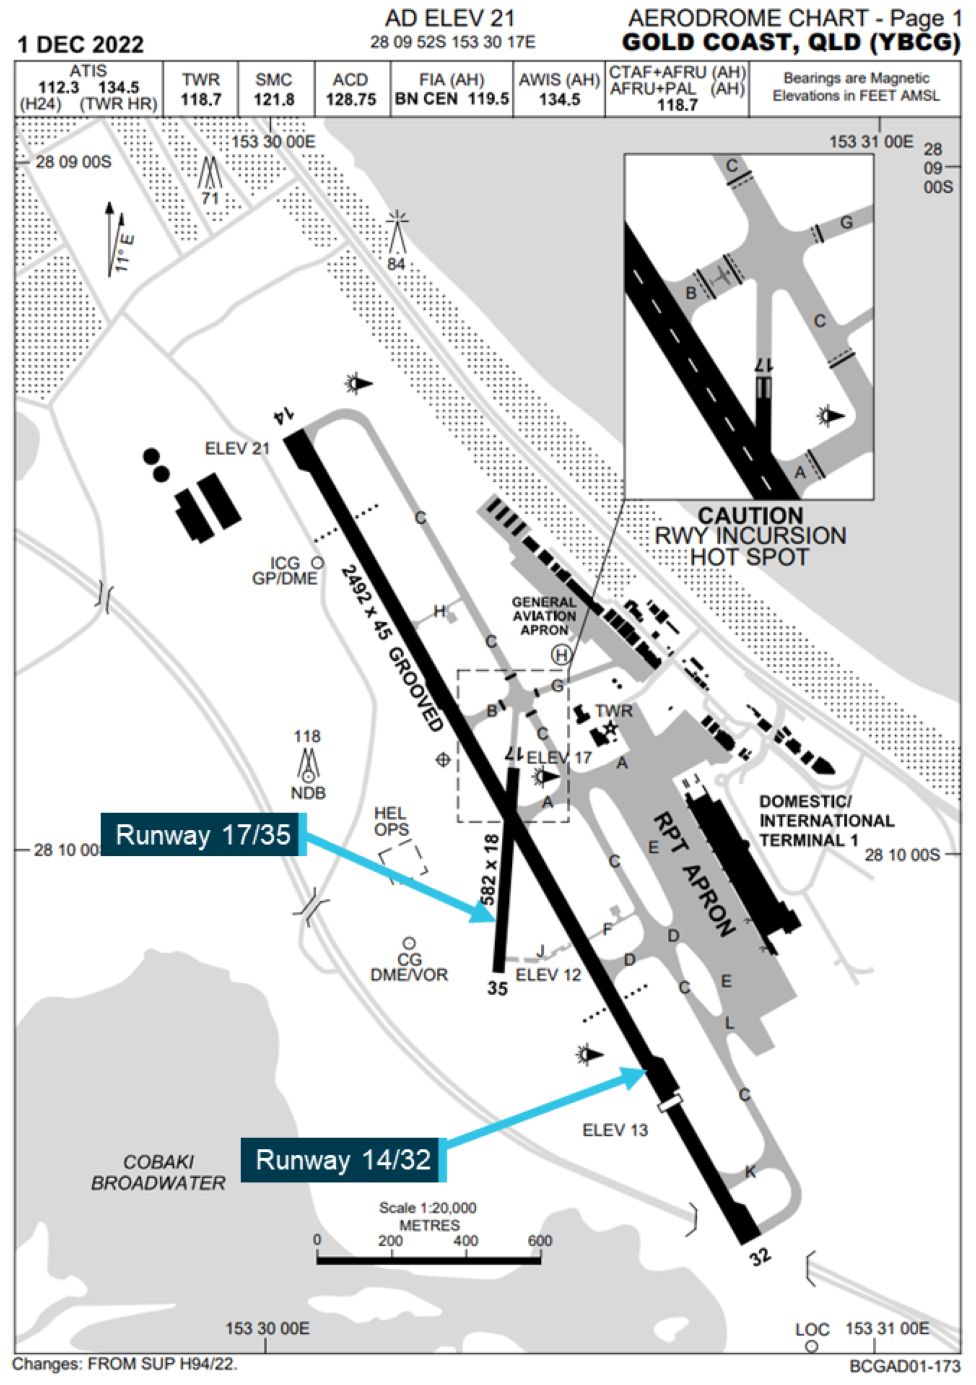
Gold Coast Airport had 2 runways 14/32 and 17/35 (Figure 4). The main runway, runway 14/32, was used for all operation types, whereas runway 17/35 was used only for small general aviation operations.
Runway 14/32 had a total length of 2,492 m and was 45 m wide. However, runway 32 had a permanently displaced threshold, reducing the landing distance available to 2,042 m.27 The surface was bitumen and had been grooved to assist with braking efficiency. Runway 32 had a slight uphill slope, rising from 13 ft above mean sea level at the southern end to 21 ft at the northern end.
Figure 4: Gold Coast Airport aerodrome chart
Approach and landing aids
Approach slope guidance
Runway 14 was equipped with an instrument landing system (ILS)28 and PAPI visual approach slope guidance system. Runway 32 was equipped with a PAPI only. The PAPI was located on both sides of the runway adjacent to the aiming point (about 325 m beyond the threshold) and set to a 3° glideslope, such that an aircraft on this path would pass over the threshold at a height of 53 ft.
The PAPI is a ground-based visual approach slope indicator system (VASIS) that, as the name suggests, provides a visual indication of the glideslope. The requirements for a PAPI are included in Civil Aviation Safety Regulation Part 139 (Aerodrome) Manual of Standards (MOS) (CASA, 2020).
A PAPI consists of 4 equally spaced lights to the side of the runway in a position that directs the aircraft to the aiming point on the prescribed glidepath, the standard being 3°. The PAPI should be located to the left of the runway, but may be located on the right, or both sides of the runway.
The lights are designed to have a sharp transition from white to red dependent on whether the aircraft is above, on or below the designated glideslope. Each of the 4 lights is tilted up so that they indicate (Figure 5):
- 4 red lights when too low (below 2.5°)
- 1 white and 3 red when slightly low (2.5° to 2.83°)
- 2 white and 2 red when on glidepath (2.83° to 3.17°)
- 3 white and 1 red when slightly high (3.17° to 3.5°)
- 4 white when too high (above 3.5°).
The angles in brackets above, are for a standard 3° glideslope angle specified in the Part 139 MOS.
Figure 5: PAPI indications (located on the left only)

Runway markings
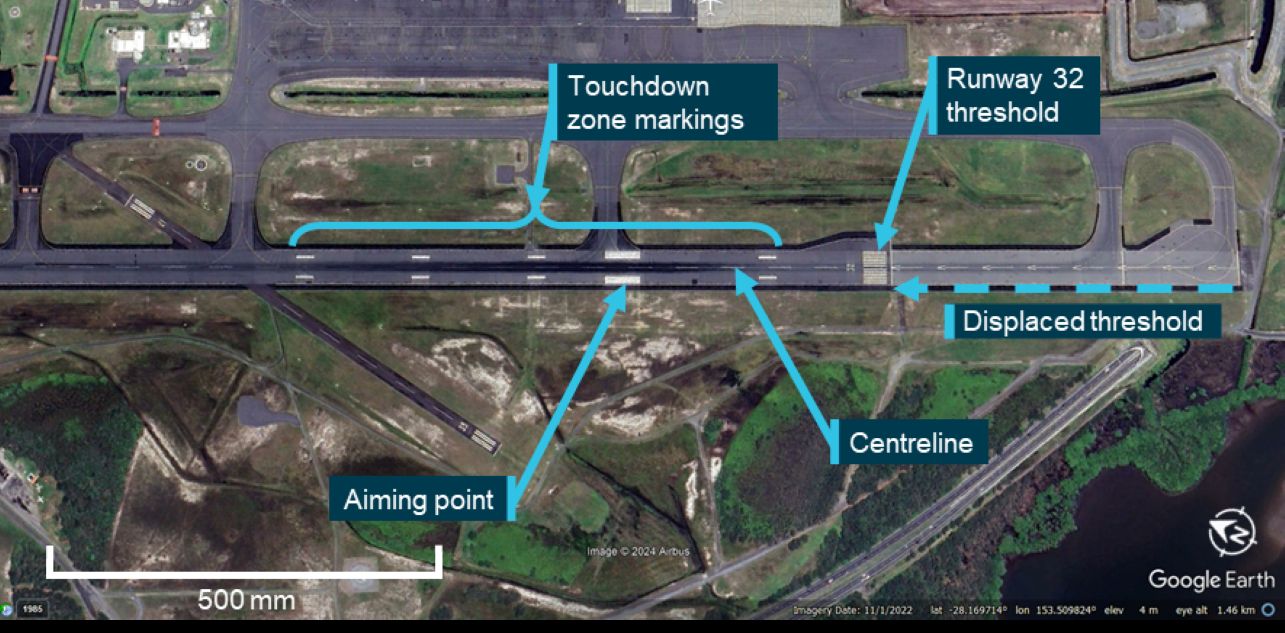
The runways also had markings designed to assist the flight crew in visually determining the runway centreline, threshold, aiming point and touchdown zone (Figure 6). All markings were in accordance with the MOS and consisted of white paint applied directly to the runway surface. The paint did not contain any retroreflective29 materials such as glass beads, nor was there any requirement to do so. The touchdown zone markings were at 150, 450, 600 and 750 m from the threshold, as per the MOS.30 However, the aiming point was 325 m from the threshold, rather than the 300 m specified for the standard markings in the MOS. This was to align the aiming point with the location of the PAPI, which was required in the MOS. As the aiming point markings aligned with the PAPI location, the difference in the aiming point was unlikely to have influenced the occurrence.
According to the Gold Coast Airport operator, the last maintenance carried out on the markings before the occurrence was in July 2022.
Figure 6: Runway 32 markings
There were no runway distance remaining signs31 at Gold Coast Airport, nor was there any requirement or recommendation for such signs in the MOS.
Lighting
The lighting for runway 32 consisted of green runway threshold lights at the southern end, red runway end lights at the northern end, runway edge lights and strobing white runway threshold identification lights (unserviceable at the time).32
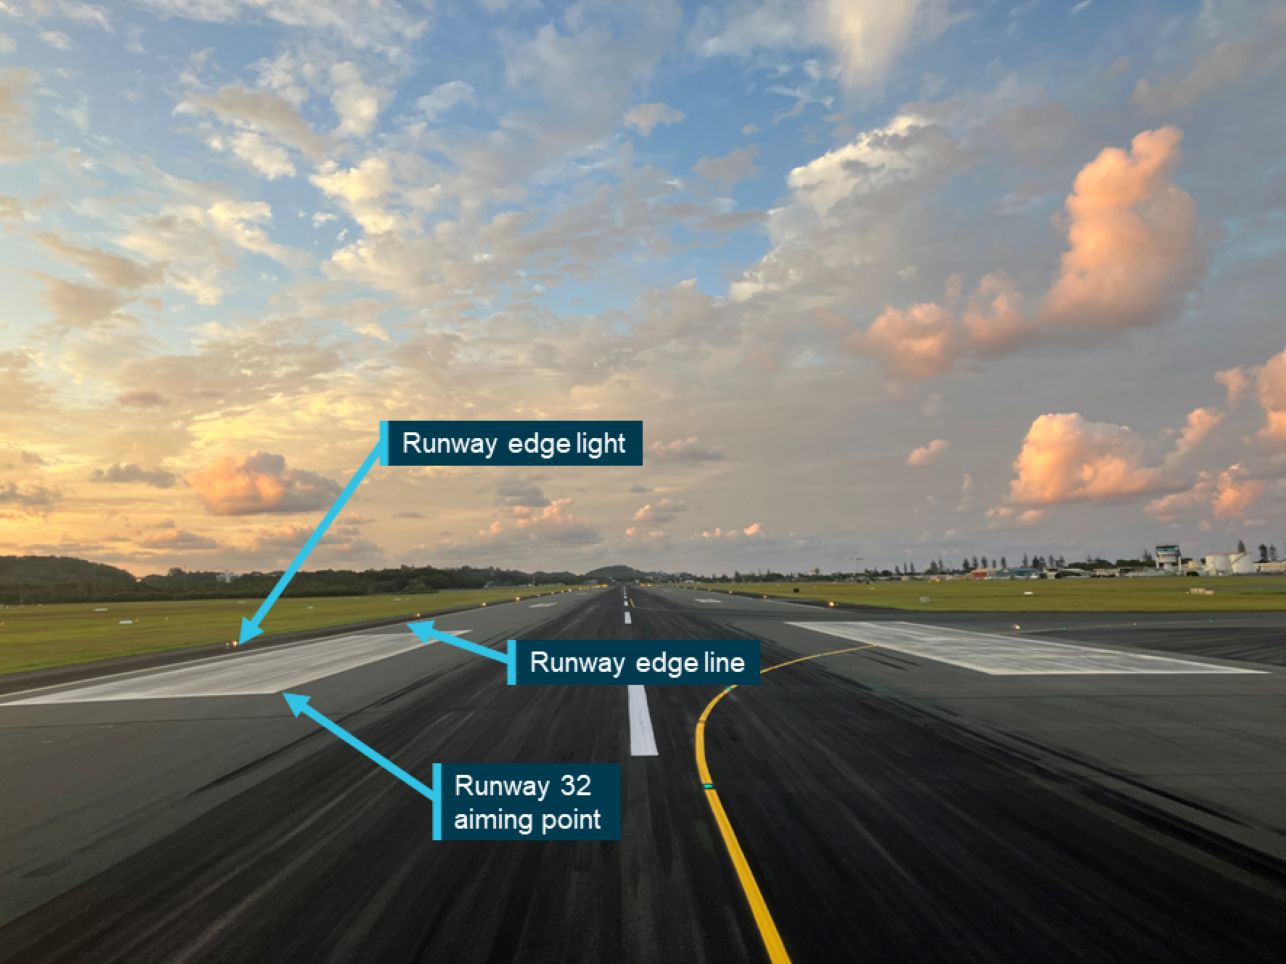
The runway edge lights were white high-intensity/medium-intensity lights, changing to yellow for the last 600 m to alert flight crew of the approaching runway end. As there was a displaced threshold (Figure 6), the lights between the beginning of the runway and the displaced threshold were red in the approach direction. The runway edge lights were displaced outside of the runway edge markings by 3 m (Figure 7).33 This resulted in the lateral distance between the edge lights being 51 m, which was 13% wider than the runway.
Figure 7: View along runway 32 showing edge lighting outside of the runway edge line
The runway did not have either runway centreline or touchdown zone lights, nor was it required to do so under the MOS.
Runway 32 instrument approach procedure
The Gold Coast runway 32 RNP X (AR) instrument approach was classed as a required navigation performance authorisation required approach (RNP AR approach). The flight crew used the instrument approach procedure based on the charts provided by Jeppesen. The procedure was a ‘straight in’ approach consisting of 2 approach waypoints, starting at 4,000 ft above mean sea level at waypoint FIKUL, and the final approach fix leading directly to the runway threshold on a 3° glideslope.
This approach had 2 decision altitude options, based on the RNP value: 560 ft for RNP 0.3 and 360 ft for RNP 0.2. The RNP value being the accuracy within which the aircraft systems must be able to determine its lateral position. For example, an RNP value of 0.3 means that the aircraft must be able to calculate its position within a circle of radius 0.3 NM (556 m). For all RNP AR approaches, the vertical RNP is 125 ft and is not included on the instrument approach procedure charts.
The Boeing 737 determined the actual navigation performance (ANP), representing the actual accuracy of the aircraft’s calculated position, with a confidence of 95%. When ANP exceeds RNP, the position does not meet the required accuracy. Both the ANP and RNP were displayed to the crew on the flight instrumentation. The flight crew reported that the ANP was sufficient for them to use the RNP 0.2 approach and take advantage of the lower decision altitude.
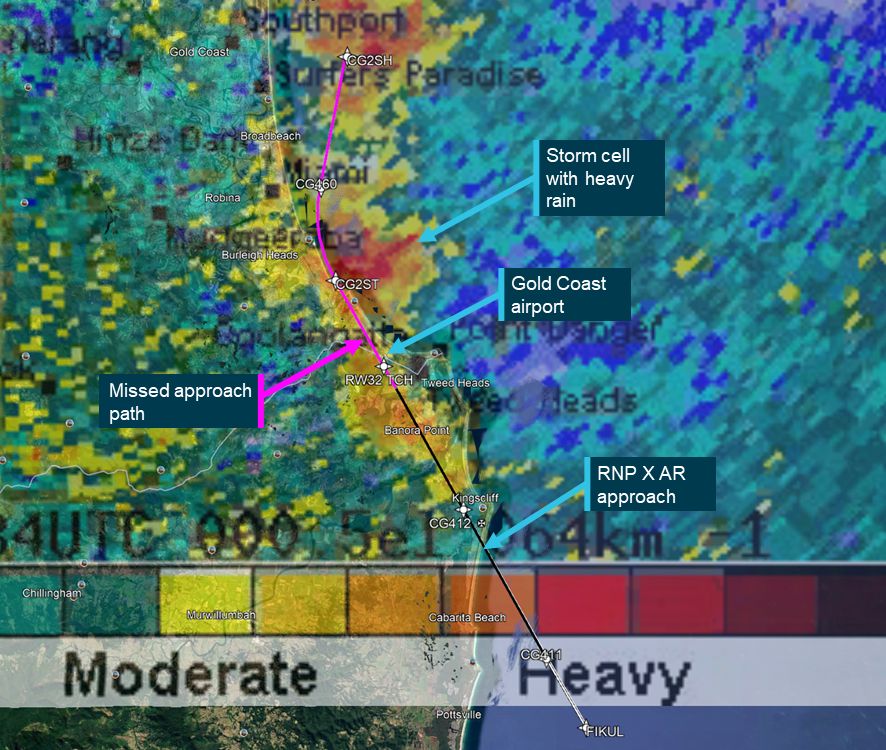
The missed approach procedure included a climb and right turn onto a heading of 360°, which at the time of the landing would have directed the aircraft into a storm cell (Figure 8).
Figure 8: Combined image of the missed approach procedure and weather radar image from 1834 showing the storm cells in the missed approach path
Recorded information
Sources of recorded information
The aircraft was fitted with a flight data recorder (FDR), cockpit voice recorder (CVR),34 and a quick access recorder (QAR). Having sustained no damage, the aircraft continued to operate, so by the time the ATSB had been informed of the occurrence and decided to investigate, the FDR and CVR had been overwritten.35 However, the QAR, which is essentially a copy of the FDR and downloaded after every flight, was supplied by the operator. Data from the ACARS was also provided by the operator.
The ATSB also obtained and examined the ATC audio recordings from Airservices Australia covering the period 1800 to 1900, which included the final 40 minutes of the flight.
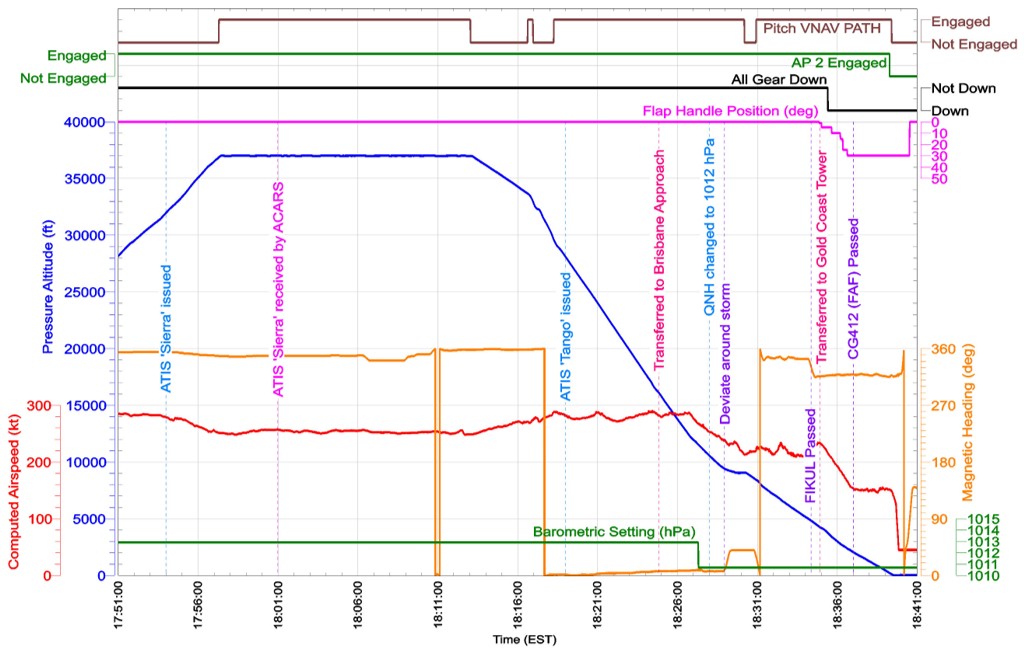
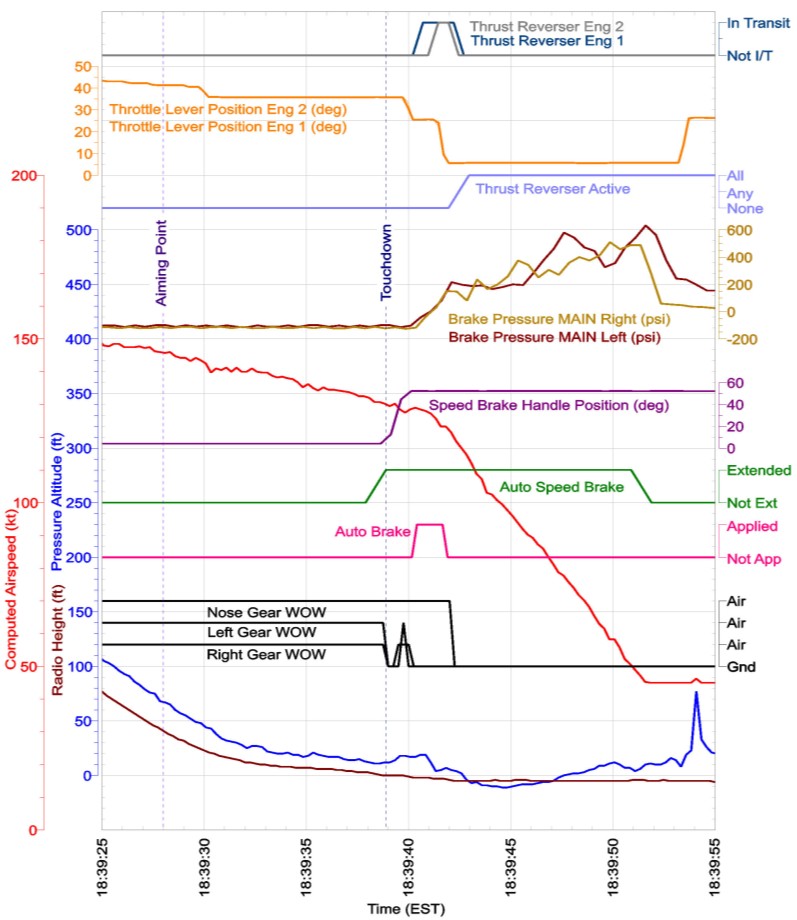
Parameters from the QAR applicable to the occurrence were examined and combined with other key points from the ATC audio recordings and ACARS data (Figure 9).
Figure 9: QAR data with key ATC, ACARS, and weather information
Key points from the quick access recorder
The following key points were identified from the QAR data:
- At 1838:12, the aircraft passed through the stabilisation height (1,000 ft above airfield elevation – 1,021 ft above mean sea level) (Figure 10). At this time, the:
- aircraft was in the landing configuration (landing gear down, flap set to 30°)
- aircraft was on path:
- lateral (cross track) deviation was 0 NM
- vertical deviation was −8 ft
- descent (sink) rate was about 960 ft/min
- autothrottle was engaged
- airspeed was 151 kt and the target speed was 150 kt.
- Barometric pressure setting for the altimeters was 1010.7 hPa.
- VNAV PATH36 was selected for vertical guidance during the descent and approach
- Minimum altitude37 was selected to 360 ft.
- At 1839:18, the autopilot and autothrottle were disengaged (Figure 11). At this time, the:
- At 1839:24, as the aircraft passed over the runway threshold (Figure 12):
- radio height indicated about 90 ft
- control inputs started to fluctuate, but in general increased from 0° to about 2° nose up
- pitch angle increased (pitched up) over about 3 seconds
- descent rate decreased by about 120 ft/min.
- Between 1839:27.5 and 1839:31, when passing over the aiming point (Figure 12), the:
- radio height reduced from 44 ft to 15 ft
- control inputs continued to fluctuate, but increased to average about 4° nose up
- pitch angle increased from 3° to 6°
- descent rate reduced from about 600 ft/m to about 200 ft/min
- throttle lever angle was reduced to an angle consistent with flight idle
- airspeed decreased from 146 kt to 140 kt.
[these changes were consistent with a flare manoeuvre39]
- Over the next 7 seconds (Figure 12), the:
- aircraft continued to descend at between 60 and 200 ft/min (1 and 3 ft/s)
- control inputs continued to fluctuate, but increased up to average about 6° nose up
- pitch angle remained at about 6°
- airspeed reduced to 130 kt.
[this was consistent with the aircraft ‘floating’ rather than touching down at the end of the flare]
- During the 14 seconds between passing over the threshold and the aircraft touching down, the headwind varied between 0 and −2.4 kt (that is, a tailwind of 2.4 kt). There was a general increase in the tailwind as the aircraft travelled along the runway.
- At 1839:39, the aircraft touched down about 1,175 m from the runway 32 threshold, with about 860 m of runway remaining (Figure 13).
- After the left and right main gear contacted the runway (as indicated by the weight on wheels (WOW) parameters in Figure 14):
- When the autobrake deactivated, 2 to 3 seconds after touching down, the aircraft was about 685 m from the end of the runway.
Figure 10: QAR data showing parameters relating to stabilised approach criteria
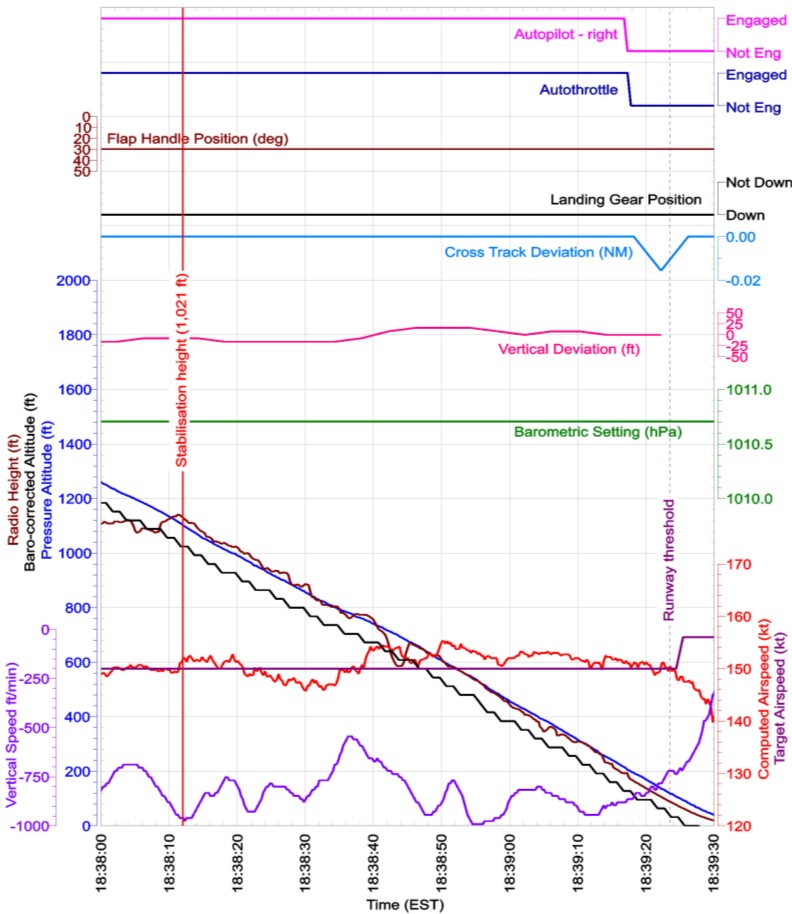
Figure 11: QAR data showing parameters related to the vertical guidance
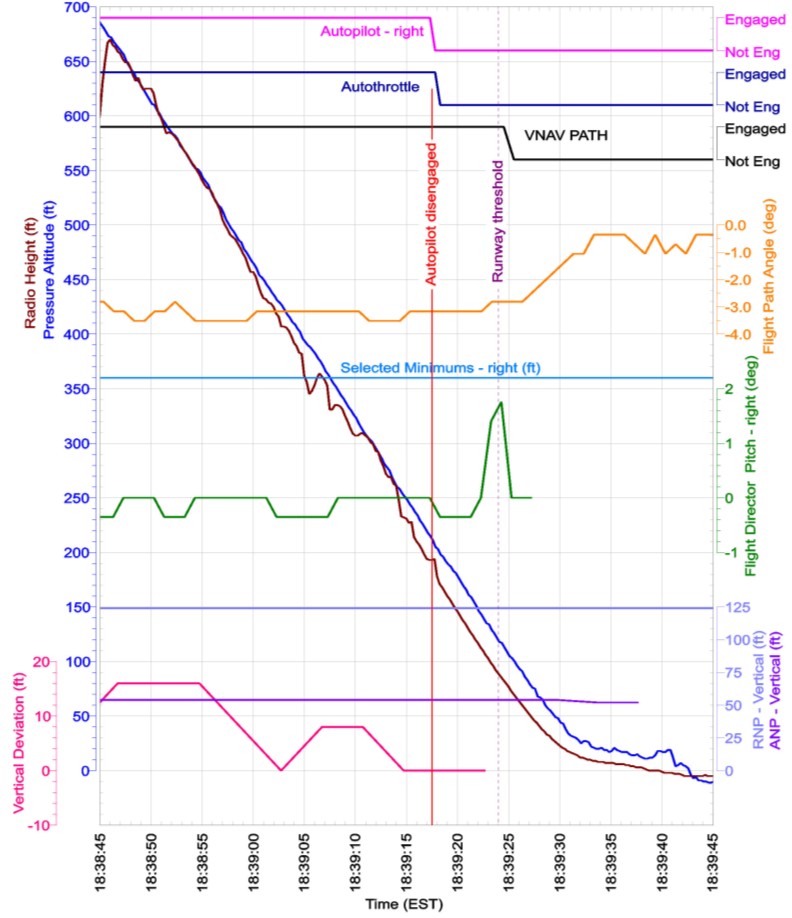
Figure 12: QAR data showing parameters associated with the flare and landing
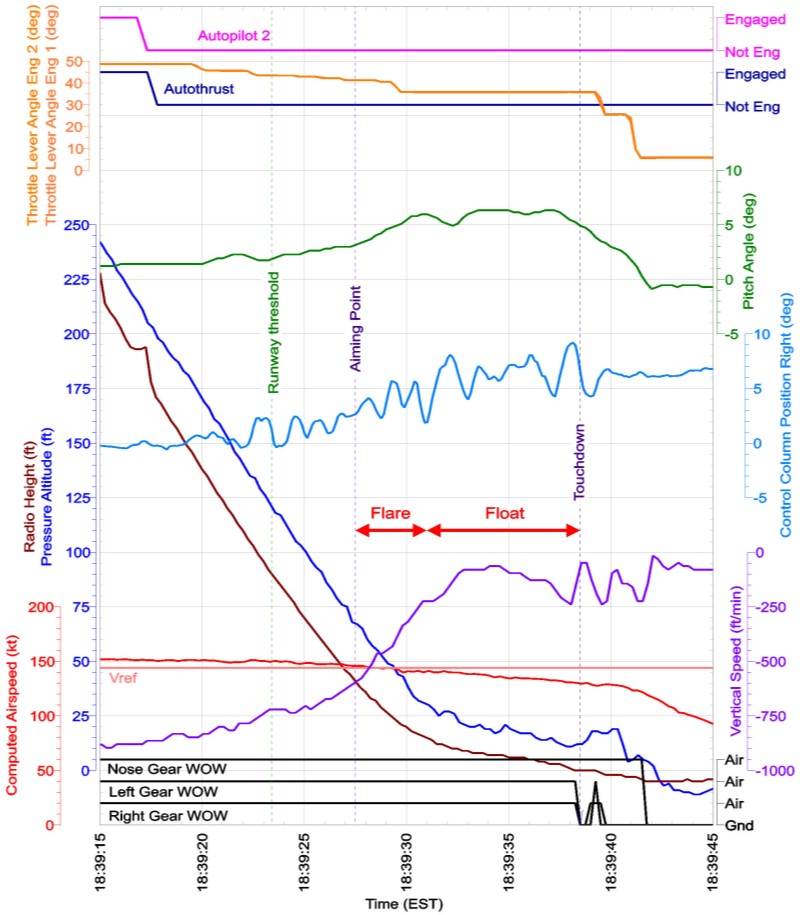
Figure 13: Actual landing position relative to threshold and latest point of touchdown
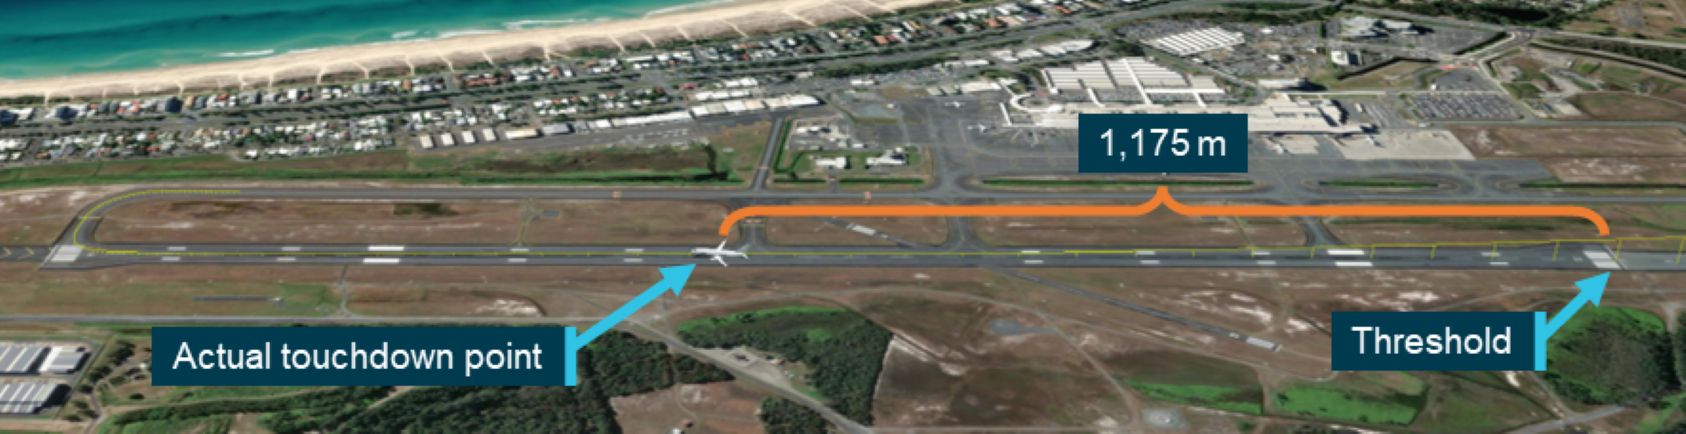
Figure 14: QAR data showing the braking parameters during the landing
Flight path comparison
Precision approach path indicator
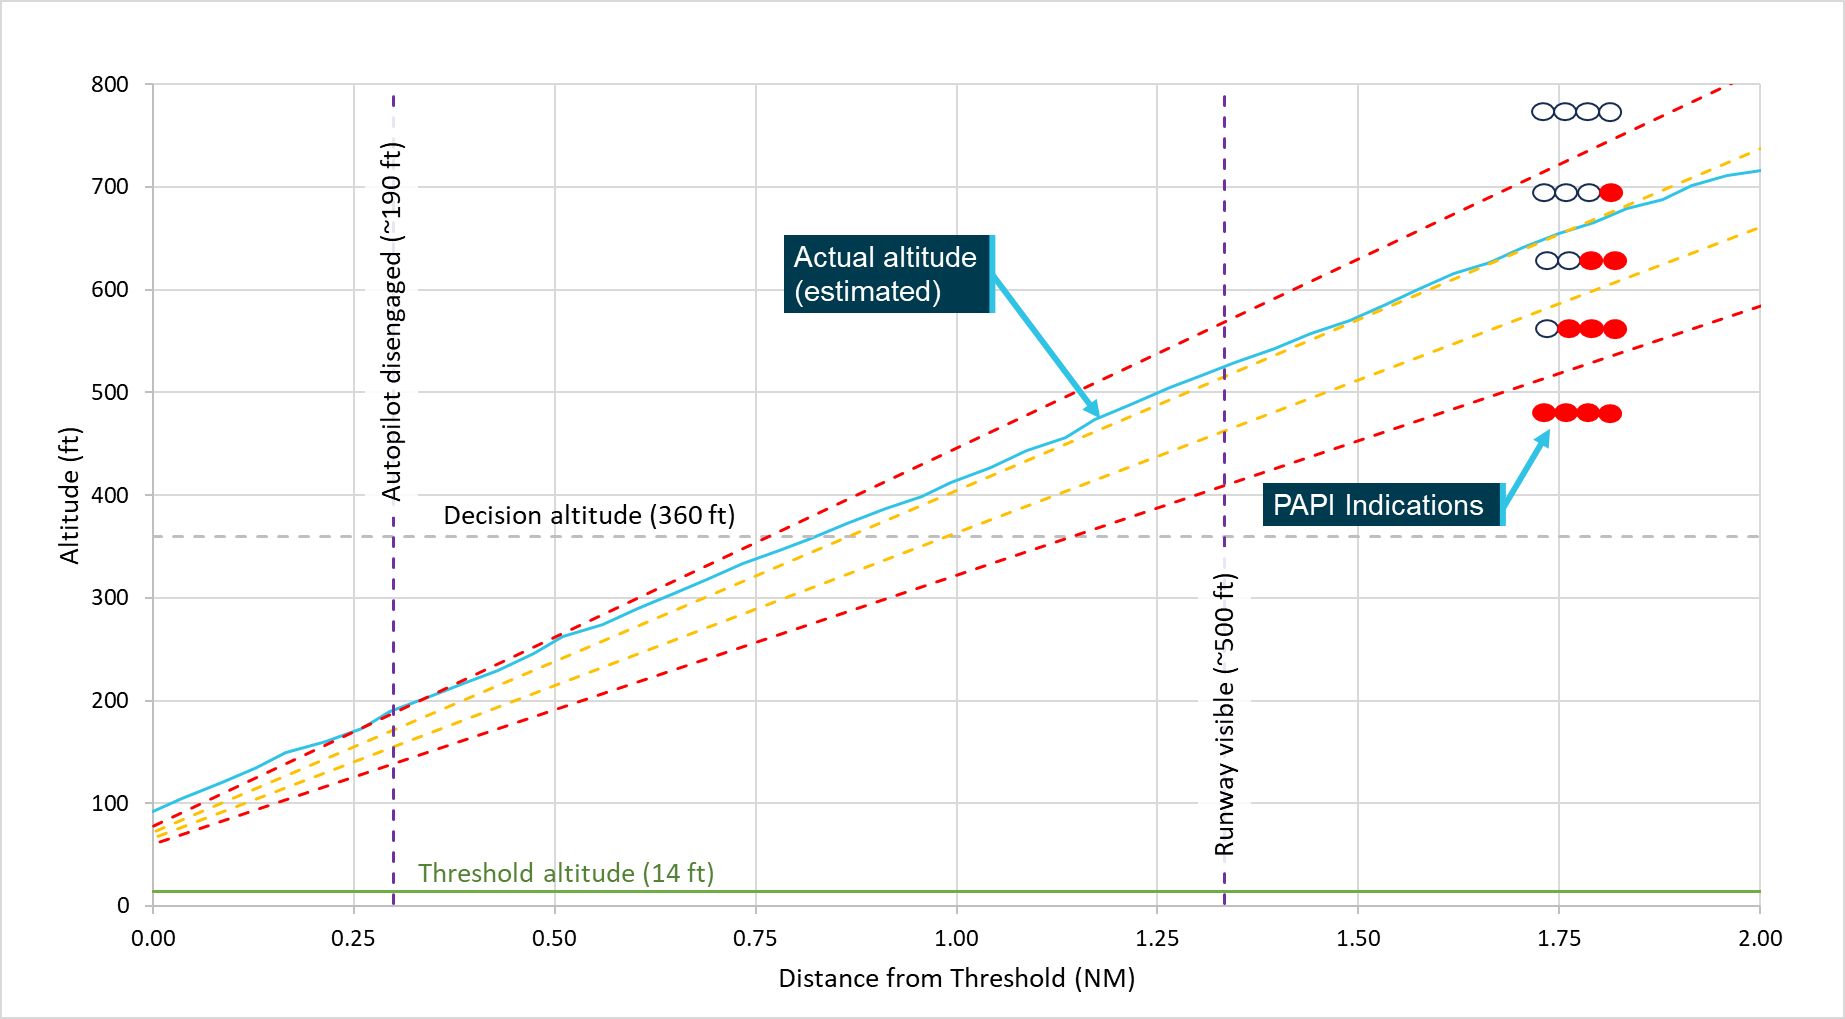
As the PAPI was fixed to the ground, the glideslope it provided was with reference to the ground. To determine the likely PAPI indications during the approach, the ATSB compared the aircraft’s glidepath, based on the temperature and baro‑corrected altitude,42 to the PAPI design angles for a standard 3° approach path (Figure 15). This showed that it was likely that the PAPI was indicating 3 white and 1 red light when they became visual with the runway at about 500 ft indicated altitude and when passing the decision altitude. It then likely transitioned to indicating 4 white lights about the time the autopilot was disengaged.
Figure 15: Descent profile based on actual altitude and PAPI glidepath indications
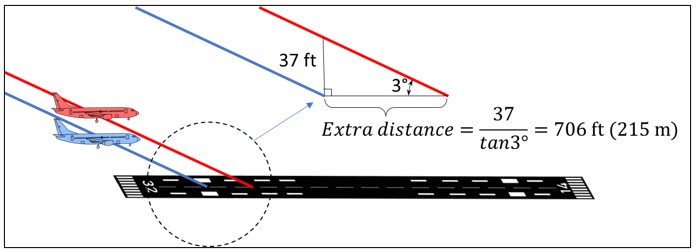
For the 3° approach, the ATSB determined that the aircraft was 37 ft in altitude above the PAPI-provided glideslope when crossing the runway threshold. This resulted in the effective aiming point moving 215 m along the runway as shown in Figure 16.
Figure 16: Extra landing distance due to high approach
Flight management computer-generated glideslope
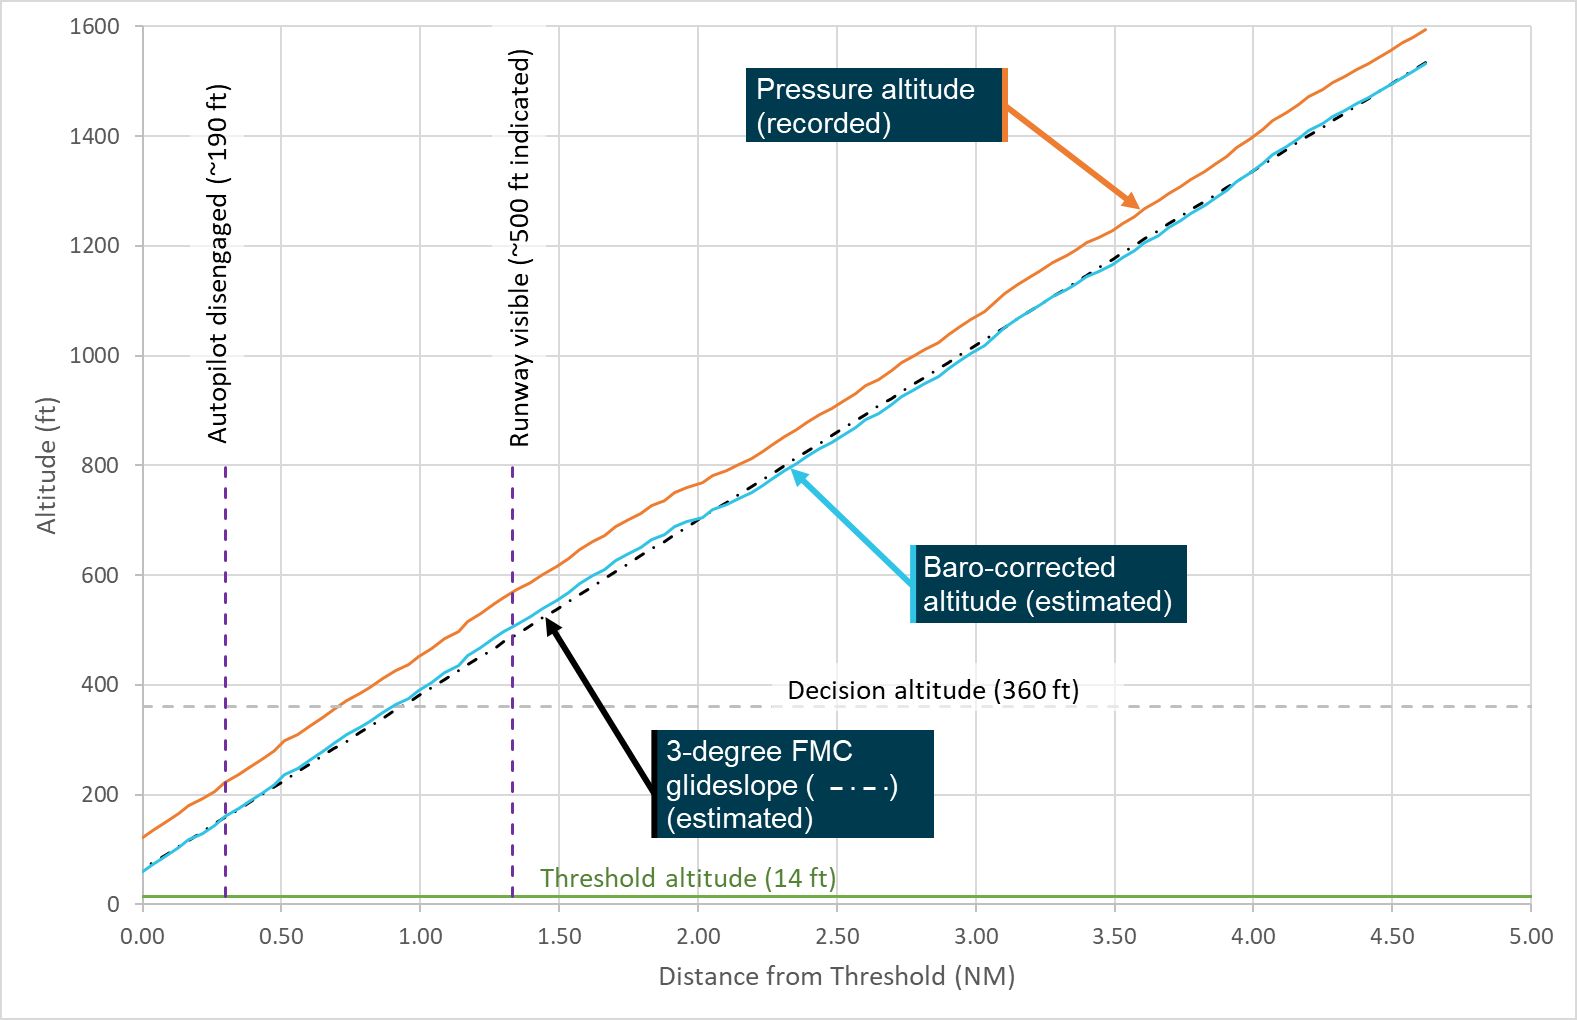
The vertical guidance for the FMC-generated glideslope was based on barometric altitude, while the recorded altitude was pressure altitude. A baro-correction was made to the pressure altitude using the barometric pressure setting recorded on the quick access recorder (1010.7 hPa). This was then representative of the indicated altitude from the flight, that is, the altitude displayed to the flight crew on the altimeter (Figure 17 ‘Baro‑corrected altitude (estimated)’). This showed that, with the unreported change in the QNH at Gold Coast Airport, the indicated altitude was inaccurate by about 35 ft.
The FMC-generated glideslope was not recorded, so a representative (estimated) FMC‑generated glideslope was generated. This glideslope was constructed from a geometric 3° path crossing the runway threshold at 50 ft. Comparison of the baro‑corrected flightpath with the representative FMC-generated glideslope showed a strong correlation (Figure 17).
Figure 17: Descent profile based on baro-corrected altitude and FMC-generated glidepath
Operational information
Approaches – general
The policies and procedures for the conduct of approaches was distributed over multiple sections of the Virgin Australia Operating Policies and Procedures Manual (OPPM) and the Boeing Flight Crew Operating Manual (FCOM). The OPPM had a requirement that, if the destination weather conditions were forecast to be instrument meteorological conditions below the minimum safe, or minimum vectoring altitude, an instrument approach procedure must be planned for the destination runway. A 3D instrument approach procedure was to be used in preference to a 2D procedure.43 The RNP X AR approach used by the flight crew was a 3D approach, so fulfilled this requirement.
Approach and landing guidance aids
Operator’s requirements and guidance
The OPPM included a section titled ‘Visual/Electronic Glideslope’, which required that the destination runway provide approach slope guidance. This requirement was considered met if:
• The runway is equipped with a visual approach slope indicator system (PAPI, T-VASIS or AT‑VASIS),44 or
• The runway is equipped with an electronic slope guidance system (ILS/GLS),45 or
• The aeroplane is equipped with a serviceable approach slope indicator system and RNP AR APCH or RNP APCH – LNAV/VNAV [lateral and vertical navigation] procedures are available for the runway and flown.
There were some exclusions to this, but they were not applicable to this flight as the runway met these criteria having both a PAPI and an RNP AR approach.
Guidance for non-ILS instrument approaches, such as the RNP AR approach, was provided in the OPPM, which stated:
Automatic flight is the preferred method of flying non-Instrument Landing System (non-ILS) approaches. Non-ILS instrument approaches are to be flown with a constant descent profile that, where possible, provides for a steady 3 degree descent gradient to 50 ft above the runway threshold.
Procedures for accomplishing a stabilised constant descent profile for non-ILS approaches are detailed in the aircraft type operating manuals.
Instrument approach procedures – general
An instrument approach procedure is a series of predetermined manoeuvres made with reference to flight instruments. The procedures are designed to provide protections from obstacles from an initial approach fix through a series of waypoints to a point where a landing can be completed. If a landing cannot be completed, the procedure includes a missed approach procedure that also provides protections from obstacles, to a point at which holding or en route clearance criteria apply.
The point in an instrument approach at which the determination is made as to whether a landing can, or cannot, be completed, termed the missed approach point, is either a point in space or a minimum altitude, or minima.
There are 2 broad categories of instrument approach procedures:
- 2-dimensional (2D) instrument approach procedures, also known as non-precision approaches, using lateral navigation guidance only
- 3-dimensional (3D) instrument approach procedures, using both lateral and vertical navigation guidance.
3D approach procedures are further broken into 2 categories:
- precision approach (PA) procedures
- approach procedures with vertical guidance (APV).
Precision approaches are instrument approaches based on ground-based navigation systems such as an instrument landing system (ILS) or GBAS landing system (GLS).46 Vertical guidance is provided by reference to either a ground-based navigation aid, for an ILS, or an augmented global navigation satellite system (GNSS)47 derived altitude.
Approach procedures with vertical guidance, operate similar to precision approaches, but the vertical guidance is based on barometric48 altitude, or a satellite-based augmentation system (SBAS) GNSS derived altitude. Due to the lower accuracy of these vertical sources, they are not considered a precision approach and have correspondingly higher minima to ensure obstacle clearance. Approach procedures with vertical guidance are considered a form of ‘performance-based navigation’, which is discussed in more detail in the next section.
Individual instrument approach procedures are designed to national regulations based on standards promulgated by the International Civil Aviation Organization (ICAO). The resulting procedure is published as a chart for use by authorised flight crew. Flight crew must be appropriately trained and qualified to operate the various types of instrument approach procedure.
Required navigation performance instrument approaches
General
Along with traditional ground-based navigation infrastructure procedures, Australia uses performance-based navigation, a form of navigation based on navigation performance requirements for aircraft operating along an air traffic services route, on an instrument approach procedure, or in a designated airspace. In this context, ‘performance requirements are expressed in navigation specifications (RNAV specification, RNP specification) in terms of accuracy, integrity, continuity, availability and functionality needed for the proposed operation …’ (CASA, 2021).
The navigation specifications are a set of aircraft and flight crew requirements to support a navigation application within a defined airspace. These specifications are broken down into area navigation (RNAV) and required navigation performance (RNP). The key difference being that an RNP specification requires on-board performance monitoring and alerting.
There are a range of RNP specifications covering different operation types and phases of flight. RNP specifications are identified by the required lateral navigation accuracy performance value in nautical miles which is expected to be achieved at least 95% of the time. For example, an RNP 2 specification, used for oceanic and en route navigation, requires that the actual aircraft position be within a circle of radius 2 nautical miles of the calculated position. RNP instrument approaches do not include the performance value in the specification title as the procedure may include multiple RNP values and are identified as RNP APCH.
RNP approaches are further broken down into 2D and 3D approaches. A further subset of the 3D RNP approaches requires specific approval from the Civil Aviation Safety Authority (CASA) to use. These RNP ‘authorisation required’ (RNP AR) approaches require specialised aircraft, procedures, and training for operation. Virgin Australia was authorised by CASA to operate RNP AR approaches.
RNP AR approaches
According to ICAO in its Required Navigation Performance Authorization Required (RNP AR) Procedure Design Manual (ICAO, 2021):
RNP AR procedures can provide significant operational and safety advantages over other area navigation (RNAV) procedures. This is done by incorporating additional navigational accuracy, integrity, and functional capabilities to permit operations using reduced obstacle clearance tolerances that enable approach and departure procedures to be implemented in circumstances where other types of approach and departure procedures are not operationally possible or satisfactory.
However, ICAO also noted in the Performance-based Navigation (PBN) Manual (ICAO, 2023) that:
RNP AR procedures increase risk and complexity, yet stringent performance and eligibility criteria mitigates this risk and achieves safe operations by taking advantage of advanced aircraft capabilities and additional training and procedures for the operator and the operator’s flight crews.
Unlike traditional ground-based instrument approaches, such as an ILS, RNP approaches can consist of complex flight paths, including curved sections. However, the final approach segment typically consists of a runway aligned constant descent angle path. The angle of descent on an RNP approach was referred to as the vertical path angle (VPA).
The ICAO Required Navigation Performance Authorization Required (RNP AR) Procedure Design Manual noted that the optimal VPA was 3° but should not be lower than 2.5° for the minimum temperature limit. The standard threshold crossing height was 50 ft but may be varied to suit the approach and runway geometries. It was also recommended that:
To the extent practicable, the VPA for an RNP AR procedure to a runway served by a visual approach slope indicator system (VASIS) should be optimized to equal the VASIS glide path (GP) angle at the prevailing temperature for the aerodrome. A note must be published on the chart if the effective VPA at the prevailing temperature differs by more than 0.2 degrees from the VASIS GP angle.
There was no note on the charts for the Gold Coast runway 32 RNP X (AR) approach as both the approach procedure VPA and the PAPI glideslope were 3°.
A particular aspect of the RNP AR approach design is the reduced obstacle clearance tolerances that permit lower minima, in particular lower decision altitudes. Obstacle clearance is based on a statistical assessment of all the component errors referred to as a vertical error budget. The components of the errors are detailed in Appendix B of the ICAO Required Navigation Performance Authorization Required (RNP AR) Procedure Design Manual (ICAO, 2021) as:
a) actual navigation performance error (anpe);
b) waypoint precision error (wpr);
c) flight technical error (fte) fixed at 75 ft;
d) altimetry system error (ase);
e) vertical angle error (vae); and
f) automatic terminal information system (atis) fixed at 20 ft.
RNP AR approach path guidance
In a traditional ILS approach, the position of the aircraft relative to the desired glidepath is determined by interrogation of radio signals transmitted from ground-based localiser (lateral guidance) and glideslope (vertical guidance) antennas. This is then presented to the flight crew on an instrument that shows the position of the desired path relative to the aircraft on separate vertical and lateral scales. The ground-based localiser transmitter is calibrated to align with the runway centreline. The glideslope transmitter is calibrated to provide the correct glideslope angle and runway intersection point, which usually corresponds with the aiming point.
For an RNP approach, the relative position of the aircraft is determined on board the aircraft by the flight management computer (FMC)49 through comparison of the aircraft’s current absolute position (GPS position and baro-altitude) with the expected position along the predetermined flightpath calculated by the FMC. There is no direct reference to any ground-based navigation aids. The 3D (lateral and vertical) flightpath for an RNP approach is stored as a series of waypoints on board the aircraft in the FMC. The FMC directs the flight crew/aircraft through the waypoints from the start of the approach to the runway threshold in accordance with the selected approach procedure.
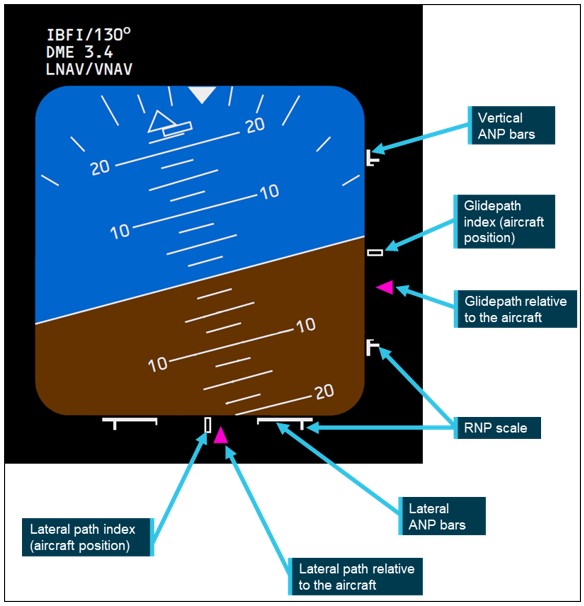
With LNAV and VNAV modes operating, the aircraft presented guidance to the flight crew on horizontal and vertical deviation scales like an ILS, but using a ‘navigation performance scale’. The navigation performance scale was similar to an ILS, in that it presented the desired path relative to the aircraft, but also graphically indicated the relative RNP and ANP values (Figure 18). The key features of this display were:
- Indexes in the centre of the scales that represent the aircraft.
- Magenta triangles that indicate the relative location of the desired path (course and glidepath).
- Full-scale marks that indicate the RNP value. These marks remain in the same position regardless of the RNP value. The relative position of the course/glidepath indicators scale to the RNP value.
- ANP bars that extend inward from the RNP scale (full scale) as a function of increasing ANP relative to the RNP.
The ANP bars are particular to the navigation performance scale. The gap between the ANP bars indicates the available flight technical error50 remaining after system errors have been accounted for. In other words, if the lateral or vertical path indicators were outside the ANP bars, but inside the RNP scales, the aircraft may be within the RNP, but could not be assured due to the reduced performance (accuracy) of the system. For low ANP values (that is, high accuracy) the ANP bars will be close to the full-scale markers. As the ANP value increases (decreasing accuracy), the ANP bars move inward toward each other. When the ANP equals the RNP, the ANP bars touch in the middle. In the example shown in Figure 18, the aircraft is above and to the left of the desired flight path and is within the allowable flight technical error.
Figure 18: Navigation performance scale on the primary flight display used for RNP operations
If the autopilot is engaged and in VNAV PATH mode,51 the aircraft will follow the RNP approach guidance down to the runway threshold.
RNP AR procedures
The aircraft specific procedures for performance-based navigation approaches, including RNP AR approaches, were contained in the FCOM – Quick Reference Handbook. The procedure for RNP AR approaches required that, among other things:
- actual aerodrome QNH from an approved source is available and used
- autopilot shall be engaged from the initial approach fix, unless operating in visual conditions that can be maintained to touchdown
- LNAV shall be engaged from the initial approach fix
- VNAV PATH should be engaged by the initial approach fix and shall be engaged by the final approach fix
- confirm that the vertical RNP defaults to 125 ft (if not manually set) by the final approach fix.
Complementing this, the FCOM stated that for instrument approaches using VNAV the flight crew should use the autopilot during the approach to give:
- autopilot alerts and mode failure indications
- more accurate course and glidepath tracking
- lower RNP limits.
It also noted that it minimises flight crew workload and facilitates monitoring the procedure and flight path. Autopilot use was recommended until suitable visual reference was established on the final approach.
Altitude errors during an RNP AR approach
Vertical navigation for an RNP AR approach is based upon barometric altitude (baro‑VNAV), where the barometric altitude is the altitude indicated to the flight crew on the altimeter. Barometric altitude is an estimate of the aircraft’s altitude based upon measurement of the static air pressure.52 The change in pressure with altitude is known, so an altimeter can be calibrated to change altitude based on this pressure change.
Several references are used to measure altitude in aviation. At low levels (below 10,000 ft), altitudes are referenced to mean sea level. However, the local sea-level pressure changes with weather conditions. To ensure that the altimeter accurately indicates the altitude above mean sea level, the altimeter’s barometric pressure setting (sometimes referred to as the sub-scale) needs to be set to the local sea level pressure, referred to as the local QNH. Any difference between the altimeter’s barometric pressure setting and the local QNH will result in an altitude error, at a rate of 27 ft/hPa.53 For example, if the altimeter’s barometric setting is 1 hPa below the QNH, the altimeter will indicate 27 ft below the actual altitude. As aircraft are flown to the indicated altitude, the result is the aircraft will actually be higher than indicated. Conversely, if the QNH is lower than the barometric setting, the aircraft will fly lower than the indicated altitude.
For this reason, RNP AR approaches require that QNH for the airport be set for the approach.
ATSB observation The design of the RNP AR approach includes an ATIS error of 20 ft in the vertical error budget. The only ATIS item that could affect the vertical error budget in such a constant manner is the QNH. As such, the vertical error budget used to ensure terrain clearance during an RNP AR approach was based on a QNH error of less than 1 hPa. Any error in the QNH reported on the ATIS greater than 0.74 hPa will result in an error that exceeds the RNP AR approach design standard. |
Variations in temperature away from the international standard atmosphere54 also affect the indicated altitude. Unlike the effect of the sea level pressure variation, the effect of temperature on the indicated altitude is not constant but is a function of the altitude. This variation is approximately linear, where the effect is greater at higher altitude. When the approach path is based on the indicated altitude, the effect is to decrease the descent angle when temperatures are lower than the standard atmosphere, and increase the angle when temperatures are above the standard atmosphere.
While most altimeters are corrected for sea level pressure variations, they are typically not corrected for temperature. As such, RNP AR approaches present a temperature range for which they are applicable. This temperature range ensures that the descent angle during the approach remains between 2.5° and 3.5°.55
Flight path management
The operator’s policy stated in the OPPM was that ‘The responsibility for flight path management, control and monitoring remains with the flight crew at all times, irrespective of the Auto Flight System (AFS) engagement status.’ The policy also noted that the auto flight system should be used to enhance operational capability, improve safety and reduce workload. However, the operator required that the intended auto flight should always be briefed by the pilot flying and that autopilot must be engaged when directed by the FCOM for the procedure being flown and/or required by the airspace procedures.
The autopilot should also be engaged on all instrument approaches, when cloud was within 500 ft of the minima or when the reported visibility was less than the required visibility of +2,000 m.
In the subsection on flight path guidance, the OPPM also included a highlighted note stating:
NOTE: Flight director guidance must be used when flying RNP AR APCHs |
In this occurrence, the ATIS reported broken cloud at 2,000 ft and visibility 6 km in rain. Although this would indicate no requirement for the autopilot to be engaged as the minima was 360 ft and visibility greater than 2,000 m, the FCOM QRH for RNP AR approaches required the autopilot to be engaged from the initial approach fix, unless operating in visual conditions. The flight crew reported that they did not become visual until about 500 ft, which was within the criteria for the autopilot engagement on an RNP AR approach.
Stabilised approach
Key to any approach, but particularly those in instrument meteorological conditions is a stabilised approach. Continuing an unstabilised approach may result in an aircraft arriving at the runway threshold too high/low, too fast/slow, out of alignment with the runway centreline, incorrectly configured or unprepared for landing.
The operator required that all approaches be stabilised by 1,000 ft above field elevation.56 An approach was considered stabilised when all the following criteria had been met:
• Briefings and normal checklists are completed
• Aircraft is in the correct landing configuration
• Aircraft is on the correct lateral and vertical flight path:
- Instrument approach, refer to Section 10.41.9 – Instrument Approach Go-around criteria [in the OPPM]
- Visual Manoeuvring, refer to type specific manoeuvre guidance within the FCOM. Wings must be level no later than 500 ft.
• Sink rate, no greater than 1000 fpm
• Thrust setting is appropriate for the aircraft configuration and trajectory
• Speed is within -5 kt to +10 kt of the speed target.
Section 10.41.9 referenced in the stabilised approach criteria, prescribed the tolerances beyond which an approach must be discontinued, and a go‑around commenced by the pilot flying, for the various types of instrument approaches. The line relevant to the RNP approach required a go‑around if the flightpath was outside the allowable vertical flight technical error. That is, if either the lateral or vertical deviation presented on the primary flight display navigation performance scale moved outside of the ANP bars, a go‑around must be performed. However, there was an associated note stating that for RNP AR approaches, ‘if the vertical deviation is momentarily exceeded above the vertical path due to aircraft configuration changes, a missed approach is not required’.
Additional policy was provided regarding actions below the 1,000 ft stabilisation height. Of note was the requirement that the pilot flying must initiate a go‑around for sustained or repeated exceedances of the stabilised approach criteria. Also, the pilot monitoring had a responsibility to alert the pilot flying to an unstable approach with a ‘Not stable’ call. Associated with this policy was a series of standard advisory call‑outs:
When the aircraft is flown outside specified limits, the PM [pilot monitoring] must provide advisory calls. The limits are not tolerances but are parameters beyond which sustained flight should not be accepted without corrective action being taken by the PF [pilot flying].
The PF should initiate immediate flight path corrections in response to the following advisory calls:
| Limit | Call-out - PM | Response - PF |
| [various limits including sink rate, airspeed, and tracking] … | … | … |
| PAPI ≥ 3 red or 3 white lights | “PAPI” | “CHECKED” |
ATSB observation The recorded data in Figure 10 shows that the aircraft met the stabilised approach criteria when 1,000 ft above the airfield (1,021 ft above mean sea level), as the flaps and landing gear were configured for landing, the aircraft was on the lateral and vertical flight paths according to the aircraft instruments, the sink rate (negative vertical speed) was less than 1,000 ft/min, and the airspeed was 2 kt above the target airspeed. The aircraft was still in cloud at this point, so the PAPI was not yet visible. According to the recorded data, the flight remained stable down to the runway threshold. Figure 11 shows that the greatest vertical deviation recorded was 16 ft, the required navigation performance was 125 ft, and the actual navigation performance was 54 ft. As such, the glidepath indicator on the primary flight display would have remained within the allowable vertical flight technical error, as required in the instrument approach go-around criteria. |
When discussing the ‘Actions During Flare and Touchdown’, the stabilised approach policy further stated that:
• The PM must continue to monitor whether or not the corrections made by the PF will result in a touchdown within the touchdown zone and prior to the latest point of touchdown, refer Section 10.43 - Landing Touchdown Area - Go-Around Criteria
• If either pilot is unsure about the safe outcome of the landing then a go-around must be initiated or called for
• The option to go-around is not available after selection of reverse thrust.
Landing touchdown area – go-around criteria
As referenced in the ‘actions during flare and touchdown’, the OPPM expanded on landing within the touchdown zone prior to the latest point of touchdown in the section Landing Touchdown Area – Go-around criteria. While their description of the touchdown zone was consistent with the touchdown zone markings on the runway, they included an additional concept of a touchdown area. The touchdown area was defined as the area from the start of the touchdown zone to the latest point of touchdown. It was required that the latest point of touchdown be nominated by the pilot, and was the lesser of:
• That calculated by the pilot for that landing
• The end of the touchdown zone
• The specific point stated in Jeppesen 10-7.
In this section, the operator required that the ‘latest point of touchdown must be calculated for every landing as it may be limiting when the runway is short, landing weight is high, or weather conditions are adverse’. They required that the ‘nominated latest point of touchdown must be easily identifiable … When determining the latest point of touchdown, crews must be conservative …’. Of particular importance was the requirement that:
Should it become apparent during the approach that the aircraft will touchdown more than 150 m short of the aiming point, or past the latest point of touchdown, the PF must initiate a go-around.
The following represents calls to be made in the event an aircraft will touchdown beyond the latest point of touchdown:
| LIMIT | CALL-OUT - PM | ACTION/ RESPONSE – PF |
| Landing beyond the latest point of touchdown | “LONG LANDING” | “GO-AROUND” |
The FO reported that during preparation for the approach and landing, they determined that the calculated landing distance meant that the latest point of touchdown was before the last touchdown marker. As such, they nominated the second last touchdown zone marker as their latest point of touchdown.
Missed approach/go-around policy
There was no specific section in the documentation detailing the operator’s missed approach/go-around policies. Instead, they were distributed throughout the operating procedures of the FCOM and the OPPM specific to the situation. However, the section on the ‘Commencement and Continuation of an Approach’ contained a sub-section under the heading ‘General’ that stated:
1. A missed approach (or a go-around) is considered to be a conservative risk-control measure and will not result in disciplinary action in accordance with the company's Safety Culture policy.
Flight crew are encouraged to perform a missed approach/go-around whenever any doubt exists as to the safe continuation of an approach and landing.
2. An explanatory PA [passenger announcement] should be made as soon as workload permits following any missed approach/go-around. This PA should contain factual information and be reassuring to the guests.
3. All missed approaches/go-arounds are to be reported via a Safety Report …
Landing technique
Flare manoeuvre
The flare manoeuvre transitions the aircraft from the approach descent to landing on the runway. It normally involves a simultaneous increase in pitch attitude and reduction in engine thrust, resulting in a reduction in the rate of descent and airspeed. To be successful, the pitch and thrust adjustments need to occur at a height above the runway that depends on the size, weight and performance category of the aircraft. In many aircraft, the flight crew are required to judge the height for the flare based on visual references, however, a radio altimeter can aid the pilot in determining the appropriate height at which to initiate the flare (Skybrary, 2026).
According to a University of Tokyo research report on flare techniques and flare training methods, there are various techniques for deciding where to flare (Okubo and Entzinger, 2021). These techniques include a range of visual techniques, aircraft ‘feel’, and flaring at a specified height above the runway. Visual techniques included judging the height based on forward distance (Jacobson flare), runway widening effect, time-to-contact, and the relative angles between the runway sidelines.
The research found that all techniques had pros and cons, noting that estimation of the altitude from visual cues like the apparent angle between runway sidelines and the level of textural detail, are likely to remain quite inaccurate and estimates may be too low when approaching runways wider than usual. It also noted that automated callouts may be used as a cue for when to initiate the flare.
Boeing guidance
Guidance on the landing technique was provided in the Boeing 737 NG/Max Flight Crew Training Manual sections on ‘Threshold Height’ and ‘Flare and Touchdown’. The technique was applicable to all landings, including one engine inoperative landings, crosswind landings and landings on slippery runways. Key points of the technique included:
- Unless an unexpected or sudden event occurs, such as windshear or collision avoidance situation, it is not appropriate to use sudden, violent or abrupt control inputs during landing.
- Begin with a stabilised approach on speed, in trim and on glide path.
- Approach speed at Vref57 + 5 kt, which bleeds off to Vref during the flare.
- Pilot flying should consider disengaging the autopilot and disengaging the autothrottle 1 to 2 NM (2–4 km) before the threshold, or approximately 300 ft to 600 ft above field elevation.
- When the threshold passes out of sight under the aircraft nose, shift the visual sighting point to the far end of the runway. Shifting the visual sighting point assists in controlling the pitch attitude during the flare.
- Initiate the flare when the main landing gear is approximately 20 ft above the runway by increasing the pitch attitude 2°–3°.
- After the flare is initiated, smoothly retard the thrust levers to idle.
- Hold sufficient back pressure on the control column to keep pitch attitude constant.
- Avoid rapid control column movements during the flare.
- Do not allow the aircraft to float or attempt to hold it off.
- Prolonged flare increases aircraft pitch attitude a further 2°–3°. When prolonged flare is coupled with a misjudged height above the runway, a tail strike is possible.
To assist the flight crew at judging heights during the approach and landing, automatic altitude callouts at 2,500, 1,000, 500, 100, 50, 40, 30, 20, and 10 ft were provided by the enhanced ground proximity warning system based on heights from the radio altimeter. The Flight Crew Training Manual noted that ‘If automatic callouts are not available, the radio altimeter should be used to assist the pilot in judging terrain clearance, threshold height and flare initiation height.’
A chart showing the touchdown body attitudes and the possible tail strike angles for the 737‑800 range from about 9.6° to 11°, depending on the main landing gear strut compression. The maximum pitch attitude during the landing was about 6° (Figure 12), so the aircraft was not at risk of a tail strike during the occurrence.
In the ‘Landing Roll’ section of the manual, factors affecting landing distance were noted, which included:
- height and speed over the threshold
- glide slope angle
- landing flare
- lowering the nose onto the runway
- use of reverse thrust, speed brakes and wheel brakes
- runway surface condition.
Visual illusions
The Flight Safety Foundation Approach-and-landing accident reduction toolkit briefing note on visual illusions (Flight Safety Foundation, 2000) discussed a range of illusions that may be present during the approach and landing phase. The main factors that affect the pilot’s perception of their relative height above the runway are the runway dimensions (width and length) and the slope. Of specific note was that an approach to a relatively wide runway (either wide, or short with respect to the width) can be perceived as being low on the approach, which can result in a long landing.
It was also identified in the briefing note that heavy rain could affect depth and distance perception. It noted that ‘in nighttime conditions, rain increases the apparent brilliance of the ALS [approach light system], making the runway appear to be closer, inducing a pitch-down input and the risk of landing short of the runway threshold’.
Landing performance calculations
The operational policies and procedures required that the flight crew plan an operational stopping solution for the actual landing weight and environmental conditions at the predicted time of landing. It noted that stopping solutions based on the use of autobrake, must ensure that the calculated landing distance is less than the landing distance available. There was also a company requirement that, when the margin between the landing distance required and the landing distance available was less than 150 m, the flight crew must brief the reduced margin and the requirements for immediate intervention of up to maximum manual braking and maximum reverse thrust.
The onboard performance tool used to determine the landing performance data in-flight did not save the calculations, so exactly what was used by the flight crew was not available. However, at the request of the ATSB, the operator reproduced the likely data input into the tool based on the ATIS ‘Sierra’ conditions (Figure 19). These results indicated that autobrake 3, maximum autobrake, and maximum manual braking were acceptable braking solutions for the landing. Autobrake 3 resulted in the greatest acceptable landing distance, which was 211 m less than the landing distance available. As this was greater than 150 m, there was no requirement for the flight crew to specifically brief on an immediate intervention.
Figure 19: Post-occurrence reproduction of the onboard performance tool landing performance calculations based upon the ATIS 'Sierra' conditions
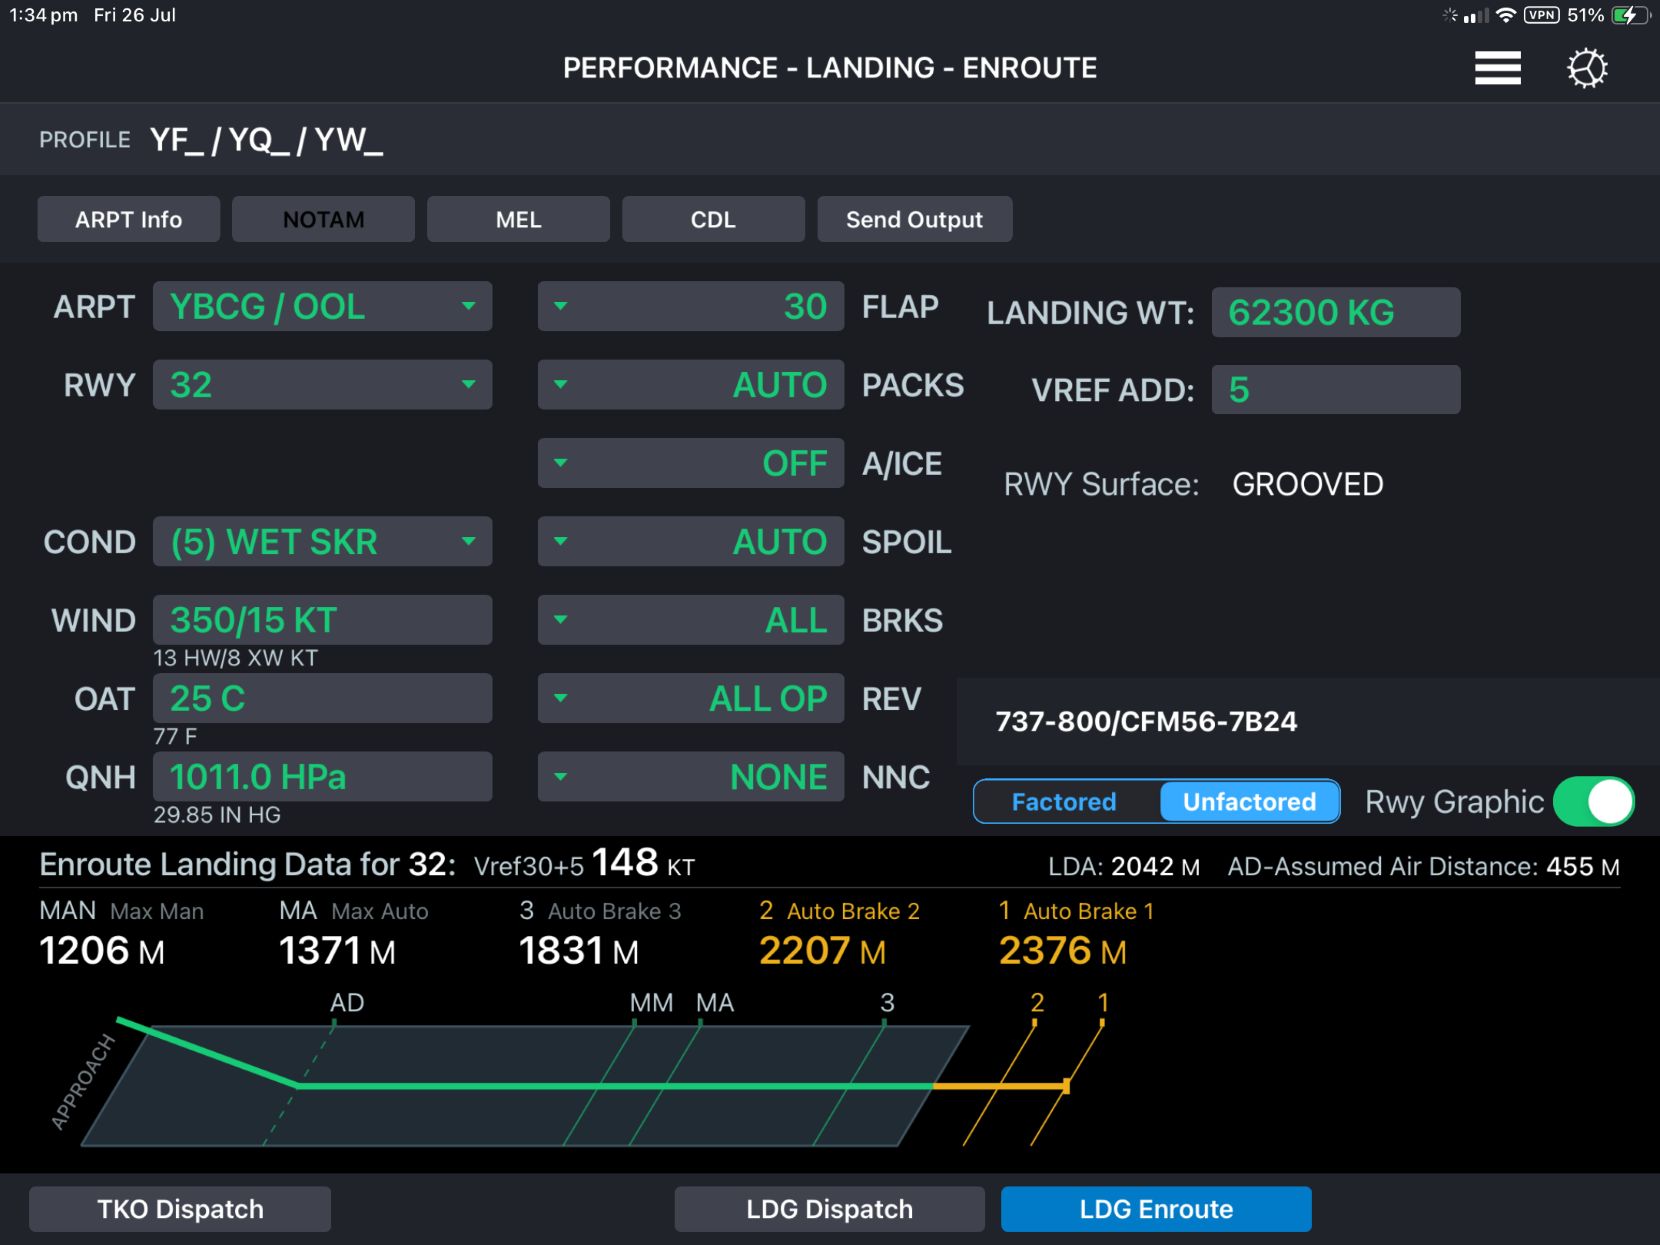
The calculated ground distances (total distance minus the assumed air distance) for the landing at the varying braking solutions are shown in Table 4. For autobrake 3, the ground distance was 1,376 m.
Table 4: Landing solution ground distances
| Braking solution | Total distance (m) | Ground distance (m) |
| Autobrake 3 | 1,831 | 1,376 |
| Maximum autobrake (Max Auto) | 1,371 | 916 |
| Maximum manual (Max Man) | 1,206 | 751 |
Adverse atmospheric conditions
The operator’s policies on the handling of adverse atmospheric conditions, including thunderstorms, was contained in the OPPM. Flight crews were required to remain clear of thunderstorms by holding or adopting an alternate track, and using the avoidance distances prescribed in the OPPM. For take-off and landing, that distance was greater than 5 NM (9.3 km) from an approaching thunderstorm, but included a note stating that thunderstorms that have passed may be approached closer than 5 NM (9.3 km).
The FCOM supplementary procedures also contained a section on adverse weather. A subsection on windshear noted that windshear may be indicated by thunderstorm activity, pilot reports, and low‑level windshear alerting systems. During the occurrence, the prevailing conditions, particularly the presence of thunderstorms in the area, made windshear a possibility.
According to the FCOM, precautions to be taken when windshear was suspected during approach and landing, included:
- Use flaps 30 for landing.
- Use electronic or visual glide path indications to detect flight path deviations and help with timely detection of windshear.
- Crosscheck flight director commands using vertical flight path instruments.
- Flight crew coordination and awareness are very important, particularly at night or in marginal weather conditions. Closely monitor the vertical flight path instruments such as vertical speed, altimeters, and glideslope displacement. The pilot monitoring should call out any deviations from normal. Use of the autopilot and autothrottle for the approach may provide more monitoring and recognition time.
Runway markings as visual aids
International Civil Aviation Organization
The standards and recommended practices for the design of aerodrome visual aids are specified by the International Civil Aviation Organization (ICAO) in Annex 14 to the Convention on International Civil Aviation. The standards for runway markings are contained in section 5.2 of Volume 1 – Aerodrome Design and Operations. Section 5.2 included a section on ‘Colour and conspicuity’ of aerodrome markings (ICAO, 2022). This section required that runway markings shall be white. It also included a recommendation in paragraph 5.2.1.7 that:
At aerodromes where operations take place at night, pavement markings should be made with reflective materials designed to enhance the visibility of the markings.
Note. – Guidance on reflective materials is given in the Aerodrome Design Manual (Doc 9157), Part 4.
The ICAO Aerodrome Design Manual, Part 4, did not explicitly specify when retro‑reflective elements (glass beads) were to be included in the aerodrome markings. However, item 9 in Appendix 3 of that document provided advice on the conditions for using reflective markings (ICAO, 2021):
Reflective aerodrome markings are used to improve the performance of markings at night, especially in conditions when the markings may be wet. Because of the additional costs, some authorities may use reflective markings only for those aerodromes which can benefit from the improved performance. Aerodromes which operate only during daylight, or are used only by aircraft without landing or taxiing lights, would not need to provide reflectorized markings. Reflective markings may not be necessary on runways with operating runway centre line and touchdown zone lights; however, the reflective markings may be helpful for nighttime operations in clearer visibilities when the centre line and touchdown zone lights are not energized. Tests have shown that the reflectivity of markings may be enhanced by factors in excess of 5 by the inclusion of glass beads.
Importantly, this notes that reflective markings may not always be applicable and cites cases such as when the runway is not used at night, or when there are centreline and touchdown zone lights. Touchdown zone lights are only required for CAT II and CAT III instrument approaches,58 of which there are not many in Australia. Previous ATSB investigations have also identified a lack of centreline lights at large Australian airports as contributing to occurrences.59
Civil Aviation Safety Authority
Standards for aerodrome markings
The Australian regulations for aerodromes were contained in Part 139 of the Civil Aviation Safety Regulations 1998. Those regulations do not, in themselves, contain the standards for aerodrome markings, but sets the regulatory basis, including the issue of a Manual of Standards. The details for the standards pertaining to the markings were contained in the Part 139 (Aerodromes) Manual of Standards 2019, dated 13 August 2020 (MOS) (CASA, 2020).
Visibility of runway markings
Details relating to runway markings were contained in the MOS chapter on Visual Aids provided by Aerodrome Markings, Markers, Signals, Signs, Wind Direction Indicators, etc. This included a section on the visibility of markings and markers, which stated:
(1) Each marking and marker must be clearly visible against the background and environment in which it is placed.
(2) Unless the colour is otherwise stated in this Chapter, the selection of the surrounding colour for a marking must be white, grey or black, whichever if the most appropriate to provide sufficient contrast to ensure that the marking is clearly visible.
There was no mention of reflective runway markings for night operations. The only mention of retroreflectivity was as an alternative to taxiway lighting at certain classes of aerodromes.
Further guidance was provided by CASA in advisory circular (AC) 139.C-09v1.0 Visual Aids, Markings Signals and Signs (CASA, 2020). Section 3 of this AC commenced with the statement:
Ground markings on paved surfaces that cannot be seen either by pilots or ground personnel are ineffective. A contrast colour of either white, grey or black, may be applied to the surface should additional background contrast be required to enhance the visibility of the marking.
Again, there was no mention of reflectivity being used to enhance the visibility of markings at night, or when markings were wet.
AC 139.C-09v1.0 did not provide any further design information, but did note the importance of aiming point and touchdown zone markings:
Aiming point and touchdown zone markings provide added visual cues to pilots, particularly in conditions of poor visibility. The distance between the aiming point marking and the runway threshold marking is intended to aid a pilot on the final stage of the approach.
CASA further reinforced the importance of the visibility of markings as visual aids in 2017 when carrying out its post‑implementation review of the Part 139 legislative framework (CASA, 2017). In reference to the maintenance of visual aids (excluding lights) CASA noted:
Visual aids which become no longer visible and also those which are not maintained in a clearly visible condition pose a safety hazard for aircraft operations.
As a member state of ICAO, Australia should include the ICAO standards and recommended practices in their local requirements. However, a state may lodge a difference with a particular ICAO Annex standard or recommended practice. The differences lodged by Australia were available through the Aeronautical Information Publication, managed by Airservices Australia.
The latest version available from the Airservices Australia website, dated 12 May 2026, stated a difference to Annex 14 paragraph 5.2.1.7. The difference level was listed as ‘Less protective or partially implemented not implemented’ and the difference was stated as ‘not required by Australian standards’. No detail was included to indicate why it was not included in the Australian standards. However, in 2005, Australia notified ICAO of a difference to paragraph 5.2.1.7 of the third edition of Annex 14, stating:
There are no requirements for the use of reflective materials in pavement markings.
Remark: Australia requires more evidence of the safety value of reflective markings before mandating their use.
CASA was asked if it could provide further information regarding the justification for the difference when it was originally lodged. However, due to the time since the difference was lodged, it was unable to locate the relevant files.
On 21 July 2026, following review of the draft report, CASA advised the ATSB that Australia’s current electronic filing of difference (EFOD) to Annex 14 Volume 1 is:
5.2.1.7 Recommendation.— At aerodromes where operations take place at night, pavement markings should be made with reflective materials designed to enhance the visibility of the markings.
The above is a recommended practice not a standard.
Recommended Practice: Any specification for physical characteristics, configuration, matériel, performance, personnel or procedure, the uniform application of which is recognized as desirable in the interest of safety, regularity or efficiency of international air navigation, and to which Contracting States will endeavour to conform in accordance with the Convention.
CASA also clarified:
CASA’s position on the recommended practice and the substance of the finding, which underpinned the EFOD, is:
1. Globally, there are far more airports that DO NOT use glass beading/reflective markings than those that do.
2. Whilst it is noted that significant numbers of aerodromes (e.g. LHR [London Heathrow, United Kingdom], YVR [Vancouver, Canada] and LAX [Los Angeles, United States]) use this system, there are limitations to the effectiveness and Australia has a difference filed with ICAO over this matter.
3. The primary source of Visual Aids for operations at night and in poor weather is the aerodrome lighting system. Any painted markings can become less effective due to glare from water, ice or snow on the movement areas.
International authorities
The requirements and guidance for visual aids for other major international aviation safety authorities were examined. In particular, those from the European Aviation Safety Agency (EASA) and the United States Federal Aviation Administration (FAA).
European Aviation Safety Agency
EASA included details about visual aids, including runway markings and lighting, in Certification Specifications and Guidance Material for Aerodrome Design (CS‑ADR‑DSN). The section on ‘Colour and conspicuity’ was a copy of the standards prescribed in ICAO Annex 14, with additional information on temporary markings (EASA, 2017). However, it did not include the ICAO recommendation for reflective markings for night operations. Instead, it was included in the associated guidance material, which was identical to 5.2.1.7 of Annex14.
United States Federal Aviation Administration
The FAA regulations, contained in Title 14 Code of Federal Regulations Part 139, specifically section 139.311, detailed what markings and lighting must be included, but not the design specifications for each item (FAA, 2004). These details were contained as guidance material in AC 150/5340-1M Design and Installation Details for Airport Visual Aids (FAA, 2020).
Generally, FAA AC were not mandatory, but were ‘practices the FAA recommends to establish an acceptable level of safety…’. However, the applicability section of AC 150/5340-1M indicated that the standards and guidelines detailed in the AC were mandatory for projects funded under Federal grant assistance programs.
The AC stated that there were 2 proven techniques to enhance the contrast (conspicuity) of surface markings:
(1) outlining surface markings with black borders on concrete pavements and light-colored pavements and (2) placing glass beads in paint.60
The first technique was applicable to increasing the contrast on light-coloured surfaces, which was not applicable to this incident, as Gold Coast Airport runway 32 is a dark bitumen runway. The second technique was the use of glass beads on permanent pavement markings, but it did not specify the runway pavement type. This method stated that:
Glass beads identified in Item P-620 of AC 150/5370-1061 are an effective means of enhancing the conspicuity of surface markings when aircraft and vehicles operate at night, during low-visibility conditions, or when the pavement surface is wet.
In the AC, markings that required glass beads included runway centreline, threshold, aiming point, and touchdown zone markings. They were also recommended for runway edge markings.
In the Innovative Pavement Research Foundation Airfield Marking Handbook62 (Innovative Pavement Research Foundation, 2008) it was noted that ‘Water-borne paint … and glass beads … are used in 95 percent of airports, both DOD [Department of Defence] and domestic.’ These statements indicated that it was normal practice, at least in the United States (US), to include glass beads for retroreflectivity in aerodrome markings.
Research on reflective markings
United States Federal Aviation Administration
In addition to its regulatory information, the US FAA has also completed research into the effectiveness of reflective markings. In December 1994, the FAA completed a report titled Evaluation of Retro‑Reflective Beads in Airport Pavement Markings (Bagot, 1994). The objective of the study was to determine the operational benefits gained in using reflective beads in airport pavement markings. The introduction to that report stated:
Airport pavement markings are an important component of ground visual aids for pilots. A common complaint by pilots is that airport pavement markings are not conspicuous. This problem is often seen as a failure to repaint, but the solution involves much more than frequent repainting. It is an involved and expensive task to repaint markings. Consequently, durability and conspicuity of markings may be viewed as a single problem in efforts to improve airport ground safety.
The study included several types of glass beads and examined the effectiveness and durability of those beads with respect to each other and bare paint without beads. This included measurement of the retroreflectivity of the markings using specialised equipment, but importantly also included airborne evaluation of the markings. The test configuration included applying different beads to some of the runway threshold marking stripes and runway centrelines. During the airborne evaluation, a total of 17 approaches were conducted during 3 flights using 3 different aircraft types. The pilots reported differences between the different bead types, but:
It was considered significant that the remaining unbeaded [paint only] stripes were not visible at all to the pilots.
After each of the final approaches, the aircraft was taxied back along the runway to evaluate the conspicuity during taxi. It was again noted that on all 3 tests, the beaded lines were readily acquired from as far as 1,000 ft (approx. 330 m), but the ‘unbeaded stripes were not acquired until the aircraft reached the immediate vicinity.
The study concluded that:
The use of retro-reflective glass beads in airport pavement markings, whether they be Type I (1. 5 lOR)63 or Type III (1. 9 lOR), greatly enhance the conspicuity of the markings on all airport surfaces. This enhancement is amplified on airports without runway centerline or touchdown zone lighting. Throughout this research effort there were no findings that would require limiting the use of glass beads to certain airport surfaces.
It also found that the beaded paint offered positive friction benefits as compared to non‑beaded paint. However, the test markings used in the study included both glass beads and silica grains. A follow‑up evaluation of the effects of glass beads only on the friction characteristics was carried out (Bagot, 1996). This study showed that the addition of glass beads to painted markings increased the friction coefficient of those markings. The increase in friction was present even after damage to the beads from the use of snow ploughs.
The 1994 study was repeated in 2010 to evaluate a different type of glass bead by comparison to existing types (Previti, 2010). That particular study did not include a comparison to non‑reflective paint schemes, but did make some more quantitative assessments. The report noted that it revalidated the research performed in 1994.
A 1978 FAA report Airfield Marking Paints State-of-the-Art (Disko, 1978), included a section on ‘reflectorised’ paint. The section of the report on reflectorised paint stated ‘Glass spheres (beads) are used on most marking paints to reflect light from the aircraft or car back to the pilot or driver, thus making the markings much more visible at night.’ It also noted that ‘During wet weather, however, a water film can cover the spheres, thus rendering the reflectivity ineffective.’ This statement referenced a 1975 report by the Georgia Institute of Technology (Tooke, 1975). Although this may indicate that there was no benefit from the beads when the runway was wet, there have been significant improvements in retroreflective treatments for surface marking paint systems since 1975. For example, further studies by the FAA have included wet testing and evaluation of marking systems (Cyrus, 2015). These studies have found that, although a film of water can reduce the retro-reflectivity, modern systems have better performance than older systems and provide a benefit.
Road research and standards organisations
Road transport authorities have conducted significant research into road marking visibility, particularly in dark wet conditions.
Netherlands Institute for Road Safety
A 1983 study on the Reflection properties of road surfaces carried out by the Netherlands Institute for Road Safety Research SWOV (Schreuder, 1983) found that:
New road paints follow the texture of the surface. They do not, therefore interfere with the drainage of the road; on the other hand, when the paint and the adjoining road is covered with a film of water, the difference in reflection disappears. This means that road paints are invisible on a wet road surface. This is true for all (three) different types of illumination: daylight, public lighting and vehicle lighting.
However, the study also noted that ‘Adding glass beads to the paint enhances the retro‑reflecting properties of the marking quite dramatically in the dry condition, but it does not help at all when wet, because the beads are covered as well by the water film; they are thus rendered useless.’
United States Department of Transport Federal Highway Administration
The US Department of Transport Federal Highway Administration presented information on its website regarding Wet Pavement Marking Retroreflectivity (Federal Highway Administration, 2024). It noted that researchers had found that detection distances of various retroreflective marking systems reduced to between 80% and 17% of the dry values, depending on the system used. This indicated that, while the detectability was degraded, there was a residual amount that with modern systems may be quite significant. It also noted that those studies were based on continuous wetting of 2 inches per hour (51 mm/hr). As noted in the section Weather from the Bureau of Meteorology, the average rainfall in the 10 minutes prior to the landing was about 24 mm/hr. Therefore, the information above was applicable to the occurrence. Furthermore, Gold Coast Airport runway 14/32 was grooved, which roads are not, and assists in drainage of water from the surface.
Swedish National Road and Trasport Research Institute
A 2001 research report by the Swedish National Road and Trasport Research Institute, The performance of wet visibility road markings – final report on Provväg 1998-2000 tested a range of road markings for their performance in wet conditions (Lundkvist and Åström, 2001). The report noted that:
The poor visibility of road markings in the dark and wet is a well known problem. In rainy weather, a reflective water surface is often formed on the surface of road markings, with the result that the light from the vehicle is reflected away from, instead of towards, the vehicle. This is the reason that conventional flat road markings can be hardly seen in the dark when it rains.
The project tested 10 products in real-world conditions over a 2‑year period and concluded that ‘it is possible to produce road markings that have good visibility even in rainy weather’.
ASTM International
In 2001, ATSM International64 released standard E2172 Standard Test Method for Measuring the Coefficient of Retroreflected Luminance (RL) of Pavement Markings in a Standard Condition of Continuous Wetting (ASTM, 2001). This was superseded in 2012 by standard E2832-12 (ASTM, 2012). These standards provided a method for the measurement of the wet retroreflective properties of horizontal pavement marking materials, such as traffic stripes and road surface symbols.
A Texas A&M Transport Institute report Traffic Control Device Analysis, Testing, and Evaluation Program: FY2021 Activities (Finley, 2023), which included a review of wet‑weather pavement markings on roadways using ASTM E2832‑12, noted that ‘Wet‑weather pavement markings have been shown to provide a safety benefit compared to traditional markings.’ It also referred to research into roads with wet-weather pavement markings where the results ‘indicated statistically significant crash reductions across the wet-weather crash types with up to a 60 percent reduction for wet-night fatal and injury crashes’.
Advice from the Australian Airports Association
In trying to better understand what technologies are currently used for runway markings in Australia, the ATSB contacted the Australian Airports Association. In response, the Australian Airports Association advised that:
- Reflective markings are not common on pavements provided for aircraft that are greater than code B.65
- Sometimes glass beads are added to paint, but reports of turbine-engine compressor ‘glazing’ has worried/deterred airport operators.
- Cost may be an issue, and historical practices – it has not been raised as an issue before as lighting is required for night operations.
- Glass beads may be suitable in paint, however, the water-based runway marking paint used at major airports by necessity may not hold the beads and could create a debris hazard:
- Water based ‘Airpave’ paint is used to prevent the build-up of paint layers that flake off and create debris hazards. The Airpave paint was developed in Australia to prevent this hazard as runway centrelines at major airports are repainted between 4 and 12 times per year due to the black rubber deposits/wear and tear.
Noting the concerns regarding glazing, the ATSB conducted a search for glass bead engine glazing issues. The only reference found was an article in The Seattle Times, dated 18 December 2004, that reported on engine glazing due to glass beads from airport markings (Gates, 2024). The article discussed engine glazing identified in up to 10 new Boeing aircraft that was suspected to have originated from a particular taxiway that had recently had the markings reapplied. However, at the time of writing the article, the source of the engine glazing was still under investigation. The article also reported a Boeing spokesman as saying that ‘The damaged engines were never a safety issue…the planes could fly perfectly well’.
Runway excursions
Runway veer-offs (when an aircraft departs the side of the runway) and overruns (when an aircraft departs the end of a runway) are collectively termed runway excursions. The international aviation community has invested a considerable amount of time and resources into reducing the risk of runway excursions.
Runway excursion risks
Flight Safety Foundation research
A Flight Safety Foundation (FSF) report Reducing the Risk of Runway Excursions (Flight Safety Foundation, 2009) noted that of the 1,429 accidents involving commercial transport aircraft in the 14‑year period from 1995 to 2008 that resulted in major or substantial damage, 431 (30%) were runway related. Of those runway-related accidents, 417 (97%) were runway excursions. Forty-one of the runway-related accidents resulted in fatalities and of those, 34 were runway excursions, resulting in 712 fatalities.
Breaking the data down further, the FSF found that 79% of runway excursions were during the landing phase and 21% during take‑off. Of the runway excursions during landing, overruns accounted for 53% and veer‑offs 47%.
Multiple runway excursion risk factors were identified by the FSF (Figure 20). The 2 most common factors were go‑around not conducted and touchdown: long (long landing). The FSF analysis also noted that combinations of risk factors had a significant impact on the overall risk. Of those combinations, a combination of a long and/or fast landing and go‑around not conducted presented the greatest risk of a runway excursion.
Figure 20: Landing excursion top risk factors
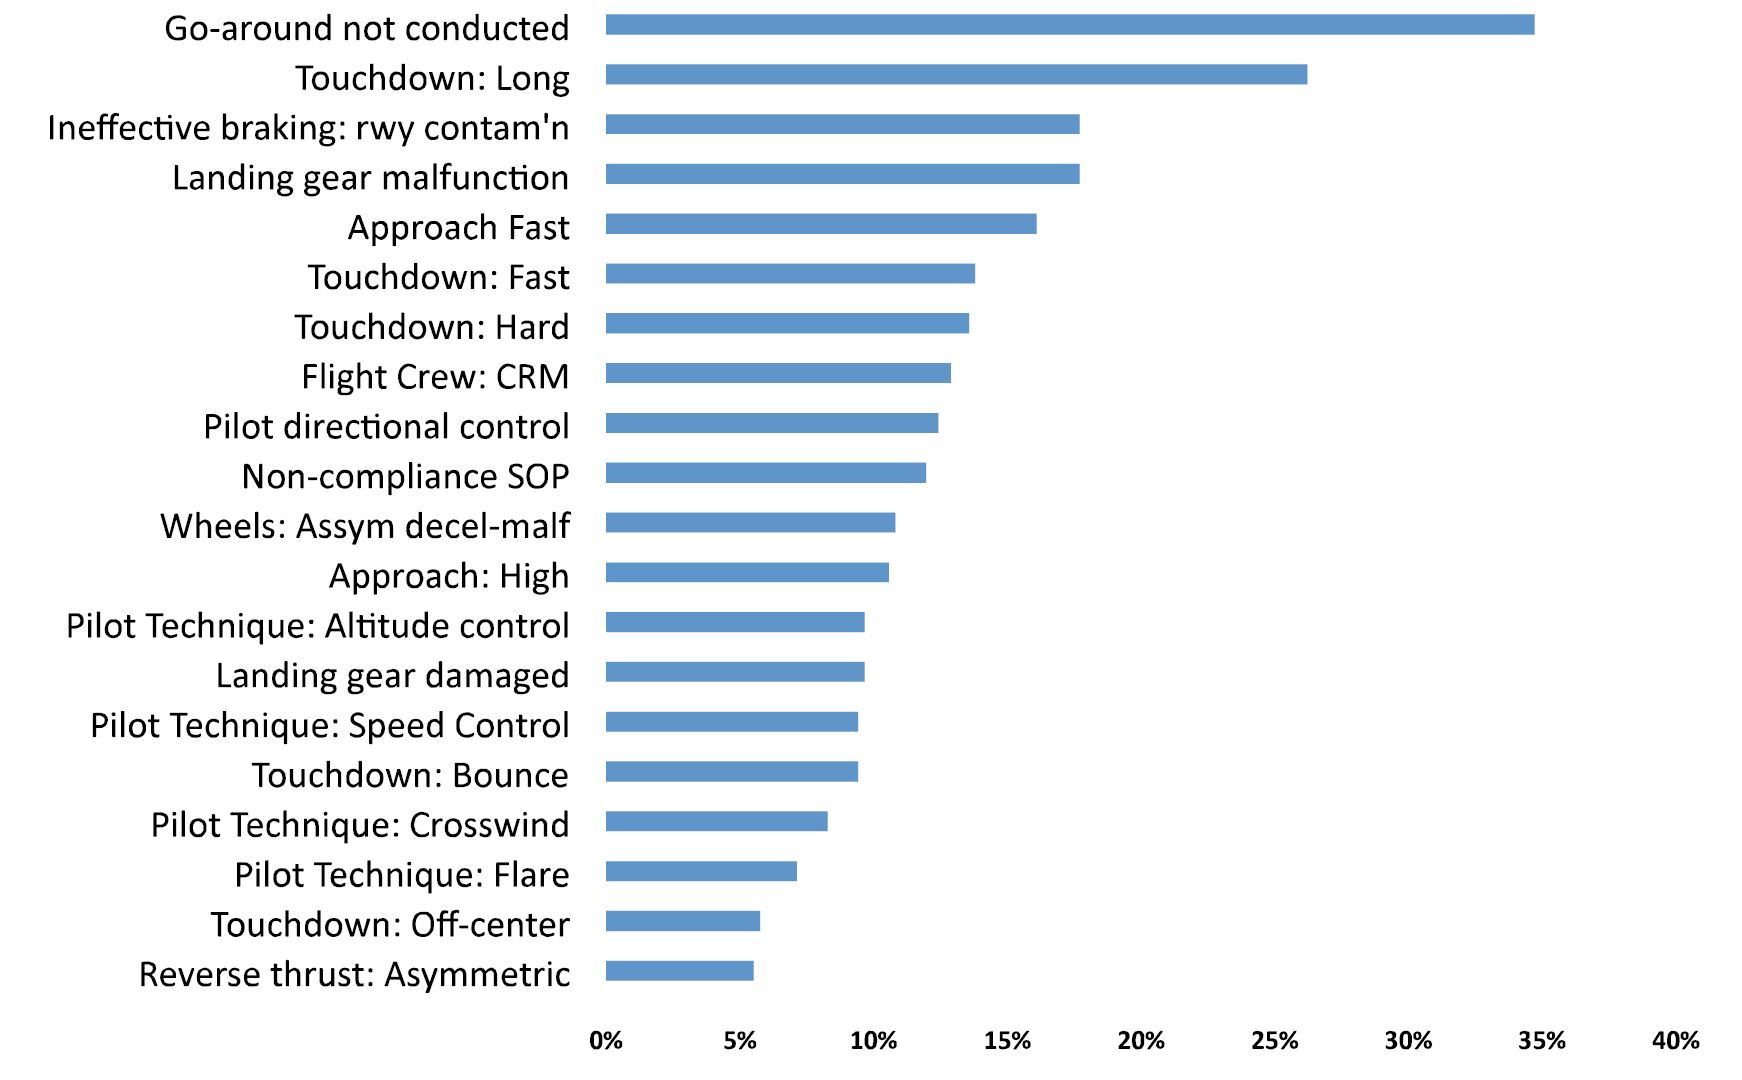
The FSF report also identified failure to provide timely or accurate wind/weather information to the flight crew by air traffic control, and incorrect or obscured runway markings as factors influencing runway excursions.
Boeing
Analysis of commercial jet aircraft accidents by Boeing found that in the period 2002‑2011, runway excursions were the third leading cause of fatalities, behind inflight loss of control and controlled flight into terrain (Stephens and Smith, 2012). It also identified that, in about half of the long landings, the approach was otherwise stable.
In its report Statistical Summary of Commercial Jet Airplane Accidents – Worldwide Operations | 1959-2024, Boeing found that while commercial aircraft accident rates continued to decrease, in the period 2015–2024 runway excursions remained one of the top 4 factors resulting in fatal accidents.66
A 2012 Boeing Aero magazine article Reducing Runway Landing Overruns broke down the factors contributing to runway overrun excursions in the period between 2003 and 2010 (Figure 21). It found that in 45% of the cases, the aircraft did not land within the touchdown zone and 90% landed on an ‘other-than-dry’ runway. In the cases where the aircraft did not land within the touchdown zone, the article did not indicate whether they touchdown before or after the touchdown zone, however, the data in Figure 21 suggests that most, if not all, were beyond the touchdown zone.
Figure 21: Factors in landing runway overruns
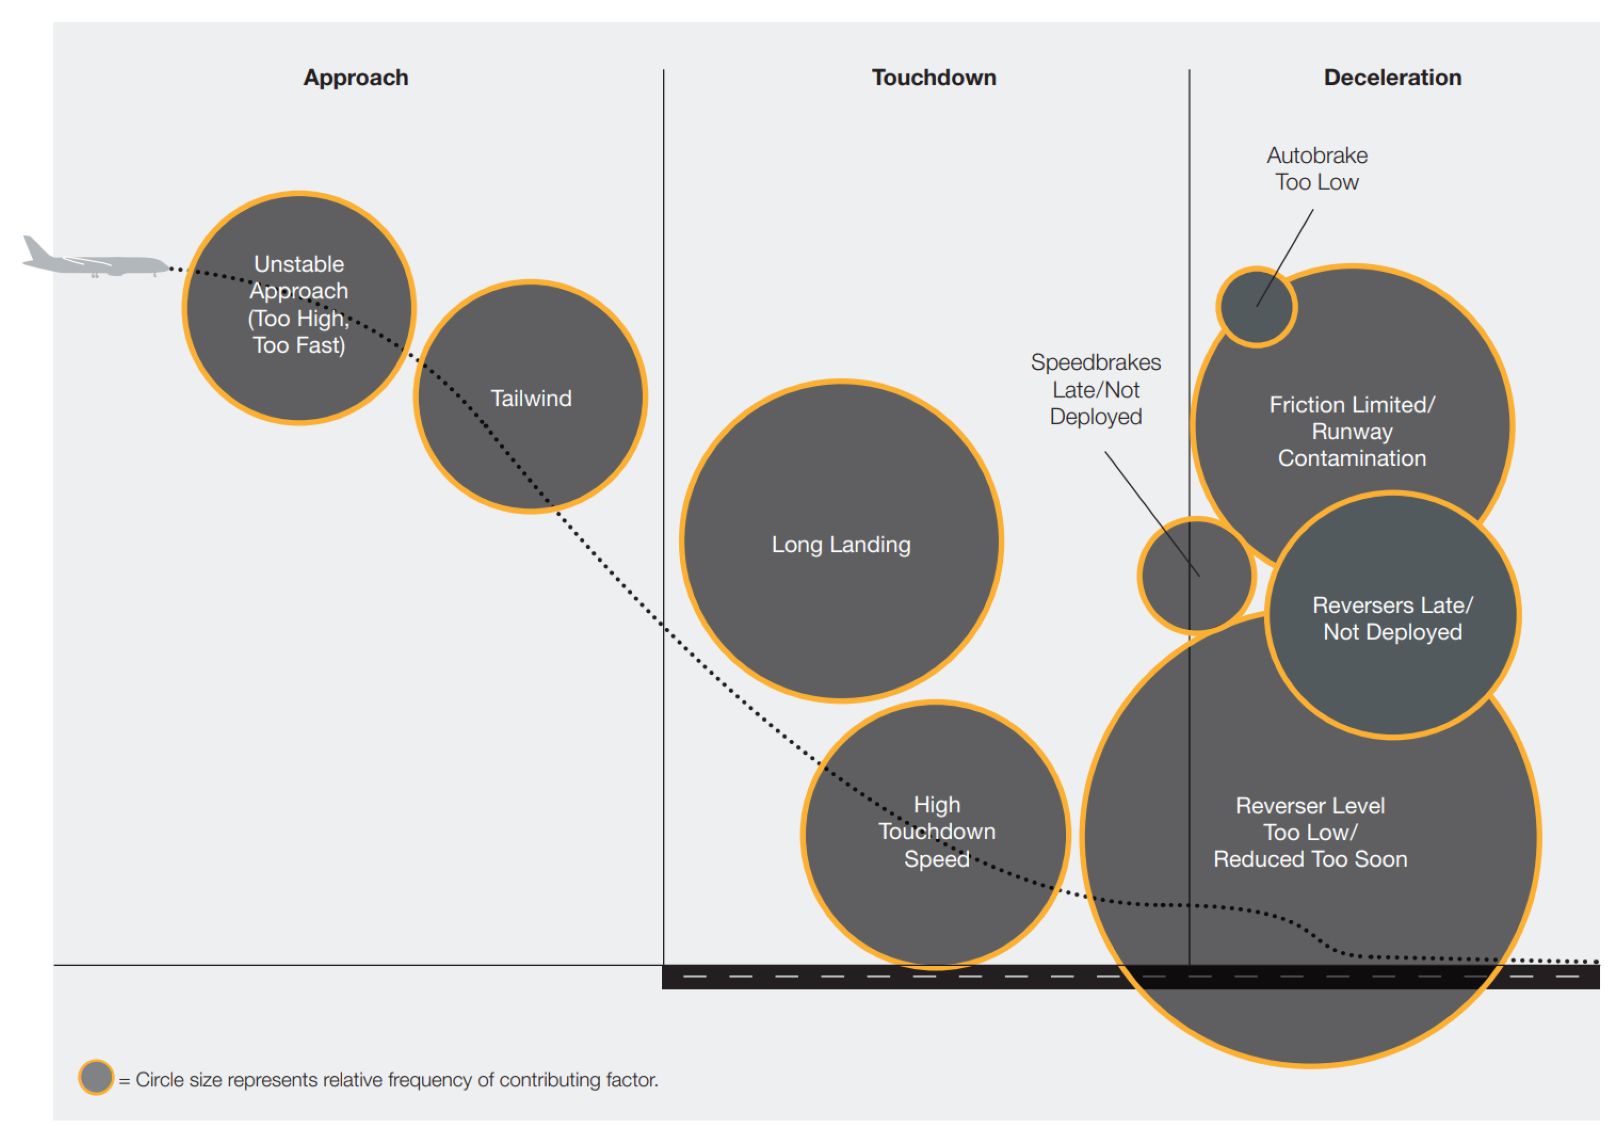
ICAO Global Runway Safety Action Plan
In February 2024, ICAO released the second edition of its Global Runway Safety Action Plan (GRSAP), which identified ‘landing deviations’ as one of the top contributing factors to runway excursions (ICAO, 2024). These deviations included long, floated, bounced, firm, off‑centre and crabbed landings. It further broke these factors down into those where the flight crew did not recognise the incipient or actual landing deviation and those where the flight crew were unable to manage the incipient or actual landing deviation.
The GRSAP also identified a number of latent conditions that could contribute to runway excursions, including absent or inadequate regulations, and inadequate, obscured or poorly maintained visual aids (including signs, marking and lighting).
Australian Transport Safety Bureau
A 2009 ATSB research study of commercial jet runway excursions (ATSB, 2009) studied 141 runway excursion accidents, resulting in 550 fatalities that occurred in the 10‑year period from 1998 to 2007. Of those 141 accidents, 120 occurred during the landing phase. An in‑depth analysis of those 120 accidents was conducted in order to identify the types of flight crew technique and decision‑related, flight crew performance‑related, weather‑related, and systems‑related factors that contribute to runway excursions.
Of note was the assessment of weather‑related factors in runway excursion accidents. The analysis found that weather‑related factors accounted for 37% of all factors identified that contributed to runway excursions and of the 120 runway excursions on landing, 81 (68%) involved at least one potentially unsafe weather factor that contributed to the accident. Wet or contaminated67 runways were present in 64% of the accidents. However, all included other contributing factors, such as unstabilised approaches, long and/or fast landings, or failing to go around where potentially dangerous conditions existed.
The analysis found that some runway accidents occurred when the flight crew was aware of poor weather at the destination airport, but continued with a landing. This may have been due to less than adequate standard operating procedures for landing in potentially unsafe weather conditions, factors such as press‑on‑itis and flight crew fatigue, or overconfidence.
The ATSB review also found that 35 (29%) of the accidents involved a long landing or extended flare (but, identified that the extended flare resulted in a long landing).
Prevention of runway excursions
Flight Safety Foundation
In the Reducing the Risk of Runway Excursions report (Flight Safety Foundation, 2009), the FSF made a number of recommendations to operators, airport operators, air traffic control organisations, regulators, and aircraft manufacturers. Of particular note were the following recommended mitigations:
- Operators should define and train procedures for:
- use of the FSF Runway Excursion Risk Awareness Tool (see copy in Appendix A)
- landing on wet, slippery or contaminated runways.
- airport operators should ensure that visual aids, specifically touchdown zone location and markings, are visible and in accordance with ICAO Annex 14
- air traffic control organisations:
- provide flight crews with timely and accurate information that will reduce the risk of a runway excursion.
- controllers should communicate the most accurate meteorological and runway condition information available to the flight crews in a timely manner.
The FSF also provided advice on the prevention of runway excursions and runway overruns in Briefing Note 8.1 of its Approach-and-landing Accident Reduction (ALAR) Tool Kit (Flight Safety Foundation, 2000). Applicable preventative measures that were not already included in the operator’s policies and procedures included:
- defining a policy to promote readiness and commitment to go around
- incorporate standard calls for runway remaining in low visibility conditions, based on:
- runway-lighting colour change
- runway-distance-to-go markers
- other available visual references (such as runway/taxiway intersections).
Boeing
In its Anatomy of an Overrun (Stephens and Smith, 2012), Boeing did not provide any specific recommendations, but concluded that ‘if landing in the Touchdown Zone is not assured – Go-around!’. Given that these were slides from a conference presentation, further detail may have been verbally provided.
In the Aero magazine article (Boeing, 2012), Boeing recommended that flight crew:
- calculate the landing distance using real-time information
- calculate and brief a go-around point or the latest point on the runway by which the flight crew must touch down.
It also detailed new technologies directed at preventing runway excursions, including landing and flare guidance and long landing alerting. The enhanced ground proximity warning systems fitted to the Boeing 737 also have options available, such as the Honeywell SmartRunway and SmartLanding systems.68 These systems alert flight crew that they have passed the touchdown zone with an aural ‘long landing’ alert, and provide distance remaining advisories. There was no indication in the Virgin Australia documentation that its aircraft contained this technology.
ICAO Global Runway Safety Action Plan
The Global Runway Safety Action Plan (ICAO, 2024) contained recommended actions for the short and medium terms (2027 and 2029, respectively). Recommendations were made to ICAO, Runway Safety Programme partners, state civil aviation authorities, aircraft operators, air navigation service providers, aerodrome operators and the aerospace industry. Applicable recommendations from the GRSAP are presented in Appendix B. Key themes in these recommendations were:
- airports to comply with Annex 14, Volume 1
- operators implement threat and error management programs with emphasis on monitoring and decision making
- flight crews use the most suitable or appropriate level of automation during approach, landing and go-around.
EUROCONTROL/Flight Safety Foundation
A publication the Global Action Plan for the Prevention of Runway Excursions, (GAPPRE) coordinated by EUROCONTROL and the Flight Safety Foundation, and supported by Airbus, Boeing, EASA, the FAA, and others, provided recommendations for the prevention of runway excursions. Recommendations were made to aerodrome operators, air navigation service providers (ANSPs), aircraft operators, aircraft manufacturers, regulators, and ICAO. The following recommendations from the GAPPRE were found to be applicable:
ADR[aerodrome operators]3
If provided, ensure that approach radio navigation aids (e.g. ILS) and visual aids (e.g. AGL, PAPIs and surface markings) are maintained in accordance with ICAO Standards and Recommended Practices.
The associated guidance material in the GAPPRE noted that the navigation and visual aids, including runway markings ‘all help flight crews to fly an adequate flight path to the expected touchdown point on the runway, thus avoiding long or short landings’.
OPS[aircraft operators]21
Aircraft operators should clearly define their policy for a safe landing and publish it in their SOPs and Operations Manuals. This policy should clearly define acceptable touchdown limits and prohibit intentional long and short landings, e.g. to minimise runway occupancy or minimise taxi time to the gate. The supplementing SOPs and guidance should include means, methods and responsibilities with regard to how a crew will identify and act on such limits.
The guidance material pointed out that although most operators have policies defining where touchdown should occur:
...very few have guidance or SOPs explaining how to determine where the touchdown should occur, or how and when to determine whether a go-around should be executed. For example, most operators specify that the aircraft should touch down in the touchdown zone (TDZ), on the centreline; however, they do not train or specify how to determine if the aircraft has passed the TDZ
REG[regulators]1
Regulators should ensure that:
• The national/regional regulations are in line with the relevant ICAO standards and recommended practices; and
• All infrastructure, practices and procedures relating to runway operations are designed and remain in compliance with such national/regional regulations.
REG13
Except where runway TDZ lights are provided, regulators and ICAO should upgrade to a standard the use of simple TDZ lighting as an aid to enhance landing (touch down point) accuracy.
REG14
ICAO should investigate improvements in marking and lighting systems that may enhance the simple TDZ lighting system.
Much of the guidance was on regulators incorporating the GAPPRE recommendations into their processes, and promoting them to industry. Of particular note was:
• Investigating measures to enhance flight crew positional awareness in the runway touchdown zone during approach and landing. Specifically, the improvement of the visual aids may include, for example, lighting systems indicating the end of the touchdown zone. This will help flight crew, especially in conditions where runway markings are difficult to observe, to have an optimal flare and to decide whether to go around, when the timeliness of the decision is a critical parameter affecting the runway excursion risk;
• Investigating the possibility of upgrading to a standard the use of simple touchdown zone lighting. This may enhance flight crew awareness of the touchdown zone and will increase touchdown point accuracy, which is a critical risk factor for the runway overrun risk.
Human factors considerations
Fatigue
ICAO defines fatigue as (ICAO, 2020):
A physiological state of reduced mental or physical performance capability resulting from sleep loss, extended wakefulness, circadian phase, and/or workload (mental and/or physical activity) that can impair a person’s alertness and ability to perform safety related operational duties.
Fatigue can have a range of adverse effects on human performance. These include (Caldwell, 2019):
|
|
Inadequate quantity and quality of sleep is a contributor to fatigue. It is generally agreed that most adults need at least 7 hours of sleep each day to achieve maximum levels of alertness and performance (Hirshkowitz et al, 2015). As well as length of sleep, sleep quality also has an influence on fatigue. Sleep quality refers to the capacity of sleep to restore waking function. Good quality sleep has minimal disruption to the non‑rapid eye movement/rapid eye movement cycle. Frequent fragmentation of this cycle by waking up, or by brief arousals that move the brain to a lighter stage of sleep without actually waking up, decreases the restorative value of sleep (ICAO, 2020). Research has found that sleep fragmentation is known to degrade memory, reaction time, vigilance, and mood (Bonnet, 2003).
Workload
Workload is characterised by the demands of tasks imposed on the limited processing capacity of a person (Wickens, 2021). Factors that affect workload include task demands and situational factors, which can include the weather conditions (Vidulich, 2012). It is also acknowledged that the incident occurred during landing, which is one of the highest workload phases of flight, related to the number of tasks to be completed (Lee, 2003; Bonnet, 2003). Consequences of high workload include allowing performance to degrade or shedding tasks in a non‑optimal fashion by abandoning those that should be performed (Wickens et al. 2021).
Combined effects of workload and fatigue
The relationship between workload and fatigue can be complex, predominantly as both low and high workload can contribute to fatigue. Both the cognitive and physical demands of the work, as well as pace/time pressure can all impact upon an individual’s fatigue levels. Workload can increase the level of fatigue experienced by a person (Goel, 2024) and has similar effects on vigilance, perception and reaction/response times (Civil Aviation Authority, 2023).
The type of task can be inherently more fatiguing, such as descent, approach, and landing (Vidulich, 2012). These phases of flight are characterised by higher workloads compared to other phases and research has found that subjective fatigue and mean response speeds are slower at the end of flights compared to the start of flights. Studies have found that during a multi-sector day pilots’ self-ratings of fatigue were higher and longer lapses occurred compared to a duty day with a single sector (Honn, 2016). This was due to the number of take-offs and landings that occur within a multi-sector duty day, as high workload phases, which can increase the experience of fatigue.
Cognitive lapses occurring when operational demand is high can lead to errors. In turn, if the consequences of the error/s are significant, it may result in a serious incident or accident (Van Dongen, 2017).
Plan continuation bias
According to the Global action Plan for the Prevention of Runway Excursions, a study showed that more than 65% of flight crew reported experiencing a situation where neither pilot called for a go‑around although it was required. While a go‑around is considered a normal procedure for which flight crew are trained, this may explain why they occur infrequently. This may suggest that there are barriers within the aviation system that prevent flight crews from conducting a go‑around. One such barrier may be plan continuation bias (also known as ‘get‑there‑itis’ or ‘press‑on‑itis’), which is described as (EUROCONTROL, Flight Safety Foundation, 2021):
...a proclivity to continue a planned or habitual course of action past the point when changing conditions require altering the plan. This is the strong unconscious tendency to forge ahead with the original plan in spite of changing conditions. This bias grows stronger near the end of the mission as the crew anticipates landing the aircraft and completing the flight. Plan continuation bias may have the effect of obscuring subtle cues which indicate that original conditions and assumptions have changed.
A particularly relevant part of the report noted how flight crews have an unconscious bias towards task completion, such as completing the landing, and it takes particularly compelling cues to alert them of the need to change their plan. In fact, the final report of the Flight Safety Foundation’s Go‑around Decision‑Making and Execution Project identified that for 42% of the approaches that should have been discontinued, plan continuation bias was a factor in them not being discontinued (Blajev and Curtis, 2017).
Related occurrences
Long landings
A search of the ATSB’s occurrence database identified only one other report of a long landing. That occurrence occurred on 5 June 2024, at 2105 local time, at Mackay Airport, Queensland, and involved a Boeing 737 aircraft from a different operator. In that occurrence, the flight crew reported receiving an automated ‘long landing’ alert from the runway awareness and advisory system69 and the aircraft landed about 52% of the way down the runway. Further details about this occurrence were not available as the ATSB did not investigate.
It was possible that there have been other long landings in Australia. However, as there was no specific requirement under the Transport Safety Investigation Regulations to report long landings, they were likely not reported.
Runway excursions involving a long landing
Boeing 747-438 – Bangkok, Thailand (ATSB investigation 199904538)
On 23 September 1999, at about 2247 local time, a Boeing 747‑438 aircraft overran runway 21 Left (21L)70 while landing at Bangkok International Airport, Thailand. The aircraft sustained substantial damage during the overrun.
Thunderstorms and heavy rain were in the area and at the airport during the approach and landing. The flight crew noted no effect from the weather until visibility reduced when the aircraft entered very heavy rain as it descended through 200 ft on late final approach. The aircraft then started to deviate above the 3.15° glideslope, passing over the runway threshold at 169 kts at a height of 76 ft, which were within company limits.
When the aircraft was approximately 10 ft above the runway, the captain instructed the first officer to go around. As the first officer advanced the engine thrust levers, the aircraft’s mainwheels touched down 1,002 m along the 3,150 m runway, 636 m beyond the ideal touchdown point and past the last touchdown zone marker. The captain immediately cancelled the go‑around by retarding the thrust levers, without announcing his actions. Those events resulted in confusion, and contributed to them not selecting (or noticing the absence of) reverse thrust during the landing roll. Due to a variety of factors associated with the cancellation of the go‑around, the aircraft’s speed did not decrease below the touchdown speed until the aircraft was 1,625 m, or halfway down the runway. The aircraft overran the 100 m stopway (at the end of the runway) at a speed of 88 kts, before stopping 220 m later with the nose resting on an airport perimeter road.
The investigation established that, during the landing roll, the aircraft tyres aquaplaned on the water‑affected runway. This limited the effectiveness of the wheel brakes to about one third of that for a dry runway. In such conditions and without reverse thrust, there was no prospect of the flight crew stopping the aircraft in the runway distance remaining after touchdown.
Boeing 737-800 – Darwin Airport, Northern Territory (ATSB investigation 200202710)
A Boeing 737-800 was being operated on a scheduled flight between Brisbane and Darwin, Northern Territory. It was dark and the runway had a temporarily displaced threshold. The aircraft touched down an estimated 1,016 m from the departure end of the runway. During the landing roll, the aircraft overran the runway and came to a stop approximately 44 m into the 90 m runway end safety area. There were no injuries, and the aircraft was not damaged.
The investigation determined that a high approach speed led to a long landing and overrun situation. The captain continued with an unstable approach and did not go around as required by company standard operating procedures. The FO did not announce that the approach was unstable and instruct the captain to go around. Throughout the approach, there were various cues available to both crewmembers to indicate that the approach was unstable and that a go‑around was required.
A number of safety issues identified during the course of the investigation, including: a non‑precision approach at night that was conducive to illusions; a displaced threshold that limited the landing distance available; crew resource management problems; aircraft handling difficulties; an underdeveloped landing approach risk assessment by the flight crew and a safety management system that had yet to incorporate the flight data monitoring programmes advocated by the ICAO and industry associations.
Airbus A340-313 – Toronto, Canada (Transportation Safety Board of Canada investigation A05H0002)
On 2 August 2005, an Airbus A340-313 was landing at Toronto International Airport. The aircraft was on the ILS approach to runway 24 Left and was 200 ft above the runway threshold height when the autopilot and autothrust were disconnected. The aircraft deviated above the glideslope and the groundspeed increased. The aircraft crossed the threshold about 40 ft above the normal glideslope height.
During the flare, the aircraft travelled through an area of heavy rain, and visual contact with the runway environment was significantly reduced. The aircraft touched down about 3,800 ft (1,158 m) past the runway threshold. About 12.8 seconds later, thrust reversers were activated. The aircraft was not able to stop on the 9,000 ft (2,743 m) runway and departed the far end at about 80 kt. The aircraft stopped in a ravine and caught fire. All passengers and crew evacuated the aircraft, but 2 crew and 10 passengers were seriously injured.
The investigation found that the pilot flying increased thrust when disconnecting the autopilot in reaction to a decrease in airspeed and perception that the aircraft was sinking. This resulted in the aircraft deviating above the glideslope and increasing the aircraft’s energy. Approaching the threshold, the aircraft entered an intense downpour, and the forward visibility was severely reduced. The touchdown was long as the aircraft floated due to its excess speed over the threshold and intense rain and lightning made visual contact with the runway very difficult.
Embraer ERJ-170 – Cleveland, Ohio, United States (NTSB investigation AAR-08/01)
On 18 February 2007, an Embraer ERJ-170, was landing on runway 28 at Cleveland Hopkins International Airport, Cleveland, Ohio, during snow conditions when it overran the end of the runway, contacted an ILS antenna, and struck an airport perimeter fence. The aircraft’s nose landing gear collapsed during the overrun. Of the 2 flight crewmembers, 2 flight attendants, and 71 passengers on board, 3 passengers received minor injuries. The aircraft received substantial damage. Instrument meteorological conditions prevailed at the time of the accident.
The National Transportation Safety Board presented the probable cause of the accident was the failure of the flight crew to execute a missed approach [go-around] when visual cues for the runway were not distinct and identifiable. Contributing to the accident were (1) the flight crew’s decision to descend to the ILS decision height instead of the localizer (glideslope out) minimum descent altitude; (2) the first officer’s long landing on a short contaminated runway and the flight crew’s failure to use reverse thrust and braking to their maximum effectiveness; (3) the captain’s fatigue, which affected his ability to effectively plan for and monitor the approach and landing; and (4) the operator’s failure to administer an attendance policy that permitted flight crewmembers to call in as fatigued without fear of reprisals.
Boeing 737-800 – Kingston, Jamaica (NTSB recommendation A-11-92 through -95)
On 22 December 2009, a Boeing 737-800, ran off the departure end of runway 12 after landing at Norman Manley International Airport Kingston, Jamaica. The aircraft landed approximately 4,000 ft (1,219 m) down the 8,911 ft (2,716 m) runway with a 14 kt tailwind component and was unable to stop on the remaining runway length. After running off the runway end, it went through a fence, across a road, and came to a stop on the sand dunes and rocks above the waterline of the Caribbean Sea adjacent to the road. No fatalities or post-crash fire occurred. Eighty-five of the 154 occupants (148 passengers, 4 flight attendants, and 2 pilots) received injuries ranging from minor to serious. The aircraft was substantially damaged. Instrument meteorological conditions and heavy rains prevailed at the time of the accident flight.
The investigation was carried out by the Jamaican Civil Aviation Authority, but the US National Transportation Safety Board assisted and released 4 recommendations to the FAA. These recommendations related to training and guidance in mitigating the risk of runway overruns, and landing distance assessments.
CRJ-700 – Chakeri Airfield, Kanpur, India (DGCA, India)
On 20 July 2011, a CRJ-700 aircraft overran the runway at Chakeri Airfield, Kanpur, India. The flight crew had conducted an uneventful ILS approach in rain. The visibility was reported to be 1,200 m and they had sighted the runway by the decision altitude. At about 43 ft, the pilot flying reduced the throttle to idle and flared the aircraft for landing. The aircraft floated for about 10 seconds before touching down past the middle runway marker, with less than 4,500 ft (1,372 m) of runway remaining. The thrust reversers and speed brakes were deployed, but the aircraft continued off the end of the runway, coming to rest about 200 m beyond the end of the runway.
The investigation found that at the time the aircraft landed, there was an 11 kt tailwind and the required landing distance for the aircraft on a wet/contaminated runway was about 5,000 ft (1,524 m). As such, there was insufficient runway remaining after touchdown for the aircraft to stop within the confines of the runway. The probable cause was listed as a delayed touchdown and tailwind higher than the aircraft limitation.
Safety analysis
Introduction
On 24 January 2023, a Virgin Australia Airlines Boeing 737 aircraft conducted a required navigation performance authorisation required (RNP AR) approach to runway 32 at Gold Coast Airport, Queensland, in instrument meteorological conditions. After becoming visual at about 500 ft, which was above the decision height, the approach was continued to landing. Immediately after touching down, the captain took control, reverse thrust was applied, and the autobraking overridden with maximum manual braking. It was later identified that the touchdown was beyond the touchdown zone, resulting in a long landing.
This analysis will examine the weather conditions and the flight crew’s actions that influenced landing beyond the touchdown zone, including workload and fatigue. It will also discuss the visibility of the runway markings and the effect of the local QNH on the aircraft’s glidepath.
ATIS not updated for change in QNH in a timely manner
The automatic weather information service data from the Bureau of Meteorology indicated that the local sea-level pressure (QNH) at Gold Coast Airport had changed from 1011 hPa, as indicated in the current automatic terminal information service (ATIS) ‘Tango’, to 1012 hPa at 1828. This was 4 minutes before the flight crew were cleared for the runway 32 RNP AR approach, 10 minutes before being cleared to land and 11 minutes before landing. The ATIS was not revised until 1849, 21 minutes after the QNH changed.
While the ATIS was the primary source for flight crew to obtain the airport QNH, weather information could also be passed by the tower controller to the aircraft under their control, pending an update to the ATIS. Although the tower controller passed updated wind information to the flight crew when they were cleared to land, there was no information provided regarding the change in QNH. Thus, the approach was conducted with a QNH setting that did not reflect the current conditions at the airport.
Other factor that increased risk Although the local QNH at Gold Coast Airport had changed 11 minutes before the aircraft landed, the automatic terminal information service (ATIS) had not been updated, nor the flight crew alerted to the change by air traffic control. This resulted in an out-of-date QNH being used for the approach. |
High on the approach – glideslope guidance
The approach to runway 32 was designed with a 3° glideslope which, combined with a threshold crossing height of about 50 ft, directed aircraft to the marked runway aiming point. Once becoming visual, the flight crew had 2 sources of glideslope information available to guide their descent to the runway: the flight director and glideslope deviation provided by the flight management computer (FMC) on the primary flight display, and an external visual path provided by the precision approach path indicator (PAPI) located adjacent to the left and right sides of the aiming point on the runway. The FMC‑derived glideslope should have had the aircraft cross the threshold at 50 ft, while the PAPI glidepath was set to cross the threshold at 53 ft. However, the recorded data showed that the aircraft passed over the runway threshold at about 90 ft above ground level.
While both flight crew described having acquired visual references for the runway before passing the decision altitude of 360 ft, neither specifically stated what their primary glideslope reference was after passing that altitude. To determine what their likely references were, the approach was examined with reference to the likely FMC-glideslope and the PAPI glideslope.
The FO did not recall observing the PAPI during the approach but described transitioning from instruments to visual when disengaging the autopilot. This indicated that after passing below the decision altitude at 360 ft, and up until about 190 ft, their primary reference remained the instruments, which presented the FMC-generated glideslope and not the PAPI indications.
It was less clear what the captain was using for their primary reference. The captain recalled seeing that the PAPI indicated they were slightly high on the approach, suggesting they observed 3 white and 1 red light, but was not sure exactly when that was. The ATSB’s estimation of the actual flightpath (in Figure 15) indicated that the PAPI would have been indicating 3 white and 1 red from the time the runway became visible to about the time the autopilot was disengaged. So, it could have been any time during the visual segment of the approach. However, based on their description during interview, it was most likely around the time the autopilot was disengaged.
The operator required the pilot monitoring to closely monitor the flight path instruments and alert the pilot flying to any deviations when operating in adverse weather conditions. Given that the aircraft’s flight control systems cannot follow the PAPI indications, any corrections made to follow the PAPI glideslope would need to be made by the flight crew. However, there was no indication from the ATSB’s descent profile comparison of any correction to attain the PAPI glidepath (2 white and 2 red lights). Therefore, it was very likely that the flight crew were monitoring the progress of the approach primarily by referencing the FMC-generated glideslope information presented on the primary flight display, rather than the PAPI. This was also evidenced by the strong correlation between the baro‑corrected flightpath and FMC-generated glideslope, which was consistent with the autopilot tracking the FMC‑generated glideslope in VNAV PATH mode.
Being higher on the approach, but at the appropriate glideslope angle, resulted in the aiming point projecting 215 m further along the runway, reducing the available landing distance from 2,042 m to 1,827 m. This was 4 m less than the total landing distance calculated for autobrake 3, but still 451 m greater than the corresponding ground distance.
While referencing the FMC-generated glideslope information rather than the PAPI indications resulted in an inaccurate flightpath that decreased the landing distance margins, the touchdown would still have been within the designated landing area, as shown in Figure 22. Even though it added to the overall magnitude of the long landing, this factor alone did not contribute to the long landing.
Figure 22: Effect of additional landing distance due to excess height on approach
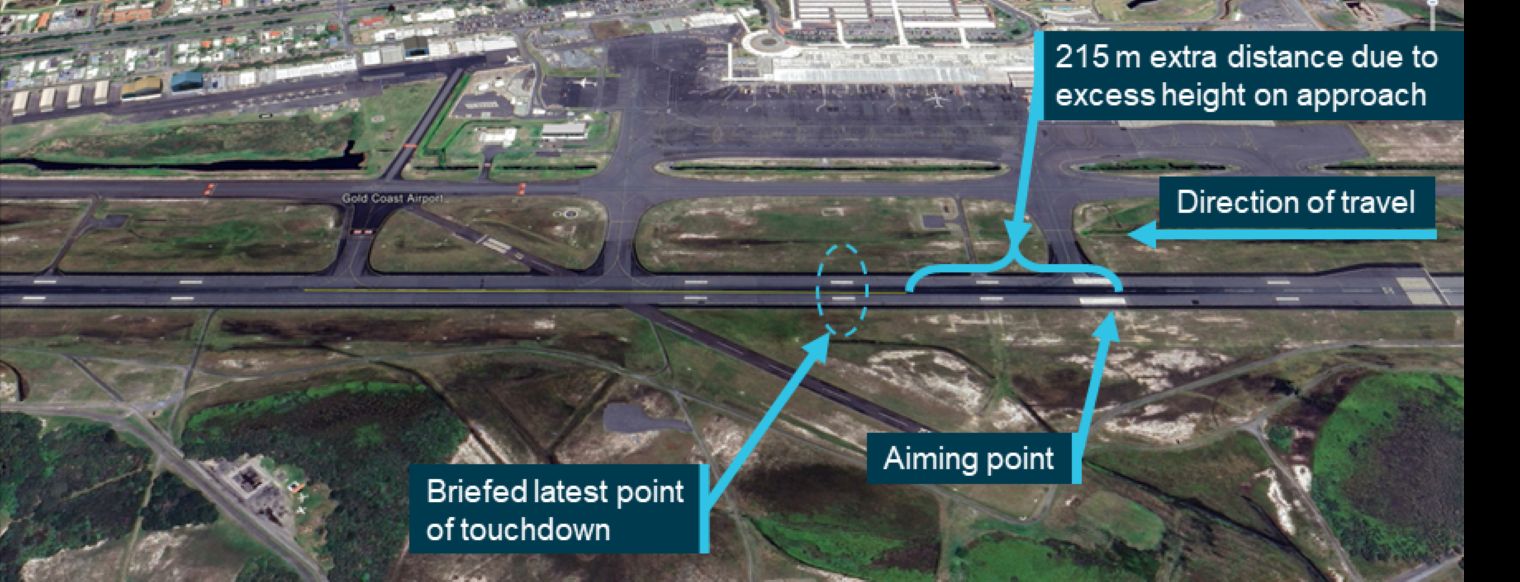
While some aircraft, such as the Boeing 737, may continue to provide vertical guidance below the decision height, flight crews should be aware that it should not be solely relied on. The decision altitude is based on the precision of the approach path guidance, so below this altitude the vertical indications provided by the VNAV system is advisory only and may not assure adequate precision to maintain terrain clearance, or guidance to the aiming point, hence the change to visual references.
There are cases where it is operationally advantageous to keep the autopilot engaged below the decision altitude, such as in this case, to aid in flight path and workload management. However, it is important that flight crew maintain and use visual references to ensure that the autopilot is flying the approach path accurately.
Though there was no indication that the flight crew used the PAPI for flight path guidance, there was no specific requirement for them to reference the PAPI during the visual portion of the approach. It would, however, have provided them with information to assist with accurately flying the approach to the runway aiming point.
Other factor that increased risk The flight crew were very likely using the flight management computer (FMC)‑generated glidepath as their primary glideslope reference during the approach segment below the decision altitude. However, as the barometric pressure setting varied from the local QNH, the aircraft was about 35 ft above the expected glidepath. |
Flare conducted too high
Examination of the recorded flight data identified that the first officer (FO), who was the pilot flying, initiated the flare manoeuvre in a manner consistent with the Boeing landing technique except that it was commenced 44 ft above the runway, which was 24 ft above that recommended by Boeing. This resulted in the aircraft floating and travelling further along the runway before touching down. Given that the aircraft landed about 1,175 m past the threshold, which was 850 m beyond the aiming point, and the additional height on the approach added 215 m to the landing distance, the remaining distance travelled of about 635 m was due to the float and any tailwind component.
The tailwind varied between 0 and 2.4 kts during the air segment of the landing. Although this fluctuated, assuming an average tailwind of 1.2 kts, the additional distance travelled during the 14 seconds between passing the runway threshold and touching down due to the tailwind was about 8.6 m. Thus, the early flare alone would have resulted in the aircraft touching down about 626 m from the aiming point, about 330 m beyond the latest point of touchdown marker (Figure 23).
Figure 23: Effect of additional landing distance due to early flare
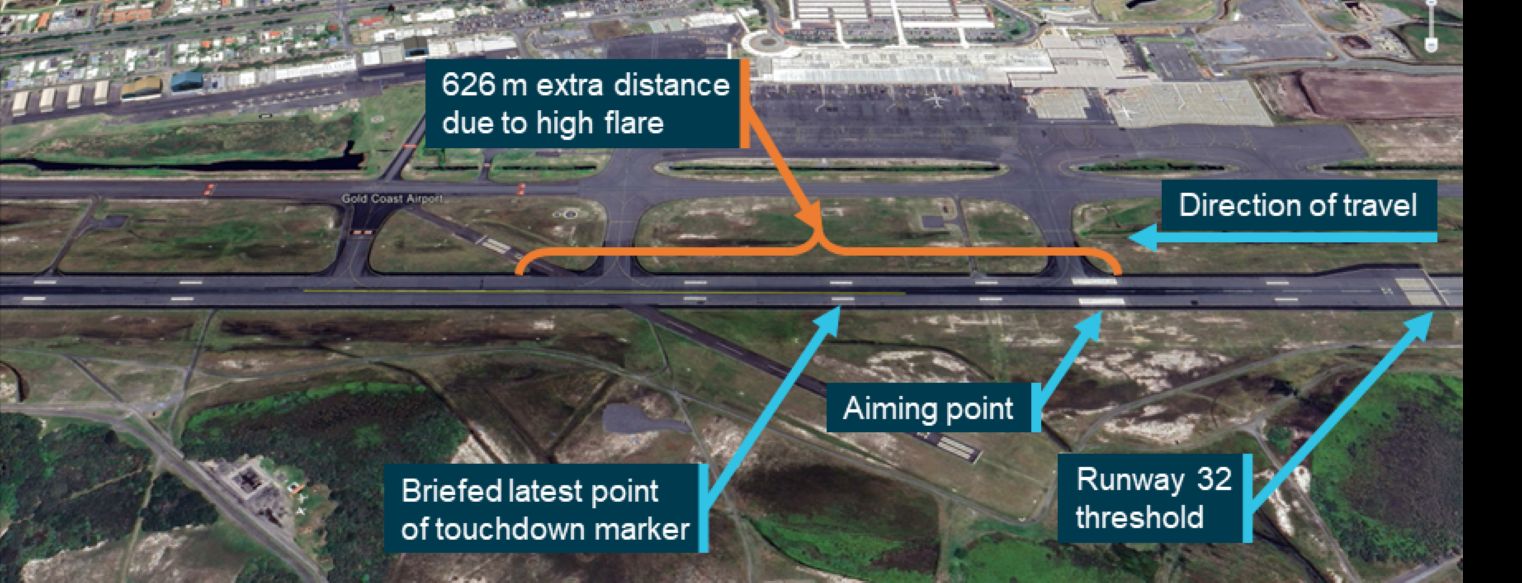
There was no indication that the FO intentionally flared high for any operational reason, or that they were even aware that they had. However, they reported their preference for judging the flare was by using visual references rather than the automatic altitude callouts. This left them susceptible to the associated visual illusions. Both flight crew reported not being able to see the runway markings, so the runway width was given only by the runway edge lighting, which was 6 m wider than the actual runway width. This would result in the runway appearing to be the same width as the marked runway when the aircraft was 3 to 4 ft higher above the runway. As this was much less than the 24 ft of excess height on the flare, there were likely other factors, such as the increase in the apparent brilliance of the runway lighting in heavy rain making the lights appear closer, which affected the FO’s ability to judge the appropriate flare height. While the ATSB was unable to determine the specific influence of all the potential factors, this incident highlights the importance of using more reliable sources of height information, such as automatic height callouts, to judge the flare, particularly in poor weather conditions when visual references are reduced.
Contributing factor The pilot flying initiated the flare manoeuvre at a height above that recommended, leading to a delayed touchdown. |
Flight crew did not identify passing touchdown zone
The operator’s procedures specified that a go‑around must be conducted should it become apparent that the aircraft will touch down past the latest point of touchdown. Both flight crew had displayed an awareness of this as they had nominated the second last touchdown markers as their latest point. However, the effectiveness of this requirement was reliant on them identifying that they had passed, or would pass, beyond this point.
In this case, both flight crew reported that they knew the aircraft floated after the flare, but were unable to see the touchdown zone markings. Therefore, neither flight crew had identified they had passed both the designated latest point of touchdown and the last of the touchdown zone markers. Consequently, they continued the landing.
However, after touching down, it became apparent to both flight crew that the landing was probably long, although neither was sure, nor could they say by how far they had passed beyond the touchdown zone. The recorded data showed that the aircraft touched down over halfway along the runway, beyond the touchdown zone and about 860 m from the runway end. Based on the landing performance calculations, the aircraft required a ground distance of at least 1,376 m with autobrake 3 selected. As a result, there was insufficient runway distance remaining to stop if the flight crew continued with the planned autobrake 3 landing and the aircraft would have very likely overrun the runway end if no intervention was taken. In taking manual control of the braking about 2 to 3 seconds after touching down and applying maximum manual braking, the captain likely identified that there was insufficient runway remaining in which to stop the aircraft using autobrake. What prompted the captain to do this was unclear, but given the extended flare and that they were only about 80 m from the start of the yellow runway edge lights, which indicated that there was 600 m of runway remaining, they probably realised that they had landed long. While their awareness did not prevent a long landing, the captain’s quick actions at this point likely prevented a runway overrun.
While in this case the landing was completed safely, the research from the Flight Safety Foundation and others has shown that long landings are a significant contributor to runway overruns, which are one of the leading contributors to fatal accidents.
There were several criteria in the operator’s policies and procedures that had the potential to have resulted in the flight crew rejecting the landing and conducting a go‑around. However, these required the flight crew to identify that the aircraft was not going to land safely within the touchdown zone. As the crew did not identify they had passed the touchdown zone until after they had touched down, they were committed to the landing once the thrust reversers had been deployed.
There was some advice, such as that from the Flight Safety Foundation in its Approach‑and‑Landing Accident Reduction tool kit, that standard operating procedures include standard calls for distance remaining based upon runway lighting colour, distance to go markers or other visual references, such as runway/taxiway intersections. Virgin Australia had not incorporated any of these into their operating procedures, but their potential effectiveness for this occurrence was assessed.
Gold Coast runway 32 edge lighting included a light colour change from white to yellow to indicate the last 600 m of runway. However, there were no changes in lighting colour to indicate the touchdown zone, nor were there any requirements to do so. Likewise, Gold Coast Airport did not have runway distance remaining signs to assist the flight crew in identifying if there was sufficient landing distance remaining.
Airport information is primarily provided to flight crews and operators through the Aeronautical Information Package, notably in the aerodrome charts and the En Route Supplement Australia. While these publications include a scale diagram of the aerodrome layout showing the location of taxiwaysFigure 6, it does not include information on the runway markings or the extent of the touchdown zone. As such, the only way for flight crew to use other physical characteristics such as taxiway and runway intersections would be through personal experience. This personal knowledge could be built up over time for airports that the pilots operate into regularly, such as their home base, but is not a formal process for preventing long landings.
The captain mentioned that they thought there was a taxiway near the last of the touchdown markers but noted they did not recall passing the taxiway during the landing. Thus, even though the captain had an alternate visual reference for the touchdown zone, it was ineffective in this case.
Further complicating the use of other visual references is the potential variation in the designated latest point of touchdown, which may not correspond with the last of the touchdown zone markers. For example, in this case, the landing calculations dictated that the last point of touchdown was to be between the last 2 touchdown zone markers. To provide a positive identification, the FO elected to use the second last of the markers. On runway 32, this marker was located about halfway between taxiway D and A, which has no specific visual references, particularly in the dark.
While the use of other visual references, such as runway intersections and taxiways can be of general assistance they are not a reliable substitute for the formal runway markings and should not be relied on to prevent a long landing when runway markings are not visible, as was highlighted by this occurrence.
Contributing factor The flight crew did not identify that they had passed the last touchdown point and continued the landing. As a result, the aircraft landed beyond the touchdown zone, reducing the available stopping distance. |
Visibility of runway markings on dark and wet runway
Although the aircraft landed about 6 minutes before sunset, both flight crew reported they encountered dark-night conditions. This was likely due to the low overcast cloud, rising terrain to the west and heavy rain.
Given these dark conditions, the primary light available to illuminate the runway markings was the aircraft’s landing lights. The status of the landing lights was not recorded by the quick access recorder, so it could not be positively confirmed that they were on at the time of landing. However, it is standard procedure for the landing lights to be on for landing and the flight crew recollection of being able to see the runway markings earlier in the approach suggests that they were on.
While the flight crew reported that they were visual with the runway for the landing, the aircraft encountered heavy rain during the final approach and landing. The intensity and quantity of the rain leading up to the landing likely resulted in a layer of water over the runway surface. The distance in which the aircraft was brought to a speed suitable for taxi indicated that the water was not sufficiently deep to reduce the braking effectiveness beyond that included in the performance calculations. However, it was very likely to be sufficient to wet the runway, making the surface reflective. This was consistent with the ATIS reported runway conditions, and the FO’s description of the ‘glassy’ runway.
As noted by the Netherlands Institute for Road Safety Research, road paints follow the texture of the surface and when covered by a film of water the difference in the reflective properties of the paint and road surface disappear and the paints are invisible (Schreuder, 1983). Given the similarity of road and runway construction methods and materials, this road research is equally applicable to runways. As the runway markings consisted only of white paint, with the wet surface and dark night conditions, it was likely that the markings were not visible to the flight crew during the landing flare.
Contributing factor The combination of the time of day, overcast skies, and heavy rainfall created conditions akin to a dark night. Under these conditions, the presence of water on the runway likely diminished the visibility of the painted markings to such an extent that they were likely not visible to the flight crew during the landing flare. |
High workload and fatigue
Both flight crew reported they experienced a sustained high workload throughout the day due to operating in weather conditions that required them to adjust their flight paths. The incident occurred during the approach and landing phases of flight, which was already a high-workload period due to the number of tasks to be completed. Further, the weather conditions required the flight crew to constantly review their plans, and consider alternate landing airports, which also increased their workload.
People have a limited processing capacity, and when additional demands are present, various inputs and tasks may be both voluntarily and involuntarily shed. Both flight crew reported aspects of their actions that were consistent with being task saturated. For example, the FO reported that they were so focused on the landing that they thought they may have missed a call from the captain, which is a common sign of task saturation. The captain also reported becoming task saturated to the point it affected their ability to make decisions.
The captain, as the pilot monitoring, was responsible for monitoring a range of variables, including the configuration of the aircraft, the flightpath and the performance of the FO. This required collating multiple sensory inputs from a range of sources and forming them into an understanding of the aircraft’s current and future states. These were used by the pilot monitoring to determine whether the aircraft would safely achieve the desired future state, in this case, the safe landing of the aircraft within the confines of the runway. There were 2 opportunities identified by the ATSB where the captain could have used their understanding of the aircraft state to call for the approach and landing to be aborted and a go-around conducted. The first was when the aircraft was high on the approach path resulting in a difference between the PAPI and instrument glideslope indications, and the second was when they lost visual reference of the aircraft’s position along the runway.
The captain recalled that, at some stage during the approach the PAPI indicated that they were a little high, however, they could not recall how high or when that was. This lack of detail in recollection could be a result of the effects of fatigue, the time between the incident and when the captain was interviewed, or related to the captain’s ability to collate and align the various information sources during the flight, particularly as it occurred during a period of high workload. The captain could also not recall if they alerted the FO to the PAPI indications. This reduction in vigilance and communication is consistent with the effects of fatigue, particularly in a high-workload environment, where the attentional resources are saturated.
According to the operator’s procedures, the captain should have called for a go-around if the aircraft was not going to land within the touchdown zone. The lack of visual runway references reported by the flight crew and the delayed touchdown should have alerted the captain to the likelihood of a long landing and the need to call for a go-around. The captain’s concerns about a go-around in the weather conditions, and limited alternative options may have influenced their decision to continue the landing. Alternatively, while they reported no external pressure to land, it was also possible they continued with the approach as they were experiencing a level of plan continuation bias. Specifically, the 2 opportunities discussed above were not sufficient to alert the captain to change the plan to land.
Some workload factors have also been associated with fatigue. One example is the number of sectors flown. This is due to the number of take-offs and landings that occur within a multi-sector duty day as high-workload phases can increase the experience of fatigue. The flight crew was rostered for a 4-sector duty, with the incident occurring at the end of the third sector. The time of the incident was coincident with an increased risk of fatigue as a result of the repeated high workload phases.
To determine whether the captain was experiencing a level of fatigue to adversely affect performance, the ATSB considered a range of factors. These included the time of day, sleep quality and quantity, the captain’s self-assessment, and workload across the day, including the incident flight. The captain reported they were feeling tired that day. In addition to the workload experienced, the captain recalled that in the 3 days preceding the incident, the sleep obtained was disrupted and of poor quality. They also reported challenges in readjusting their sleep patterns after completing multiple flights across time zones and overnight – also known as back-of-clock operation (Thomas, 2007). These factors can increase a person’s level of fatigue. Overall, the high workload nature of the flights on the day of the incident and the captain’s reduction in sleep quality increased their potential for fatigue.
The biomathematical fatigue risk modelling indicated that the captain was unlikely to experience fatigue during the flight. However, considering the factors and indicators described above, it was likely that the captain did experience a level of fatigue that adversely affected their performance. In the context of the high workload that both flight crew experienced during the landing, this level of fatigue likely contributed to the captain not calling for a go-around when the 2 opportunities of the high approach and loss of visual runway references presented themselves.
Contributing factor The flight crew’s prolonged high workload, due to the weather conditions throughout the day and during the approach and landing, likely had an adverse effect on their performance. The captain was also likely experiencing fatigue due to the combination of poor-quality sleep in the previous days and high workload, further affecting their performance. |
Visibility of runway markings at Gold Coast Airport
While the runway markings at Gold Coast Airport were consistent with the Civil Aviation Safety Regulations Part 139, there was no requirement for them to contain any retroreflective materials. Similarly, the regulations did not require runway 32 to have touchdown zone lighting.
On a dry runway during daylight hours, the ambient lighting and contrast with the runway surface may generally be sufficient for standard paint markings to distinguish the aiming point and extent of the touchdown zone to the flight crew of an aircraft on approach and during landing. This was not the case for the flight crew on the incident flight, where it was dark and the runway was wet. As previously discussed, this resulted in the runway markings not being visible to the flight crew late in the approach and landing.
The conspicuity of painted runway markings may be adequate for many night operations on a dry runway. However, research by the United States Federal Aviation Administration found that the inclusion of retroreflective beads in runway markings greatly enhanced the visibility and conspicuity of markings on all runway surfaces in dark conditions. This resulted in flight crews being able to acquire the markings much earlier than those without. It also noted that the enhancement in conspicuity was amplified at airports without runway touchdown zone lighting (Bagot, 1994). There was no indication in this research that the testing included wet runways. The Netherlands Institute for Road Safety Research had previously identified that a film of water rendered retroreflective glass beads ineffective (Schreuder, 1983). Yet, more recent wet-weather test standards, research, and testing by the Federal Aviation Administration and others indicated that this was no longer applicable with modern marking systems. As such, retroreflective material in the runway markings would improve the conspicuity of runway markings in dark/wet conditions.
Contributing factor The runway markings at Gold Coast Airport did not contain retroreflective material, nor was there a requirement for them to, making it difficult for flight crew to discern the markings in certain conditions. |
Incompatibility of air traffic control alerting tools and limits for updating the QNH
The Integrated Tower Automatic Suite (INTAS) system that was in use at Gold Coast Airport could alert the tower controller to changes in various weather parameters. However, the INTAS system threshold to alert the controller of a change in the QNH was greater than the allowable variation listed in the Manual of Air Traffic Services (MATS) for updating the ATIS. The threshold in the INTAS system was a 2 hPa change, whereas the MATS requirement was a 1 hPa change. This meant that, for changes in QNH between 1 and 2 hPa, there was a reliance on the tower controller to observe a QNH change and recognise that the ATIS required revision.
After this incident, when the ATIS was revised from Tango to Uniform, the only change was the QNH, which had changed by 1 hPa. This showed that the change was recognised by the tower controller and they updated the ATIS, as required. However, it took 21 minutes from when the QNH changed to when the ATIS was updated, during which time 2 aircraft completed RNP AR approaches, including the incident aircraft.
While not a precision approach, RNP AR approaches ‘permit operations using reduced obstacle clearance tolerances’ (ICAO, 2021). Given that the vertical navigation is based on barometric altitude, it is important that the altitude be accurate. This requires the barometric setting on the aircraft altimeter to accurately reflect the actual QNH for the landing airport. Fortunately, in this case, the QNH change resulted in the aircraft being high on the approach, increasing the terrain clearance. However, a QNH change in the other direction could result in a reduced terrain clearance.
The International Civil Aviation Organization (ICAO) design standard for RNP AR approaches, which was the basis for the Australian RNP AR approach design standard, based the terrain clearance on a number of error variables, including a 20 ft ATIS error. However, a 2 hPa difference between the actual QNH and the altimeter setting can result in an altitude error of about 54 ft, which is 34 ft not accounted for in the approach design. As such, and consistent with the Flight Safety Foundation Reducing the Risk of Runway Excursions report recommendations (Flight Safety Foundation, 2009), it is vital that the QNH is updated in a timely manner to ensure the flight is conducted within the approach design parameters. While it was noted that a 1 hPa (27 ft) change is greater than the approach design philosophy of 20 ft ATIS error, the QNH is truncated (rounded down) to the nearest whole number, so the altimeter will always read less than the actual altitude. As this is an underreading error, the aircraft will be higher than indicated, improving the terrain clearance, but not so much as to result in a flight path instability.
Tower controllers have multiple responsibilities that take their attention away from continually monitoring weather changes. The INTAS system used by the controllers had a function that could assist with alerting to changes that required an ATIS revision. However, the difference between the system alerting threshold and the MATS requirements did not ensure that controllers were provided the best opportunity to identify the need to revise the ATIS, leaving approaching aircraft vulnerable to potential altitude errors.
For comparison, had the control tower been closed, the weather information transmitted on the secondary ATIS frequency would have been from the automatic weather information service. As this was an automated system, changes in the QNH would have been updated immediately, providing flight crews with up-to-date weather information.
Other factor that increased risk The Airservices Australia Integrated Tower Automatic Suite (INTAS) system QNH change alert threshold was greater than that required for revision of the automatic terminal information service (ATIS), leaving it reliant on the controller to identify smaller changes in QNH that require ATIS revision. This could result in flights conducting required navigation performance authorisation required (RNP AR) approaches operating with altitude errors greater than those used in the design of the approach. (Safety issue) |
Requirements for the visibility of markings used as visual aids
Australia has generally adopted the ICAO Annex 14 requirements for visual aids. However, it has chosen not to adopt the recommended practice for reflective markings on aerodromes that include night operations and has lodged a difference to Annex 14. Although the use of reflective markings is not a mandatory part of Annex 14, other significant aviation authorities have adopted the use of retroreflective markings and, in the United States, it is a required element when the project involving visual aids is funded by the government.
The Australian aerodrome regulations specify that runway markings be ‘clearly visible’. However, neither the Manual of Standards nor the associated guidance material in advisory circular AC 139.C-09 mentioned using reflective materials to improve the visibility of markings in degraded visual conditions, such as at night and/or when the runway was wet. The inclusion of information regarding reflective markings would increase the likelihood of aerodrome operators using reflective markings to improve the safety of operations in adverse conditions. However, there was nothing prohibiting their use. As such, the lack of such guidance material did not directly influence this incident.
The Australian Airports Association reported concerns regarding turbine engine ‘glazing’ from retroreflective glass beads may be deterring some aerodrome operators. While this was a valid consideration, the ATSB was unable to identify any cases of this creating an unsafe condition.
The Civil Aviation Safety Authority identified in its Part 139 Manual of Standards post‑implementation review, that ‘Visual aids which become no longer visible and also those that are not maintained in a clearly visible condition pose a safety hazard for aircraft operations.’ Thus, it is important that runway markings be visible in all conditions in which an aerodrome is likely to be operated, and the incorporation of reflective materials in markings be appropriately considered for Australian aerodromes.
By not incorporating the ICAO Annex 14 recommended practice for reflective markings into the advisory material, there was limited regulatory assurance that aerodrome operators considered the visibility of runway markings for operations in dark, wet conditions. It was also contrary to the many recommendations aimed at the prevention of runway excursions, which call for full compliance with Annex 14.
Other factor that increased risk While recommended by the International Civil Aviation Organization, the Civil Aviation Safety Authority did not provide guidance for airport operators on considering the use of reflective materials to enhance the visibility of runway markings as visual aids for operations at night, especially in conditions when the markings may be wet. (Safety issue) |
Findings
ATSB investigation report findings focus on safety factors (that is, events and conditions that increase risk). Safety factors include ‘contributing factors’ and ‘other factors that increased risk’ (that is, factors that did not meet the definition of a contributing factor for this occurrence but were still considered important to include in the report for the purpose of increasing awareness and enhancing safety). In addition, ‘other findings’ may be included to provide important information about topics other than safety factors. Safety issues are highlighted in bold to emphasise their importance. A safety issue is a safety factor that (a) can reasonably be regarded as having the potential to adversely affect the safety of future operations, and (b) is a characteristic of an organisation or a system, rather than a characteristic of a specific individual, or characteristic of an operating environment at a specific point in time. These findings should not be read as apportioning blame or liability to any particular organisation or individual. |
From the evidence available, the following findings are made with respect to the long landing involving Boeing 737-8FE, VH-YQM at Gold Coast Airport, Queensland, on 24 January 2023.
Contributing factors
- The pilot flying initiated the flare manoeuvre at a height above that recommended, leading to a delayed touchdown.
- The flight crew did not identify that they had passed the last touchdown point and continued the landing. As a result, the aircraft landed beyond the touchdown zone, reducing the available stopping distance.
- The combination of the time of day, overcast skies, and heavy rainfall created conditions akin to a dark night. Under these conditions, the presence of water on the runway likely diminished the visibility of the painted markings to such an extent that they were likely not visible to the flight crew during the landing flare.
- The flight crew’s prolonged high workload, due to the weather conditions throughout the day and during the approach and landing, likely had an adverse effect on their performance. The captain was also likely experiencing fatigue due to the combination of poor-quality sleep in the previous days and high workload, further affecting their performance.
- The runway markings at Gold Coast Airport did not contain retroreflective material, nor was there a requirement for them to, making it difficult for flight crew to discern the markings in certain conditions.
Other factors that increased risk
- Although the local QNH at Gold Coast Airport had changed 11 minutes before the aircraft landed, the automatic terminal information service (ATIS) had not been updated, nor the flight crew alerted to the change by air traffic control. This resulted in an out-of-date QNH being used for the approach.
- The flight crew were very likely using the flight management computer (FMC)‑generated glidepath as their primary glideslope reference during the approach segment below the decision altitude. However, as the barometric pressure setting varied from the local QNH, the aircraft was about 35 ft above the expected glidepath.
- The Airservices Australia Integrated Tower Automatic Suite (INTAS) system QNH change alert threshold was greater than that required for revision of the automatic terminal information service (ATIS), leaving it reliant on the controller to identify smaller changes in QNH that require ATIS revision. This could result in flights conducting required navigation performance authorisation required (RNP AR) approaches operating with altitude errors greater than those used in the design of the approach. (Safety issue)
- While recommended by the International Civil Aviation Organization, the Civil Aviation Safety Authority did not provide guidance for airport operators on considering the use of reflective materials to enhance the visibility of runway markings as visual aids for operations at night, especially in conditions when the markings may be wet. (Safety issue)
Safety issues and actions
Central to the ATSB’s investigation of transport safety matters is the early identification of safety issues. The ATSB expects relevant organisations will address all safety issues an investigation identifies. Depending on the level of risk of a safety issue, the extent of corrective action taken by the relevant organisation(s), or the desirability of directing a broad safety message to the Aviation industry, the ATSB may issue a formal safety recommendation or safety advisory notice as part of the final report. All of the directly involved parties were provided with a draft report and invited to provide submissions. As part of that process, each organisation was asked to communicate what safety actions, if any, they had carried out or were planning to carry out in relation to each safety issue relevant to their organisation. Descriptions of each safety issue, and any associated safety recommendations, are detailed below. Click the link to read the full safety issue description, including the issue status and any safety action/s taken. Safety issues and actions are updated on this website when safety issue owners provide further information concerning the implementation of safety action. |
Incompatibility of air traffic control alerting tools and the requirements for updating the QNH
Safety issue number: AO-2023-018-SI-02
Safety issue description: The Integrated Tower Automatic Suite (INTAS) QNH change alert threshold was greater than that required for revision of the automatic terminal information service (ATIS), leaving it reliant on the controller to identify smaller changes in QNH that require ATIS revision. This could result in flights conducting required navigation performance authorisation required (RNP AR) approaches operating with altitude errors greater than those used in the design of the approach.
Requirements for the visibility of runway markings as visual aids
Safety issue number: AO-2023-018-SI-01
Safety issue description: While recommended by the International Civil Aviation Organization, there was no Australian guidance for airport operators on considering the use of reflective materials to enhance the visibility of runway markings as visual aids for operations at night, especially in conditions when the markings may be wet.
Safety advisory notice to Australian aerodrome operators
| SAN number: | AO-2023-018-SAN-001 |
Visual landing aids, such as runway markings, which become no longer visible pose a safety hazard for aircraft operations. The ATSB encourages operators of Australian aerodromes to consider including reflective materials in visual aid markings on runways that are used for night operations, particularly those where there is a reasonable likelihood of the runway also becoming wet.
Glossary
| ACARS | Aircraft communications addressing and reporting system |
| AC | Advisory circular |
| EDT | Eastern daylight saving time |
| EST | Eastern standard time |
| AFS | Auto flight system |
| AGL | Above ground level |
| ANP | Actual navigation performance |
| ANSP | Air navigation service provider |
| APCH | Approach |
| APV | Approach with vertical guidance |
| ATC | Air traffic control |
| ATIS | Automatic terminal information service |
| AWIS | Automatic weather information system |
| BoM | Bureau of Meteorology |
| CASA | Civil Aviation Safety Authority |
| CAT | Category |
| CRM | Crew resource management |
| CVR | Cockpit voice recorder |
| EASA | European Aviation Safety Agency |
| FAA | United States Federal Aviation Administration |
| FCOM | Flight crew operating manual |
| FDR | Flight data recorder |
| FMC | Flight management computer |
| FO | First officer |
| FSF | Flight Safety Foundation |
| GAPPRE | Global Action Plan for the Prevention of Runway Excursions |
| GBAS | Ground based augmentation system |
| GLS | GBAS landing system |
| GNSS | Global navigation satellite system |
| GP | Glidepath |
| GPS | Global positioning system |
| GRSAP | Global Runway Safety Action Plan |
| hPa | Hectopascals |
| ICAO | International Civil Aviation Organization |
| ILS | Instrument landing system |
| INTAS | Integrated tower automatic suite |
| kt | Knots |
| LNAV | Lateral navigation |
| MATS | Manual of air traffic services |
| METAR | Meteorological report |
| MOS | Manual of Standards |
| NOTAM | Notice to airmen |
| NTSB | National Transportation Safety Board |
| OPPM | Operating Policies and Procedures Manual |
| PAPI | Precision approach path indicator |
| PBN | Performance-based navigation |
| PF | Pilot flying |
| PM | Pilot monitoring |
| QAR | Quick access recorder |
| QNH | Local sea-level pressure |
| QRH | Quick reference handbook |
| RNAV | Area navigation |
| RNP | Required navigation performance |
| RNP AR | RNP authorisation required |
| SBAS | Satellite based augmentation system |
| SOP | Standard operating procedure |
| TAF | Terminal area forecast |
| TDZ | Touchdown zone |
| TEM | Threat and error management |
| US | United States of America |
| UTC | Universal coordinated time |
| VASIS | Visual approach slope indicator system |
| VNAV | Vertical navigation |
| VPA | Vertical path angle |
| Vref | Reference airspeed |
Sources and submissions
Sources of information
The sources of information during the investigation included:
- the flight crew
- Virgin Australia Airlines
- Gold Coast Airport
- Civil Aviation Safety Authority
- Airservices Australia
- International Civil Aviation Organization
- Australian Airports Association
- Flight Safety Foundation.
References
3M (2019). eBook Reliable wet retroreflectivity, when drivers need it most. https://www.3m.com/3M/en_US/road-safety-us/products/wet-reflective-pavement-markings/ 31 May 2024
Airport Technology (2014) webpage article. Airservices Australia commissions Integrated Tower Automation Suite at Melbourne Airport. https://www.airport-technology.com/news/newsairservices-australia-commissions-integrated-tower-automation-suite-at-melbourne-airport-4198688
ATSM International standard E2176-01 (2001). Standard Test Method for Measuring the Coefficient of Retroreflected Luminance (RL) of Pavement Markings in a Standard Condition of Continuous Wetting
ATSM International standard E2832-12 (2012). Standard Test Method for Measuring the Coefficient of Retroreflected Luminance of Pavement Markings in a Standard Condition of Continuous Wetting (RL-2)
Australian Transport Safety Bureau (2009). Runway excursions Part 1: A worldwide review of commercial jet aircraft runway excursions. ATSB transport safety report - Aviation research and analysis report – AR-2008-018(1).
Australian Transport Safety Bureau (2009). Runway excursions Part 2: Minimising the likelihood and consequences of runway excursions An Australian perspective. ATSB transport safety report - Aviation research and analysis report – AR-2008-018(2).
Bagot, K.W. (1994). Evaluation of Retro-Reflective Beads in Airport Pavement Markings. United States Federal Aviation Administration report DOT/FAA/CT-94/120.
Bagot, K.W. (1996). Follow-On Friction Testing of Retro-Reflective Beads. United States Federal Aviation Administration report DOT/FAA/AR-TN96/74.
Blajev, T. & Curtis, W. (2017). Flight Safety Foundation Go-Around Decision-Making and Execution Project. https://flightsafety.org/toolkits-resources/go-around-project-final-report/
Boeing Company, The (2025). Statistical Summary of Commercial Jet Airplane Accidents – Worldwide Operations | 1959-2024. Downloaded from https://www.boeing.com/content/dam/boeing/boeingdotcom/company/about_bc…
Bonnet, M. H., & Arand, D. L. (2003). Clinical effects of sleep fragmentation versus sleep deprivation. Sleep medicine reviews, 7(4), 297-310.
Bureau d'Enquetes et d'Analyses pour la Security de l'Aviation Civile (BEA), safety study The Get-home-Itis Syndrome. https://bea.aero/fileadmin/uploads/tx_scalaetudessecurite/the.get.home.itis.syndrome_01.pdf
Bureau of Meteorology. (2023). Product information: Aerodrome forecast (TAF and TAF3). http://www.bom.gov.au/aviation/data/education/taf.pdf
Caldwell, J.A. & Caldwell, J.L. (2016). Fatigue in aviation: A guide to staying awake at the stick. Routledge.
Caldwell, J.A., Caldwell, J.L., Thompson, L.A., & Lieberman, H.R. (2019). Fatigue and its management in the workplace, Neuroscience and Biobehavioral Reviews, 96, 272–289.
Civil Aviation Authority (2023) Flight-crew human factors handbook. West Sussex, United Kingdom Government.
Civil Aviation Safety Authority. (2017). Notice of Proposed Rule Making (NPRM) 1426AS Post-implementation review of the legislative framework for Part 139 – Aerodromes. Annex D, Summary of proposed changes to the Part 139 MOS. Australian Government.
Civil Aviation Safety Authority. (2020). Part 139 (Aerodromes) Manual of Standards 2019.Compilation No. 1, Australian Government.
Civil Aviation Safety Authority. (2020). Advisory circular 139.C-09v1.0 Visual Aids, Markings, Signals and Signs. Australian Government.
Civil Aviation Safety Authority. (2021). Advisory circular 91-05v1.0 Performance-based navigation. Australian Government.
Civil Aviation Safety Authority. (2023). Multi-part Advisory circular AC 91-32 and AC 139-22 v1.0 Global reporting format – Runway surface condition. Australian Government.
Cyrus, H. & Patterson, J. Jr. (2015). Evaluation of Structured Methyl Methacrylate Marking to Increase Paint Conspicuity, United States Federal Aviation Administration report DOT/FAA/TC-TN15/50.
Disko, R.W. PhD, (1978). Airfield Marking Paints State-of-the-Art, US Department of Transportation – Federal Aviation Administration report FAA-RD-78-104.
EUROCONTROL & Flight Safety Foundation. (2021). The Global Action Plan for the Prevention of Runway Excursions (https://www.eurocontrol.int/publication/global-action-plan-prevention-runway-excursions-gappre) or (https://flightsafety.org/toolkits-resources/gappre/)
European Aviation Safety Agency. (2017). Certification Specifications and Guidance Material for Aerodromes Design CS-ADR-DSN, Issue 4.
Federal Aviation Administration. (2004). Title 14 of the Code of Federal Regulations Pat 139 Certification of Airports. United States Government.
Federal Aviation Administration. (2010). Basics of aviation fatigue (advisory circular 120-100). United States Government.
Federal Aviation Administration. (2018). Advisory circular 150/5370-10H - Standard Specifications for Construction of Airports. United States Government.
Federal Aviation Administration. (2020) Advisory circular 150/5340-1M Change 1 - Standards for Airport Markings. United States Government.
Federal Highway Administration. (n.d.). Home/Safety/Other Safety Areas/Lighting and Nighttime Visibility / Chapter 5: Wet Pavement Marking Retroreflectivity. Retrieved 06 August 2024, form https://highways.dot.gov/safety/other/visibility/synthesis-pavement-marking-research/chapter-5-wet-pavement-marking
Flight Safety Foundation. (2009). Reducing the Risk of Runway Excursions, report of the Runway Safety Initiative. https://flightsafety.org/wp-content/uploads/2016/09/fsf-runway-excursions-report.pdf
Flight Safety Foundation. (2000). Approach-and-landing Accident Reduction Tool Kit Briefing Notes. Retrieved 09 July 2024, from https://flightsafety.org/toolkits-resources/past-safety-initiatives/approach-and-landing-accident-reduction-alar/alar-briefing-notes-in-english/
Flight Safety Foundation. (2000). Approach-and-landing Accident Reduction Tool Kit Briefing Note 5.3 – Visual Illusions. Retrieved 10 March 2026, from https://flightsafety.org/wp-content/uploads/2016/09/alar_bn5-3-illusions.pdf
Flight Safety Foundation. (2000). Approach and Landing Accident Reduction Toolkit Briefing Note 8.1 Runway Excursions And Runway Overruns. Retrieved from https://flightsafety.org/wp-content/uploads/2016/09/alar_bn8-1-excursions.pdf
Gates, D. (2004). Boeing Field beads damage new jet engines. The Seattle Times. https://www.seattletimes.com/business/boeing-field-beads-damage-new-jet-engines/
Gawron, V.J. (2016). Overview of self-reported measures of fatigue. The International Journal of Aviation Psychology, 26(3-4):120–131, doi:10.1080/10508414.2017.1329627.
Goel, N., Abe, T., Braun, M. E., & Dinges, D. F. (2014). Cognitive workload and sleep restriction interact to influence sleep homeostatic responses. Sleep, 37(11), 1745-1756.
Hirshkowitz, M., Whiton, K., Albert, S.M., Alessi, C., Bruni, O., DonCarlos, L., Hazen, N., Herman, J., Katz, E.S., Kheirandish-Gozal, L. & Neubauer, D.N. (2015). National Sleep Foundation’s sleep time duration recommendations: methodology and results summary. Sleep health, 1(1), pp.40-43.
Honn K.A., Satterfield B.C., McCauley P., Caldwell J.L. & Van Dongen H.P. (2016). Fatiguing effect of multiple take-offs and landings in regional airline operations. Accident Analysis and Prevention, 86:199–208, doi: 10.1016/j.aap.2015.10.005.
Innovative Pavement Research Foundation. (2008). Airfield Marking Handbook. Report IPRF 01 G 002 05 1. http://www.iprf.org/products/main.html
International Civil Aviation Organization. (2018). Procedures for Air Navigation Services – Aircraft Operations, Volume 1 – Flight Procedures (6th ed.). Montreal, Canada: International Civil Aviation Organization.
International Civil Aviation Organization. (2020). Manual for the oversight of fatigue management approaches (2nd ed., version 2). Montreal, Canada: International Civil Aviation Organization.
International Civil Aviation Organization. (2021). Doc 9157 Aerodrome Design Manual. Fifth Edition Part 4 – Visual Aids. Montreal, Canada: International Civil Aviation Organization.
International Civil Aviation Organization. (2021). Doc 9905 Required Navigation Performance Authorisation Required (RNP AR) Procedure Design Manual (3rd ed.). Montreal, Canada: International Civil Aviation Organization.
International Civil Aviation Organization. (2022). Annex 14 to the Convention on International Civil Aviation, Volume I Aerodrome Design and Operations (9th ed.). Montreal, Canada: International Civil Aviation Organization.
International Civil Aviation Organization. (2023). Doc 9613 Performance-based Navigation (PBN) Manual (5th ed.). Montreal, Canada: International Civil Aviation Organization.
International Civil Aviation Organization. (2024) Runway Safety Programme – Global Runway Safety Action Plan (2nd ed.). https://www.icao.int/Aerodromes/RunwaySafety/Pages/default.aspx
International Civil Aviation Organization. (2024). Runway Safety Programme - Global Runway Safety Action Plan (2nd ed.). Montreal, Canada: International Civil Aviation Organization.
Jones, C.B., Dorrian, J., Jay, S.M., Lamond, N., Ferguson, S., & Dawson, D. (2006). Self-Awareness of Impairment and the Decision to Drive After an Extended Period of Wakefulness. Chronobiology International, Vol. 23, No. 6: 1253-1263.
Jenkins, M., & Aaron Jnr, R.F. (2012). Reducing runway landing overruns, Boeing AERO, 47, 15-19. https://skybrary.aero/sites/default/files/bookshelf/1938.pdf
Lee, Y. H., & Liu, B. S. (2003). Inflight workload assessment: Comparison of subjective and physiological measurements. Aviation, space, and environmental medicine, 74(10), 1078-1084.
Lundkvist, S-O, & Åström, S. (2001). The performance of wet visibility road markings – final report on Provväg 1998 – 2000. Swedish National Road and Transport Research Institute.
Okubo, K. & Entzinger, J. O. (2021). An overview of flare techniques and flare training methods. Paper for the 32nd Congress of the International Council of Aeronautical Sciences. University of Tokyo, School of Engineering.
Petrilli, R.M., Roach, G.D., Dawson D., & Lamond, N. (2006). The sleep, subjective fatigue, and sustained attention of commercial airline pilots during an international pattern. Chronobiology international, (6),1357-1362.
Previti, A.J, Cyrus, H. & Gallagher, D.W. (2010). Airborne Evaluation of Retro-Reflective Beads, United States Department of Transportation – Federal Aviation Administration report DOT/FAA/AR-TN10/8.
Roach, G.D., Petrilli, R.M., Dawson, D. & Lamond, N. (2012). Impact of layover length on sleep, subjective fatigue levels, and sustained attention of long-haul airline pilots, Chronobiology International, 29(5): 580–586. doi: 10.3109/07420528.2012.675022.
Schreuder, D.A. (1983). Reflection Properties of Road Surfaces, Report number R-83-52 (page 15) Institute for Road Safety Research SWOV, The Netherlands.
SKYbrary Aviation Safety. Reference Speed (Vref). Retrieved 27 May 2025, from https://skybrary.aero/articles/reference-speed-vref
SKYbrary Aviation Safety. Landing Flare. Retrieved 10 March 2026, from https://skybrary.aero/articles/landing-flare
Stephens, A.T. & Smith, M.H. (2012). Anatomy of an Overrun. Boeing presentation at the Flight Safety Foundation 65th International Air Safety Seminar.
Finley, M.D., Theiss, L., Venglar, S., Habermann, J., & Pike A.M. (2023) Traffic Control Device Analysis, Testing, and Evaluation Program: FY2021 Activities. Texas A&M Transport Institute
Thomas, M.J.W., Petrilli, R.M., & Roach G.D. (2007). The Impacts of Australian Transcontinental ‘Back of Clock’ Operations on Sleep and Performance in Commercial Aviation Flight Crew. Centre for Applied Behavioural Science, University of South Australia. Australian Transport Safety Bureau Grant B2005/0121. https://www.atsb.gov.au/sites/default/files/media/29956/b20050121.pdf
Tooke, W. R. & Hurst, D. R., (1975). Final report on GDOT research project no. 6701: Wetnight visibility study. Georgia Institute of Technology. Engineering Experiment Station.
Van Dongen, H.P.A., Balkin, Hursh S.R. (2017). Performance deficits during sleep loss and their operational consequences. In Principles and practice of sleep medicine 6th edition (405-413).
Vidulich, M. A., & Tsang, P. S. (2012). Mental workload and situation awareness. In Salvendy, G (ed), Handbook of human factors and ergonomics, 4th edition, 243-273.
Wickens, C. D., Helton, W. S., Hollands, J. G., & Banbury, S. (2021). Engineering psychology and human performance. Routledge.
Submissions
Under section 26 of the Transport Safety Investigation Act 2003, the ATSB may provide a draft report, on a confidential basis, to any person whom the ATSB considers appropriate. That section allows a person receiving a draft report to make submissions to the ATSB about the draft report.
A draft of this report was provided to the following directly involved parties:
- Civil Aviation Safety Authority
- Airservices Australia
- Virgin Australia Airlines
- the flight crew
- Gold Coast Airport
- Australian Airports Association.
Submissions were received from:
- Civil Aviation Safety Authority
- Airservices Australia
- the flight crew
- Gold Coast Airport.
The submissions were reviewed and, where considered appropriate, the text of the report was amended accordingly.
Appendices
Appendix A – Flight Safety Foundation – Runway Excursion Risk Awareness Tool
Appendix B – ICAO Global Runway Safety Action Plan
Applicable recommendations
| Stakeholder | Recommendation |
| State Civil Aviation Authorities, Aircraft Operators, Air Navigation Service Providers, Aerodrome Operators and Aerospace Industry | Ensure all infrastructure, radiotelephony phraseology, practices and procedures relating to runway operations are in compliance with ICAO, Regional and State provisions. |
| State Civil Aviation Authorities | Certify aerodromes used for international operations in accordance with Annex 14 Vol I. |
| Include requirements addressing flight crew use of the most suitable or appropriate level of automation during approach, landing and go-around in recurrent training. | |
Establish requirements for operators to define and apply: a. Threat and Error Management (TEM) strategies for flight crew to prevent runway excursions, and SOPs [standard operating procedures], in accordance with regulations and manufacturers’ guidance on take-off, landings and go-around, ensuring these incorporated into training. b. Policies and training that clearly define actions for Pilot Flying (PF) and Pilot Monitoring (PM), including interventions by PM. | |
| Aircraft Operators | Ensure flight crew complete Crew Resource Management (CRM) and Threat and Error Management (TEM) training addressing runway excursion prevention with emphasis on team decision making, effective monitoring and appropriate Pilot Monitoring (PM) intervention. |
| Implement TEM strategies for flight crew to prevent runway excursions, and SOPs, in accordance with regulations and manufacturers’ guidance on take-off, landings and go-around, ensuring these incorporated into training. | |
| Implement policy and training that clearly define actions for Pilot Flying (PF) and Pilot Monitoring (PM), including interventions by PM. | |
| Ensure rejected take off/landing policy defines all scenarios that may require the discontinuation of an approach or take off and train pilots to perform them when necessary. | |
| Establish policies that require that flight crew be prepared to execute a go-around. | |
| Support flight crew use of the most suitable or appropriate level of automation during approach, landing and go-around. | |
| Work with ANSPs [Air Navigation Service Providers] to implement procedural changes to reduce the rate of un-stabilized approaches, particularly to runways identified as having higher risk. | |
| Aerodrome Operators | Ensure that runways, runway strips, manoeuvring areas and their associated visual aids such as signs, marking, lighting, etc. conform with ICAO Annex 14 Vol I. |
Purpose of safety investigationsThe objective of an ATSB safety investigation is to improve transport safety through:
In accordance with the TSI Act, the ATSB does not investigate for the purpose of taking administrative, regulatory or criminal action, and cannot apportion blame, assist in determining liability, or, as a general rule, assist in court proceedings. About ATSB reportsATSB safety investigation reports are developed in accordance with ATSB procedures and guidelines, and with regard to applicable international standards and instruments. Reports must include factual material of sufficient weight to support the investigation’s analysis and findings. At all times the ATSB endeavours to balance the use of material that could imply adverse comment with the need to properly explain what happened, and why, in a fair and unbiased manner. An explanation of terminology used in ATSB investigation reports is available here. Publishing informationReleased in accordance with section 25 of the Transport Safety Investigation Act 2003 Published by: Australian Transport Safety Bureau © Commonwealth of Australia 2026 Ownership of intellectual property rights in this publication Unless otherwise noted, copyright (and any other intellectual property rights, if any) in this report publication is owned by the Commonwealth of Australia. Creative Commons licence 
With the exception of the Commonwealth Coat of Arms, ATSB logo, and photos and graphics in which a third party holds copyright, this report is licensed under a Creative Commons Attribution 4.0 International licence. The CC BY 4.0 licence enables you to distribute, remix, adapt, and build upon our material in any medium or format, so long as attribution is given to the Australian Transport Safety Bureau. Copyright in material obtained from other agencies, private individuals or organisations, belongs to those agencies, individuals or organisations. Where you wish to use their material, you will need to contact them directly. |
- ^ Eastern Daylight saving Time (EDT): Universal Coordinated Time (UTC) +11 hours;
Eastern Standard Time (EST) – UTC +10 hours. At the time of the occurrence, Queensland was operating on EST, which was 1 hour behind New South Wales. As the occurrence was in Queensland, EST will be used in all further references in this report. - ^ Pilot flying (PF) and pilot monitoring (PM): procedurally assigned roles with specifically assigned duties at specific stages of a flight. The PF does most of the flying, such as planning for descent, approach and landing, except in defined circumstances. The PM carries out support duties, monitors the PF’s actions and the aircraft’s flight path and configuration to ensure the aircraft would safety achieve the desired future state.
- ^ The provision of current, routine information to arriving and departing aircraft by means of continuous and repetitive broadcasts during the hours when the unit responsible for the service is in operation. Each version of the ATIS is assigned a code, which consists of a letter, sequencing through the alphabet as it is revised. Refer to section titled Provision of weather information from air traffic control for more information on the processes for the update of ATIS.
- ^ ACARS is a digital datalink system for the transmission of messages between aircraft and ground stations.
- ^ A computer-based tool provided by the aircraft manufacturer to replace the original paper-based performance charts and tables, allowing the flight crew to accurately and quickly complete the performance calculations for the flight. Among other functions, the tool calculated the aircraft’s landing performance based on the weight, configuration, and environmental conditions.
- ^ Runway number: the number represents the magnetic heading of the runway divided by 10. The runway identification may include L, R or C as required for left, right or centre.
- ^ Required navigation performance – a form of performance-based navigation. A navigation specification for where the performance is based on the required level of accuracy, integrity, continuity, availability and functionality. RNP navigation requires aircraft systems capable of on-board performance monitoring. Where more than one approach of the same type is provided to the same runway, these are identified by an alphabetical suffix commencing at the end of the alphabet: for example, RWY 19 ILS-Z, and RWY 19 ILS-Y identify 2 different instrument landing system (ILS) approaches to the same runway. [Airservices Australia – Aeronautical chart user guide, version 4, 19 January 2024].
- ^ Decision altitude: A specified altitude in a 3D instrument approach operation at which a missed approach must be initiated if the visual reference to continue the approach has not been established.
- ^ The autobrake system has 4 settings, 1, 2, 3 and MAX, which determines the deceleration rate for the landing.
- ^ Sourced from the aircraft’s radio altimeter, which measures the height above the terrain directly below the aircraft. The antennas are located on the aircraft belly and calibrated to display 0 ft at touchdown.
- ^ A threshold marking helps identify the beginning of the runway that is available for landing.
- ^ A marking on the runway surface that serves as a visual aiming point for pilots.
- ^ A manoeuvre that decreases the rate of descent and airspeed to transition from the final descent to the touchdown on the runway. This normally involves an increase in pitch and reduction in engine thrust.
- ^ Given that the aircraft was on the ground in Sydney, it was assumed that this was the weather radar on the Bureau of Meteorology public website (www.bom.gov.au) rather than the aircraft’s weather radar.
- ^ A condition where a pilot tries to reach their destination at all costs (Bureau d'Enquetes et d'Analyses pour la Security de l'Aviation Civile (BEA), safety study The Get-home-Itis Syndrome, https://bea.aero/fileadmin/uploads/tx_scalaetudessecurite/the.get.home.itis.syndrome_01.pdf).
- ^ Precision approach path indicator (PAPI): a ground-based system that uses a system of coloured lights used by pilots to identify the correct glide path to the runway in visual conditions. Refer to section Approach slope guidance for more information on the PAPI.
- ^ A Honeywell proprietary terrain avoidance and warning system that provides the flight crew with sufficient information and alerting to detect a potentially hazardous terrain situation. It also provides altitude callouts during the approach to enhance the flight crew’s situation awareness.
- ^ Instrument meteorological conditions: weather conditions that require pilots to fly primarily by reference to instruments, and therefore under instrument flight rules, rather than by outside visual reference. Typically, this means flying in cloud or limited visibility.
- ^ METAR: a routine report of meteorological conditions at an aerodrome. METAR are normally issued on the hour and half hour.
- ^ Aerodrome forecast (TAF): a statement of meteorological conditions expected for a specific period of time in the airspace within a radius of 8 km of the aerodrome reference point.
- ^ Cloud cover: in aviation, cloud cover is reported using words that denote the extent of the cover – ‘few’ indicates that up to a quarter of the sky is covered, ‘scattered’ indicates that cloud is covering between a quarter and a half of the sky, and ‘broken’ indicates that more than half to almost all the sky is covered.
- ^ The term PROB is used in a TAF if the estimated probability of occurrence is 30% or 40% (probabilities of less than 30% are not given) and is only used with reference to thunderstorms or poor visibility (less than the alternate minimum) resulting from fog, mist, dust, smoke or sand. If the estimated probability of occurrence is equal to or greater than 50%, then reference to PROB is not included (Bureau of Meteorology, 2023).
- ^ Indicates a significant temporary variation from the prevailing conditions previously given in the TAF. TEMPO is used for periods of 30 minutes or more but less than 60 minutes (Bureau of Meteorology, 2023).
- ^ A copy of the ACARS messages was supplied to the ATSB by the operator.
- ^ Automatic weather information service (AWIS): actual weather conditions, provided via telephone or radio broadcast, from BoM automatic weather stations, or weather stations approved for that purpose by the BoM.
- ^ A fully harmonised suite of ATC tools that provides controllers with a common, modern set of key ATC systems and capabilities in a single customisable platform (Airport Technology, 2014).
- ^ The permanently displaced threshold applied to landing only. The full length of the runway was available for take-off. As this was a landing occurrence, any further reference to ‘threshold’ in this report is to the permanently displaced threshold.
- ^ A ground-based electronic landing guidance system that provides both vertical (glideslope) and lateral (localiser) guidance.
- ^ Reflecting light back to its source.
- ^ Refer to the section Runway markings as visual aids for details of the standards, regulations and guidance material for runway markings and other visual aids.
- ^ Runway distance remaining signs are a simple and low-cost measure to increase flight crew spatial awareness during the landing rollout. These are large, illuminated signboards on either side of the runway that indicate the distance remaining in thousands of feet during a take-off or landing roll. The signs may be single-faced, or double‑faced to provide runway distance information for operations in either direction (ATSB, 2009).
- ^ Runway threshold identification lights are used at an aerodrome where it is difficult to locate a runway threshold from the air during the day and may also be used at night. They consist of one light on each side of the runway, equidistant from the runway centreline indicating the start of the runway. At the time of the occurrence, there was a notice to airmen (NOTAM) current indicating that the runway threshold identification lights were unserviceable. A copy of the information from that NOTAM was included by the operator in the flight briefing package obtained by the flight crew before the flight.
- ^ Civil Aviation Safety Regulations Part 139 Manual of Standards permits the edge lighting to be outside the runway, but no greater than 3 m outside the declared runway area (Civil Aviation Safety Authority, 2020).
- ^ The FDR and CVR record on a continuous loop principle. The FDR captured at least 25 hours of data and the CVR captured 2 hours of sounds and voices before being recorded over.
- ^ In early April 2023, the operator provided the ATSB with a copy of its preliminary safety investigation report, which provided additional information regarding the incident. After obtaining this information, the ATSB decided to investigate the incident.
- ^ A vertical navigation mode where the flight management computer constructs and provides guidance for the flightpath to cross predetermined altitudes at particular locations. For example, a straight-line path between the altitude at the final approach point and the threshold crossing height at the runway threshold.
- ^ The minimum altitude for an approach can be set to provide an aural alert when this altitude is reached.
- ^ Radio height, from the radio altimeter, measures height above the ground. It is calibrated to read 0 ft when the landing gear touches the ground at a normal landing pitch angle.
- ^ Refer to the section Landing technique for details on the flare manoeuvre.
- ^ Speed brakes are panels on the top surface of the wing that, when deployed, project up into the airflow increasing aerodynamic drag and reducing the lift produced by the wing.
- ^ 45 kt is the minimum airspeed the system will indicate. The groundspeed, not shown in the images, continued to decrease below 45 kt to about 19 kt.
- ^ Refer to section Altitude errors during an RNP AR approach for more detail on altitude errors and corrections. In this case, the recorded pressure altitude, which is referenced to the standard atmosphere pressure of 1013 hPa, adjusted for the actual local sea-level air pressure (QNH). The altitude will change by about 27 ft for every 1 hPa difference from the standard atmosphere. The measured altitude is also affected by the temperature variation from standard conditions. The temperature correction method presented in ICAO Doc 8168 PANS-OPS Vol 3, 4.3.3 was used in the calculations.
- ^ Refer to section Instrument approach procedures – general for details on approach procedures.
- ^ T-VASIS: T visual approach slope indicator is a set of lights arranged so that the pattern seen by the pilot varies according to their position relative to the desired approach path. An AT-VASIS is an ‘abbreviated’ T-VASIS, which consists of a reduced set of lights.
- ^ ILS: instrument landing system – a precision instrument approach system consisting of ground-based radio navigation aids providing lateral (localiser) and vertical (glideslope) guidance.
GLS: Ground based augmentation system (GBAS) landing system – a precision approach system using a ground based augmentation system and satellite navigation system as the primary means of navigation reference. - ^ A system for approach and landing operations utilizing GNSS [global navigation satellite system], augmented by a ground-based augmentation system (GBAS), as the primary navigational reference (ICAO, 2018).
- ^ The Global Positioning System (GPS) is a GNSS system.
- ^ Air pressure based.
- ^ The Boeing 737 contained an integrated flight management system that provided centralised flight deck control of the aircraft’s flight path and performance parameters. The flight management system consisted of the flight management computer, autopilot/flight director, autothrottle, inertial reference system and global positioning system (GPS). The flight management computer, was the heart of the system, performing navigational and performance computations and providing control and guidance commands.
- ^ The flight technical error is basically the difference between the actual flight path and the desired fight path.
- ^ In VNAV PATH mode, the FMC will provide steering guidance to follow the programmed vertical flight path.
- ^ The pressure of the air when there are no pressure effects due to movement of the aircraft through that air.
- ^ 30 ft/hPa is often used in aviation for ease of calculation.
- ^ The international standard atmosphere has a sea level pressure of 1013 hPa and temperature of 15°C. The temperature decreases by 6.5 °C for every 1,000 m (approximately 3,300 ft) increase in height.
- ^ Required Navigation Performance Authorization Required (RNP AR) Procedure Design Manual (ICAO 2021).
- ^ Height above the landing aerodrome height.
- ^ Reference speed: 1.3 times the stalling speed in the stated landing configuration and at the prevailing aircraft weight (Skybrary, 2025).
- ^ Instrument landing systems have 3 primary categories identified as CAT I, II, and III. The higher the category number the lower the visibility conditions that it can be used for. Additional facility, procedural and qualification requirements are associated with the higher categories.
- ^ For example, investigation AO-2008-007 and AO-2016-166, both of which are available through the ATSB website www.atsb.gov.au.
- ^ Glass beads are an existing technology that provide a retroreflective property to the markings and is commonly used in road surface markings to enhance their conspicuity in low-light conditions.
- ^ Federal Aviation Administration (2018, December 21). Advisory circular 150/5370-10H - Standard Specifications for Construction of Airports (FAA, 2018).
- ^ The Airfield Marking Handbook noted that it was produced under funding from the FAA and included oversight from FAA personnel, but does not constitute a standard, specification, or regulation.
- ^ IOR – Index of refraction. A measure of how much light bends when passing from one medium to another.
- ^ ASTM International is a standard organisation that develops and publishes technical standards for a range of materials, products, systems, and services.
- ^ Aircraft with a wingspan between 15 m and 24 m.
- ^ Factors based upon the Commercial Aviation Safety Team/International Civil Aviation Organization Common Taxonomy Team (CICTT) Aviation Occurrence Categories.
- ^ According to CASA advisory circulars AC 91-32 and AC 139-22 - Global reporting format – Runway surface condition, a runway is ‘contaminated’ if more than 25% of the surface area required for a take-off or landing is covered by any of the following: (a) water or slush more than 3 mm deep; (b) loose snow more than 20 mm deep; (c) compacted snow or ice. A runway is ‘wet’ if it is (a) not dry, (b) not contaminated.
- ^ Information on the Honeywell SmartRuwnay and SmartLanding system was obtained from https://aerospace.honeywell.com/us/en/products-and-services/products/cabin-and-cockpit/terrain-and-traffic-awareness/runway-safety/smartrunway-and-smartlanding.
- ^ A heads-up advisory system with aural alerts to increase the pilot’s situational awareness during ground and air operations relative to the runway offered by Honeywell as a software update to their enhanced ground proximity warning systems. The long landing alert was not identified as a feature of the Honeywell runway awareness and advisory system, so the aircraft was likely fitted with the additional Honeywell SmartRunway and SmartLanding are software options.
- ^ This runway had neither runway centreline lights nor touchdown zone lighting.
Occurrence summary
| Investigation number | AO-2023-018 |
|---|---|
| Occurrence date | 24/01/2023 |
| Occurrence time and timezone | 1839 Australian Eastern Standard Time |
| Location | Gold Coast Airport |
| State | Queensland |
| Report release date | 19/11/2026 |
| Report status | Final |
| Investigation type | Occurrence Investigation |
| Investigation phase | Final report: Dissemination |
| Investigation status | Completed |
| Mode of transport | Aviation |
| Aviation occurrence category | Runway - Other |
| Occurrence class | Serious Incident |
| Highest injury level | None |
Aircraft details
| Manufacturer | The Boeing Company |
|---|---|
| Model | 737-8FE |
| Registration | VH-YQM |
| Serial number | 41009 |
| Aircraft operator | Virgin Australia Airlines Pty Ltd |
| Sector | Jet |
| Operation type | Part 121 Air transport operations - larger aeroplanes |
| Activity | Commercial air transport-Scheduled-Domestic |
| Departure point | Sydney Airport, New South Wales |
| Destination | Gold Coast Airport, Queensland |
| Injuries | None |
| Damage | Nil |