Statistical Publication

Aviation Occurrence Statistics 2010 to 2019

The purpose of this report

Each year, thousands of safety occurrences involving Australian aircraft and foreign‑registered aircraft operating in Australia are reported to the Australian Transport Safety Bureau (ATSB).

This report is part of a series that aims to provide information and statistical data to the aviation industry, manufacturers and policy makers, as well as to the travelling and general public, about these aviation safety occurrences. In particular, the data can be used to determine what can be learned to improve transport safety in the aviation sector.

The study uses information over the 10-year period from 2010–2019 to provide an insight into current and possible future trends in aviation safety.

This statistical report presents interactive web versions of all tables and graphs to allow the user to display aviation occurrence data in the format of their choice.

What the ATSB found

2019

In 2019, 220 aircraft were involved in accidents in Australia, with a further 154 aircraft involved in serious incidents (an incident with a high probability of becoming an accident). There were 35 fatalities from 22 fatal accidents. The number of fatalities was consistent with the average of the previous nine years (32.3 fatalities per year), and the number of fatal accidents was also consistent with its average (23.1 fatal accidents per year).

There have been no fatalities in scheduled commercial air transport in Australia since 2005.

2010 to 2019 accidents and incidents

Between 2010 and 2019, over 90 per cent of accidents and fatal accidents, and around 80 per cent of serious incidents, involved aircraft operating within the general aviation and recreational aviation sectors. In contrast, due to the more stringent reporting requirements for air transport operations, three‑quarters of reported incidents involved aircraft operating within commercial air transport.[1]

Considering all years in the period, the number of general aviation (GA) fatalities and fatal accidents decreased. The number of fatalities and fatal accidents within commercial air transport and recreation aviation remained relatively constant.

Since 2016, remotely piloted aircraft (RPA) have surpassed helicopters to become the second most common aircraft type involved in an accident. Further, the number of manned aircraft experiencing near encounters with an RPA also increased significantly over the study period.

2014 to 2018 accident rates

For the first time, statistics in this report have been organised around the type of aircraft activity being conducted, rather than the operational regulation. Due to the availability of activity data (departures and hours flown data), it was only possible to calculate accident and fatal accident rates over the five‑year period 2014–2018.

Over this period, test and ferry flights, recreational flights involving an aircraft registered with Recreational Aviation Australia (RAAus), followed by pleasure and personal transport, had the highest accident rates. Community services flights, followed closely by test and ferry flights, had the highest fatal accident rates. (However, as there was only one fatal accident involving an aircraft conducting community service flights between 2014 and 2018 there is a high level of statistical uncertainty associated with this rate). For aircraft types, recreational aeroplanes, followed by commercial balloons had the highest accident rates. Also, recreational aeroplanes had the highest fatal accident rate.

Commercial air transport

There were no fatalities within commercial air transport in 2019.

Over the full study period (2010–2019), more than half of all serious incidents and the majority of accidents and fatal accidents for commercial air transport operators involved aircraft conducting non‑scheduled activities, predominantly passenger transport charters. There were no identified increases or decreases in the number of accidents or serious incidents, however, the number of reported incidents for aircraft conducting scheduled international flights and commercial freight increased over the 10 years.

Between 2014 and 2018, around three‑quarters of the hours flown, and approximately one‑half of all departures, within commercial air transport, were operated by scheduled domestic or international operations. Over this period, there was a decrease in the hours flown by scheduled domestic operators; conversely, there was a proportionate increase in the hours for scheduled international operators.

Concerning activities within commercial air transport, passenger transport charters had the highest accident and fatal accident rates.

For specific aircraft types, within commercial air transport, balloons had an accident rate more than 10 times higher than for aeroplanes or helicopters. However, there was only one fatal accident involving a commercial balloon in the 2010 and 2019 timeframe.

Most commercial accidents and serious incidents were operational in nature (typically aircraft control and terrain collisions). The majority of incidents were environmental (mainly birdstrikes).

General aviation

In 2019, there were 17 fatalities in GA.

Over the 10 years, around one‑third of GA accidents and 44 per cent of fatal accidents involved aircraft conducting sport and pleasure flying. Aerial work accounted for a further 37 per cent of GA accidents and 32 per cent of fatal accidents. The number of GA accidents per year increased over the period, with aerial work identified as the primary contributor. Conversely, there was a decrease in the number of fatal accidents, resulting in a decrease of around one fatal accident or 1.4 fewer fatalities per year.

There was also an increase in the number of reported incidents for GA aircraft conducting instructional flying.

Between 2014 and 2018, around 40 per cent of GA hours flown were conducted within aerial work, with instructional flying accounting for a further 30 per cent. Sport and pleasure flying made up around 14 per cent.

The rate of GA accidents decreased over the five years 2014–2018. The main contributors to this decline were sport and pleasure flying, and own business travel. Additionally, there was also a decrease in the rate of fatal accidents for aircraft conducting sport and pleasure flying.

Between 2010 and 2019, there was an increase in the number of GA RPA accidents per year; this primarily resulted from a significant increase in the overall number of survey and photographic accidents.

Overall, there was a decrease in the accident rate for aeroplanes conducting GA flying. The main contributors to this decrease were identified as aeroplanes conducting sport and pleasure flying, and own business travel.

Over the 10 years, the majority of GA accidents, incidents and serious incidents were related to operational or technical issues. Additionally, the majority of fatal accidents were also attributable to operational issues.

Further, the number of GA operational-related accidents and serious incidents, per year, increased over the period. Instructional flying was the main contributor to this operational-related increase. Additionally, there was an increase in the number of accidents and serious incidents of a technical nature; largely attributable to aerial work operations (especially those conducted using an RPA).

Recreational aviation

In 2019, there were 18 fatalities involving an aircraft conducting recreational flying.

The accident rate for recreational flying decreased between 2014 and 2018, with Recreational Aviation Australia (RAAus) registered aircraft having the greatest contribution to this reduction.

Aeroplanes had the highest accident and fatal accident rates of any recreational aircraft type.

Similar to GA, over the full study period (10 years), the majority of recreational accidents and serious incidents were operational (mainly terrain collisions) or technical (primarily engine failure or malfunction) in nature.

__________

  1. Includes scheduled airline flying as well as non-scheduled passenger-carrying activities such as charter, medical transport, and joyflight/sightseeing flights, as well as freight.

Publication details

Publication number AR-2020-014
Publication type Statistical Publication
Publication mode Aviation
Publication date 29/04/2020

Aviation Occurrence Statistics 2008 to 2017

The online report includes interactive functionality allowing users to access the report’s safety data to create their own reports specific to their needs.

The purpose of this report

Each year, thousands of safety occurrences involving Australian and foreign-registered aircraft are reported to the Australian Transport Safety Bureau (ATSB) by individuals and organisations in Australia’s aviation industry and by members of the public.

This report is part of a series that aims to provide information to the aviation industry, manufacturers and policy makers, as well as to the travelling and general public, about these aviation safety occurrences. In particular, what can be learned to improve transport safety in the aviation sector.

The study uses information over the ten-year period from 2008-2017 to provide an insight into the current and possible future trends in aviation safety.

What the ATSB found

The majority of air transport operations in Australia each year proceed without incident.

In 2017, nearly 200 aircraft were involved in accidents in Australia, with 203 involved in a serious incident (an incident with a high probability of an accident). There were 40 fatalities in the aviation sector in 2017, which was a significant increase from the 21 fatalities in 2016. There were no fatalities in either high or low-capacity regular public transport (RPT) operations, which has been the case since 1975 and 2010 respectively.

Almost half of all fatalities that occurred in commercial air transport operations during the study period occurred in 2017. During 2017, there were 14 fatalities from 21 accidents in commercial air transport operations, 21 fatalities from 93 accidents in general aviation operations, and five fatalities from 53 accidents in recreational aviation operations.

Terrain collisions were the most common accidents or serious incidents for aircraft involved in general aviation, recreational aviation and remotely piloted aircraft in 2017. Aircraft control, followed by terrain collisions, were the most common occurrence type associated with an accident or serious incident for aircraft involved in air transport operations.

Wildlife strikes, including birdstrikes, were again the most common type of incident involving both commercial air transport and general aviation operations. Runway events and aircraft control incidents were the most common types of incident reported for recreational aviation.

The accident and fatal accident rates for general and recreational aviation reflect their higher‑risk operational activity when compared to commercial air transport operations. They also reflect the significant growth in recreational aviation activity over the last ten years and this sector’s increased reporting culture.

General aviation accounts for one‑third of the total hours flown by Australian-registered aircraft and over half of all aircraft movements across Australia.

The total accident rate, per hours flown, indicates general aviation operations are nine times more likely to have an accident than commercial air transport operations, with recreational operations around twice as likely to experience an accident than general aviation operations.

The fatal accident rate, per hours flown, indicates general aviation operations are around fifteen times more likely to experience a fatal accident than commercial air transport operations, and recreational operations are almost 30 times more likely to experience a fatal accident than commercial air transport operations.

Private/business helicopters followed closely by recreational gyrocopters had the highest fatal accident rate for any aircraft or operation type, whereas recreational aeroplanes had the highest total accident rate. There were no fatal accidents involving general aviation balloons reported during the study period.

Aeroplanes remain the most common aircraft type flown, which is reflected in the proportion of accidents they are involved in. In 2017, 15 of the 22 fatal accidents involved aeroplanes—three gliders, two helicopters, and two weight shift aircraft were also involved in fatal accidents.

Since 2016, the increased availability and use of remotely piloted aircraft (RPA) saw them match helicopters as the second highest aircraft type for reported accidents. However, there were no collisions with other aircraft, fatalities or serious injuries relating to RPA reported to the ATSB. While the consequences of an accident involving an RPA have been low to date, their increased use, and possible interactions with traditional aviation, is an emerging trend in transport safety that will continue to be monitored closely by the ATSB.

Note: Previous editions of Aviation Occurrence Statistics reports contained an error regarding the number of occurrences and subsequently rates for balloons conducting general aviation operations and air transport - charter operations. This error was communicated to the ATSB by the Australian Ballooning Federation. A systemic error was identified and rectified within the reporting system. This report has a decrease in the number of occurrences, and rates, for balloons conducting private operations, and a corresponding increase for balloons conducting charter operations compared to previous editions.

Safety message

This report highlights the importance of effective and timely reporting of all aviation safety occurrences, not just for the potential of initiating an investigation, but also for further study and analysis of aviation transport safety.

While there has been an increase in accident and incident reporting, the limited detail provided for most occurrences, especially by recreational flyers, remains a challenge for the industry and ATSB. This report also highlights the need for improvements in the reporting rates for some areas in general aviation.

By comparing accident and occurrence data across aviation operation types, the ATSB is able to develop a complete picture of the aviation industry to identify emerging trends in aviation transport safety, identify further areas for research and recommend pre-emptive safety actions.

Publication details

Investigation number AR-2018-030
Publication type Statistical Publication
Publication mode Aviation
Publication date 21/12/2018
Subject matter Statistics

Aviation Occurrence Statistics 2007 to 2016

The purpose of this report

Each year, thousands of safety occurrences involving Australian and foreign-registered aircraft are reported to the Australian Transport Safety Bureau (ATSB) by individuals and organisations in Australia’s aviation industry and by members of the general public.

This report is part of a series that aims to provide information to the aviation industry, manufacturers and policy makers, as well as to the travelling and general public, about these aviation safety occurrences. In particular, what can be learned to improve transport safety in the aviation sector.

The study uses information over the ten-year period from 2007–2016 to provide an insight into the current and possible future trends in aviation safety, and takes a detailed look at the accidents and incidents in 2016 for each type of aircraft operation. 

What the ATSB found

The majority of air transport operations in Australia each year proceed without incident.

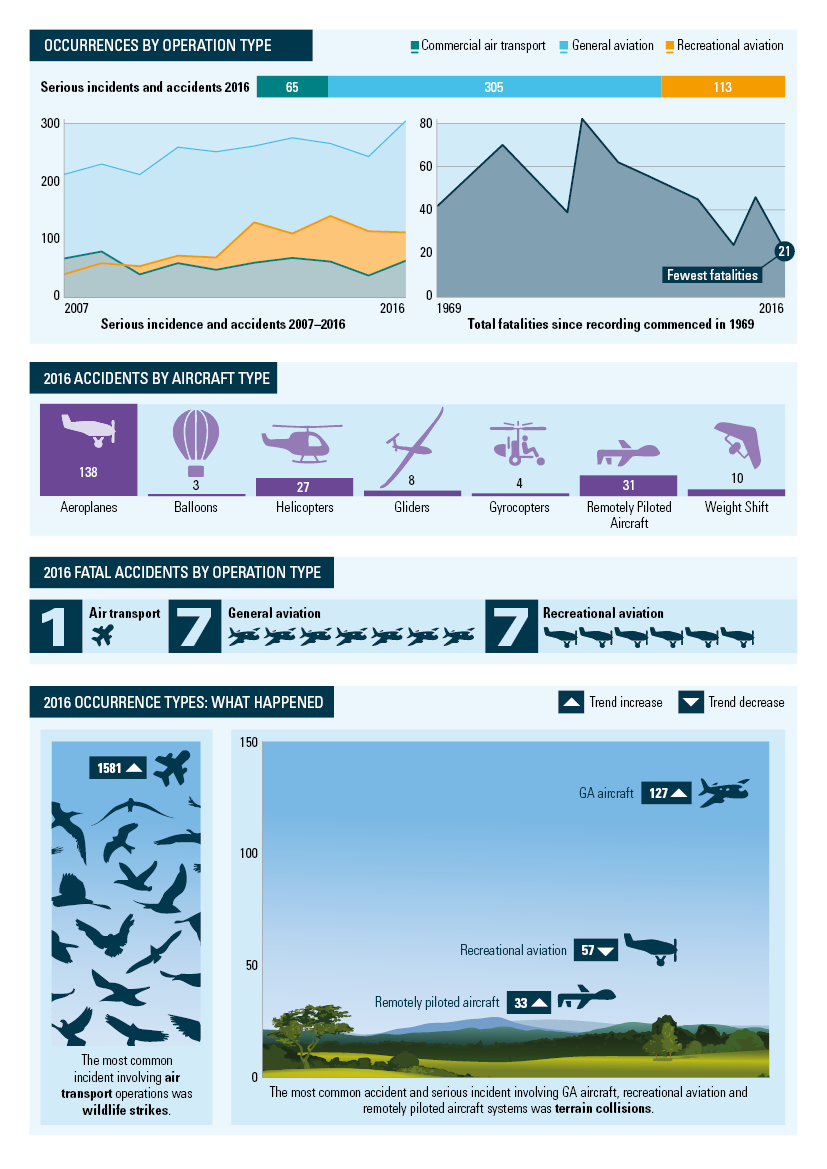
In 2016, nearly 230 aircraft were involved in accidents in Australia, with another 291 aircraft involved in a serious incident (an incident with a high probability of an accident). There were 21 fatalities in the aviation sector in 2016, which was fewer than any previous year recorded by the ATSB. There were no fatalities in either high or low-capacity regular public transport (RPT) operations, which has been the case since 1975 and 2010 respectively.

Commercial air transport operations experienced one fatality from 15 accidents; general aviation experienced 10 fatalities from 119 accidents; and recreational aviation had 10 fatalities from 63 accidents.

Collision with terrain was the most common accident or serious incident for general aviation aircraft, recreational aviation and remotely piloted aircraft in 2016. Aircraft control was the most common cause of an accident or serious incident for air transport operators.

Wildlife strikes, including birdstrikes, were again the most common types of incident involving air transport and general aviation operations, with runway events the most common type of incident for recreational aviation.

The accident and fatal accident rates for general and recreational aviation reflect the higher‑risk operational activity when compared to air transport operations. They also reflect the significant growth in recreational aviation activity over the last ten years and this sector’s increased reporting culture.

General aviation accounts for one‑third of the total hours flown by Australian-registered aircraft and over half of all aircraft movements across Australia.

The total accident rate, per hours flown, indicates general aviation operations are 10 times more likely to have an accident than commercial operations, with recreational aircraft around twice as likely to experience an accident than general aviation.

The fatal accident rate, per hours flown, indicates general aviation operations are around 20 times more likely to experience a fatal accident than commercial air transport, and recreational operations are almost 40 times more likely to experience a fatal accident than air transport.


Occurrences by operation type: In 2016, nearly 230 aircraft were involved in accidents in Australia, with another 291 aircraft involved in a serious incident

Recreational gyrocopters experienced the highest fatal accident rate for any aircraft or operation type, whereas recreational balloon operations had the highest total accident rate; almost four times as high as any other aircraft operation type. There were no fatal accidents involving recreational balloons reported during the study period.

Aeroplanes remain the most common aircraft type flown which is reflected in their involved in accidents. In 2016, nine of the 15 fatal accidents involved aeroplanes—three helicopters and two powered weight shift aircraft were also involved in fatal accidents.

In 2016, the increased availability and use of remotely piloted aircraft (RPA) saw them surpass helicopters as the second highest aircraft type for reported accidents; however, there were no collisions with other aircraft, fatalities or serious injuries relating to RPA reported to the ATSB that year. While the consequences of an accident involving an RPA have been low to date, their increased use, and possible interactions with traditional aviation, is an emerging trend in transport safety that will continue to be monitored closely by the ATSB.

Safety message

This report highlights the importance of effective and timely reporting of all aviation safety occurrences, not just for the potential of initiating an investigation, but to allow further study and analysis of aviation transport safety.

While there has been an increase in accident and incident reporting, the limited detail provided for most occurrences, especially by recreational flyers, remains a challenge for the industry and ATSB. This report also highlights the need for improvements in the reporting rates for some areas in general aviation.

By comparing accident and occurrence data across aviation operations types, the ATSB is able to develop a complete picture of the aviation industry to identify emerging trends in aviation transport safety, identify further areas for research and recommend pre-emptive safety actions.

Download the research report:


Publication details

Investigation number AR-2017-104
Publication type Statistical Publication
Publication mode Aviation
Publication date 15/01/2018

Australian aviation wildlife strike statistics: 2006 - 2015

Why we have done this report

Occurrences involving aircraft striking wildlife, particularly birds, are the most common aviation occurrence reported to the Australian Transport Safety Bureau (ATSB). Strikes with birds continue to be a potential safety risk and present a significant economic risk for aerodrome and airline operators. The aim of the ATSB’s statistical report series is to provide information back to pilots, aerodrome and airline operators, regulators, and other aviation industry participants to assist them with managing the risks associated with bird and animal strikes. This report updates the last edition published in 2014 with data from 2014 – 2015.

What the ATSB found

Between 2006 and 2015, there were 16,069 birdstrikes reported to the ATSB, most of which involved high-capacity air transport aircraft. Both the number and rate of birdstrikes per 10,000 movements in high-capacity operations have increased markedly in the past two years 2014­ – 2015. In contrast, the number of birdstrikes in low-capacity operations and general aviation has remained relatively consistent. In the two years since 2013, the rates for six of the ten major airports have increased relative to ten year averages. The largest increase in the rate of birdstrikes was observed at Cairns, Canberra, Darwin, Gold Coast and Sydney.

Domestic high-capacity aircraft were those most often involved in birdstrikes, and the birdstrike rate per aircraft movement for these aircraft was significantly higher than all other categories. The number of engine bird ingestions for high-capacity air transport operations had been increasing until 2011, but has since decreased slightly. Still, about one in ten birdstrikes for turbofan aircraft involved a bird ingested into an engine.

The four most commonly struck types of flying animal in the 2014 to 2015 period were: bats/flying foxes, Swallow/Martins, Kites, and Lapwings/Plovers. Swallows and Martins had the most significant increase in the number of reported birdstrikes per year in the last two years, with these species being involved in an average of 96 birdstrikes per year for 2014 and 2015 compared with 65 per year on average across the entire 10-year reporting period. Galahs were more commonly involved in birdstrikes of multiple birds, with more than 38 per cent of Galah strikes involving more than one Galah. However, larger birds were more likely to result in aircraft damage.

This report presents a new species mass analysis which estimates that over the ten years between 2006 and 2015, 766 kg of flying animals were struck per year by aircraft in Australia. Additionally, for every 1 kg increase in animal mass, the likelihood of a birdstrike causing damage increases by 12.5%.

Compared to birdstrikes, ground-based animal strikes are relatively rare. The most common animals involved were hares and rabbits, kangaroos, wallabies, and dogs / foxes. Damaging animal strikes mostly involved kangaroos, wallabies and livestock.

Safety message

Australian aviation wildlife strike statistics provide a reminder to everyone involved in the operation of aircraft and aerodromes to be aware of the hazards posed to aircraft by birds and non-flying animals. Timely and thorough reporting of birdstrikes is paramount. The growth of reporting to the ATSB that has been seen over the last 10 years has helped to better understand the nature of birdstrikes, and what and where the major safety risks lie. This assists the aviation industry to better manage their safety risk.  Over the ten years from 2006 to 2015, 42% of all birdstrikes reported to the ATSB contained no species information.  The more accurately this information is provided to the ATSB, the more accurate and useful reports like this one will be.

Publication details

Investigation number AR-2016-063
Publication type Statistical Publication
Publication mode Aviation
Publication date 01/02/2017
Subject matter Bird Strikes

Aviation Occurrence Statistics 2006 to 2015

Why have we done this report

Thousands of safety occurrences involving Australian-registered and foreign aircraft are reported to the ATSB every year by individuals and organisations in Australia’s aviation industry, and by the public. The aim of the ATSB’s statistical report series is to give information back to pilots, operators, regulators, and other aviation industry participants on what accidents and incidents have happened, how often they are happening, and what we can learn from them.

What the ATSB found

In 2015, Australia had 31 fatalities and 32 serious injuries – 28 aircraft were involved in fatal accidents and a further 28 in an accident resulting in serious injuries. There was a total of 227 aircraft involved in accidents, and 185 involved in serious incidents (indicating an accident nearly occurred).

  • Commercial air transport had one fatality from nine accidents.
  • General aviation had 12 fatalities from 130 accidents.
  • Recreational aviation had 18 fatalities from 76 accidents.

For commercial air transport, 2015 had the lowest number of accidents in the study period (2006–2015). Seventeen of the 19 fatalities (2006–2015) involved aircraft conducting charter operations.

The majority of fatalities, in the 10‑year period, occurred within general aviation. Around 20 per cent of fatal accidents resulted from a loss of control.

Growth in recreational (non‑VH) flying and improving awareness of reporting requirements, led to more than a tenfold increase in the number of recreational safety incidents reported to the ATSB between 2006–2015.

The number of remotely piloted aircraft accidents and incidents increased significantly – from 14 occurrences within eight years (2006–2013) to 37 within the last two years (2014–2015) of the study period.

From 2006 to 2014 (activity data was not available for 2015), recreational aircraft, search and rescue, private/business and sports aviation, and aerial agriculture operation types had the highest fatal accident rates (per hours flown). For all accidents, the highest accident rates occurred with recreational aeroplanes, followed by aerial agriculture, private/business and sport aviation, and recreational gyrocopters.

  • Around 40 per cent of all recreational gyrocopter accidents resulted in fatalities and almost one‑quarter of weight shift aircraft accidents were fatal.
  • The highest general aviation accident rate in the study period was in 2014. However, that year also had the lowest fatal accident rate.
  • In 2014, the flying training accident rate was more than double that of any year in the previous eight.

Publication details

Publication number AR-2016-122
Investigation number AR-2016-122
Publication type Statistical Publication
Publication mode Aviation
Publication date 11/01/2017

Emerging trends in Australian aviation safety January – June 2015

When aviation safety incidents and accidents happen, they are reported to the ATSB. The most serious of these are investigated, but most reports are used to help the ATSB build a picture of how prevalent certain types of occurrences are in different types of aviation operations.

The ATSB uses this data to proactively look for emerging safety trends. By monitoring trends, issues of concern can be communicated and action taken to prevent accidents.

Proactive trend monitoring is a data-driven process, reviewing all occurrences to see if there are subtle changes that may point to a larger issue. Potential issues are then monitored by the ATSB, and shared with industry and other government agencies. Safety actions can then be taken by the most appropriate people to prevent these issues resulting in accidents. These trends can also point to the need for the ATSB to target particular types of occurrences for investigation.

This report summarises significant trends in Australian aviation from January to June 2015, and resultant safety action being taken to address these trends.

Publication details

Investigation number AR-2016-002
Publication type Statistical Publication
Publication mode Aviation
Publication date 11/05/2016

Aviation Occurrence Statistics: 2005 to 2014

Thousands of safety occurrences involving Australian-registered and foreign aircraft are reported to the ATSB every year by individuals and organisations in Australia’s aviation industry, and by the public. The aim of the ATSB’s statistical report series is to give information back to pilots, operators, regulators, and other aviation industry participants on what accidents and incidents have happened, how often they are happening, and what we can learn from them.

In the 10-year period of 2005 to 2014, 254 aircraft have been involved in fatal accidents in Australia, leading to 374 fatalities. Most fatalities (240) were in CASA-registered (VH registrations) general aviation aircraft (including aerial agriculture, mustering, search and rescue, flying training, private and sport operations). Non-CASA registered recreational aircraft (aeroplanes, weight shift hang gliders, trikes, paragliders and powered parachutes, and gyrocopters) accounted for 98 fatalities. Commercial air transport (passenger regular public transport, charter and medical transport) accounted for 36 fatalities.

Across the 10-year period, the accident rate per hours flown was the highest for recreational aeroplanes, followed by aerial agriculture and private and sport aviation. However, all VH registered private and sport operations (including gliding) had a similar accident rate as that for all non-VH recreational flying combined. Recreational aircraft, private/sport, and aerial agriculture operation types were among the most likely to result in a fatal accident when considering the amount of flying activity. Within recreational aviation, half of all gyrocopters accidents were fatal and almost a third of weight shift aircraft accidents were fatal.

In 2014 alone, there was a total of 278 aircraft involved in accidents, and 202 involved in serious incidents (indicating an accident nearly occurred). Twenty aircraft were involved in fatal accidents, and another 28 resulted in serious injury. In 2014, Australia saw 28 fatalities and 36 serious injuries as a result of aviation accidents.

Commercial air transport recorded no fatalities in 2014. However, there were 27 accidents, an increase compared to the 10-year average of 19. Five of the accidents resulted in seven serious injuries. Most accidents (23) involved charter aircraft, and were mostly collision with terrain or failure of the landing gear. The 37 serious incidents (mostly aircraft separation and pilot incapacitation events) was a significant drop compared to the previous 2 years.

General aviation experienced 149 accidents in 2014 (the highest in 10 years), 11 of which were fatal (the lowest in 10 years) and another 15 resulted in serious injuries. These accidents led to 17 fatalities and 20 serious injuries. General aviation aircraft were involved in 118 serious incidents in 2014. In 2013 – the last year with available activity data – the general aviation accident rate per departure was almost five times that of commercial air transport. The year 2013 saw a significant decrease in the accident rate compared with the previous 6 years. However, the fatal accident rate was consistent with the 10-year average. Aerial agriculture, followed by private and sport aviation had the highest general aviation accidents rates, while flying training had the lowest.

The reporting of safety incidents to the ATSB from recreational (non-VH) aviation has increased more than tenfold in the last 10 years. This is due to both the growth in recreational flying and improving awareness of reporting requirements. In 2014, 99 accidents were reported, nine of which were fatal and another eight leading to serious injuries. Most accidents involved aeroplanes, as these are the most common recreational aircraft.

Download the PDF report

Publication details

Investigation number AR-2015-082
Publication type Statistical Publication
Publication mode Aviation
Publication date 23/12/2015
Subject matter Aviation statistics

Emerging trends in Australian aviation safety: July to December 2014

When aviation safety incidents and accidents happen, they are reported to the ATSB. The most serious of these are investigated, but most reports are used to help the ATSB build a picture of how prevalent certain types of occurrences are in different types of aviation operations.

The ATSB uses this data to proactively look for emerging safety trends. By monitoring trends, issues of concern can be communicated and action taken to prevent accidents.

Proactive trend monitoring is a data-driven process, reviewing all occurrences to see if there are subtle changes that may point to a larger issue. Potential issues are then monitored by the ATSB, and shared with industry and other government agencies. Safety actions can then be taken by the most appropriate people to prevent these issues resulting in accidents. These trends can also point to the need for the ATSB to target particular types of occurrences for investigation.

This report summarises significant trends in Australian aviation from July to December 2014, and resultant safety action being taken to address these trends.

Publication details

Investigation number AR-2015-021
Publication type Statistical Publication
Publication mode Aviation
Publication date 30/06/2015
Subject matter Statistics

Emerging trends in Australian aviation safety: January – June 2014

When aviation safety incidents and accidents happen, they are reported to the ATSB. The most serious of these are investigated, but most reports are used to help the ATSB build a picture of how prevalent certain types of occurrences are in different types of aviation operations.

The ATSB uses this data to proactively look for emerging safety trends. By monitoring trends, issues of concern can be communicated and action taken to prevent accidents.

Proactive trend monitoring is a data-driven process, reviewing all occurrences to see if there are subtle changes that may point to a larger issue. Potential issues are then monitored by the ATSB, and shared with industry and other government agencies. Safety actions can then be taken by the most appropriate people to prevent these issues resulting in accidents. These trends can also point to the need for the ATSB to target particular types of occurrences for investigation.

This report summarises significant trends in Australian aviation from January to June 2014, and resultant safety action being taken to address these trends.

Publication details

Investigation number AR-2014-127
Publication type Statistical Publication
Publication mode Aviation
Publication date 13/11/2014

Aviation Occurrence Statistics 2004 to 2013

Why have we done this report

Thousands of safety occurrences involving Australian-registered and foreign aircraft are reported to the ATSB every year by individuals and organisations in Australia’s aviation industry, and by the public. The aim of the ATSB’s statistical report series is to give information back to pilots, operators, regulators, and other aviation industry participants on what accidents and incidents have happened, how often they are happening, and what we can learn from them.

What the ATSB found

In 2013, there were 106 accidents, 221 serious incidents, and about 5,500 incidents reported to the ATSB involving Australian (VH­– registered) aircraft. There were also 71 accidents, 33 serious incidents, and 137 incidents involving Australian recreational aircraft and a further 200 foreign-registered aircraft operating within Australia or its airspace were involved in reportable safety occurrences.

Over the past 9 years, recreational aeroplane, aerial agriculture and private/business/sport operations had the most accidents per hour flown, with more than 160 accidents per million hours flown. Gyrocopters (recreational aviation) had the highest fatal accident rate over this period, followed by recreational aeroplane and private/business operations.

Commercial air transport aircraft were involved in the majority of occurrences, and in 2013 the most common occurrences reported were wildlife strikes, weather affecting aircraft, and aircraft system problems. Most accidents and serious incidents involved reduced aircraft separation, engine malfunction, or runway excursions. The number of incidents reported by commercial air transport operators has increased in each of the last 10 years, reflecting more flights and greater awareness of the importance of reporting safety occurrences.

General aviation aircraft, such as aircraft conducting flying training, aerial work, or private/pleasure flying, were involved in over one-third of occurrences reported to the ATSB in 2013. Wildlife strikes, runway events and aircraft separation issues were the most common incidents reported. In comparison, most accidents and serious incidents involved terrain collisions, reduced aircraft separation, or a loss of aircraft control. There was a fall in general aviation accidents and fatalities in 2013 particularly in private, business and sport flying (which is where most accidents and fatalities in general aviation happen) and in aerial work.

Recreational aviation aircraft (non-VH registered) were also involved in fewer reported accidents in 2013, although the number of fatal accidents doubled. Most accidents and serious incidents involved terrain collisions and engine malfunctions.

Safety message

Aviation occurrence statistics provide a reminder to everyone involved in the operation of aircraft that accidents, incidents, and injuries happen more often than is widely believed. Some of the most frequent accident types are preventable, particularly in general aviation. Pilots and operators should use the misfortunes of others to help identify the safety risks in their operation that could lead to a similar accident or serious incident.

Timely and thorough reporting of safety incidents is paramount. The ATSB’s capability to understand why accidents and incidents happen and to identify the major safety risks in different types of aviation operations is at its best when all aviation participants report all safety incidents. The information the ATSB provides helps everyone in the aviation industry to better manage their safety risk.

Publication details

Investigation number AR-2014-084
Publication type Statistical Publication
Publication mode Aviation
Publication date 05/11/2014
Subject matter Statistics