
Final report
Report release date: 02/10/2025
Investigation summary
What happened
On 11 January 2025, a Cessna 510, registered VH-SQY and operated by AirMed Australia (AirMed), was being used to conduct a non-emergency medical air transport flight from Narrandera Airport to Bankstown Airport, New South Wales. On board were a pilot, a flight nurse and a patient.
At 1103 local time, the aircraft departed Narrandera and approximately 30 minutes later commenced descent into Bankstown. Weather information at Bankstown reported variable wind conditions and that the runway was wet. During the landing, the pilot experienced reduced braking performance and the aircraft overran the end of the runway into muddy ground. None of the occupants were injured and the aircraft was undamaged.
What the ATSB found
The ATSB determined that during the approach, an undetected tailwind was encountered and the aircraft landed with a groundspeed higher than the minimum aquaplaning speed. In addition, there was likely standing water on the runway and the aircraft’s main landing gear tyres were worn to limits resulting in reduced braking performance. Subsequently, the pilot cycled the anti‑skid system, likely further decreasing braking performance. In combination, these factors resulted in the aircraft departing the end of the runway.
The ATSB also identified that AirMed required pilots to apply an incorrect landing distance factor, which reduced the safety margin when determining the required landing distance at a destination aerodrome. In addition, the type rating training provided by Air Link, a company associated with the operator, taught pilots to apply the same incorrect landing distance factor. Furthermore, AirMed’s procedures were unclear on how the factor should be applied, when the assessment should be conducted and how runway surface condition should be considered.
Finally, when determining the required landing distance at Bankstown, the pilot applied the incorrect landing distance factor prescribed by the operator. Subsequently, prior to descent and after obtaining the actual conditions at the aerodrome, the pilot did not identify that the landing distance available was insufficient for the landing.
What has been done as a result
AirMed updated its operations manual to require the use of a 60% landing distance factor and additional factoring for wet runway operations. Additionally, it introduced the requirement to conduct a landing distance calculation both before take-off and prior to landing, and included guidance on the applicability of options when using either tabulated data or flight planning software.
AirMed also provided training to all crew addressing the effects of tailwind, correct anti‑skid use, tyre limits and landing technique. In addition, it updated defect reporting procedures to encourage earlier reporting of anticipated maintenance requirements, and implemented a policy of tyre replacement when tread reaches 2 mm, representing 80% tyre wear.
Air Link amended training material for the C510 type rating to ensure that the correct landing distance factoring was applied and taught. In addition, past students were contacted to ensure that they understand performance requirements relating to the C510. Furthermore, it is in the process of including a new section in the endorsement training around wet weather operations, and has also implemented a policy of tyre replacement when tread reaches 2 mm.
Bankstown Airport amended the runway 11C/29C longitudinal slope information in the aerodrome manual to align with the En Route Supplement Australia slope values. Finally, while not in response to this occurrence, the Civil Aviation Safety Authority subsequently amended the performance section of the Part 121 guidance material as part of its continuous improvement process. These changes included:
- the addition of a section specifying that landing performance must be checked both pre‑flight and in-flight
- advice that actual landing distance data cannot be used to satisfy in-flight replanning operations
- provision of a list of known aircraft types, including the C510, that must not use actual landing distance data for in-flight landing distance calculations.
Safety message
The use of safety margins on top of calculated take-off and landing distances provides mitigation for a wide range of issues that impact aircraft performance, including unexpected environmental conditions. Operators must be familiar with any factoring applicable to their operation and should adjust procedures appropriately when regulations change. For private pilots, while not mandated, the use of safety margins is highly recommended. These recommended safety margins can be found in the Civil Aviation Safety Authority (CASA) Advisory Circular (AC) 91-02 Guidelines for aeroplanes with MTOW not exceeding 5 700 kg - suitable places to take off and land, and should be applied in conjunction with any guidance given in the aircraft flight manual.
This occurrence also highlights the limitations on accurate and timely reporting of runway surface condition, particularly following a period of intense rainfall. Only 3 mm of standing water is required for a runway to be considered contaminated, and this depth of water can accumulate rapidly before the runway surface condition is able to be assessed. Furthermore, when landing on an un‑grooved runway, braking may be degraded when the runway is very wet but not yet classified as contaminated, with significant additional stopping distance required.
The occurrence
On 11 January 2025, a Cessna 510, registered VH‑SQY and operated by AirMed, was being used to conduct a non‑emergency medical air transport flight from Narrandera Airport to Bankstown Airport, New South Wales (Figure 1). On board were a pilot, a flight nurse and a patient.
Figure 1: Incident flight
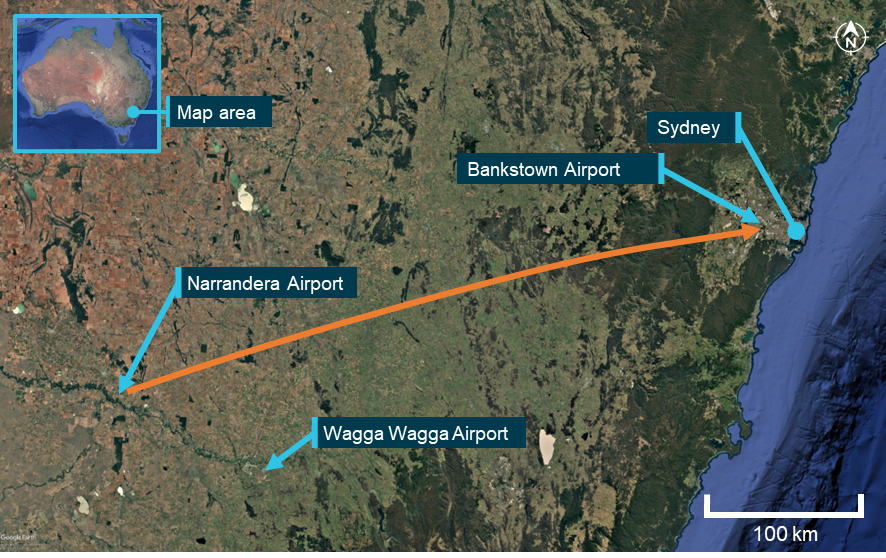
Source: Google Earth, annotated by the ATSB
The aircraft had been repositioned earlier that morning from Wagga Wagga Airport to Narrandera Airport, where the flight nurse and patient boarded for the flight to Bankstown. Prior to departure from Wagga Wagga, the pilot obtained a weather forecast for both Narrandera and Bankstown (see the section titled Meteorology) and added sufficient fuel for both flights. The forecast conditions for Bankstown indicated rain and possible thunderstorms (see the section titled Forecast conditions) and the pilot determined that the aircraft would be below the maximum landing weight permitted in these conditions by the landing distance available charts (see the section titled Pilot assessment of landing distance available).
The aircraft departed Narrandera at 1103 local time and, approximately 30 minutes later, the pilot obtained the automatic terminal information service (ATIS)[1] information ‘Echo’ for Bankstown, prior to commencing descent. The pilot conducted the instrument approach procedure for runway 11C[2] and reported becoming visual with the runway at around 800–900 ft. The pilot recalled that the runway appeared wet, however they did not see any indications of standing or pooled water. Additionally, while they did not recall seeing the windsock, they reported that they did not feel as though there was a tailwind.
The aircraft commenced the round out for landing at 1156:32, and the pilot reported touching down firmly within the touchdown zone, deploying the speed brake and lowering the nose wheel prior to applying the brakes. The pilot stated that, despite braking, no deceleration or braking action was felt. They continued to hold brake pressure, expecting the anti‑skid system to activate (see the section titled Anti‑skid system), however the lack of discernible braking continued.
By this point, the pilot considered that the aircraft had passed the point on the runway where a go‑around could be safely conducted. Observing no system failure or warning indications in the cockpit, the pilot elected to cycle the anti‑skid system. They turned the anti‑skid system off, released and re‑applied the brakes. With no change in braking action the pilot again released the brakes, turned the anti‑skid back on, then re‑applied and held the brakes.
Realising that the aircraft would not stop prior to the end of the runway, the pilot advised air traffic control (ATC) that they could not stop. They then steered the aircraft slightly to the right to avoid the lights at the end of the runway. Departing the end of the runway at a groundspeed of 28 kt, the aircraft entered muddy ground and travelled another 30 m in a right turn before coming to a stop (Figure 2). The aircraft was undamaged and the pilot, flight nurse and patient were uninjured. After advising ATC of the situation and shutting down the aircraft, the patient was transferred to ground transport and the aircraft was recovered to a hanger.
Figure 2: VH-SQY after runway excursion
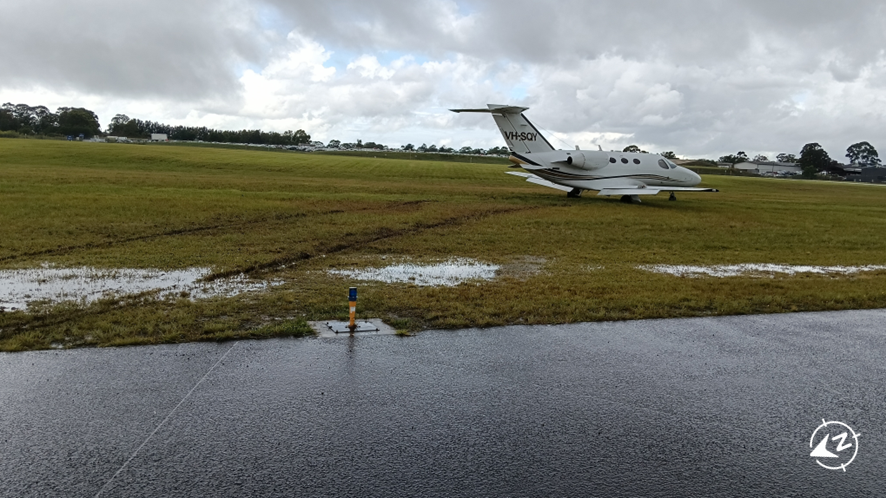
Source: Supplied
Context
Pilot
The pilot held an air transport pilot licence (aeroplane) issued in 2017 and a class 1 aviation medical certificate. They had accumulated 6,954 flight hours, of which 133 hours were operating the Cessna 510. In the previous 90 days, the pilot had accumulated 128 hours, all in the Cessna 510. The pilot had completed a type rating for the aircraft and an instrument proficiency check in October 2024 with Air Link, a company associated with the operator. The pilot had also completed line training with Air Link and had conducted operations for them, prior to commencing operations for AirMed.
Aircraft
General information
VH-SQY was a Cessna 510 Citation Mustang equipped with 2 Pratt & Whitney Canada PW615F‑A turbofan engines. The aircraft was manufactured and first registered in 2010 and was registered with the operator in 2019. It was in medical configuration, in which 2 seats and a cabinet in the main cabin were replaced with a stretcher and medical equipment.
At the time of the incident, the aircraft had accumulated 5,721 hours total time in service and was being maintained in accordance with the Cessna 510 maintenance manual. The last periodic inspection was conducted in December 2024, and the maintenance release showed no outstanding items.
Main landing gear tyres
VH-SQY was equipped with 2 Michelin main landing gear (MLG) tyres. Maintenance records showed that both MLG tyres were last replaced in October 2024, after conducting 255 landings. Since that time, the aircraft had conducted 239 landings including the incident flight.
The manufacturer required the MLG tyres to be inflated to a loaded pressure of 88 PSI. Both the maintainer and the pilot reported that, while the tyre pressure was not recorded or checked, the pressure appeared to be normal with no signs of over or under inflation.
The tyre manufacturer provided guidance on tyre removal criteria (Figure 3) which stated:
Removal criteria for normal wear is based on remaining tread rubber as determined by groove depth or exposure of textile/steel ply material…
NORMAL REMOVAL WEAR LIMIT: Remove the tire when the wear level reaches the bottom of any groove at one point up to a maximum 1/8 of the circumference.
NOTE: When the NORMAL REMOVAL limit is reached, the tire should be replaced. If it is necessary to continue the tire in service beyond the normal wear limit, the tire should be removed either at the next maintenance base or upon reaching the EXPOSED CORD LIMIT, whichever occurs first. At the EXPOSED CORD LIMIT the tire should be removed and replaced.
Figure 3: Michelin tyre wear guidance
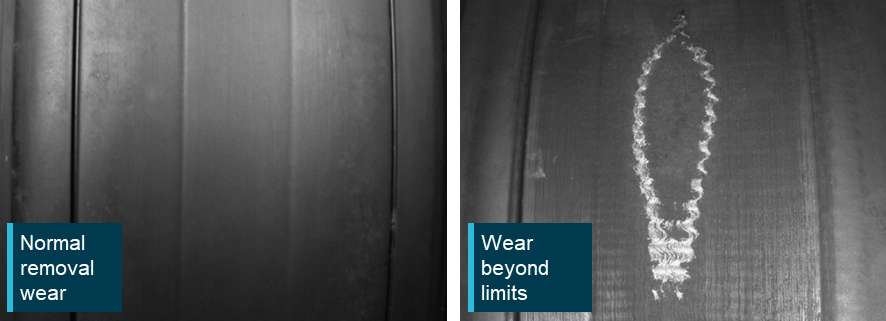
Source: Michelin, annotated by the ATSB
During the post-incident inspection, the maintainer determined that both main landing gear tyres were worn to limits (Figure 4) and identified evidence of flat spotting, potentially due to the wheels previously locking up under braking. The maintainer further advised that the tread remaining on the left and right MLG tyres was measured to be 0.013 inches (0.3 mm) and 0.019 inches (0.5 mm) respectively. Comparatively, the tread of a new tyre was reported to be 0.26–0.29 inches (about 7 mm), indicating that 4–7% of the original tread was remaining. Both tyres were subsequently replaced before the aircraft was released back to service.
Figure 4: VH-SQY main landing gear tyres post‑incident
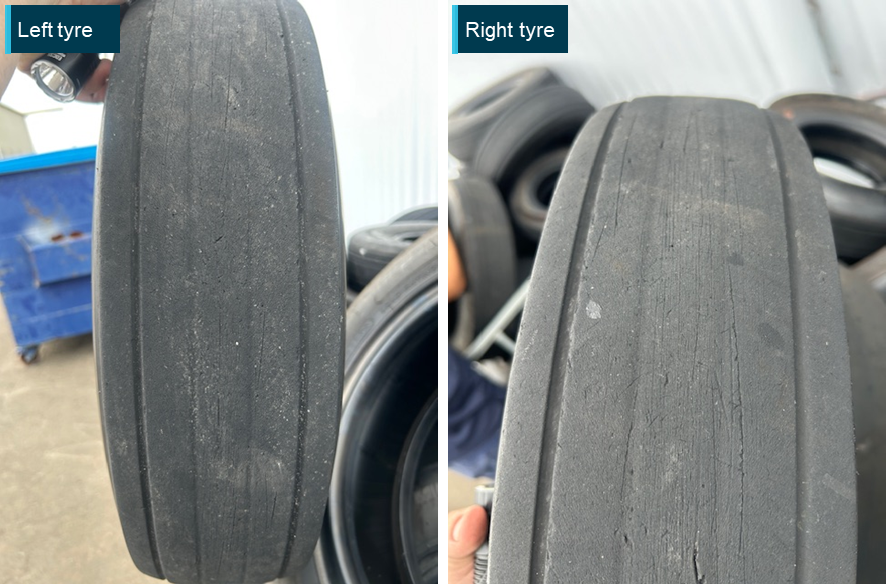
Source: Supplied, annotated by the ATSB
The pilot reported that they had inspected the condition of the tyres as part of the daily inspection of the aircraft prior to commencing operations for the day. They further reported that, while they identified that the centre tread on the tyres was low, they considered that as there was sufficient depth on the outside tread with no exposed cord the tyres were serviceable.
Anti‑skid system
The aircraft was equipped with an anti‑skid system to provide maximum braking efficiency across all runway surfaces and conditions. The anti‑skid system detects if the speed of any main landing gear wheel was too slow for the aircraft’s speed and released the brake momentarily to allow the wheel rotation to increase, preventing it from skidding. Anti‑skid systems are designed to reduce landing distance and minimise the potential tyre damage which can occur when a wheel is locked.
The aircraft was also equipped with a cockpit warning message to indicate when the anti‑skid was inoperative. While landing with anti‑skid inoperative was permitted, pilots were advised that doing so required the landing distance to be increased by between 39–45%.
In a normal landing with the anti‑skid system operative, the aircraft flight manual (AFM) advised pilots to apply brakes after nose wheel touchdown. The AFM further advised that:
to make sure of proper braking on water, snow, and ice-covered, hard-surfaced runways, and all unimproved surfaces, it is necessary for the pilot to apply maximum effort to the brake pedals throughout the braking run. When the system detects a skid and releases the applied brake pressure, any attempt by the pilot to modulate braking can result in an interruption of the applied brake signal and may increase stopping distance significantly.
The manufacturer advised that the anti‑skid system was not certified for turning off then on during a landing. They further advised that turning the system off during a landing roll may result in flat spotting the tyres if the anti‑skid was actively controlling a skid, especially on a wet runway. Additionally, when the system was powered on, it took several seconds to self‑test, during which time it would not function.
Meteorology
Forecast conditions
The Bureau of Meteorology (BoM) issued both a Graphical Area Forecast (GAF) for the area including Bankstown Airport and a terminal area forecast (TAF) for the aerodrome that covered the pilot’s expected landing time. The GAF was initially issued at 0308 that morning and described the weather to expect around Bankstown as including:
- broken cloud from 2,000–10,000 ft[3]
- periods of scattered rain showers with towering cumulus clouds and broken cloud at 500 ft
- isolated thunderstorms with heavy rain, becoming occasional from 1300.
The GAF was re‑issued as part of the regular cycle at 0926 with no changes, other than that the thunderstorms were no longer expected to produce heavy rain and were expected to remain isolated.
The TAF for Bankstown Airport was issued and then amended at 0352. It described the weather at the airport for the expected arrival time as:
- wind from 050°M at 14 kt, light showers of rain and broken cloud at 2,000 ft
- periods of up to 60 minutes of showers of rain with wind gusting 15–25 kt, broken cloud at 800 ft and visibility reduced to 2,000 m
- possibility of thunderstorms for periods up to 60 minutes with variable strong winds, broken cloud at 500 ft and visibility reduced to 1,000 m.
A new TAF was issued at 1026, with the only change being that the wind was now expected to be from 060°M at 10 kt.
Reported conditions
Prior to descent, the pilot reported that they listened to the automatic terminal information service (ATIS)[4] information ‘Echo’ for Bankstown Airport to obtain the reported conditions at the airport. The information included that:
- runway 11 left, centre and right were in use
- runway surface condition code was 5,5,5. Whole runway was wet
(see the section titled Assessment of runway surface condition) - wind was variable at 8 kt
- visibility reduced to 3,000 m in rain
- cloud was scattered at 800 ft, scattered at 1,200 ft and broken at 2,000 ft
- temperature was 23 degrees and QNH[5] was 1014.
Recorded conditions
Wind
The BoM weather station at Bankstown Airport recorded the mean direction of the wind at 1‑minute intervals in addition to the minimum, mean and maximum wind strength. Additionally, the standard deviation of the wind direction was recorded as a measurement of the variability of the wind direction within each minute.
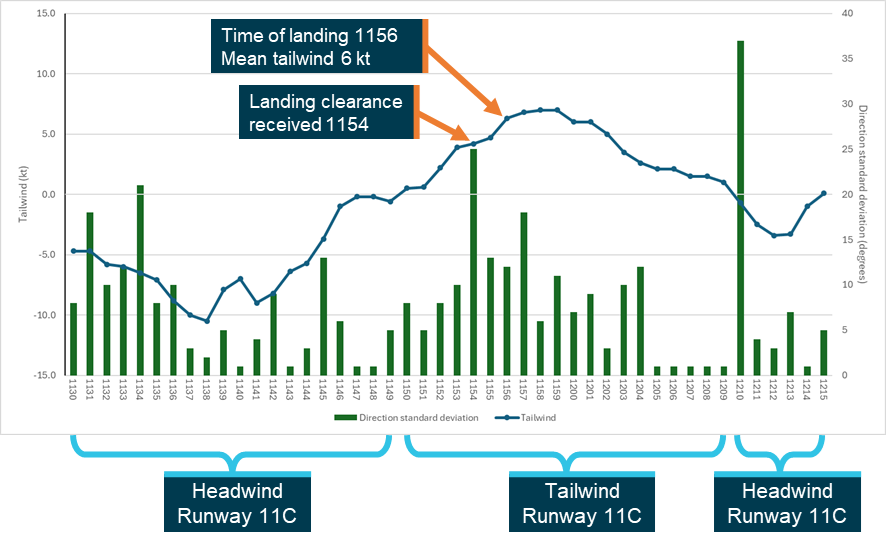
The mean wind direction varied significantly between 1130–1215 (Figure 5). The recorded wind changed from a headwind to a tailwind on runway 11C, 6 minutes prior to VH-SQY landing. However, at around this time, the variability of the wind direction increased. At the time of the landing, the mean wind was recorded as a 6 kt tailwind. Subsequently, the tailwind further increased slightly before decreasing again, becoming a headwind again 14 minutes after the landing.
Figure 5: Runway 11C mean tailwind and wind direction variability 1130–1215
Source: ATSB
Rainfall
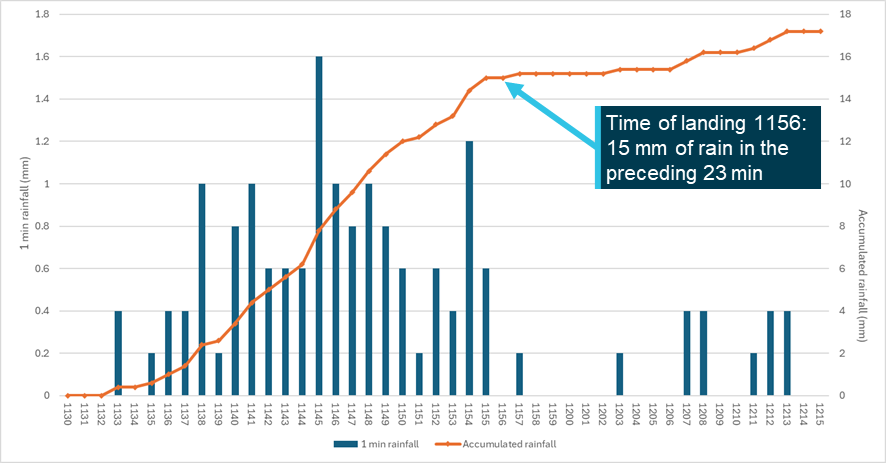
BoM observations recorded that Bankstown Airport received 2.8 mm of rain from 0900–1130 that morning. At 1133, heavy rain began to fall and continued to fall until 1155, 1 minute prior to the aircraft landing (Figure 6). During this 23‑minute period, 15 mm of rain was recorded. This represented a rainfall rate of 39 mm/hr, significantly higher than the threshold of 10 mm/hr required to be classified as heavy rain. Satellite imagery and CCTV footage confirmed that significant rain was observed at and around the aerodrome prior to the aircraft landing.
Figure 6: Bankstown Airport recorded rainfall 1130–1215
Source: ATSB
Runway surface condition
While the runway surface condition was reported as wet on the ATIS, the ATSB identified evidence of standing water on the runway at the time VH‑SQY landed. CCTV footage recorded the latter portion of the landing, during which spray was observed being ejected from beneath the aircraft during its ground roll (Figure 7).
Figure 7: CCTV images of water spray during landing
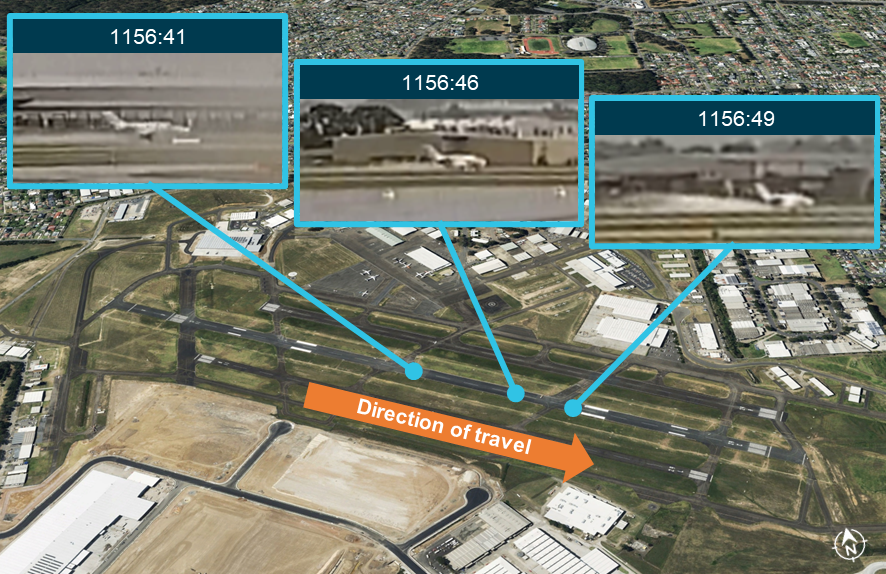
Source: Google Earth and Bankstown Airport, annotated by the ATSB
Additionally, a photograph of runway 11C taken at 1202, 6 minutes after the runway excursion, showed water on the runway (Figure 8). A subsequent photograph taken 9 minutes later showed that the amount of water on the runway had visibly reduced over this time.
Figure 8: Runway 11C surface after incident
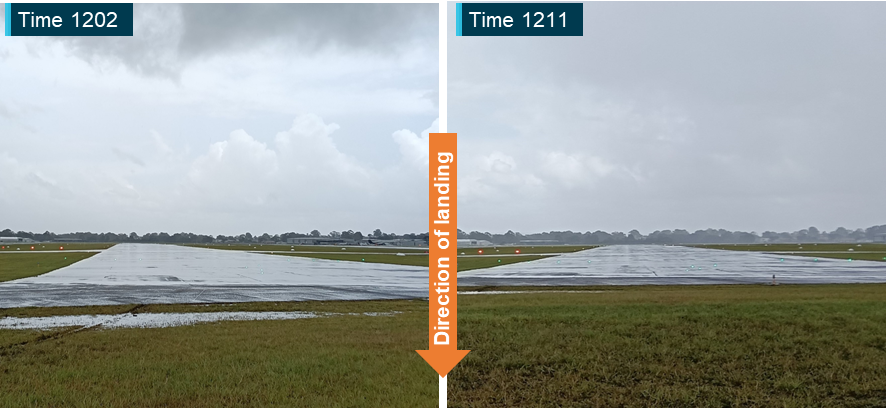
Source: Supplied, annotated by the ATSB
Air traffic control observations
Air traffic control did not advise the pilot of any tailwind when giving an initial landing clearance at 1154 or when a subsequent landing clearance was given at 1155. After the incident, the next aircraft to arrive at Bankstown was advised of an occasional tailwind of 5 kt prior to receiving a landing clearance for runway 11L at 1159.
While the ATSB did not interview the air traffic controllers who were on duty at the time, Airservices Australia advised that an internal occurrence review was conducted into the incident which reported that a tailwind was not observed by the controller at the time that a landing clearance was given to VH‑SQY. They further advised that it was likely that controllers were using instantaneous wind readings in conjunction with visual observations to inform their assessment of wind conditions.
Recorded data
The ATSB analysed flight data recorded by the aircraft’s Garmin G1000 avionics. This data recorded specific flight and system parameters every 1–2 seconds throughout the flight, including during the landing and runway excursion. The aircraft was not fitted with a flight data recorder or a cockpit voice recorder, nor was it required to have them installed.
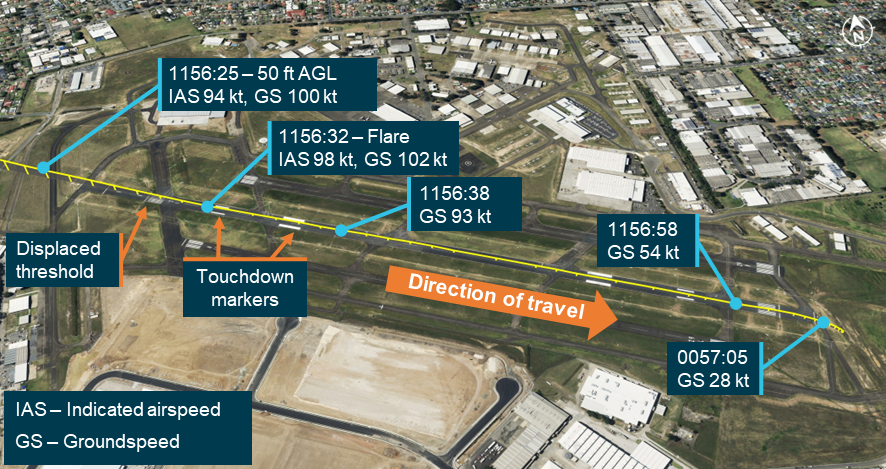
The data from the G1000 showed that on final approach, the aircraft was at 50 ft above ground level (AGL) approximately 240 m before the displaced threshold before arriving at an aim point short of the first touchdown marker (Figure 9).
Figure 9: VH-SQY flight path and landing
Source: Google Earth, annotated by the ATSB
At 1156:32 the aircraft commenced the round out and flare approximately 135 m past the displaced threshold at which point the aircraft’s groundspeed was 102 kt. The recorded data did not contain a specific data point to indicate when the aircraft was on the ground, however a positive G indication, consistent with a touchdown, was recorded at 1156:38, 430 m past the displaced threshold. At this time, the aircraft’s groundspeed had decreased to 93 kt. The aircraft’s groundspeed continued to decrease with no discernible change to the deceleration rate until 1156:58, at which time 140 m of the pavement remained. Subsequently, the aircraft departed the end of the runway at 1157:05 at a groundspeed of 28 kt.
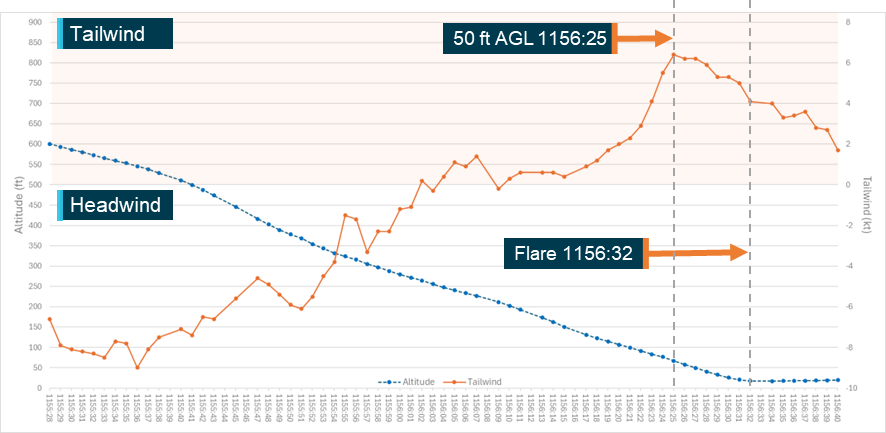
The data recorded both the indicated airspeed and groundspeed of the aircraft, enabling the headwind and tailwind component of the wind to be determined (Figure 10). At approximately 550 ft, the aircraft was experiencing a headwind of 9 kt. As the aircraft descended on the approach, the headwind decreased prior to switching to a tailwind at approximately 250 ft. As the aircraft continued its descent, the tailwind increased up to a maximum of 6.3 kt when the aircraft was 50 ft AGL, consistent with the wind recorded at the airport. After peaking at 50 ft, the tailwind decreased throughout the remainder of the landing.
Figure 10: VH-SQY calculated wind on final approach and landing
Source: ATSB
Bankstown Airport
Runway environment
Bankstown Airport’s runway environment consisted of 3 parallel runways. The centre runway, 11C/29C, was the longest runway. It was typically used for arrivals and departures under the instrument flight rules (IFR) due to associated instrument approach and standard instrument departure procedures. The runway was un-grooved, and the runway surface was asphalt.
The En Route Supplement Australia (ERSA) provided information on Bankstown Airport, including runway dimensions, take-off and landing distances, runway slope and local procedures for operating at the aerodrome. The ERSA advised that runway 11C had a displaced threshold of 97 m and a landing distance available (LDA) of 1,259 m. The pavement surface continued for a further 60 m, however this section was not permitted to be used for either take-off or landing. The reciprocal runway 29C had no displaced threshold and a LDA of 1,356 m.
Runway longitudinal slope
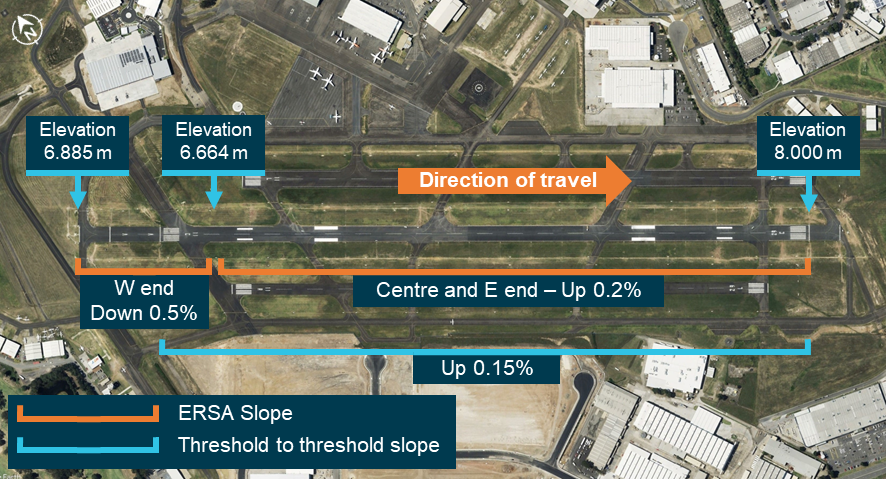
The ERSA described the longitudinal slope of the runway as:
Slope W end 0.5% down to E. Centre 0.2% up to E. E end 0.2% down to W
The ERSA did not contain information on how this description should be used to determine a runway slope value for landing and take-off performance calculations. Bankstown Airport survey information detailed how the slope described in the ERSA was constructed (Figure 11). The survey information identified that the threshold‑to‑threshold slope was 0.15% up to the east. This would have been the runway slope applicable to performance calculations for an aircraft landing on runway 11C.
Figure 11: Runway 11C longitudinal slope
Source: Google Earth, annotated by the ATSB
Bankstown Airport maintained an aerodrome manual, as required under Part 139 (Aerodromes) of the Civil Aviation Safety Regulations (CASRs). The manual included technical information regarding the longitudinal slope of runway 11C/29C and reported:
- The runway slope was 1.12% slope to the south-west.
- In a different section of the manual, the runway was a code 3 non‑precision approach runway with an overall longitudinal slope of 1.34%, whereby the current standard was 1%. This was identified as non‑compliant with the current standards, however, was being used under grandfathering provision of the regulations.
An independent aerodrome technical inspection (ATI) was conducted for the aerodrome in December 2023. The inspection included a visual inspection of all movement area pavements to appraise compliance with CASR Part 139. The inspection reported that the overall longitudinal slope of runway 11C/29C was 1.34%, consistent with one of the statements in the aerodrome manual, but not consistent with survey information.
The ATSB sought clarification from Bankstown Airport regarding the variation between the runway 11C/29C longitudinal slopes reported in the ERSA, aerodrome manual, ATI and survey documentation. Airport personnel advised that the survey information was correct and that the aerodrome manual and ERSA would be amended.
Runway transverse slope and drainage
The aerodrome manual stated that the transverse slope values required by the CASR Part 139 Manual of Standards (MOS) had not been exceeded for runway 11C/29C.
The ATI did not contain a statement regarding assessment of the transverse slope of the runway. However, it did state that the drainage infrastructure of the runway:
appeared to be operating effectively at the time of inspection within minimal areas of ponding observed.
The ATSB was advised by Bankstown Airport that the ATI offered only a visual inspection of the transverse slope and that the slope was typically determined during the runway design process. Both the pilot and the operator reported that discussions had occurred between representatives of the operator and the airport regarding what they considered to be poor runway drainage. Bankstown Airport management advised that they were not aware of any conversations where this was discussed.
Assessment of runway surface condition
Bankstown Airport had procedures for assessing and reporting runway surface conditions and associated braking action under the global reporting format (GRF). The procedures defined the steps required to determine the runway condition report (RCR), a standardised report relating to runway surface conditions, and their effect on an aircraft’s landing and take-off performance.
The RCR was provided in 2 parts, a runway condition code (RWYCC) and a surface description. Additionally, each runway was divided into approximate thirds, with an RCR being determined separately for each of these thirds. The RWYCC was initially assigned based on a runway surface description (Table 1).
Table 1: Runway surface description to assign initial RWYCC
| Runway surface description | Applicable runway condition code (RWYCC) | Braking action |
| Dry | 6 | N/A |
| Wet (The runway surface is covered by any visible dampness or water up to and including 3 mm depth) | 5 | Good |
| Wet (‘Slippery Wet’) | 3 | Medium |
| Standing Water (Depth more than 3 mm) | 2 | Medium to Poor |
After initial assignment of an RWYCC from the runway surface description, receipt of 2 or more pilot reports of braking action less than that expected, could result in the description being downgraded.
During tower hours, ATC was trained to determine if the runway was completely dry or wet and could create the RCR when conditions were dry or wet for the whole runway. Further to this, ATC was able to request the aerodrome reporting officer (ARO) to conduct a runway inspection to assess the runway surface. AROs were also required to carry out inspections after severe weather events, so long as the weather conditions would not pose a safety hazard.
The assessed RCR was advised on the ATIS. Additionally, if the runway surface condition was determined to be slippery wet, or had standing water, a NOTAM[6] was required to be submitted containing details of the adverse RCR.
The ATIS ‘Echo’ current at the time of the incident contained an RCR of 5,5,5, whole runway wet (see the section titled Reported conditions). ATC did not report having received any reports of adverse braking from other pilots prior to the incident that would have required the RCR to be amended. After the incident, while attending to VH‑SQY, the ARO advised the tower controller that there was no observed standing water on runway 11C. Subsequently, when the ATIS was updated to ‘Foxtrot’ at 1213 to advise of a disabled aircraft, the RCR remained the same.
Air traffic control requirements
Airservices Australia’s Manual of Air Traffic Services (MATS) included procedures for ATC relating to the issuing of an ATIS, and the conditions under which it should be revised. These procedures required that an ATIS include:
Surface wind direction and speed, including significant variations
Wind direction was further required to be reported as one of:
SINGLE MEAN DIRECTION;
TWO VALUES representing variation in wind direction, whenever:
i) the extremes in wind direction vary by 60 degrees or more; or
ii) the variation is operationally significant (e.g. the variation is less than 60 degrees, but the variation from the mean results in either a tailwind, and/or significant crosswind component on a nominated runway) (e.g. WIND VARYING BETWEEN [DIRECTION] AND [DIRECTION]);
VARIABLE, where it is not possible to report a mean wind direction, such as:
i) in light wind conditions (3 kt or less); or
ii) the wind is veering or backing by 180 degrees or more
(e.g. passage of thunderstorm, or localised wind effect).
The wind component of the ATIS was also required to:
Quote significant crosswind and any tailwind as:
a) MAXIMUM CROSSWIND (speed) KNOTS [RUNWAY (number), if
applicable]; and
b) MAXIMUM TAILWIND (speed) KNOTS [RUNWAY (number), if applicable].
MATS also advised on wind limitations when nominating a runway. When the runway was dry, a runway could not be nominated for use when the tailwind exceeded 5 kt. When the runway was not completely dry, a runway could not be nominated for use when there was any tailwind component.
ATC was required to revise an ATIS and assign a new code letter when certain items changed and were expected to remain that way for at least 15 minutes. This included changes to an RCR or when wind direction varied by 10°.The CASR Part 179 (Air Traffic Services) MOS also required that:
Changes to ATIS wind information must be provided to pilots with a take-off or landing clearance if it is considered that it would be of significance to the aircraft operation.
Landing performance
Aircraft flight manual
Landing performance data
The Cessna 510 AFM contained performance data for use in calculating the landing distance required (LDR) at a destination aerodrome. This data was contained in 2 sections. The first section provided data to calculate the landing distance when the runway was forecast to be dry. This section of the AFM was marked as approved by the United States Federal Aviation Administration (FAA), the organisation that originally issued the aircraft’s type certificate. The performance data was based on several assumptions including:
- the landing was on a paved, dry runway
- landing preceded by a steady 3° angle approach down to the 50 ft height point with airspeed at VREF[7] in the landing configuration
- maximum wheel braking was initiated immediately on nose wheel contact and continued throughout the landing roll
- winds were to be taken as the tower winds 32.8 ft (10 m) above runway surface
- factors of 50% of the headwind, and 150% of the tailwind had been applied to winds.
The second section of the AFM provided performance data for landing on wet, slush, snow‑ and ice‑covered runways. This section was marked as advisory information and stated that:
The following information is considered the most accurate and practical guidance material available for wet and contaminated runway operations. This advisory information is not FAA approved.
The section also stated that:
The published limiting maximum tailwind component for this airplane is 10 knots, however, landings on precipitation covered runways with any tailwind component are not recommended.
Advisory and unapproved information
The Civil Aviation Safety Authority (CASA) Advisory Circular (AC) 21‑34 Aircraft flight manuals contained information relating to approved and unapproved sections of an AFM and advised that:
- Approved parts of the AFM are approved by the applicable national aviation authority (NAA), based on the type certification requirements effective at the time of certification.
- Unapproved parts of the AFM are provided by the manufacturer additionally, as deemed necessary for the safe operation of the aircraft, and cannot conflict with approved parts of the AFM. Each approved part of the AFM is clearly distinguished from any unapproved part of that AFM.
CASA also published Civil Aviation Safety Regulation (CASR) Part 135 Acceptable means of compliance and guidance material (AMC/GM) - Australian air transport operations—smaller aeroplanes which provided guidance on complying with required performance data calculations. It stated that:
Some performance information presented in AFM or AFM supplements may be advisory information only and should not be used to determine performance in compliance with the provisions of regulations 135.345 and 135.350 [Take-off performance and Landing performance]. Caution should be exercised when using advisory material or when using third-party performance calculations as the results may not be based on the required AFM provided certification data.
Similar advice was contained in CASR Part 121 Acceptable means of compliance and guidance material (AMC/GM) - Australian air transport operations—larger aeroplanes.
The ATSB sought clarification from CASA as to the applicability of data from unapproved sections of an AFM for use in flight planning. They advised that this data could not be used for performance planning, in part because the advisory information was not developed in accordance with standardised conditions.
Landing distance requirements
Safety Margins
Take-off and landing performance data contained in an AFM was obtained through formal testing using specific criteria. It was therefore unlikely that a pilot could replicate the testing performance during normal flying conditions. For this reason, additional distance was added to the calculated distance to provide a safety margin. While only recommended for private operations, the use of safety margins was required when conducting air transport operations.
CASA AC 91-02 provided guidance on the purpose of safety margins including that:
These additional safety margins mitigate risks associated with a range of issues that impact on aircraft performance, including but not limited to:
- pilot inaccuracies compared to performance flight testing (excess landing speed, excess height over threshold, increased float before touchdown, delayed use of braking and deceleration devices, inaccurate application of maximum braking techniques)
- runway characteristics
- aerodrome density altitude
- changed external drag configuration of the aeroplane
- underperforming engine compared to that used for performance testing.
Landing distance factor
CASR Part 135 - Australian air transport operations—smaller aeroplanes, under which this flight was conducted, prescribed certain landing performance requirements. As part of these requirements, if the aircraft was a jet‑driven, multi‑engine aircraft with a maximum take‑off weight (MTOW) of greater than 2,722 kg, such as the Cessna 510, then the performance calculations were required to be conducted in accordance with CASR Part 121, the regulations for larger aeroplanes.
CASR Part 121 required that a pilot determine that the runway at the planned destination aerodrome had sufficient landing distance available (LDA) to bring the aircraft to a stop. For a jet‑engine aeroplane, such as the Cessna 510, the aircraft was required to be shown to able to stop within 60% of the full LDA (Table 2). This calculation was required to be conducted both prior to departure using forecast conditions and in‑flight when actual aerodrome conditions were obtained.
If the runway surface condition was expected to be wet or contaminated, an additional 115% factor was required to be applied as a further safety margin. If the AFM contained landing performance data specific to wet or contaminated runways an alternative calculation was available. However, if this data was contained in an advisory or unapproved section of the AFM, as it was for the Cessna 510, it was not eligible to be used (see the above section titled Advisory and unapproved information).
Table 2: Summary of landing distance required calculations
| Runway surface condition | Landing distance factor | Additional factor |
| Dry | 60% | - |
| Wet | 60% | 115% |
| Contaminated | 60% | 115% |
The regulations stated conditions to be considered when calculating LDR, which included:
- runway surface condition
- forecast wind speed and direction. Unless otherwise accounted for in the performance data in the AFM, 50% of the headwind and 150% of the tailwind
- expected runway to be used
- expected landing weight
- aerodrome elevation
- runway slope if greater than 1%.
Actual landing distance data
CASR Part 121 allowed a single, less restrictive landing distance factor of 15% to be used when determining LDR in‑flight for aircraft where the AFM contained actual landing distance (ALD) data. CASR Part 121 AMC/GM listed key points surrounding the use of ALD including:
- Actual landing distance information is intended to show landing performance that can realistically be achieved by flight crews in commercial operations.
- This is distinct from landing performance demonstrated by test pilots during flight tests for aircraft type certification.
The AMC/GM also stated that to be classified as ALD data, performance data was required to be accordance with International Civil Aviation Organisation (ICAO) Annex 8 standards and that:
the applicability is also limited to aeroplanes intended for the carriage of passengers or cargo or mail in international air navigation. These are known in some States as transport category aeroplanes. This has resulted in some aeroplanes that are seemingly captured by the requirements of ICAO Annex 8 Part IIIB not having performance data that is required to be in accordance with those requirements.
CASA confirmed that performance data in the Cessna 510 AFM did not constitute ALD data.
Landing in very wet conditions
CASA guidance material contained advice for operators and flight crew on landing in very wet conditions which stated:
Operators and flight crews should be aware that the landing distance factors mentioned above – whether based on type certification testing or actual landing distance data provided by OEMs [original equipment manufacturer] separately – may not provide adequate stopping distance in very wet but not yet contaminated runway surface conditions.
Issues that contribute to such incidents include runway conditions such as texture (polished or rubber contaminated surfaces), drainage, puddling in wheel tracks and active precipitation. For un-grooved runways, wheel braking may be degraded when the runway is very wet. Research conducted by the FAA has indicated that 30 to 40 percent of additional stopping distance may be required in certain cases where the runway is very wet, but not yet classified as contaminated.
In order to manage some of the risks associated in operating to very wet runways, it is recommended that operators consider the landing safety factor of 1.15 (which is the difference between 1.67 and 1.92 for type certification data and the value mentioned in the actual landing distance data) to be a minimum value.
Flight planning software
The operator utilised third party flight planning software from Aircraft Performance Group (APG) for performance calculations. Access to this software and underlying performance data was available to pilots through the following means:
- the APG iPreFlight App available on the pilot’s tablet
- the APG Atlas website, available via a computer with an internet connection
- tabulated data for individual aerodromes, available as PDF documents via the electronic flight bag (EFB) on the pilot’s tablet.
The APG iPreFlight App and APG Atlas website provided an interface into which pilots entered the destination airport and runway, forecast or actual conditions and estimated landing weight. Additionally, options were available to configure how the landing distance was calculated which included:
- landing distance factor: 60%, 80% or unfactored
- wet runway calculation method: 115% or use of AFM advisory data
- other runway surface conditions: including 0.125 inches (3 mm) of water, snow and slush.
Of these options, 80% landing distance factor was selected by default.
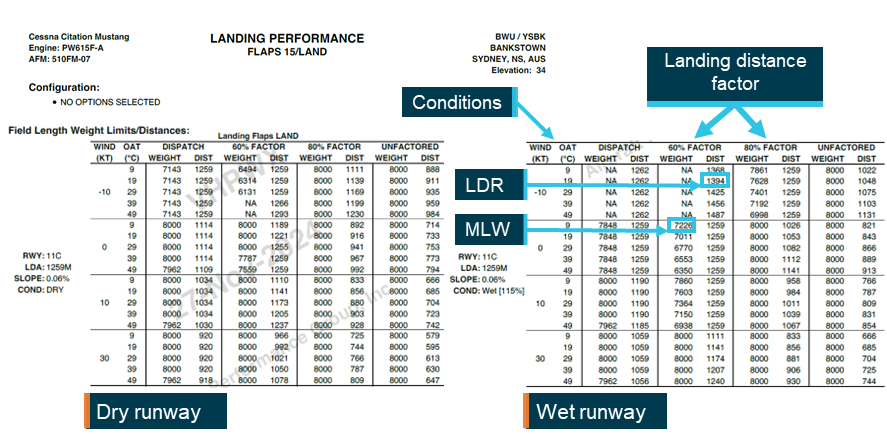
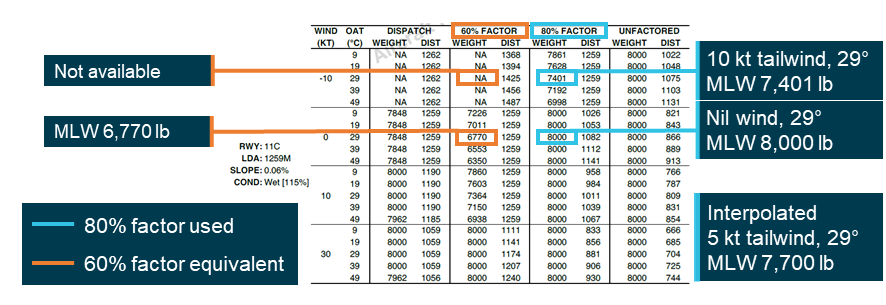
The tabulated data provided both take-off and landing performance data for an individual airport. The landing performance data (Figure 12) was presented as a maximum landing weight (MLW) permitted and the LDR required at this weight, across a discrete set of temperature and wind conditions. Tables for both dry and wet (115%) runway conditions were provided, with 60%, 80% landing distance factors in addition to unfactored data. If the landing distance required for the selected runway was not available, then ‘NA’ was listed as the MLW and the actual distance required was specified.
Figure 12: Extract of tabulated landing performance data for runway 11C
Source: Supplied, annotated by the ATSB
Type rating training
The pilot completed a type rating for the Cessna 510 with Air Link, a company related to the operator. The ground school component of the type rating contained a section on aircraft performance, which included the calculation of landing distance required. The trainer reported that this training included:
- a review of relevant CASR Part 135 and CASR Part 121 requirements for landing distance calculation
- use of the advisory section of the AFM to calculate landing distance required under CASR Part 135 on a wet and contaminated runway
- use of the APG flight planning software on a company EFB to conduct the same landing distance calculation.
The pilot recalled that, during ground training and during the type rating test, an 80% landing distance factor was used. The trainer confirmed that use of an 80% landing distance factor was taught during the type rating. Air Link advised that this factor was adopted as a safety margin in consultation with CASA when both Air Link and AirMed were initially approved under previous regulations as there was no factoring required under the previous legislation.
Operator procedures
Procedures for determining landing distance available
The operator advised the ATSB that, consistent with the training provided by Air Link, pilots were required to apply an 80% landing distance factor when determining LDA. The pilot also reported that they consistently used an 80% factor.
The operator’s procedures contained requirements for pilots when determining landing distance and advised that:
The means to determine maximum allowable take-off and landing weights are based upon:
- airport characteristics consisting of airport elevation, runway gradient and length, runway contaminants, obstructions within the take-off path,
- airport/environmental conditions consisting of temperature, wind and pressure altitude
- aircraft configurations consisting of power settings, flap settings, bleed configurations and MEL [minimum equipment list] inoperative components.
- specified factoring (set by company, in accordance with CAO 20.7.1 [historical regulation])
The procedures further stated that:
The calculation of aircraft performance must be considered prior to dispatch, as part of the pre-flight planning process.
Additional procedures for landing on a wet runway
The operator provided additional guidance for operating on wet or contaminated runways which stated:
Due to the large number of variables involved no exact formula has so far been found, but an empirical result of a 15% increase in the overall distance required has been accepted in the US [United States] and in other countries as providing an acceptable correction for landing.
It is desirable to apply some correction for take-off when the runway is considered to be significantly wet, so as to provide a distance margin to offset the reduced braking likely to arise in the accelerate-stop manoeuvre, whenever the take-off is likely to be distance limited. For take-off and landing, the 15% increase is considered to be appropriate.
It also provided the following guidance for adjusting landing distance available when expecting to land on a wet runway:
Obtain the LDA, and using only 0.85 X LDA as the effective distance available, derive a ‘wet’ length limited landing weight from the general chart in the manual.
Derive the approach climb limit in the usual way, and observe this and the structural limit.
If the ‘wet’ length limit is the most restrictive consider using another runway to provide better protection.
Note: That in both the take-off and landing cases, the use of 1.67% of the overall distance will provide an acceptable margin in that portion of the distance used. In most cases, the distance available for decelerating will be approximately doubled by this means.
Stabilised approach criteria
The operator’s procedures contained requirements for a stabilised approach that stated:
An approach to land must be stabilised by the FAF [final approach fix] in IMC [instrument meteorological conditions] and by 300 ft above the airport elevation in VMC [visual meteorological conditions]. An approach is stabilised when all of the following criteria are met:
- The aircraft is on the correct flight path.
- Only small changes in heading and pitch are required to maintain the correct flight path.
- The aircraft speed is not more than VREF +15 IAS [indicated airspeed] and not less than VREF +5.
- The aircraft is in the correct landing configuration.
- The sink rate is no greater than 1,000 ft/min.
- Power setting is appropriate for the configuration.
- All briefings have been conducted.
The operator further advised that the expectation was for pilots to fly the aircraft within the specified range as they approach the field, reducing airspeed so that the aircraft was at VREF at touchdown.
Pilot assessment of landing distance available
Pre-departure
The pilot reported that prior to departure, as part of their pre-flight planning process they assessed the landing distance available at Bankstown using the APG tabulated landing distance data. Given the forecast conditions (see the section titled Forecast conditions), they determined that the runway would likely be wet on arrival, therefore they consulted the section of the data for a wet runway. Rather than using the wind forecast from the TAF, they used for a more conservative 5 kt tailwind on arrival. Using the 80% landing distance factor in accordance with operator procedures, a more conservative temperature of 29° and interpolating between the values for nil wind and a 10 kt tailwind, they determined that the maximum landing weight was approximately 7,700 lb for runway 11C at Bankstown (Figure 13).
Figure 13: Pre-departure landing distance calculation
Source: Supplied, annotated by the ATSB
The pilot had also determined that the landing weight of VH‑SQY was expected to be 7,089 lb based on calculated take‑off weight and anticipated fuel consumption. Therefore, as the aircraft was expected to be below the maximum landing weight, the aircraft could depart.
In-flight
The pilot reported that upon receiving the ATIS they again conducted an assessment of the landing distance available at Bankstown using APG tabulated data and the reported conditions (see the section titled Reported conditions). Considering that the variable 8 kt wind reported could be all tailwind, the pilot used a more conservative 10 kt tailwind. Again, using the 80% landing distance factor in accordance with operator procedures, the pilot determined that the maximum landing weight was 7,401 lb. The pilot recalculated the estimated landing weight with the current fuel load as approximately the same as that estimated prior to take‑off.
As the aircraft was expected to be below the weight assessed in the chart, they determined that the landing could be conducted. In addition, the pilot advised that they had decided that if they observed a tailwind greater than 5 kt during the approach, they would request to land on the reciprocal runway 29C. At this point, the pilot also determined 89 kt as the required VREF for the aircraft, for the expected landing weight.
ATSB assessment of landing distance required
The ATSB calculated the landing distance required using the 60% landing distance factor required for operating the Cessna 510. A pre‑departure assessment was conducted using conditions from the TAF available prior to departure from Narrandera. An in‑flight assessment using the conditions reported on the ATIS prior to descent was also performed (Table 3). The calculations were conducted using APG flight planning software, software from the manufacturer and using performance data from the AFM with the results consistent across the 3 methods. The pre‑departure calculation determined that a landing distance of approximately 1,230 m was required on runway 11C, less than the 1,259 m available. However, the in‑flight calculation determined that approximately 1,530 m was required, greater than that available.
Table 3: ATSB assessment of landing distance required
| Time of assessment | APG Software | AFM | Manufacturer software |
Pre-departure (TAF) Temperature: 23°C | 1,232 m | 1,234 m | 1,228 m |
In-flight (ATIS) Temperature: 23°C | N/A (insufficient LDA) | 1,533 m | 1,529 m |
Wet or contaminated runway landing performance
Dynamic aquaplaning
Dynamic aquaplaning (also known as hydroplaning) can occur when an aircraft lands on a runway contaminated with standing water, slush or wet snow. Above a certain groundspeed and with sufficient contaminant, the tyre is lifted off the runway surface. This can have serious adverse effects on ground controllability and braking efficiency.
The depth of standing water required for dynamic aquaplaning to occur is generally accepted to be 3 mm (approximately 0.125 inches). This is also the depth required for a runway surface condition to be considered contaminated rather than wet.
The minimum speed above which dynamic aquaplaning can occur is a function of tyre pressure. Two different speeds are often quoted depending on whether the tyre is rotating. A lower speed is considered for a non‑rotating tyre as is the case immediately on touchdown (Table 4).
Table 4: Generally accepted Cessna 510 main landing gear aquaplaning speeds
| Tyre state | Formula | Speed |
| Rotating tyre | 9 x √PSI | 84 kt |
| Non-rotating tyre | 7.7 x √PSI | 72 kt |
The operator’s procedures contained guidance for pilots regarding aquaplaning and stated:
The formula used to determine the speed at which a tyre is likely to hydroplane [aquaplane] after touchdown on a wet runway is: Hydroplane speed = 7.7√𝑇𝑦𝑟𝑒𝑃𝑟𝑒𝑠𝑠𝑢𝑟𝑒𝑃𝑆𝐼
From the above formula, the Citation Mustang’s nose gear hydroplane speed is about 86 knots and the main gear about 72 knots. Above these speeds hydroplaning may occur.
The manufacturer advised that the aircraft’s minimum aquaplaning speed for performance calculations was 84 kt. The operator’s speed was consistent with that for a non‑rotating tyre, while the manufacturer’s speed was consistent with that for a rotating tyre.
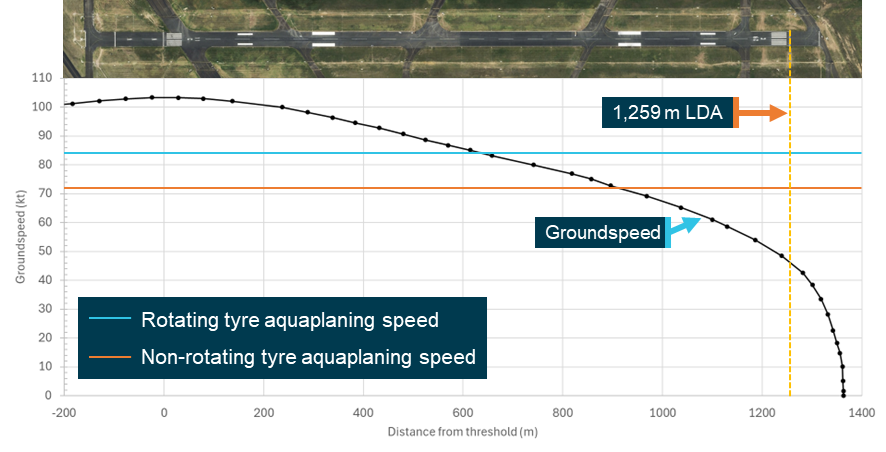
Recorded data showed that the groundspeed of the aircraft was above both the rotating and non‑rotating tyre minimum aquaplaning speed until approximately 360 m of LDA remained (Figure 14).
Figure 14: Recorded groundspeed of VH‑SQY during landing
Source: Google Earth, annotated by the ATSB
Effect of reduced tyre tread
The ATSB reviewed research to assess the effect of reduced tyre tread on braking effectiveness when landing on a wet or contaminated runway. Research conducted by Leland & Taylor (1965) An investigation of the influence of aircraft tire-tread wear on wet‑runway braking concluded that:
On the wet runway, a gradual degradation in braking effectiveness was experienced up to about the 80 percent worn tire tread condition, where the wet-runway friction coefficients dropped markedly.
The completed worn tire was observed to develop, at higher speeds, only about one‑half the braking effectiveness of a new tire.
The research from O’Callaghan (2023) Wet‑runway overruns: still a slippery problem included consideration of the effect of tyre wear on braking performance and stated that:
For the aircraft operator, tire wear is a most important factor … the available 𝜇𝐵 [coefficient of braking] in wet conditions decreases as a tire wears. For a typical aircraft-type, rib-tread tire, when groove depths have been reduced to about 20% or less of the unworn value, the remaining tread may be ‘flattened out’ under load and the tire may then behave as if smooth
Additionally, the research paper Aircraft tyre hydroplaning and how to analyse it in runway excursion events, van Es (2018) discussed the effect of tyre tread on the depth of water required for aquaplaning to occur and stated:
The tyre tread grooves act similar to the pavement macrotexture in draining the bulk water. When there is sufficient macrotexture on the surface and/or the tyre has a sufficient number of deep circumferential grooves, full dynamic hydroplaning will normally not occur, unless the water depth is at a level that both tyre grooves and runway macro texture cannot drain the water sufficiently quick enough…
Smooth tread tyres operating on smooth pavements surfaces require the smallest fluid depth for dynamic hydroplaning, whereas rib treads tyres operating on an open textured or grooved-pavement surface require the largest fluid depths.
Related occurrences
Australia
The ATSB occurrence database contained 263 instances of runway excursions on landing in Australia between 2020–2024. The majority of these involved the aircraft veering off the runway rather than overrunning.
Of these occurrences, 3 included mention of standing water leading to aquaplaning, one of which involved a Cessna 525 operated by Air Link landing on runway 11C at Bankstown in 2022. The ATSB did not investigate these occurrences.
In 2020 the ATSB investigated the runway excursion of a Fokker 100 landing at Newman, Western Australia (AO‑2020‑002). It was found that poor braking effectiveness in wet conditions resulted in the aircraft overrunning the runway.
In 2008, the ATSB published a two‑part research report (AR‑2008‑018) titled Runway Excursions with the objective of analysing international and Australian trends in runway excursions. Part 1 of the report explored the contributing factors associated with runway excursions between 1998 and 2007. Water‑affected and contaminated runways was one of the contributing factors identified.
International
The ATSB identified the following occurrences of runway excursions associated with a wet or contaminated runway:
Runway excursion of a Beech 95-C55 on 12 January 2023 (NTSB WPR23LA089)
During the landing roll, the pilot applied the brakes but discovered that there was more standing water on the runway than expected, resulting in the airplane aquaplaning. It was determined that the wet runway contributed to the aircraft overrunning the runway.
Runway excursion of a Learjet 36 on 9 September 2022 (NTSB WPR22LA344)
During a landing following recent rainfall, the pilot reported that the aircraft did not decelerate normally and subsequently overran the runway. It was determined that a fast landing on a wet runway resulted in the airplane aquaplaning during the landing roll.
Safety analysis
Introduction
On the morning of 11 January 2025, a Cessna 510, registered VH‑SQY, was being used to conduct a medical air transport flight from Narrandera Airport to Bankstown Airport, New South Wales. During the landing at Bankstown, the pilot experienced reduced braking performance, and the aircraft overran the end of the runway.
This analysis will discuss the operator’s procedures for determining landing distance and the pilot’s use of these procedures. The environmental conditions at the time and the actions performed during the landing are also examined. Additionally, the analysis will consider the reporting of conditions at Bankstown Airport and the airport’s runway environment.
Pilot training
The pilot completed a type rating for the Cessna 510 with Air Link, a company related to the operator. The performance component of the ground school incorporated the use of Part 135 regulations.
These regulations required the application of a 60% landing distance factor for a twin‑engine jet aircraft over 2,722 kg, such as the Cessna 510, when determining the landing distance required at a destination aerodrome. However, pilots were taught to use an 80% landing distance factor for this calculation. Use of this factor reduced the safety margin applied to mitigate issues that impacted the aircraft’s ability to achieve published landing performance. Furthermore, pilots were taught to use the aircraft flight manual (AFM) wet runway performance data for wet runway landing distances. However, this data was not permitted to be used for flight planning as it was from an advisory section of the AFM.
Contributing factor The type rating training provided by Air Link taught pilots to apply an incorrect landing distance factor, which reduced the safety margin when determining the required landing distance at a destination aerodrome. (Safety Issue) |
Operator procedures
Both the operator and the pilot reported that, consistent with the type rating training, a landing distance factor of 80% was used when determining the required landing distance. However, a 60% factor was required for these types of operations.
The operator’s procedures contained guidance for calculating the required landing distance during the pre‑flight planning. However, while they referred to the application of specified factoring when determining landing distance available, they did not define what this factoring was. Additionally, the procedures did not advise that a landing distance assessment was required in‑flight in addition to prior to departure.
Furthermore, the operator’s flight planning software provided 2 options for determining the landing distance required: 60% and 80% landing distance factors. However, the 80% option was incorrectly selected by default when using the APG iPreFlight App. In addition, an option to use the AFM advisory wet runway performance data was also available on the App. However, the operator’s guidance did not specify that this was not permitted to be used for flight planning.
Contributing factor AirMed required pilots to apply an incorrect landing distance factor, which reduced the safety margin when determining the required landing distance at a destination aerodrome. Furthermore, its procedures were unclear on how the factor should be applied, when the assessment should be conducted and how runway surface condition should be considered. (Safety Issue) |
Flight planning
Pre departure planning
Prior to departure, the pilot assessed the landing distance available at Bankstown Airport using tabulated data extracted from the flight planning software. Using the Terminal Area Forecast (TAF) at Bankstown Airport, they determined that the runway would likely be wet. While the TAF forecast a headwind on runway 11C, the pilot used a more conservative assumption of a 5 kt tailwind, despite the aircraft flight manual (AFM) stating that landing with a tailwind was not recommended on a wet runway.
The pilot used an 80% landing distance factor, as they had been taught, and determined that sufficient landing distance was available under these conditions. However, the use of a 60% factor was required for this flight.
The ATSB calculated the landing distance required using the conditions forecast in the TAF and the required 60% landing distance factor. It was determined that sufficient landing distance did exist at Bankstown due to the forecast headwind on runway 11C. Therefore, while incorrect data was used to conduct the assessment, the pilot correctly determined that a departure was possible.
In-flight planning
Prior to descent, the pilot obtained aerodrome conditions from the Automatic Terminal Information Service (ATIS). This information included that the wind was variable at 8 kt, the runway 11C was in use and the whole runway was wet. Using this information, the pilot again consulted the 80% landing distance factor tabulated data and determined that there was sufficient landing distance available to attempt a landing with up to a 10 kt tailwind.
However, this assessment also required that a 60% factor was used. Use of this factor would have identified that insufficient landing distance was available to plan for a landing on runway 11C.
If the pilot had determined that insufficient landing distance was available to attempt the landing, options were available to hold for the weather to improve or request more up‑to‑date weather information from air traffic control (ATC).
Contributing factor When determining the required landing distance at Bankstown, the pilot applied the incorrect landing distance factor prescribed by the operator. Subsequently, prior to descent and after obtaining the actual conditions at the aerodrome, the pilot did not identify that the landing distance available was insufficient for the landing. |
Landing and runway excursion
Tyre condition
During the daily inspection of the aircraft, the pilot inspected the aircraft’s main landing gear (MLG) tyres and assessed them as serviceable. However, an inspection after the incident identified that the tyres were below the tyre manufacturer’s guidance for normal removal wear, and less than 10% of the tread was remaining.
Research showed that the braking performance of an aircraft on a wet runway degraded as its tyres wore, with a marked increase in effect when reaching 20% of the original tread depth. Additionally, the depth of tread on a tyre influenced the amount of standing water required to support aquaplaning. Consequently, while permitted for flight, the low tread on the aircraft’s MLG tyres likely had an adverse effect on the aircraft’s braking performance when landing on a wet or contaminated runway.
Meteorology
Rainfall and standing water
At Bankstown Airport there was a period of very heavy rain which continued until 1 minute prior to the landing. Given the intense nature of this rainfall, it is likely that parts of the runway were contaminated with standing water. Furthermore, video and photographic evidence showed that the aircraft encountered standing water during the landing roll. The pilot was not aware of the recent rainfall and had assessed the runway surface as wet but not contaminated, observing no standing water. This was consistent with the runway surface condition reported by the Automatic Terminal Information System (ATIS). Standing water on the runway provided an environment for aquaplaning. In addition, guidance material advised that when landing in very wet conditions degraded wheel braking may require an additional 30–40% of stopping distance.
Tailwind
The ATIS reported that the wind was variable at 8 kt. The pilot recalled that they considered this and had planned to use the reciprocal runway if they observed a tailwind greater than 5 kt. The pilot further reported that they did not observe, nor were they advised by air traffic control (ATC), of a tailwind. However, while the wind was initially a headwind during the approach, this headwind decreased and became a tailwind as the aircraft approached the runway and commenced the landing.
Landing with a tailwind increased the landing distance required. Additionally, while the recorded tailwind was below the maximum permitted by the aircraft flight manual (AFM), landing with any tailwind component was not recommended by the manufacturer when landing on a wet or contaminated runway.
Landing sequence
The aircraft conducted the final portion of the approach to an aim point short of the first touchdown marker. At 50 ft AGL, the indicated airspeed was within 5 kt of the VREF and within the operator’s stabilised approach criteria. However, due to the tailwind encountered, the aircraft’s groundspeed was higher than the airspeed and above both the rotating and non‑rotating dynamic aquaplaning speeds during the touchdown. Consequently, the aircraft likely experienced dynamic aquaplaning when encountering standing water on the runway. Throughout the landing roll, the aircraft’s groundspeed did not decrease below the non‑rotating minimum aquaplaning speed of 72 kt until approximately 900 m into the landing roll.
During the landing roll, due to the lack of braking performance, the pilot elected to release and reapply the brakes and cycle the anti‑skid system. While well intentioned, this action likely further decreased braking performance as brake pressure was released for portions of the landing, and the anti‑skid system was momentarily not operational while a self‑test was conducted. Furthermore, this was not in accordance with the AFM which required that maximum braking was maintained throughout the landing roll. Damage observed on the main landing gear tyres was consistent with them having locked up under braking.
In summary, while the individual contributions of standing water, tailwind, tyre condition and pilot braking action could not be ascertained, the combination of these factors resulted in the aircraft’s reduced braking performance and subsequent runway excursion.
Contributing factor During the approach, an undetected tailwind was encountered and the aircraft landed with a groundspeed higher than the minimum aquaplaning speed. In addition, there was likely standing water on the runway and the aircraft’s main landing gear tyres were worn to limits resulting in reduced braking performance. Subsequently, the pilot cycled the anti‑skid system, likely further decreasing braking performance. In combination, these factors resulted in the aircraft departing the end of the runway. |
Bankstown Airport
Reported conditions
Wind and nominated runway
The ATIS reported the wind as variable at 8 kt with runway 11C nominated for use and no maximum tailwind advised. The Manual of Air Traffic Services (MATS) did not permit the nomination of a runway when there was a tailwind component with a wet runway. Recorded data showed that a mean tailwind had been recorded during the 6 minutes prior to landing. However, the wind direction was highly variable over this time. MATS required that ATIS information be updated when changes to meteorological conditions were expected to remain for 15 minutes, supporting the decision to report the wind as variable, and maintain runway 11C as the nominated runway. It was also required that wind significant to aircraft operation was provided to pilots with a landing clearance. However, at the time the landing clearance was given, the instantaneous wind observed by air traffic control (ATC) may not have indicated a tailwind.
Runway condition code
The ATIS reported the runway condition code as ‘whole runway wet’, however it was likely that sections of the runway were contaminated with standing water. Had the runway condition included sections reported as 2/standing water, the pilot would have been alerted to the potential for reduced braking performance.
However, ATC observations could only be used to declare a runway as fully dry or wet. Downgrading the runway surface condition required either 2 less-than-good braking reports from pilots or physical inspection of the runway surface by the aerodrome reporting officer (ARO). On this occasion, no braking reports had been received, and the ARO had not inspected the runway. After the incident, the ARO reported that there was no standing water observed. However, some water had likely drained away by this time.
Runway environment
Runway slope and drainage
Survey information showed that the longitudinal slope was approximately 0.15% up when landing on runway 11C. While the aerodrome manual and the aerodrome technical inspection (ATI) report contained conflicting information, Bankstown Airport advised that the surveyed slope was correct.
The En Route Supplement Australia (ERSA) entry provided runway slope information expressed by dividing the runway into 3 sections and reporting the slope for each section individually. As a result, it was unclear how to use runway slope values for performance planning. However, as the reported slopes, and the actual surveyed slope were not greater than 0.5%, use of one or a combination of these values would have had little, if any, effect on landing distance calculations.
The ATSB was advised of previous discussions regarding poor runway drainage at Bankstown Airport. However, an aerodrome technical inspection had assessed that the drainage of the runway was operating effectively. In addition, the aerodrome manual stated that the runway slope was designed in accordance with regulatory requirements. Furthermore, while standing water was likely present during the landing, no standing water was observed by the ARO after the incident. Therefore, it was likely that the runway drainage was operating effectively.
Findings
ATSB investigation report findings focus on safety factors (that is, events and conditions that increase risk). Safety factors include ‘contributing factors’ and ‘other factors that increased risk’ (that is, factors that did not meet the definition of a contributing factor for this occurrence but were still considered important to include in the report for the purpose of increasing awareness and enhancing safety). In addition ‘other findings’ may be included to provide important information about topics other than safety factors. Safety issues are highlighted in bold to emphasise their importance. A safety issue is a safety factor that (a) can reasonably be regarded as having the potential to adversely affect the safety of future operations, and (b) is a characteristic of an organisation or a system, rather than a characteristic of a specific individual, or characteristic of an operating environment at a specific point in time. These findings should not be read as apportioning blame or liability to any particular organisation or individual. |
From the evidence available, the following findings are made with respect to the runway excursion involving Cessna 510, VH-SQY, at Bankstown Airport, New South Wales, on 11 January 2025.
Contributing factors
- During the approach, an undetected tailwind was encountered and the aircraft landed with a groundspeed higher than the minimum aquaplaning speed. In addition, there was likely standing water on the runway and the aircraft’s main landing gear tyres were worn to limits resulting in reduced braking performance. Subsequently, the pilot cycled the anti‑skid system, likely further decreasing braking performance. In combination, these factors resulted in the aircraft departing the end of the runway.
- The type rating training provided by Air Link taught pilots to apply an incorrect landing distance factor, which reduced the safety margin when determining the required landing distance at a destination aerodrome. (Safety Issue)
- AirMed required pilots to apply an incorrect landing distance factor, which reduced the safety margin when determining the required landing distance at a destination aerodrome. Furthermore, its procedures were unclear on how the factor should be applied, when the assessment should be conducted and how runway surface condition should be considered. (Safety Issue)
- When determining the required landing distance at Bankstown, the pilot applied the incorrect landing distance factor prescribed by the operator. Subsequently, prior to descent and after obtaining the actual conditions at the aerodrome, the pilot did not identify that the landing distance available was insufficient to attempt the landing.
Safety issues and actions
Central to the ATSB’s investigation of transport safety matters is the early identification of safety issues. The ATSB expects relevant organisations will address all safety issues an investigation identifies. Depending on the level of risk of a safety issue, the extent of corrective action taken by the relevant organisation(s), or the desirability of directing a broad safety message to the Aviation industry, the ATSB may issue a formal safety recommendation or safety advisory notice as part of the final report. All of the directly involved parties are invited to provide submissions to this draft report. As part of that process, each organisation is asked to communicate what safety actions, if any, they have carried out or are planning to carry out in relation to each safety issue relevant to their organisation. Descriptions of each safety issue, and any associated safety recommendations, are detailed below. Click the link to read the full safety issue description, including the issue status and any safety action/s taken. Safety issues and actions are updated on this website when safety issue owners provide further information concerning the implementation of safety action. |
Type training
Safety issue number: AO-2025-002-SI-01
Safety issue description: The type rating training provided by Air Link taught pilots to apply an incorrect landing distance factor, which reduced the safety margin when determining the required landing distance at a destination aerodrome.
Landing distance assessment procedure
Safety issue number: AO-2025-002-SI-02
Safety issue description: AirMed required pilots to apply an incorrect landing distance factor, which reduced the safety margin when determining the required landing distance at a destination aerodrome. Furthermore, its procedures were unclear on how the factor should be applied, when the assessment should be conducted and how runway surface condition should be considered.
Safety action not associated with an identified safety issue
Additional safety action by Air Link Pty Ltd
Air Link is in the process of including a new section in the endorsement training around wet weather operations, including the associated limitations and the effect of worn tyres on aircraft performance. In addition, it has implemented a policy of tyre replacement when tread reaches 2 mm, representing 80% wear.
Additional safety action by AirMed
The operator conducted the following additional proactive safety action:
- Provided training to all crew addressing the effects of tailwind, correct anti‑skid use, tyre limits and landing technique.
- Updated defect reporting procedures to encourage earlier reporting of anticipated maintenance requirements.
- Implemented a policy of tyre replacement when tread reaches 2 mm.
Safety action by Bankstown Airport
Bankstown Airport amended the runway 11C/29C longitudinal slope information in the aerodrome manual to align with the En Route Supplement Australia depiction of runway slope.
Safety action by the Civil Aviation Safety Authority
While not in response to this occurrence, the Civil Aviation Safety Authority subsequently amended the performance section of the Part 121 guidance material as part of its continuous improvement process. These changes included:
- the addition of a section specifying that landing performance must be checked both pre‑flight and in‑flight
- advice that actual landing distance data cannot be used to satisfy in-flight replanning operations
- provision of a list of known aircraft types, including the C510, that must not use actual landing distance data for in-flight landing distance calculations.
Glossary
| AC | Advisory circular |
| AFM | Aircraft flight manual |
| AGL | Above ground level |
| ALD | Actual landing distance |
| AMC/GM | Acceptable means of compliance / guidance material |
| APG | Aircraft performance group |
| ARO | Aerodrome reporting officer |
| ATC | Air traffic control |
| ATI | Aerodrome technical inspection |
| ATIS | Automatic terminal information service |
| BoM | Bureau of Meteorology |
| CASA | Civil Aviation Safety Authority |
| CASR | Civil Aviation Safety Regulation |
| EFB | Electronic flight bag |
| ERSA | En Route Supplement Australia |
| FAA | Federal Aviation Authority |
| GAF | Graphical area forecast |
| GRF | Global reporting format |
| ICAO | International Civil Aviation Organisation |
| IFR | Instrument flight rules |
| LDA | Landing distance available |
| LDR | Landing distance required |
| MATS | Manual of Air Traffic Services |
| MEL | Minimum equipment list |
| MLG | Main landing gear |
| MLW | Maximum landing weight |
| MOS | Manual of standards |
| MTOW | Maximum take-off weight |
| NOTAM | Notice to airmen |
| OEM | Original equipment manufacturer |
| RCR | Runway condition report |
| RWYCC | Runway condition code |
| TAF | Terminal area forecast |
Sources and submissions
Sources of information
The sources of information during the investigation included:
- the pilot and operator
- the manufacturer
- Air Link
- Bureau of Meteorology
- Civil Aviation Safety Authority
- Bankstown Airport
- Airservices Australia
- Aircraft Performance Group
References
Civil Aviation Safety Authority (2022). Aircraft flight manuals (advisory circular AC 21-34 v1.1), https://www.casa.gov.au/sites/default/files/2021-08/advisory-circular-21-34-aircraft-flight-manuals.pdf, CASA, accessed 1 April 2025.
Civil Aviation Safety Authority (2022). Guidelines for aeroplanes with MTOW not exceeding 5 700 kg - suitable places to take off and land (advisory circular AC 91-02 v1.2), https://www.casa.gov.au/guidelines-aeroplanes-mtow-not-exceeding-5-700-kg-suitable-places-take-and-land, CASA, accessed 8 May 2025.
O’Callaghan, J. (2023, August). Wet-runway overruns: still a slippery problem. Presentation to the International Society of Air Safety Investigators (ISASI), Nashville, Tennessee, USA.
Van Es, G. (2018). Aircraft tyre hydroplaning and how to analyse it in runway excursion events. Presentation to the International Society of Air Safety Investigators (ISASI), Dubai, United Arab Emirates.
Leland, T. J., & Taylor, G. R. (1965). An investigation of the influence of aircraft tire-tread wear on wet-runway braking (Vol. 2770). National Aeronautics and Space Administration, Washington, D.C., USA
Submissions
Under section 26 of the Transport Safety Investigation Act 2003, the ATSB may provide a draft report, on a confidential basis, to any person whom the ATSB considers appropriate. That section allows a person receiving a draft report to make submissions to the ATSB about the draft report.
A draft of this report was provided to the following directly involved parties:
- the pilot and operator
- the manufacturer
- Air Link
- Civil Aviation Safety Authority
- Bankstown Airport
- Airservices Australia
- Aircraft Performance Group
- National Transportation Safety Board.
Submissions were received from:
- the pilot
- the operator
- Air Link
- Bankstown Airport
- Civil Aviation Safety Authority.
The submissions were reviewed and, where considered appropriate, the text of the report was amended accordingly.
Purpose of safety investigationsThe objective of a safety investigation is to enhance transport safety. This is done through:
It is not a function of the ATSB to apportion blame or provide a means for determining liability. At the same time, an investigation report must include factual material of sufficient weight to support the analysis and findings. At all times the ATSB endeavours to balance the use of material that could imply adverse comment with the need to properly explain what happened, and why, in a fair and unbiased manner. The ATSB does not investigate for the purpose of taking administrative, regulatory or criminal action. TerminologyAn explanation of terminology used in ATSB investigation reports is available here. This includes terms such as occurrence, contributing factor, other factor that increased risk, and safety issue. Publishing informationReleased in accordance with section 25 of the Transport Safety Investigation Act 2003 Published by: Australian Transport Safety Bureau © Commonwealth of Australia 2025 
Ownership of intellectual property rights in this publication Unless otherwise noted, copyright (and any other intellectual property rights, if any) in this report publication is owned by the Commonwealth of Australia. Creative Commons licence With the exception of the Commonwealth Coat of Arms, ATSB logo, and photos and graphics in which a third party holds copyright, this report is licensed under a Creative Commons Attribution 4.0 International licence. The CC BY 4.0 licence enables you to distribute, remix, adapt, and build upon our material in any medium or format, so long as attribution is given to the Australian Transport Safety Bureau. Copyright in material obtained from other agencies, private individuals or organisations, belongs to those agencies, individuals or organisations. Where you wish to use their material, you will need to contact them directly. |
[1] Automatic terminal information service: the provision of current, routine information to arriving and departing aircraft by means of continuous and repetitive broadcasts. ATIS information is prefixed with a unique letter identifier and is updated either routinely or when there is a significant change to weather and/or operations.
[2] Runway number: the number represents the magnetic heading of the runway. C specifies the centre runway when there are parallel runways available.
[3] Cloud cover: in aviation, cloud cover is reported using words that denote the extent of the cover – ‘scattered’ indicates that cloud is covering between a quarter and a half of the sky, ‘broken’ indicates that more than half to almost all the sky is covered, and ‘overcast’ indicates that all the sky is covered.
[4] Automatic terminal information service: the provision of current, routine information to arriving and departing aircraft by means of continuous and repetitive broadcasts. ATIS information is prefixed with a unique letter identifier and is updated either routinely or when there is a significant change to weather and/or operations.
[5] QNH: the altimeter barometric pressure subscale setting used to indicate the height above mean sea level.
[6] Notice to Airmen (NOTAM): a notice containing information or instructions concerning the establishment, condition or change in any aeronautical facility, service, procedure or hazard, the timely knowledge of which is essential to persons concerned with flight operations.
[7] VREF: landing reference speed. The airspeed equal to the landing 50-foot point speed with the aircraft configured for landing.
Occurrence summary
| Investigation number | AO-2025-002 |
|---|---|
| Occurrence date | 11/01/2025 |
| Location | Bankstown Airport |
| State | New South Wales |
| Report release date | 02/10/2025 |
| Report status | Final |
| Investigation level | Defined |
| Investigation type | Occurrence Investigation |
| Investigation status | Completed |
| Mode of transport | Aviation |
| Aviation occurrence category | Runway excursion |
| Occurrence class | Serious Incident |
| Highest injury level | None |
Aircraft details
| Manufacturer | Cessna Aircraft Company |
|---|---|
| Model | 510 |
| Registration | VH-SQY |
| Serial number | 510-0343 |
| Aircraft operator | AirMed Australia Pty Ltd |
| Sector | Jet |
| Operation type | Part 135 Air transport operations - smaller aeroplanes |
| Departure point | Narrandera Airport, New South Wales |
| Destination | Bankstown Airport, New South Wales |
| Damage | Nil |