
Final
Report release date: 26/11/2025
Investigation summary
Why the ATSB conducted this safety study
The ATSB occurrence data reported by industry identified a trend towards a heightened exposure to risk in the commercial ballooning sector, compared with other forms of non‑scheduled passenger carrying commercial aviation. This study incorporates a detailed analysis of the data and aims to identify key areas of focus for safety improvements, with an intent to reduce passenger injuries.
What the ATSB found
The ATSB found that over the period 2014–2022, commercial ballooning carried a higher risk to fare paying passengers compared with similar operations in small aeroplanes and helicopters. Specifically, a commercial ballooning flight was more likely to have a:
- reported occurrence – especially a serious incident or accident
- passenger sustain an injury.
The ATSB also found that minor injuries, serious injuries, serious incidents and accidents were all more likely to occur during landing than any other phase of flight, and wind was the most common factor reported to have contributed to these occurrences.
Also identified, was that between 2014 and 2022 there was a significant increase in balloons with an envelope size above 400,000 cubic ft on the Civil Aviation Safety Authority’s aircraft register. This reflected an increase in the number of balloons capable of carrying the maximum passenger limit of 24 per flight, thereby increasing overall exposure to risk.
Safety message
Balloons are distinct from other aircraft, in that they travel by moving with the wind. Directional control is achieved using differing wind directions at different altitudes. As such, balloon pilots should use all available information sources, including approved Bureau of Meteorology products, to ensure they understand the weather, particularly the wind, and its influence on flight safety. Accurate weather assessment is critical for safe go/no-go decisions. Pilots should also apply threat and error management by anticipating risks such as powerlines and poor visibility, and prioritising safety over logistical pressures in adverse conditions.

The ATSB SafetyWatch highlights the broad safety concerns that come out of our investigation findings and from the occurrence data reported to us by industry. One of the safety concerns is reducing passenger injuries in commercial ballooning operations.
Reducing accident rates and passenger injuries in balloon operations requires effective safety practices. Although not required by legislation for balloon operators, implementing a Safety Management System (SMS) provides a structured approach to identifying and managing risks.
Recommended risk controls to reduce passenger injury risks include:
- thorough passenger safety briefings and visual safety cards
- ensuring correct brace/landing positions
- clear emergency instructions
- seating or positioning to minimise passenger contact injuries.
Introduction
Background
The ATSB occurrence statistics report for the 10-year period 2010–2019 (AR-2020-047) identified 19 accidents involving commercial balloon operations. These accidents resulted in 1 fatality and 19 serious injuries. Over the same period there were 70 minor injuries involving commercial balloon operations reported to the ATSB.
The report also found the following rates of accidents per million hours flown for the 5‑year period 2014–2019:[1]
- 291.2 for commercial ballooning operations
- 26.3 for non-scheduled commercial aeroplane operations
- 20.9 for non-scheduled commercial helicopter operations.
In addition to attempting to reduce the accident rate, one of the ATSB’s SafetyWatch priorities is to reduce passenger injuries in commercial ballooning operations.
This study benchmarks ballooning operations against other similar operations in Australia, to identify any systemic areas of concern. The results of this work will form the basis of the ballooning safety watch initiative, and identify what further investigation, research and education work may be required for this sector of aviation operations.
Any systemic safety concerns identified will be shared with industry to promote a generative safety culture, encourage further reporting of occurrences, and drive future safety action.
Safety study goals
This safety study expands the understanding of the risks of Australian commercial ballooning, namely balloon transport operations, to the fare paying passenger compared with other similar operations in an aeroplane or helicopter.
The goals of this study were to:
- define what a similar operation for a fare paying passenger was in an aeroplane or helicopter to provide a valid basis for comparison
- provide a rate analysis of balloon occurrences against similar operations in an aeroplane or helicopter
- provide a statistical description of balloon occurrences, including the severity of injuries and safety factors involved
- identify commonalities between all balloon occurrences
- compare balloon occurrences by location and envelope size
- identify and analyse the risks for a fare paying passenger for a flight in a commercially-operated balloon.
Balloon transport operations
Part 131 of the Civil Aviation Safety Regulations (CASR) sets out specific requirements for operating balloons and hot air airships, known in industry as ‘Part 131 aircraft’.
The CASR dictionary defines a balloon as an unpowered, lighter-than-air aircraft. A free balloon is defined as a balloon that is intended for flight without being permanently tethered.
A manned free balloon is defined as one equipped:
- to carry one or more people
- with controls that enable the altitude of the balloon to be controlled.
For the purposes of the safety study, the term balloon will refer to a ‘manned free balloon’.
The focus of this study was balloon transport operations, defined in CASR 131.010 as:
- a passenger transport operation conducted using a Part 131 aircraft that is a registered aircraft or a foreign registered aircraft; and
- conducted for hire or reward; and
- undertaken wholly within Australia; and
- not undertaken as part of a flight into or out of Australian territory.
This does not include training, specialised or recreational operations as defined by the CASR.
Commercial ballooning is a flying operation that takes part in a manned free balloon carrying fare paying passengers for the purpose of a joy flight or sightseeing. As such, valid comparable operations were passenger transport operations classified as a joyflights/sightseeing flight in a Part 135 small aeroplane or a Part 133 rotorcraft subset (helicopter).
Methods and sources
Overview
To allow comparison between the different aircraft types and operations, this study used reported occurrence records of aviation incidents, serious incidents, and accidents from the ATSB national aviation occurrence database. Aircraft activity data was collected from the Bureau of Infrastructure, Transport and Research Economics (BITRE) Australian aircraft activity survey, which is conducted annually and made publicly available online.
Data analysis
The collected data sets for balloons, aeroplanes and helicopters were used to conduct:
- a rate analysis of reported occurrences of commercial ballooning against aeroplane and helicopter operations
- an injury rate comparison.
The following analysis of balloon data from the ATSB national occurrence database was conducted:
- occurrences by phase of flight
- serious incidents and accidents by phase of flight
- serious injuries by phase of flight
- safety factors identified for serious incidents and accidents
- occurrences by location.
A comparison was also conducted of the Bureau of Meteorology weather package services by location to occurrence locations, together with analysis of balloon envelope size changes over the years 2014–2022 inclusive.
ATSB national aviation occurrence database
Occurrence data is reported to the ATSB from industry through the mandatory occurrence reporting requirements of the Transport Safety Investigation Act 2003 and stored in the national aviation occurrence database. This stored data contains information including:
- aircraft type
- registration
- location
- time of occurrence
- number of injuries
- injury level
- occurrence class (incident, serious incident, accident)
- occurrence summary.
A publicly-available search engine allows users to search the database using multiple parameters including: time period, location, type of occurrence and type of aircraft.
In classifying occurrences, the ATSB used the following definitions:
Accident: an occurrence involving an aircraft where:
- a person dies or suffers serious injury
- the aircraft is destroyed, or is seriously damaged
- any property is destroyed or seriously damaged.
Serious incident: an incident involving circumstances indicating that an accident nearly occurred (ICAO Annex 13).
Incident: an occurrence, other than an accident, associated with the operation of an aircraft which affects or could affect the safety of operation (ICAO Annex 13).
BITRE Australian aircraft activity survey
Survey data
The annual BITRE Australian aircraft activity survey and associated statistical report covers all Australian (VH-) registered aircraft used in the commercial air transport and general aviation sectors of the Australian aviation industry.
The survey is completed annually by operators, and the following data is collected:
- aircraft registration
- postcode of aircraft base (balloon operators indicate the postcode of the general area from which most flying was conducted)
- type of activity by hours flown
- type of activity by landings conducted.
The data collection allows aircraft operators to nominate the type of activity that a particular aircraft conducted over that calendar year. The survey results are merged with details from the civil aircraft register. The register gives access to additional relevant information including aircraft type, engine and fuel type, country, and year of manufacture.
Activity classification
In 2013, recommendations from the Tenth Session of the Statistics Division of the International Civil Aviation Organization (ICAO) were adopted by the ICAO Council and a new edition of the Reference Manual on the ICAO Statistics Program was published. Included within the manual was a new ICAO Classification of Civil Aviation Activities.
In 2014, BITRE adopted ICAO’s new classification and began collecting statistics in their survey to reflect this change.
In 2019, the ATSB adopted the new activity classification to align with BITRE and ICAO. The ATSB conducted a multi-year project to reclassify over 320,000 occurrences and events within the ATSB occurrence database to include the new activity classification. This reduced most of the uncertainty associated with combining/comparing the databases. These changes meant the ATSB could present more accurate, higher resolution rate data (the best measure for comparison between activities) for more activities.
In response to this change, and to enable an accurate classification comparison between balloon, aeroplane and helicopter operations, this safety study used rate and occurrence data for the years 2014–2022 inclusive.
Landings versus flight hours
BITRE provided rate data in 2 forms: flight hours per operational category and number of landings per operational category. The ATSB elected to use the number of landings (as a proxy for number of flights) rather than flight hours when comparing aircraft types.
Unlike aeroplanes and helicopters, which can record several take-offs and landings within a single hour of flight, balloon flights almost always involve only one take-off and one landing. Therefore, using flight hours would not give an accurate comparison across aircraft types. The number of landings offered a more valid and consistent measure of risk exposure between them.
BITRE flying activities
BITRE defined commercial air transport as an ‘aircraft operation involving the transport of passengers, cargo or mail for remuneration or hire’; and general aviation as an ‘aircraft operation other than a commercial air transport operation’.
The Australian aircraft activity survey had the following relevant flying activities:
- general aviation
- sport and pleasure flying
- joyflights/sightseeing charters. Flying involving the carriage of passengers for joyflight or sightseeing purposes that take off and land at the same location
- sport and pleasure flying
- commercial aviation
- non-scheduled
- passenger transport charters. Flying involving the carriage of passengers by the aircraft operator or his/her employees for hire or reward (but excluding scheduled airline operations).
- non-scheduled
A review of initial data collected from BITRE identified that commercial balloon flights had been recorded as either a joyflights/sightseeing charters activity or a passenger transport charters activity. Therefore, for the purpose of this analysis, data from both aircraft activity types was used to capture all commercial balloon transport operations (‘commercial ballooning’).
Similarly, it was possible that aeroplanes and helicopter operators also recorded joyflights/sightseeing charters as passenger transport charters and not joyflights/sightseeing charters.
As such, this study analysed the data with the passenger transport charters aircraft activity type included and then excluded for aeroplanes and helicopters for the comparison with commercial ballooning.
Collected data
Australian aircraft activity survey data 2014–2022
The following data was collected from BITRE Australian aviation activity surveys for the years 2014–2022 inclusive:
- balloon landings logged as joyflights/sightseeing and passenger transport charters
- aeroplane and helicopter landings logged as joyflights/sightseeing and passenger transport charters
- aeroplane and helicopter landings logged as joyflights/sightseeing charters only.
Results of the aircraft activity surveys conducted between 2014 and 2022 showed that there were:
- 68,433 commercial ballooning landings (Figure 1)
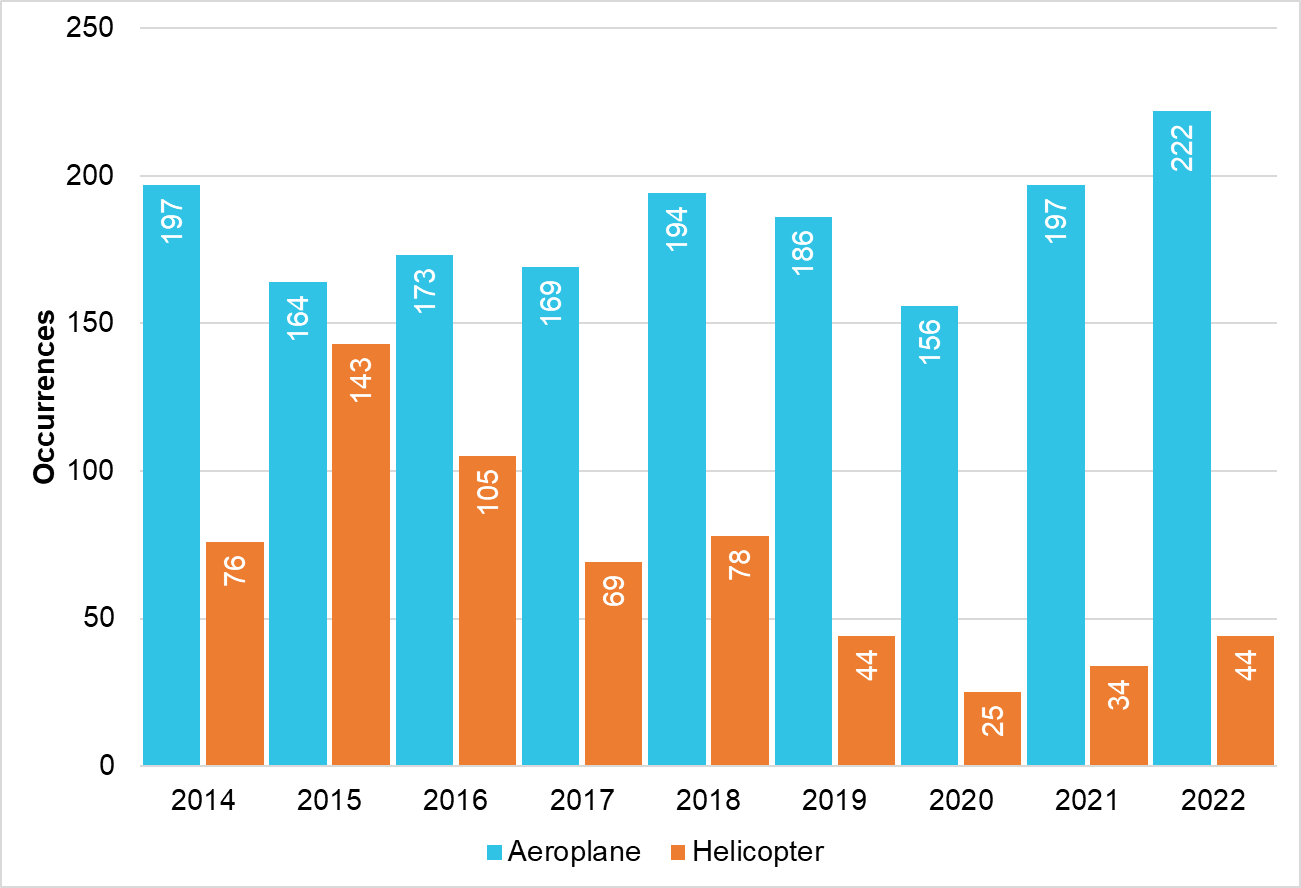
- 2,190,607 aeroplane joyflights/sightseeing and passenger transport landings (Figure 2)
- 1,795,332 helicopter joyflights/sightseeing and passenger transport landings combined (Figure 2)
- 260,506 aeroplane joyflights/sightseeing landings (Figure 3).
- 496,867 helicopter joyflights/sightseeing landings (Figure 3).
The reduction in total landings between 2019–2021 across the 3 groupings was likely due to effects of the COVID-19 pandemic.
Figure 1: Commercial ballooning flights per year (2014–2022)
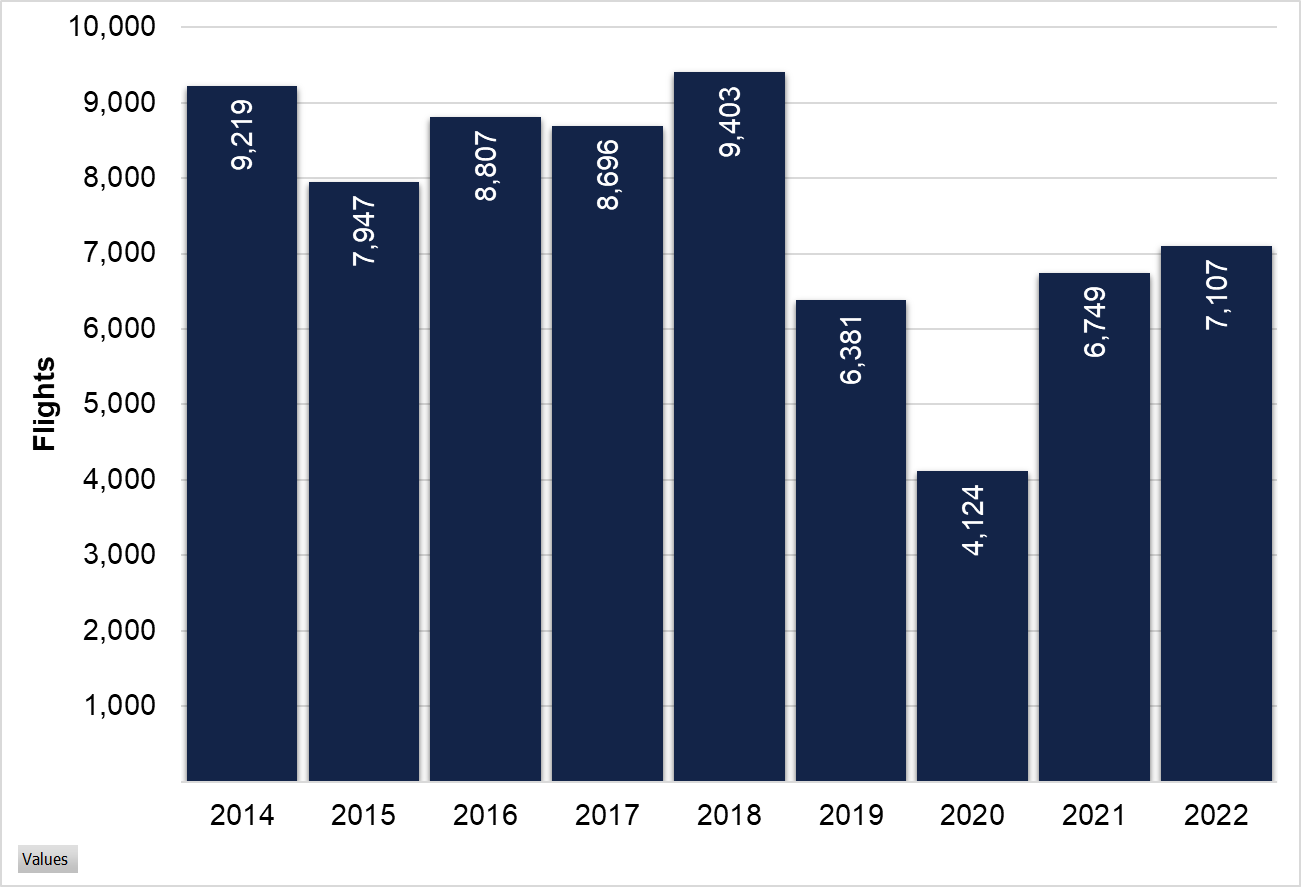
Source: BITRE, annotated by the ATSB
Figure 2: Aeroplane and helicopter joyflights/sightseeing and passenger transport flights per year (2014–2022)
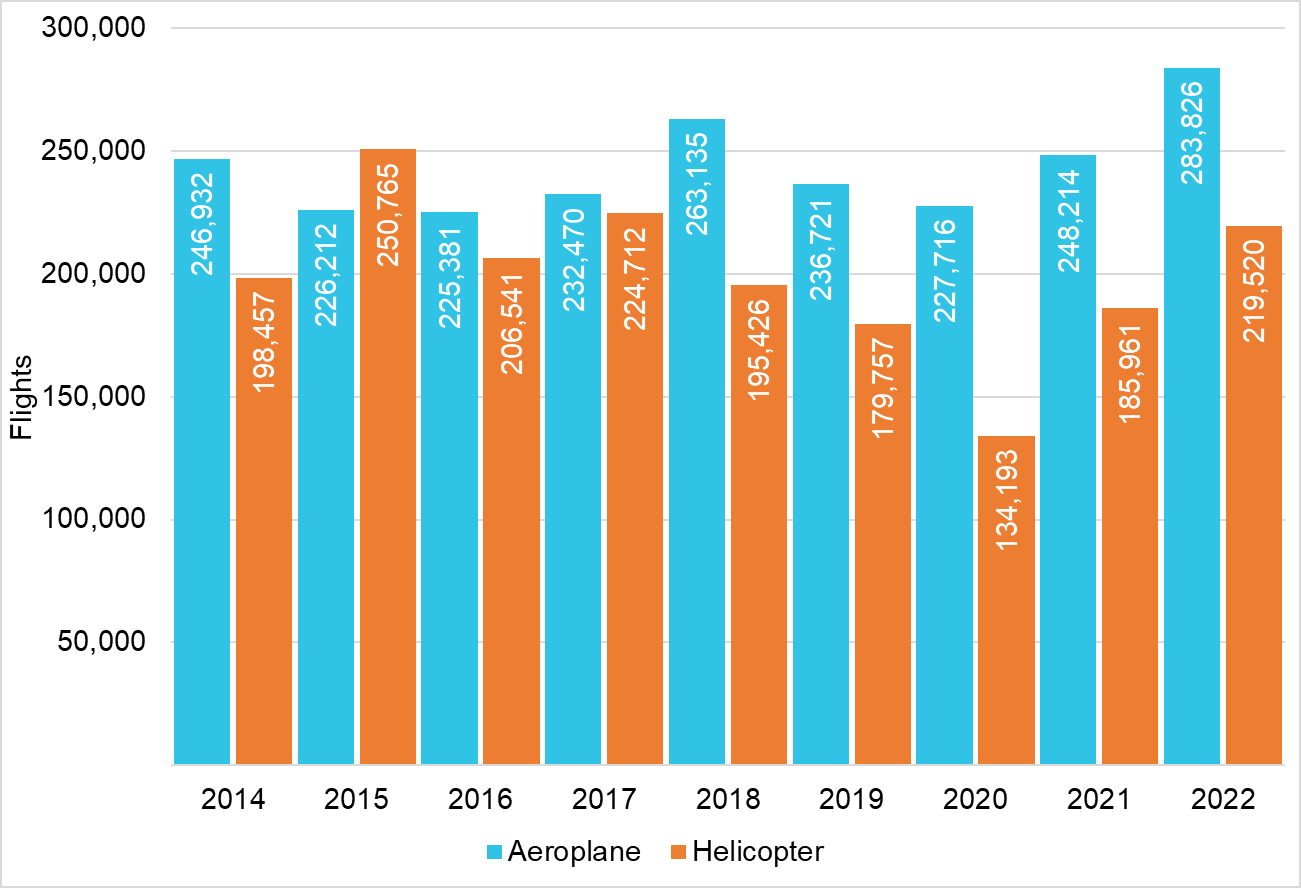
Source: BITRE, annotated by the ATSB
Figure 3: Aeroplane and helicopter joyflights/sightseeing flights per year (2014–2022)
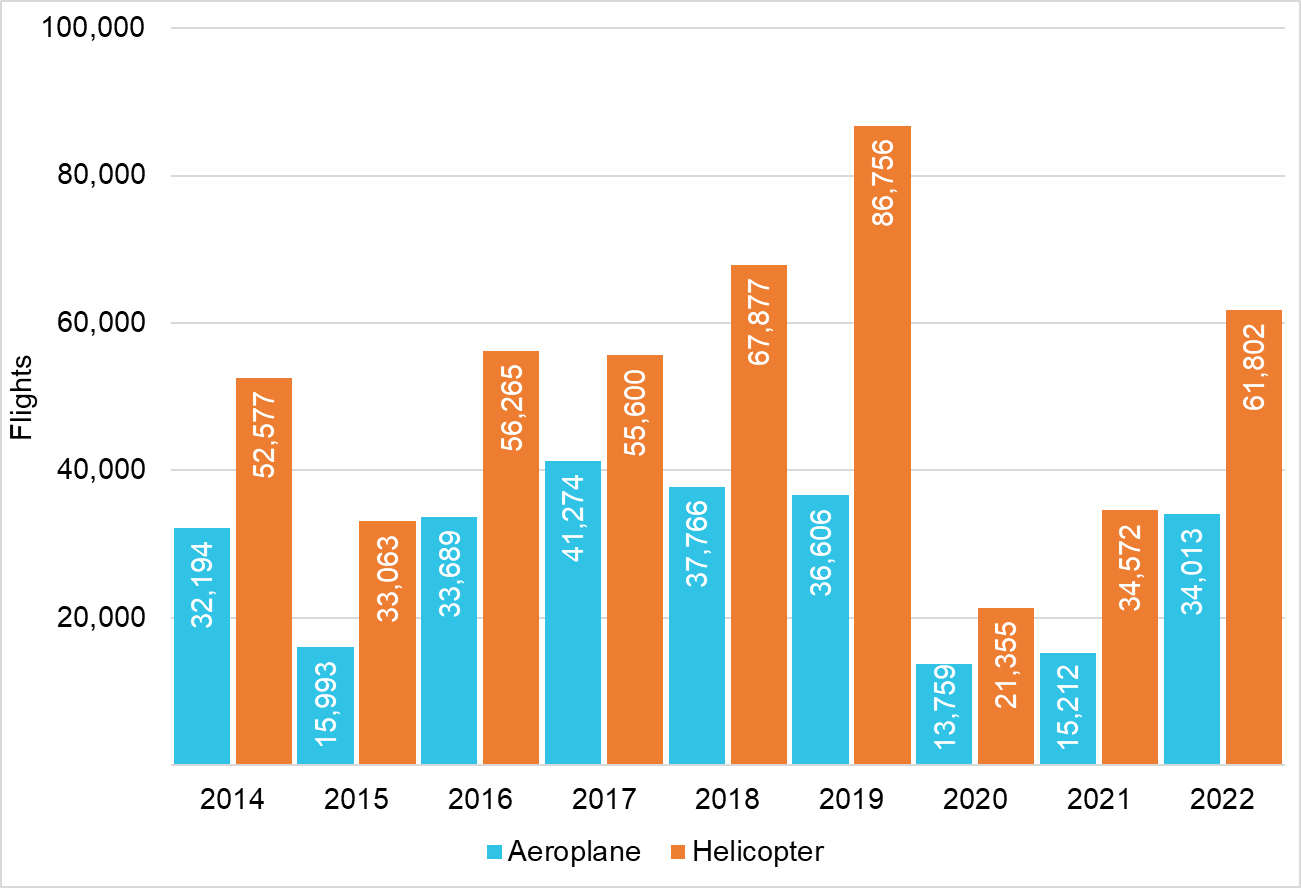
Source: BITRE, annotated by the ATSB
ATSB occurrence data 2014–2022
Occurrence data was extracted from the ATSB national aviation occurrence database for the years 2014–2022 inclusive of the following categories:
- manned free balloons
- commercial ballooning operations
- aeroplanes and helicopters
- joyflights/sightseeing operations and non-scheduled commercial passenger transport operations combined
- joyflights/sightseeing operations.
Between 2014 and 2022, the following numbers of occurrences were reported to the ATSB:
- 79 commercial ballooning occurrences (Figure 4)
- 1,658 aeroplane joyflights/sightseeing and passenger transport occurrences (Figure 5)
- 618 helicopter joyflights/sightseeing and passenger transport occurrences (Figure 5)
- 71 aeroplane joyflights/sightseeing occurrences (Figure 6)
- 62 helicopter joyflights/sightseeing occurrences (Figure 6).
Figure 4: Commercial ballooning reported occurrences per year (2014–2022)
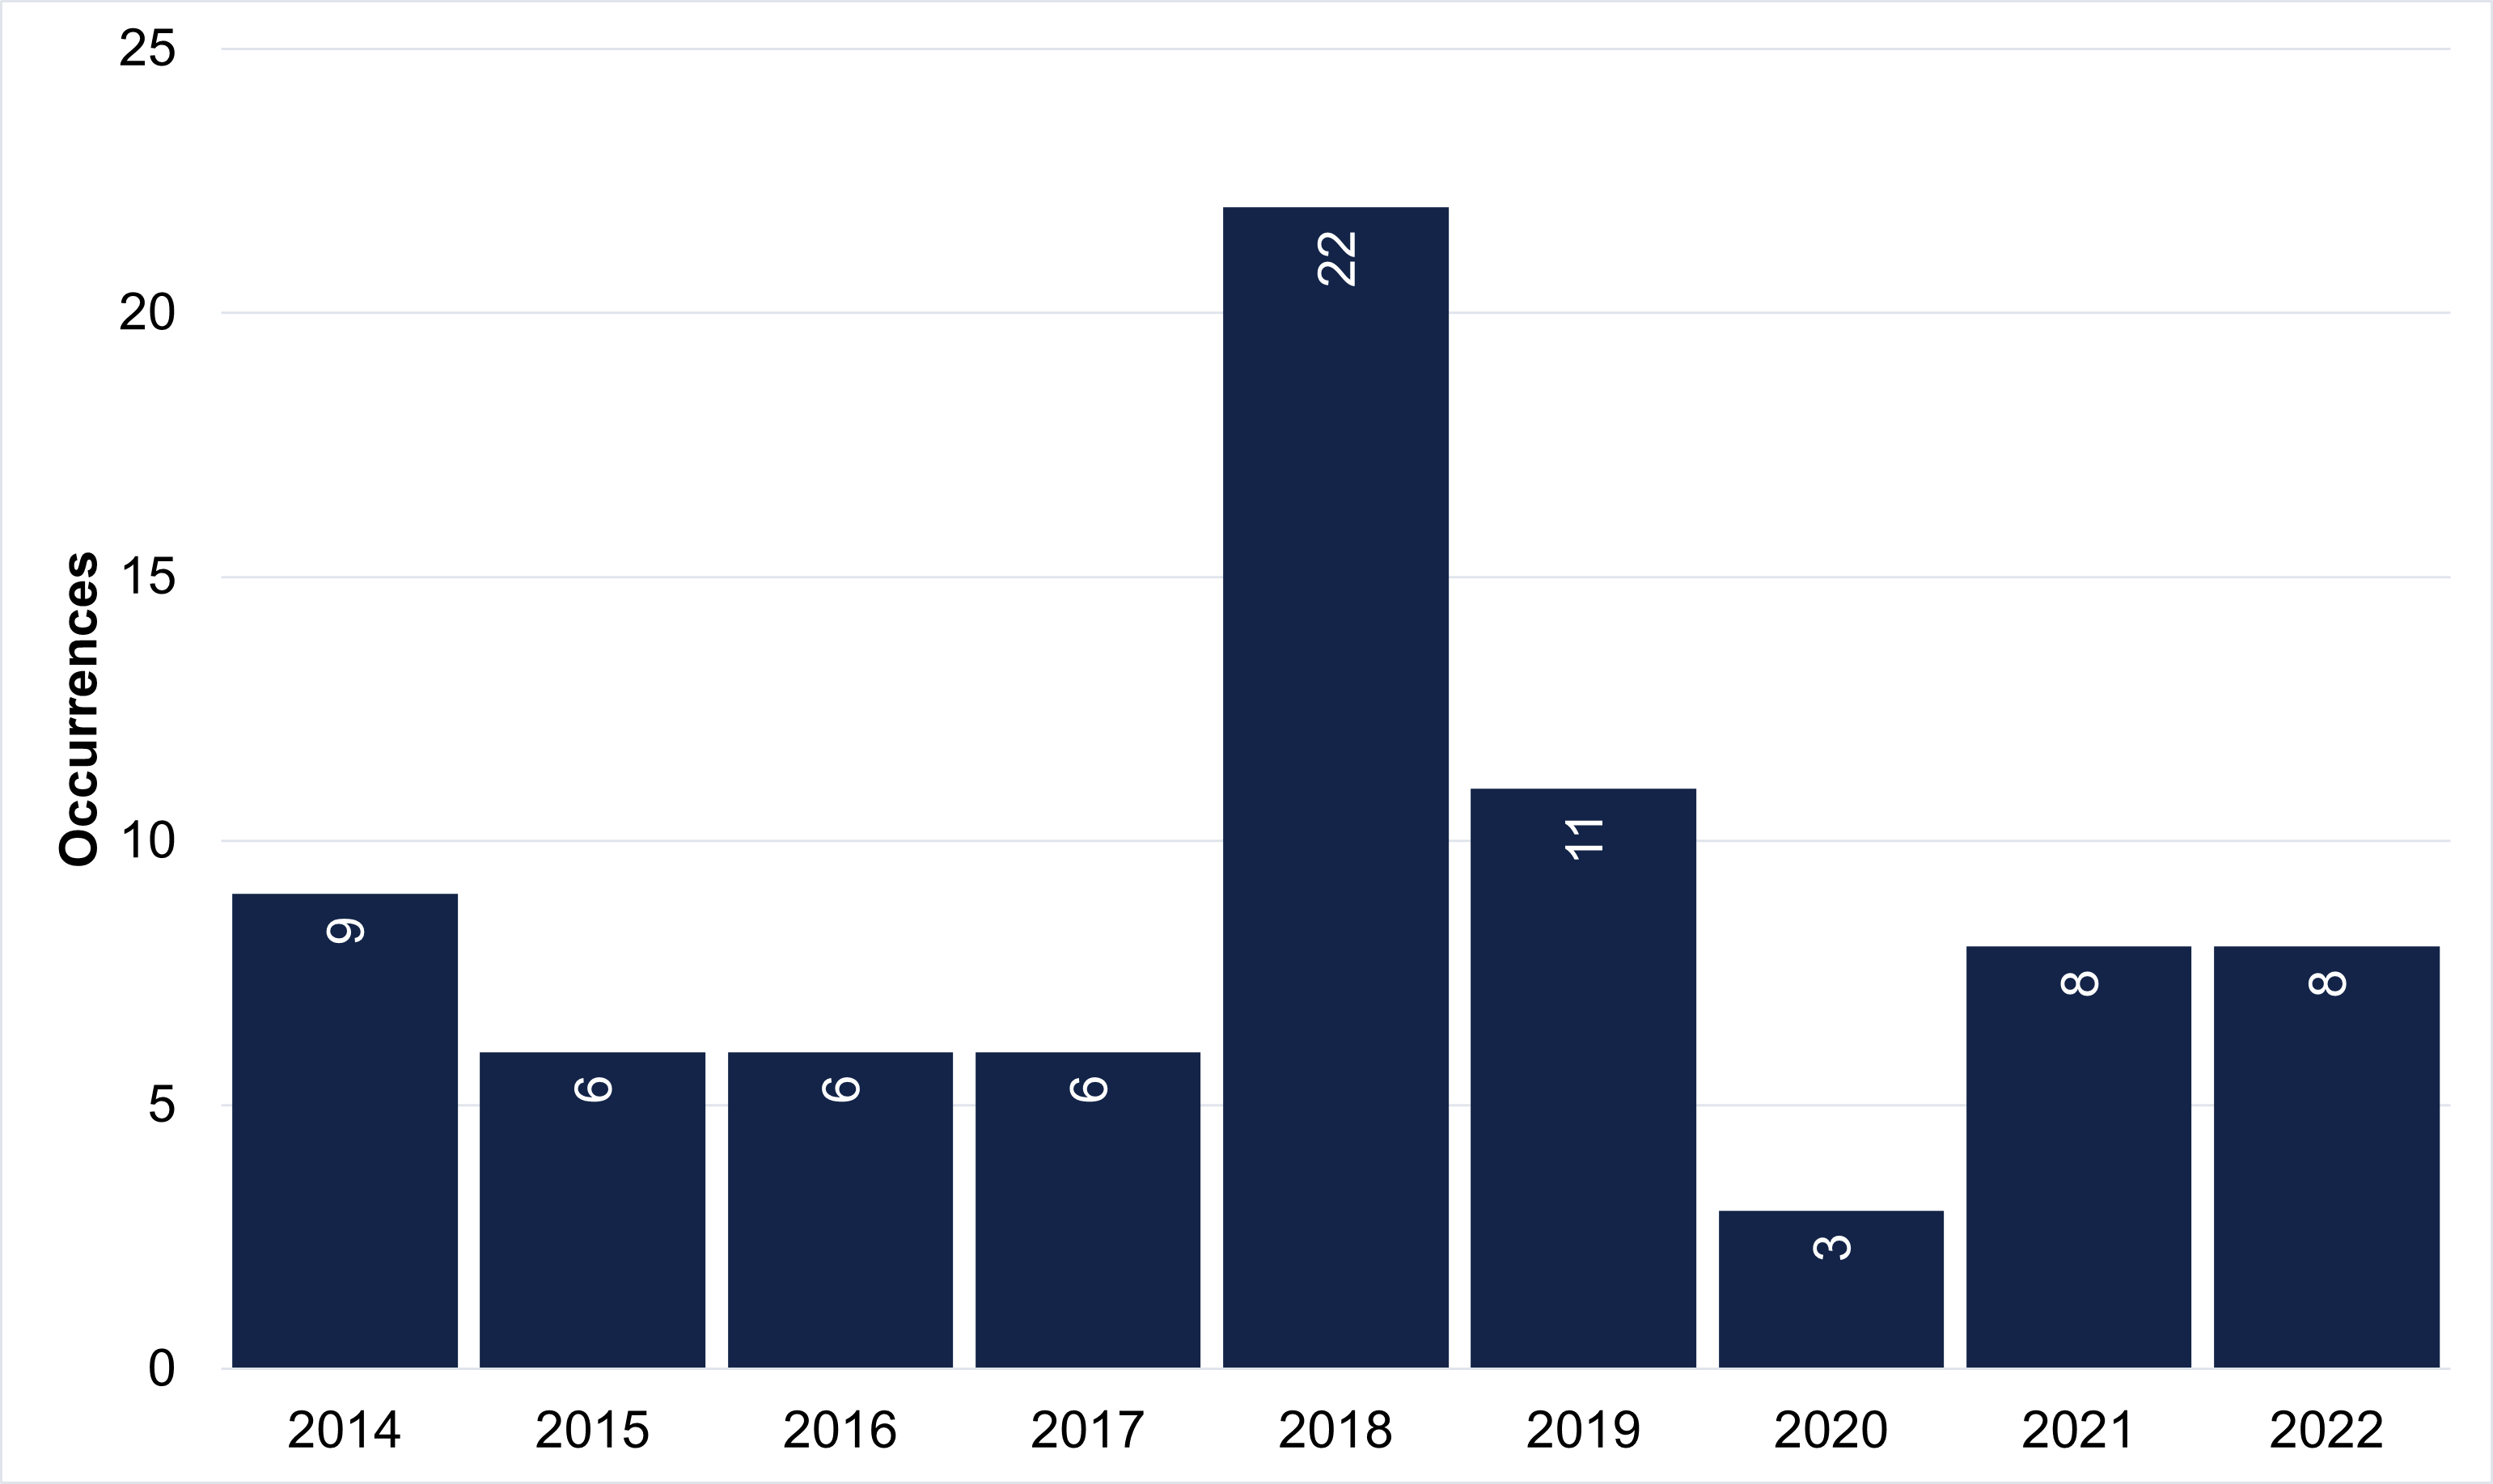
Source: ATSB
Figure 5: Aeroplane and helicopter joyflights/sightseeing and passenger transport reported occurrences per year (2014–2022)
Source: ATSB
Figure 6: Aeroplane and helicopter joyflights/sightseeing reported occurrences by year (2014–2022)
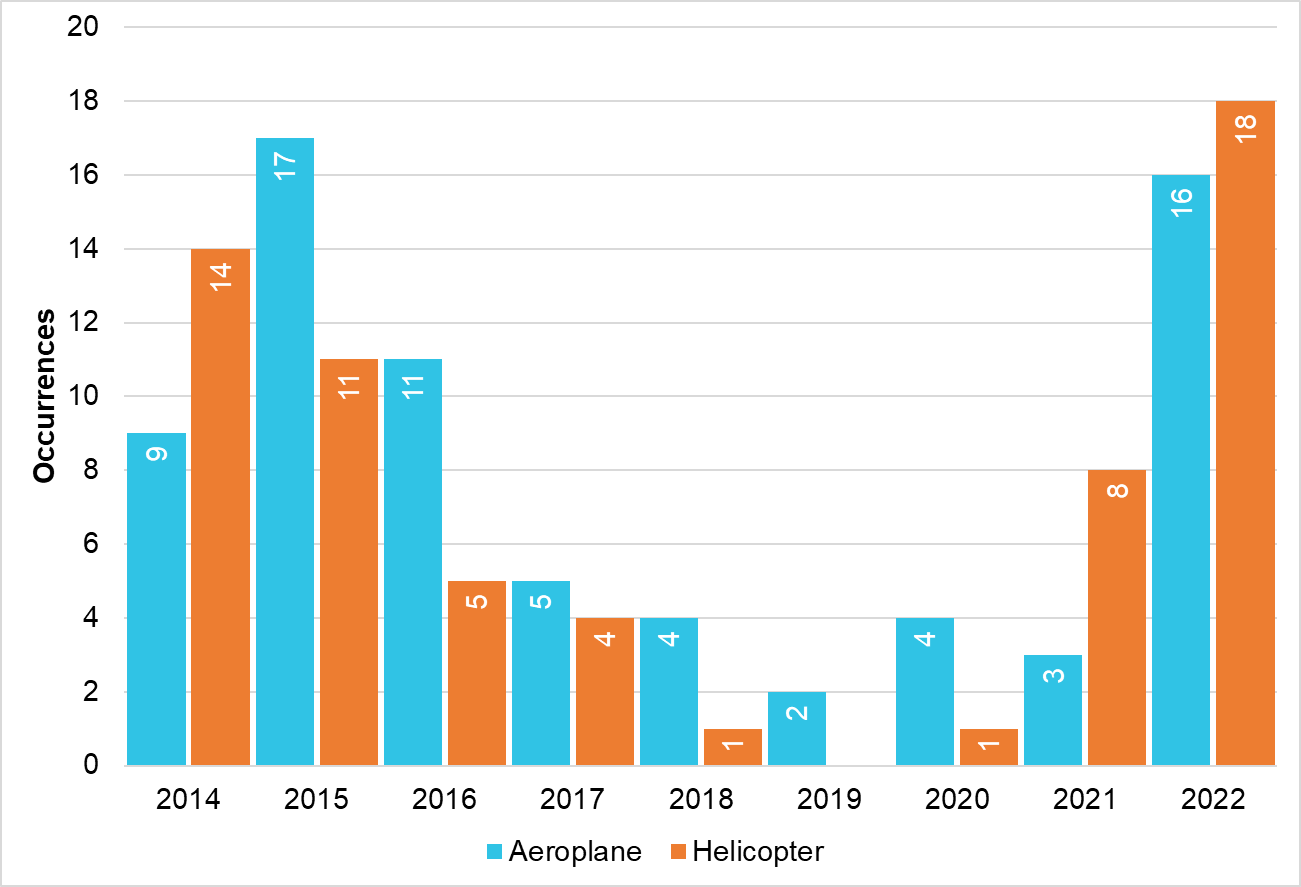
Source: ATSB
Reported occurrence rate comparison
The ATSB used reported occurrence data and activity survey data (2014–2022) to obtain an occurrence rate comparison between commercial ballooning and combined aeroplane and helicopter operations.
The 4 rate analyses were:
- occurrence rate (comparison 1)
- serious incident and accident rates (comparison 2)
- injury rate (comparison 3)
- serious injury rate (comparison 4)
Two comparisons were conducted for each rate analysis:
- commercial ballooning versus aeroplane and helicopter joyflights/sightseeing and passenger transport activities (comparison X.1)
- commercial ballooning versus aeroplane and helicopter joyflights/sightseeing (only) (comparison X.2).
Occurrence rate comparison
Comparison 1.1 – reported occurrence rate comparison between commercial ballooning and joyflights/sightseeing and passenger transport in an aeroplane and helicopter
Commercial ballooning reported occurrence rate
- 68,433 landings
- 79 reported occurrences
- 115.4 reported occurrences per 100,000 landings.
For the period 2014–2022, the commercial ballooning reported occurrence rate was 115.4 occurrences per 100,000 landings.
Aeroplane joyflights/sightseeing and passenger transport reported occurrence rate
- 2,190,607 landings
- 1,658 occurrences
- 75.7 per 100,000 landings.
For the period 2014–2022, the aeroplane joyflights/sightseeing and passenger transport reported occurrence rate was 75.7 occurrences per 100,000 landings.
Helicopter joyflights/sightseeing and passenger transport reported occurrence rate
- 1,795,332 landings
- 618 occurrences
- 34.4 per 100,000 landings.
For the period 2014–2022, the helicopter joyflights/sightseeing and passenger transport reported occurrence rate was 34.4 occurrences per 100,000 landings.
ATSB finding A commercial balloon flight was 1.5 times more likely to have a reported occurrence than a comparable joyflights/sightseeing and passenger transport activity in an aeroplane and 3.4 times more likely than a helicopter. |
Comparison 1.2 – reported occurrence rate comparison between commercial ballooning and a joyflights/sightseeing activity in an aeroplane and helicopter aircraft
Commercial ballooning reported occurrence rate
For the period 2014–2022, the commercial ballooning reported occurrence rate was 115.4 occurrences per 100,000 landings.
Aeroplane joyflights/sightseeing reported occurrence rate
- 260,506 landings
- 71 occurrences
- 27.3 per 100,000 landings.
For the period 2014–2022, the aeroplane joyflights/sightseeing reported occurrence rate was 27.3 occurrences per 100,000 landings.
Helicopter joyflights/sightseeing reported occurrence rate
- 496,867 landings
- 62 occurrences
- 12.5 per 100,000 landings.
For the period 2014–2022, the helicopter joyflights/sightseeing reported occurrence rate was 12.5 occurrences per 100,000 landings.
ATSB finding A commercial balloon flight was 4.2 times more likely to have a reported occurrence than a comparable joyflights/sightseeing activity in an aeroplane and 9.2 times more likely than a helicopter. |
Serious incident and accident rates
Analysis of serious incident and accident data 2014–2022, found:
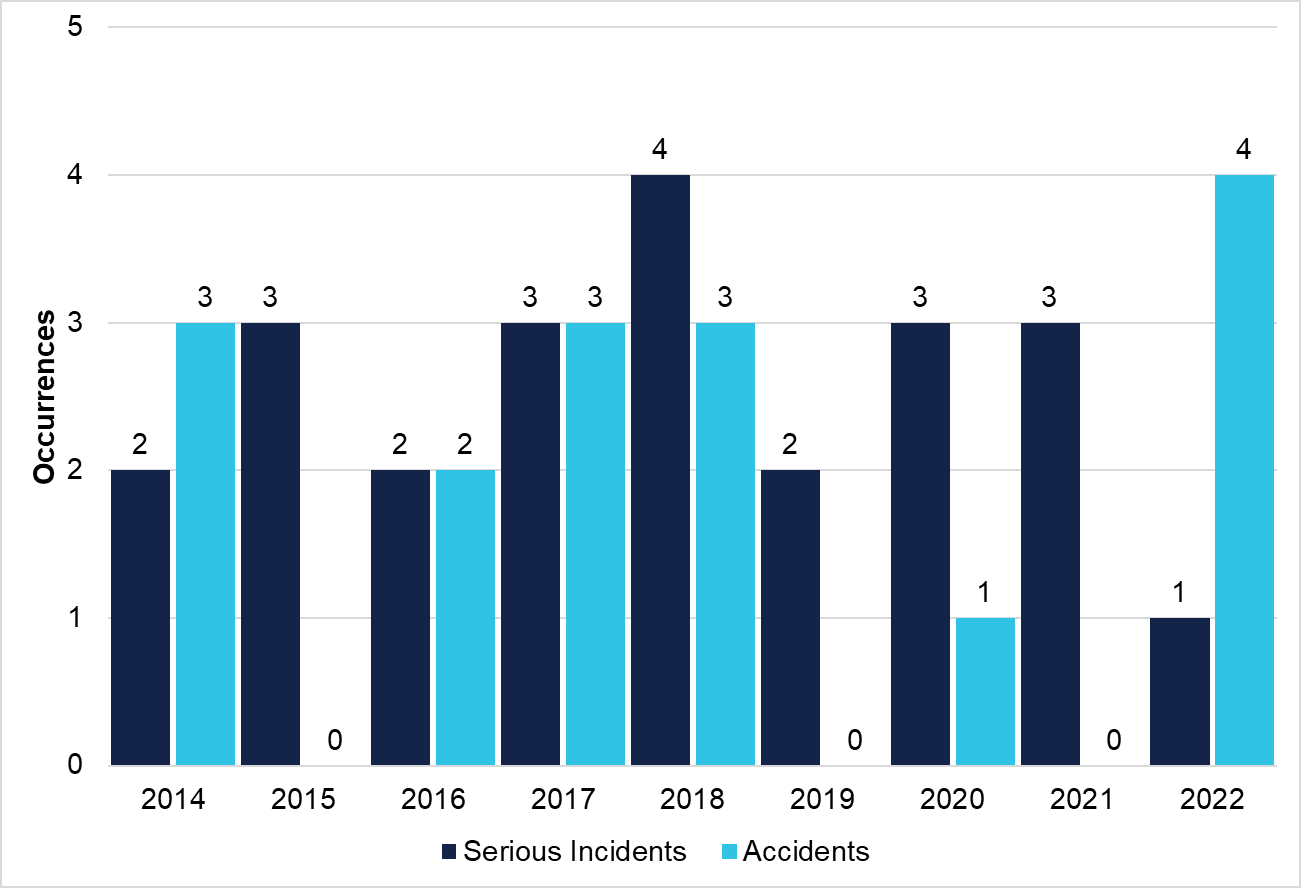
- 23 serious incidents and 15 accidents involving commercial balloons (Figure 7)
- 86 serious incidents and 50 accidents involving aeroplanes engaged in joyflights/sightseeing and passenger transport activities (Figure 8)
- 23 serious incidents and 16 accidents involving helicopters engaged in joyflights/sightseeing and passenger transport activities (Figure 9)
- 15 serious incidents and 12 accidents involving aeroplanes conducting joyflights/sightseeing activities (Figure 10)
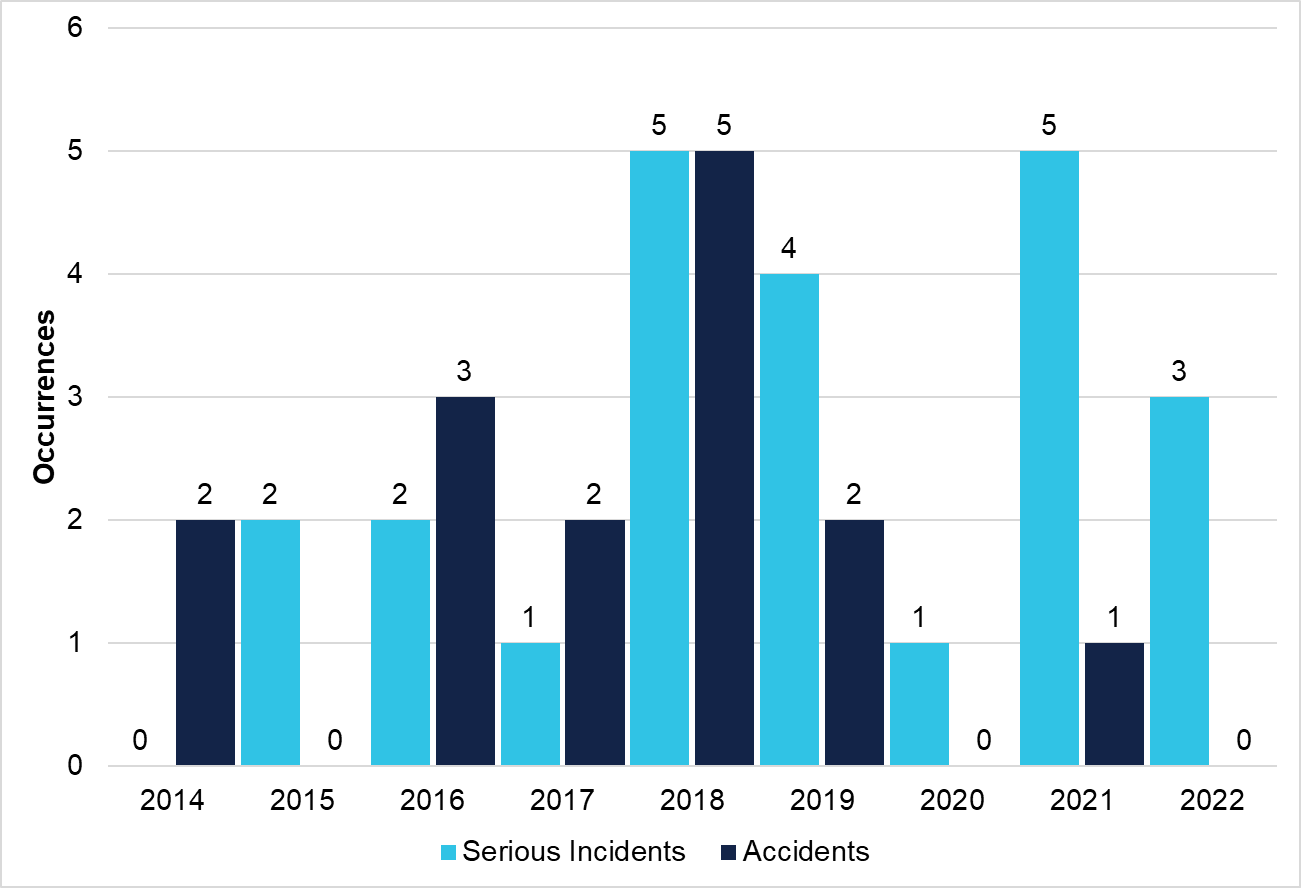
- 9 serious incidents and 4 accidents involving helicopters conducting joyflights/sightseeing activities (Figure 11).
Figure 7: Commercial ballooning serious incident and accidents per year (2014–2022)
Source: ATSB
Figure 8: Aeroplane joyflights/sightseeing and passenger transport serious incidents and accidents per year (2014–2022)
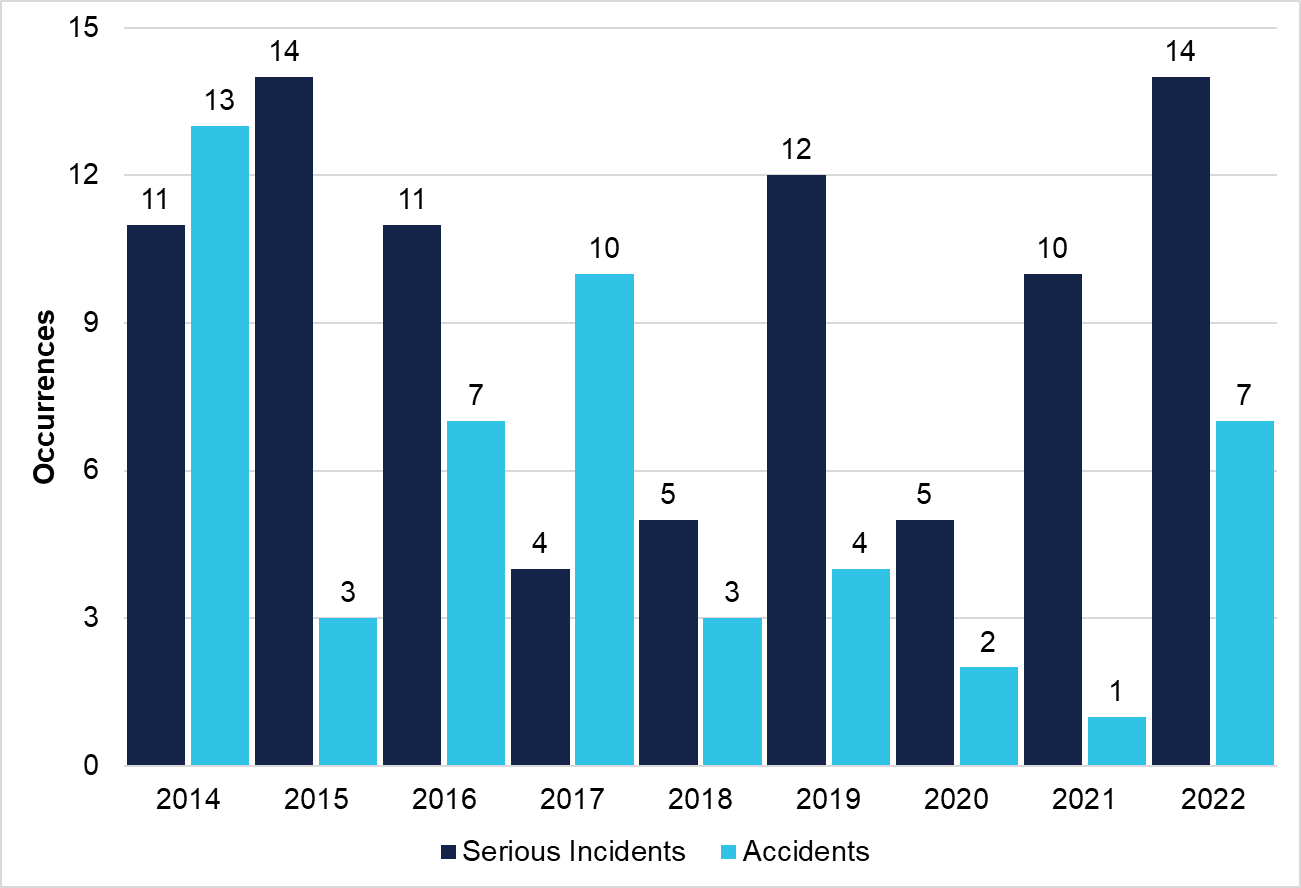
Source: ATSB
Figure 9: Helicopter joyflights/sightseeing and passenger transport serious incidents and accidents per year (2014–2022)
Source: ATSB
Figure 10: Aeroplane joyflights/sightseeing serious incidents and accidents per year (2014–2022)
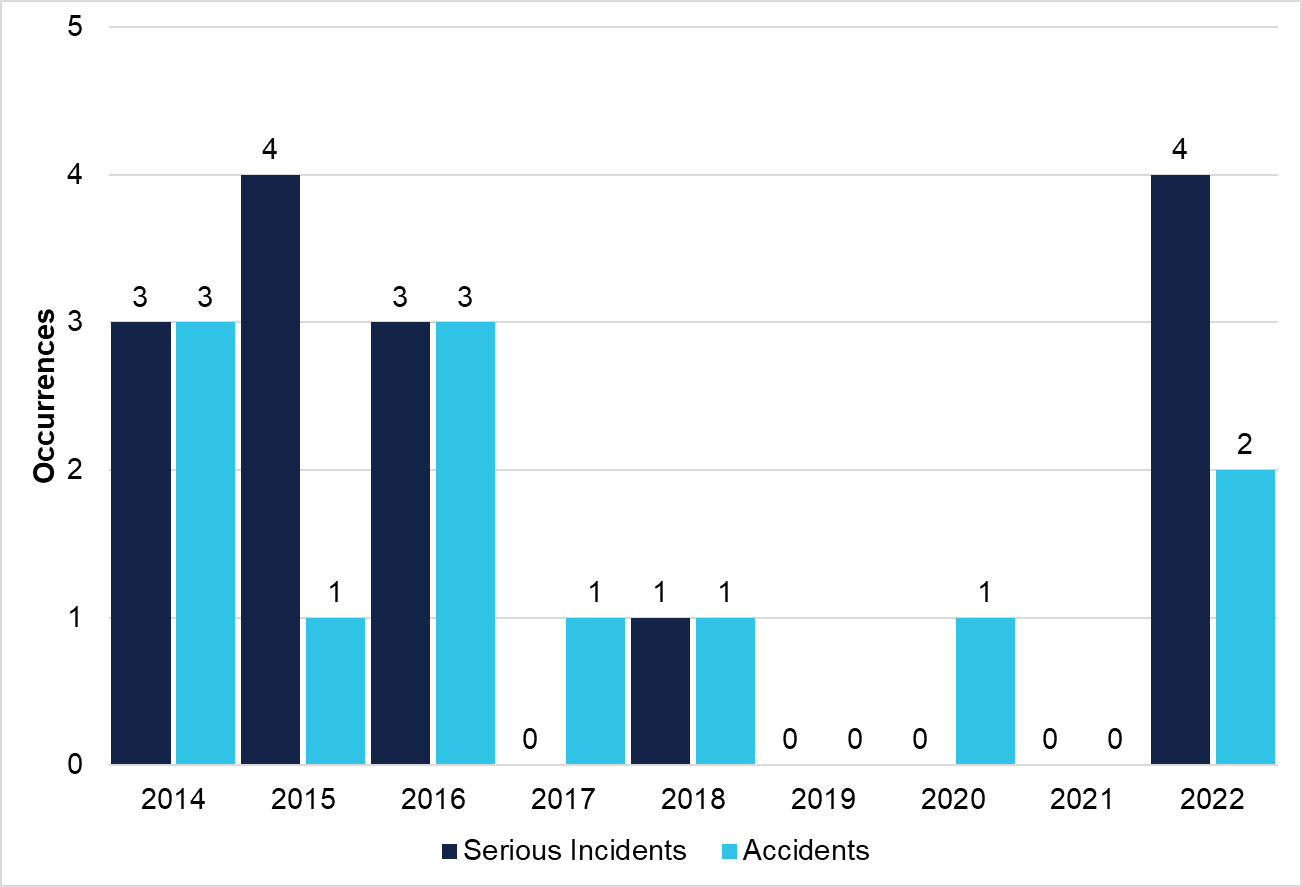
Source: ATSB
Figure 11: Helicopter joyflights/sightseeing serious incidents and accidents per year (2014–2022)
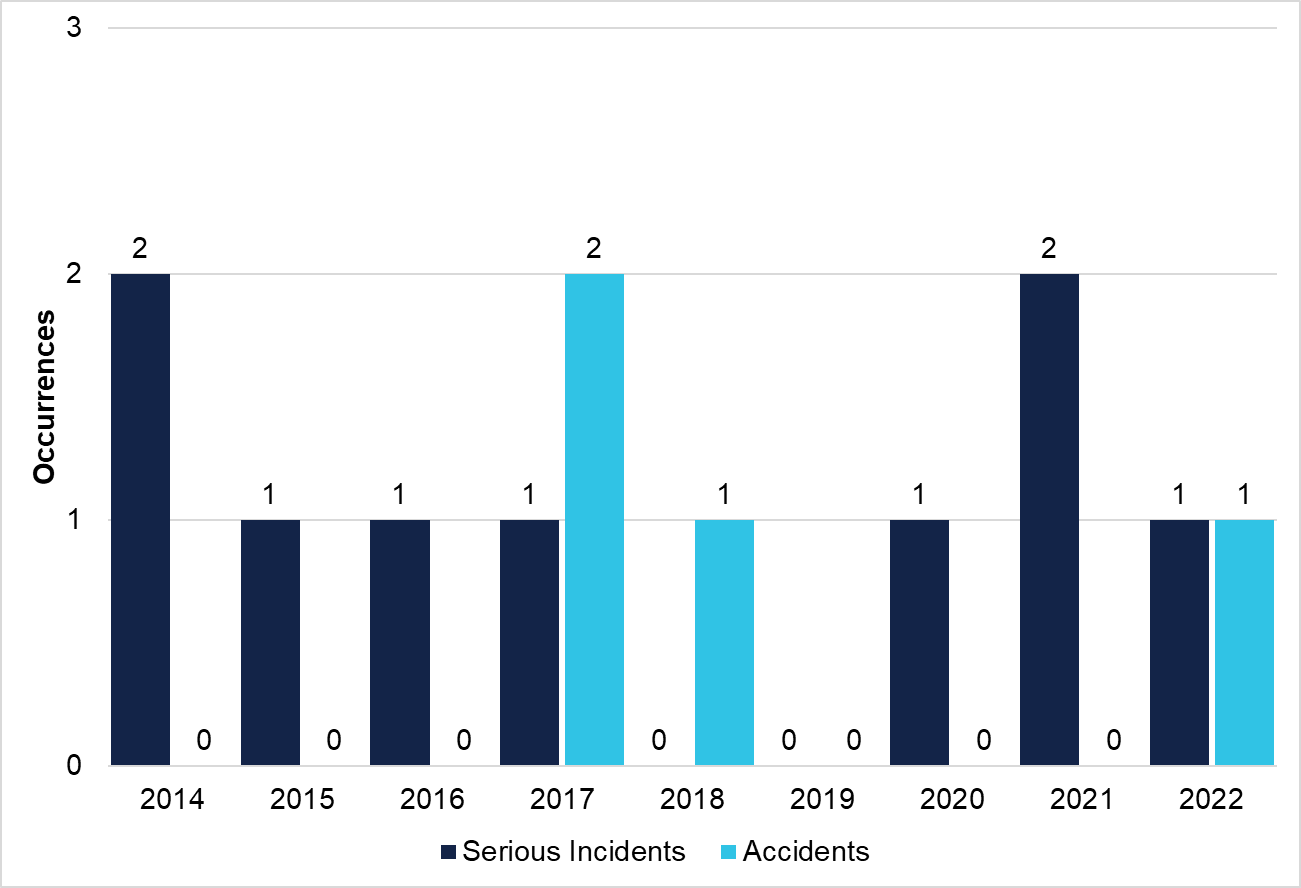
Source: ATSB
Serious incident and accident rate comparison
Comparison 2.1 – comparison between commercial ballooning and a joyflights/sightseeing and passenger transport activity in an aeroplane and helicopter
Commercial ballooning serious incident and accident rate
- 68,433 commercial balloon landings
- 23 serious incidents + 15 accidents = 38 total
- 55.5 serious incidents and accidents per 100,000 landings.
Commercial ballooning had 55.5 serious incidents or accidents per 100,000 landings.
Aeroplane joyflights/sightseeing and passenger transport serious incident or accident rate
- 2,190,607 landings
- 86 serious incidents and 50 accidents = 136 total
- 6.2 serious incidents and accidents per 100,000 landings.
Aeroplane joyflights/sightseeing and passenger transport had a serious incident or accident rate of 6.2 per 100,000 landings.
Helicopter joyflights/sightseeing and passenger transport serious incident or accident rate
- 1,795,332 landings
- 23 serious incidents and 16 accidents = 39 total
- 2.2 serious incidents and accidents per 100,000 landings.
Helicopter joyflights/sightseeing and passenger transport had a serious incident or accident rate of 2.2 per 100,000 landings.
ATSB finding A serious incident or accident was 8.9 times more likely to occur on a commercial balloon flight than a joyflights/sightseeing or passenger transport activity in an aeroplane and 25.6 times more likely than in a helicopter. |
Comparison 2.2 – comparison between commercial ballooning and a joyflights/sightseeing activity in an aeroplane and helicopter
Commercial ballooning serious incident or accident rate
Commercial ballooning had 55.5 serious incidents or accidents per 100,000 landings.
Aeroplane joyflights/sightseeing serious incident or accident rate
- 260,506 landings
- 15 serious incidents and 12 accidents = 27 total
- 10.4 serious incidents and accidents per 100,000 landings.
Aeroplane joyflights/sightseeing had a serious incident or accident rate of 10.4 per 100,000 landings.
Helicopter joyflights/sightseeing serious incident or accident rate
- 496,867 landings
- 9 serious incidents and 4 accidents = 13 total
- 2.6 serious incidents and accidents per 100,000 landings.
Helicopter joyflights/sightseeing had a serious incident or accident rate of 2.6 per 100,000 landings.
ATSB finding A serious incident or accident was 5.4 times more likely to occur on a commercial balloon flight than a joyflights/sightseeing activity in an aeroplane and 21.2 times more likely than a helicopter. |
Reported injuries
Analysis of injury data in the reported occurrences 2014–2022, found:
- no fatalities involving commercial balloon flights
- 24 fatalities involving aeroplane joyflights/sightseeing and passenger transport activities
- 8 fatalities involving helicopter joyflights/sightseeing and passenger transport activities
- 7 (of the 32) fatalities occurred in aeroplane and helicopter joyflights/sightseeing activities.
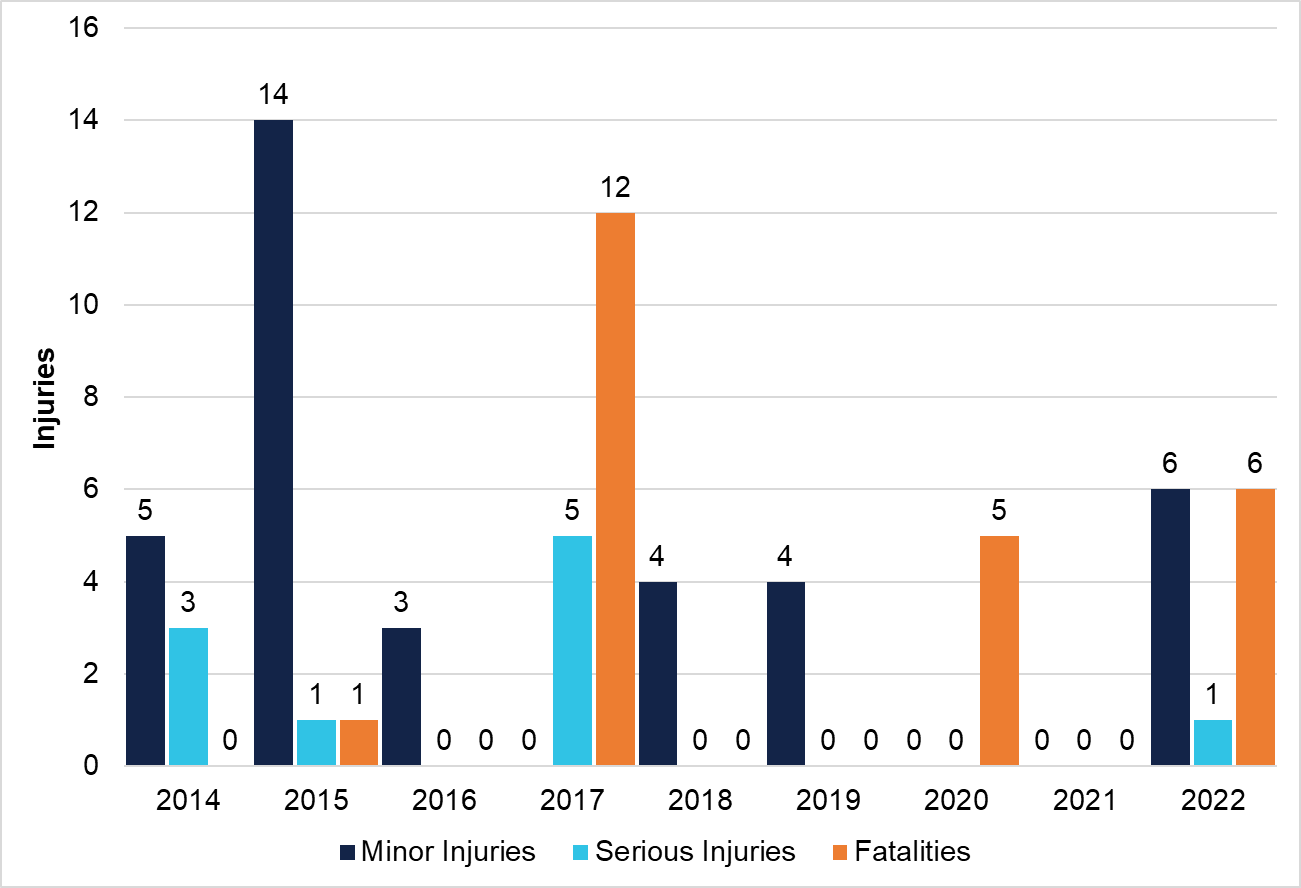
- 76 injuries (58 minor, 18 serious) involving commercial ballooning (Figure 12)
- 36 minor injuries and 10 serious injuries involving aeroplanes conducting joyflights/sightseeing and passenger transport activities combined (Figure 13)
- 17 minor injuries and 9 serious injuries involving helicopters conducting joyflights/sightseeing and passenger transport activities (Figure 14)
- 12 minor injuries and 2 serious injuries involving aeroplanes conducting joyflights/sightseeing activities (Figure 15)
- 3 minor injuries and 5 serious injuries involving helicopters conducting joyflights/sightseeing activities (Figure 16).
Figure 12: Reported commercial ballooning injuries per year (2014–2022)
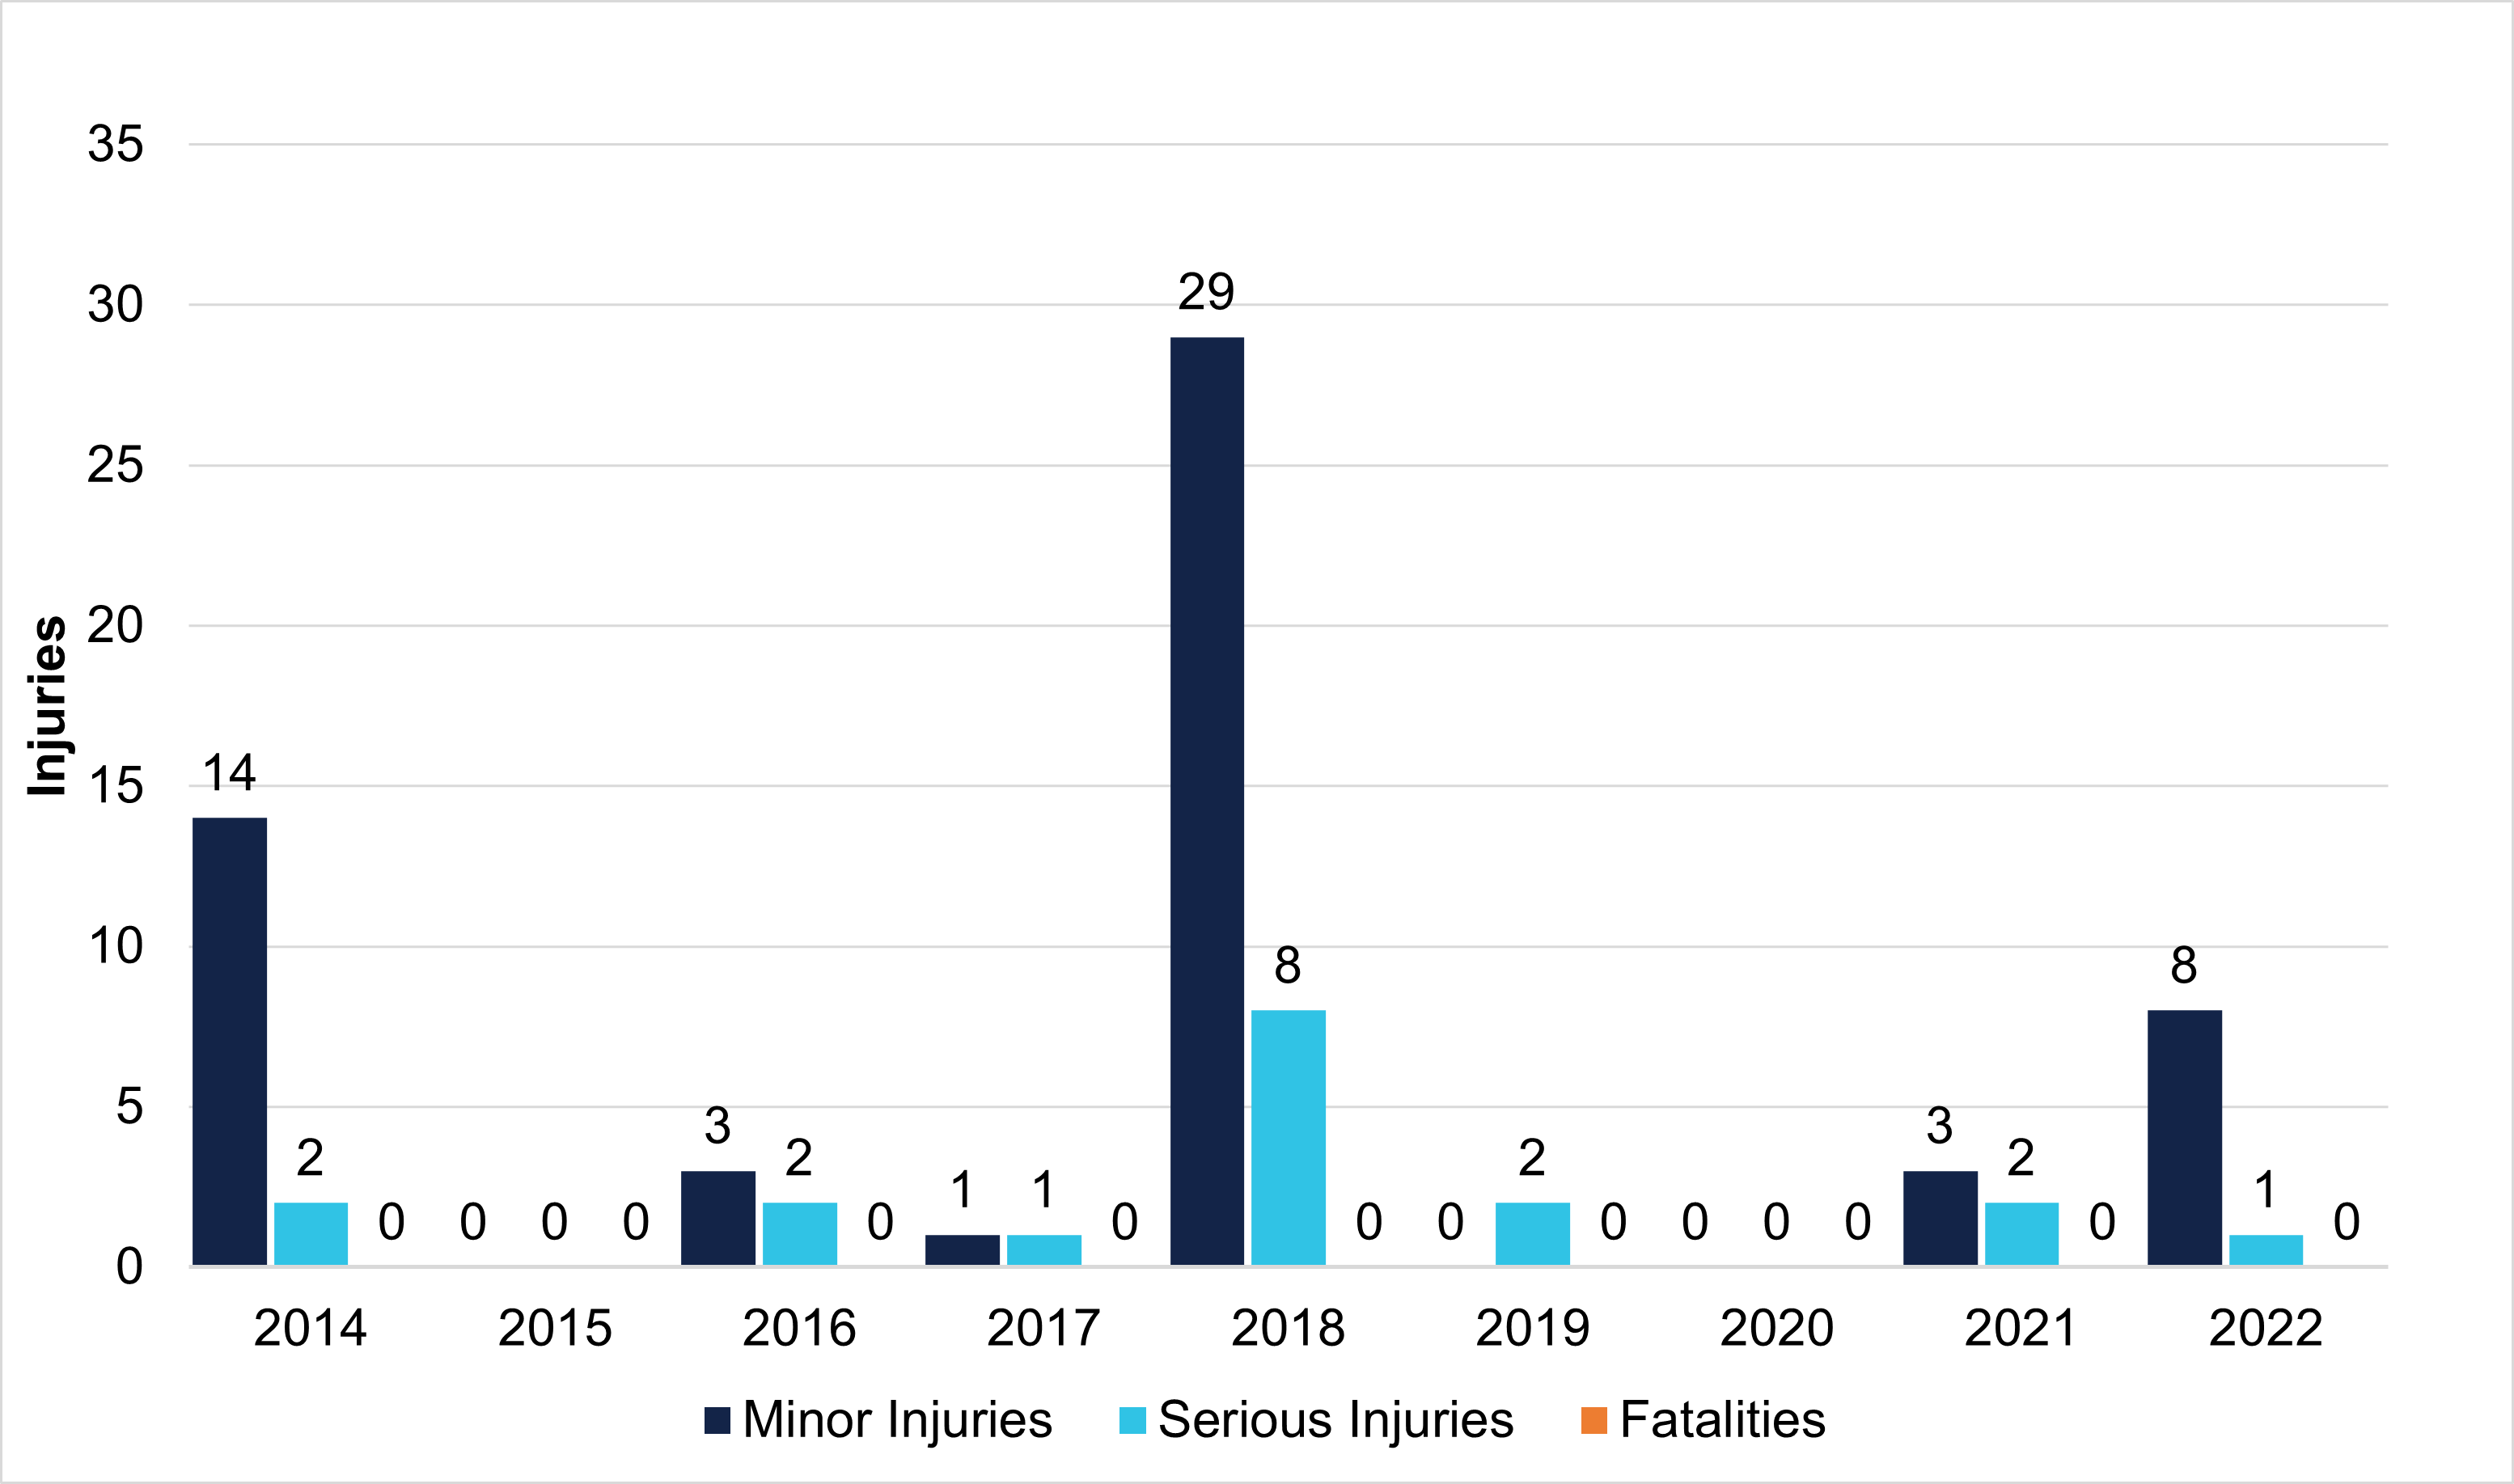
Source: ATSB
Figure 13: Reported aeroplane joyflights/sightseeing and passenger transport injuries per year (2014–2022)
Source: ATSB
Figure 14: Reported helicopter joyflights/sightseeing and passenger transport injuries per year (2014–2022)
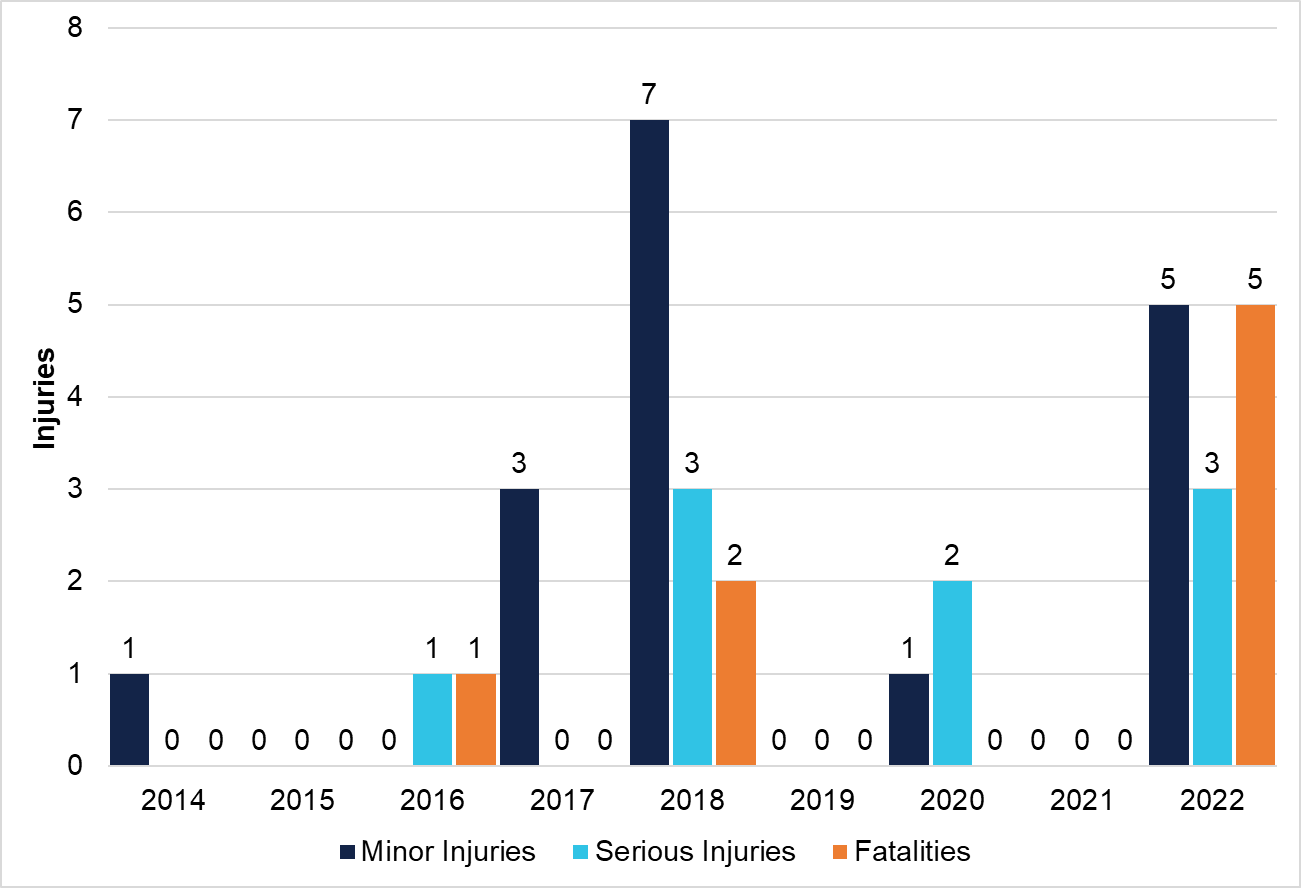
Source: ATSB
Figure 15: Reported aeroplane joyflights/sightseeing injuries per year (2014–2022)
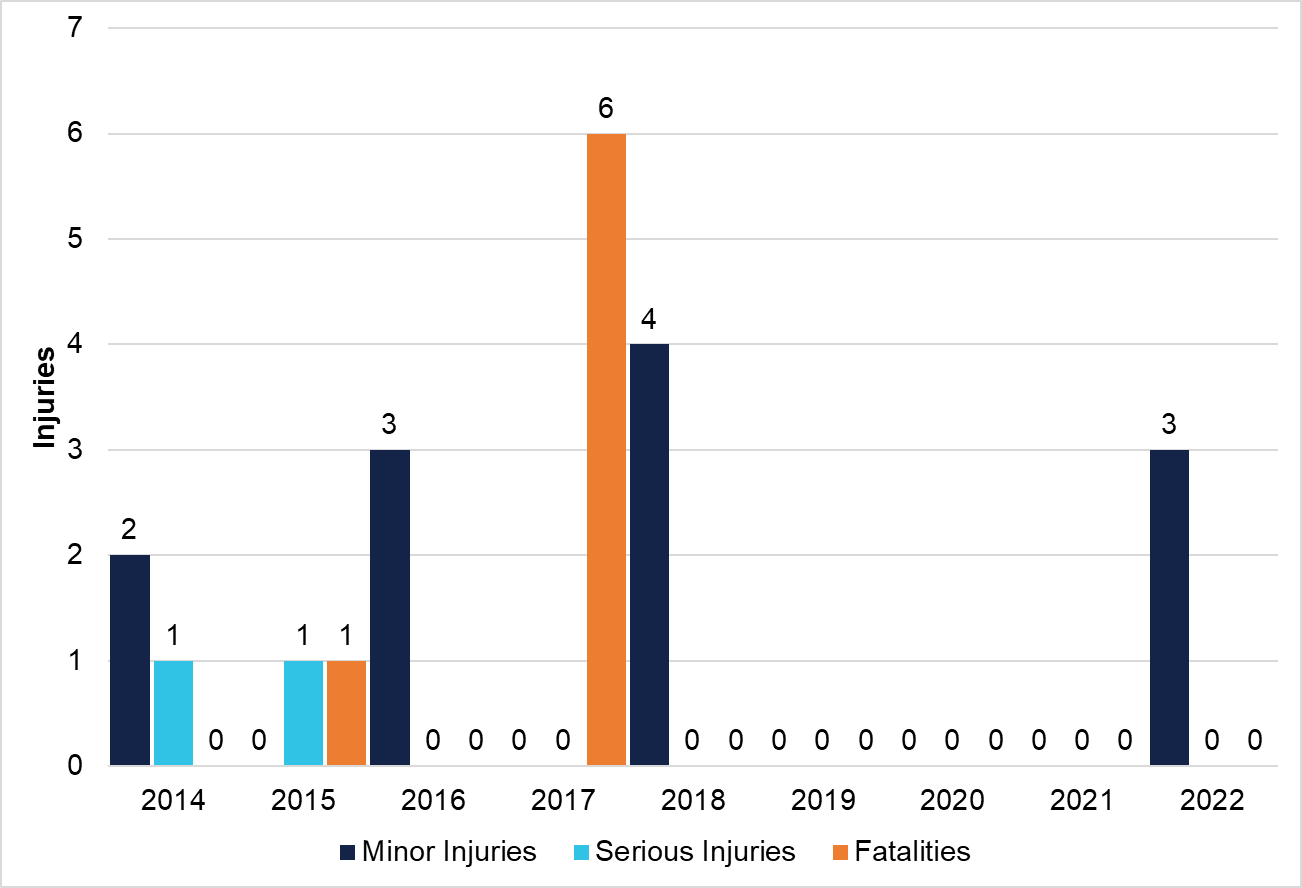
Source: ATSB
Figure 16: Reported helicopter joyflights/sightseeing injuries per year (2014–2022)
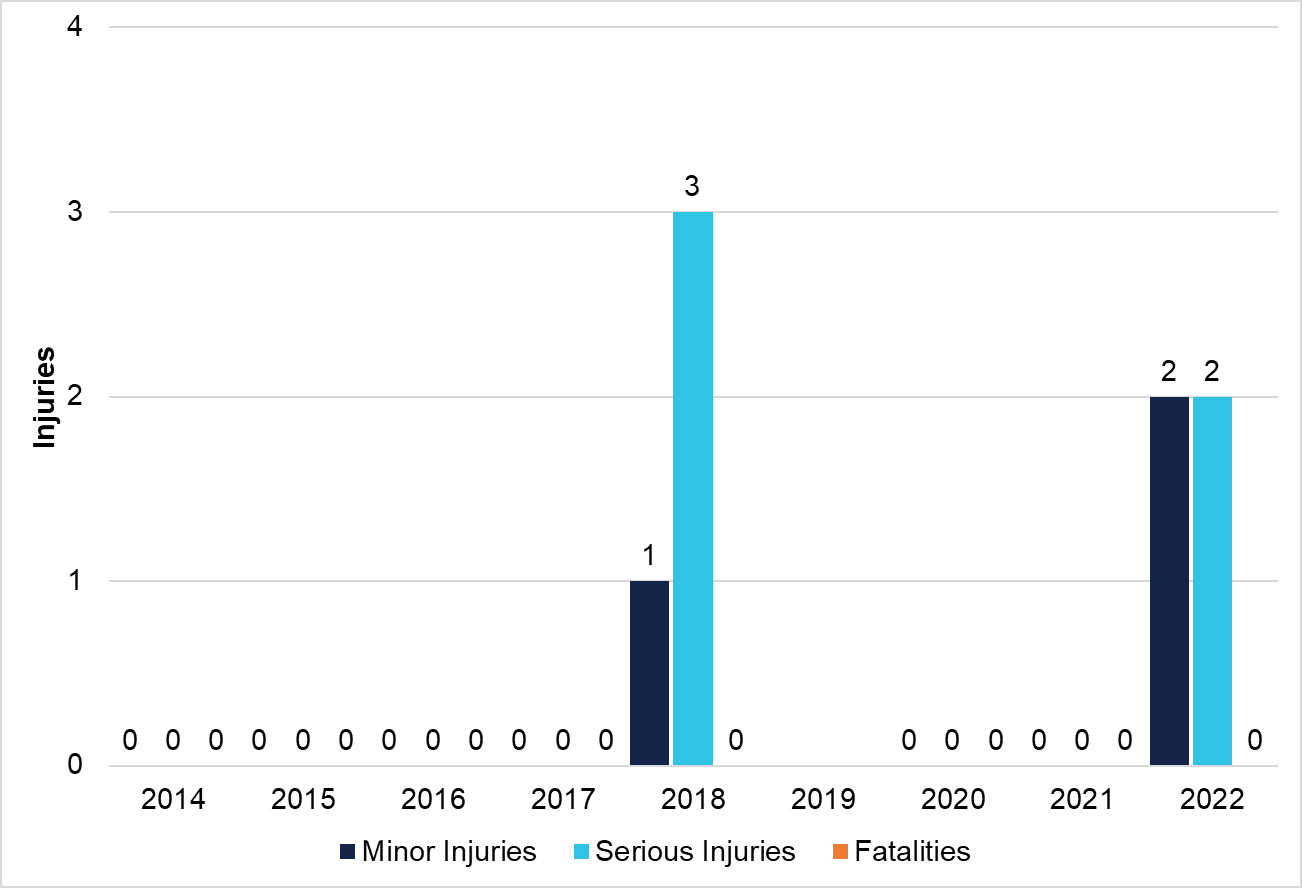
Source: ATSB
Injury rate comparison
Comparison 3.1 – comparison between commercial ballooning and joyflights/sightseeing and passenger transport activity in an aeroplane and helicopter
Commercial ballooning total injury rate
- 68,433 landings
- 76 total injuries (no fatalities)
- 111.1 injuries per 100,000 landings.
Commercial ballooning had an injury rate of 111.1 injuries per 100,000 landings.
Aeroplane joyflights/sightseeing and passenger transport total injury rate
- 2,190,607 landings
- 70 total injuries including fatalities
- 3.2 injuries per 100,000 landings.
Aeroplane joyflights/sightseeing and passenger transport had an injury rate of 3.2 injuries per 100,000 landings.
Helicopter joyflights/sightseeing and passenger transport total injury rate
- 1,795,332 landings
- 34 total injuries including fatalities
- 1.9 per 100,000 landings.
Helicopter joyflights/sightseeing and passenger transport had an injury rate of 1.9 injuries per 100,000 landings.
ATSB finding A person was 34.7 times more likely to sustain an injury on a commercial balloon flight than in an aeroplane on a joyflights/sightseeing and passenger transport charter activity and 58.5 times more likely than in a helicopter. |
Comparison 3.2 – comparison between commercial ballooning and a joyflights/sightseeing activity in an aeroplane and helicopter
Commercial ballooning total injury rate
For the period 2014–2022, the commercial ballooning injury rate was 111.1 injuries per 100,000 landings.
Aeroplane joyflights/sightseeing total injury rate
- 260,506 landings
- 21 total injuries including fatalities
- 8.1 per 100,000 landings.
Aeroplane joyflights/sightseeing had an injury rate of 8.1 injuries per 100,000 landings.
Helicopter joyflights/sightseeing total injury rate
- 496,867 landings
- 8 total injuries (no fatalities recorded)
- 1.6 per 100,000 landings.
Helicopter joyflights/sightseeing had an injury rate of 1.6 injuries per 100,000 landings.
ATSB finding A person was 13.7 times more likely to sustain an injury on a commercial balloon flight than a joyflights/sightseeing activity in an aeroplane and 69.4 times more likely than in a helicopter. |
Serious injury rate comparison
Comparison 4.1 – comparison between commercial ballooning and a joyflights/sightseeing and passenger transport activity in an aeroplane and helicopter
Commercial ballooning serious injury rate
- 68,433 balloon landings
- 18 serious injuries
- 26.3 serious injuries per 100,000 landings.
Commercial ballooning had a serious injury rate of 26.3 injuries per 100,000 landings.
Aeroplane joyflights/sightseeing and passenger transport serious injury rate
- 2,190,607 landings
- 10 serious injuries
- 0.5 serious injuries per 100,000 landings.
Aeroplane joyflights/sightseeing and passenger transport had a serious injury rate of 0.5 injuries per 100,000 landings.
Helicopter joyflights/sightseeing and passenger transport serious injury rate
- 1,795,332 landings
- 9 serious injuries
- 0.5 serious injuries per 100,000 landings.
Helicopter joyflights/sightseeing and passenger transport had a serious injury rate of 0.5 injuries per 100,000 landings.
ATSB finding A person was 57.2 times more likely to sustain a serious injury on a commercial balloon flight than a joyflights/sightseeing and passenger transport charter activity in an aeroplane and 52.6 times more likely than in a helicopter. |
Comparison 4.2 – comparison between commercial ballooning and a joyflights/sightseeing activity in aeroplane and helicopter
Commercial ballooning serious injury rate
For the period 2014–2022, the commercial ballooning serious injury rate was 26.3 serious injuries per 100,000 landings.
Aeroplane joyflights/sightseeing serious injury rate
- 260,506 landings
- 2 serious injuries
- 0.8 serious injuries per 100,000 landings.
Aeroplane joyflights/sightseeing had a serious injury rate of 0.8 injuries per 100,000 landings.
Helicopter joyflights/sightseeing serious injury rate
- 496,867 landings
- 5 serious injuries
- 1.0 per 100,000 landings.
Helicopter joyflights/sightseeing had a serious injury rate of 1.0 injuries per 100,000 landings.
ATSB finding A person was 34.2 times more likely to sustain a serious injury on a commercial balloon flight than a joyflights/sightseeing activity in an aeroplane and 26.0 times more likely than in a helicopter. |
Occurrence categories
Commercial ballooning occurrence categories
Figure 17 shows the occurrence rate per most common commercial ballooning occurrence categories for the period 2014–2022.[2] Collision with terrain was the most common with 38.0 occurrences per 100,000 flights, followed by hard landings (16.1), cabin injuries (13.2) and wirestrikes (13.2).
Figure 17: Commercial ballooning occurrence rate per most common occurrence categories (2014–2022)
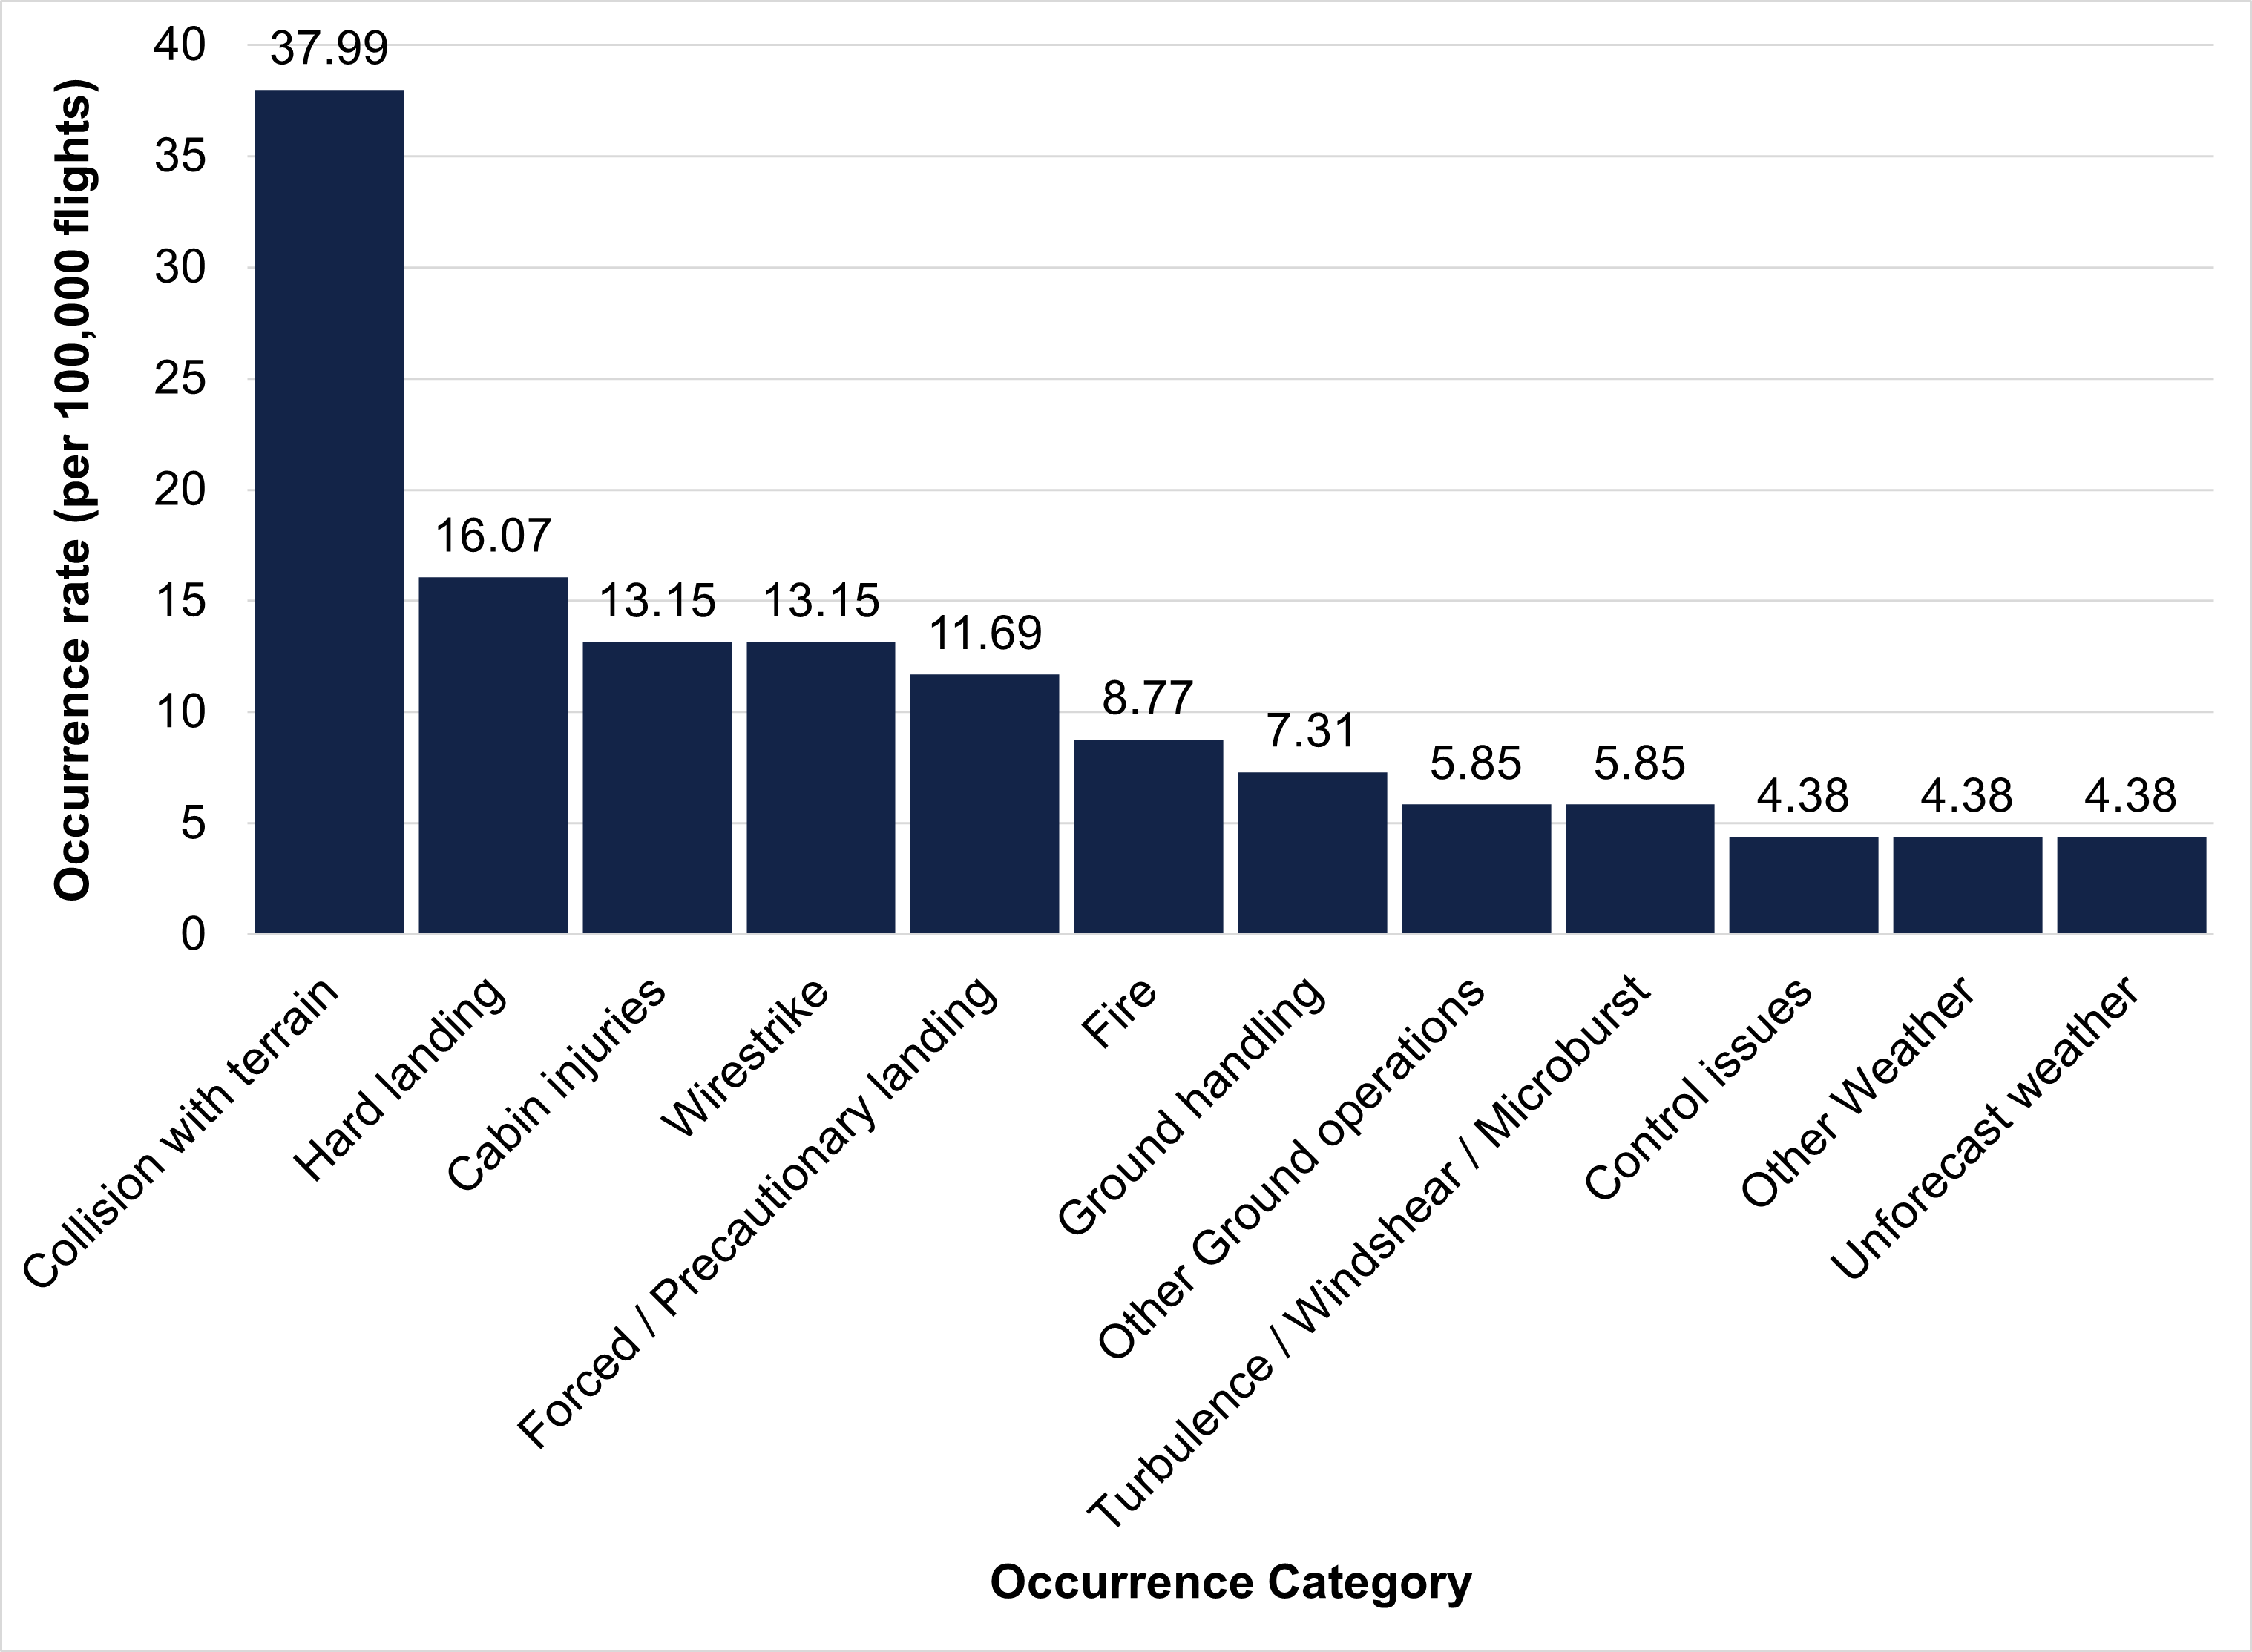
Source: BITRE and ATSB
Aeroplane and helicopter occurrence categories
The most common aeroplane and helicopter occurrence categories for joyflights/sightseeing and passenger transport combined are displayed in Figure 18 and Figure 19 respectively. Aeroplane occurrences involving a birdstrike had a rate of 16.3 occurrences per 100,000 flights, this was followed by diversion/returns (16.0), and a landing gear/indication (12.6). An engine failure or malfunction had an occurrence rate of 6.3 per 100,000 flights. Helicopters’ most common occurrence category was diversion/returns at 9.0 per 100,000 flights, followed by warning devices (5.8) and birdstrikes (5.2).
Figure 18: Aeroplane joyflights/sightseeing and passenger transport occurrence rate per most common occurrence categories (2014–2022)
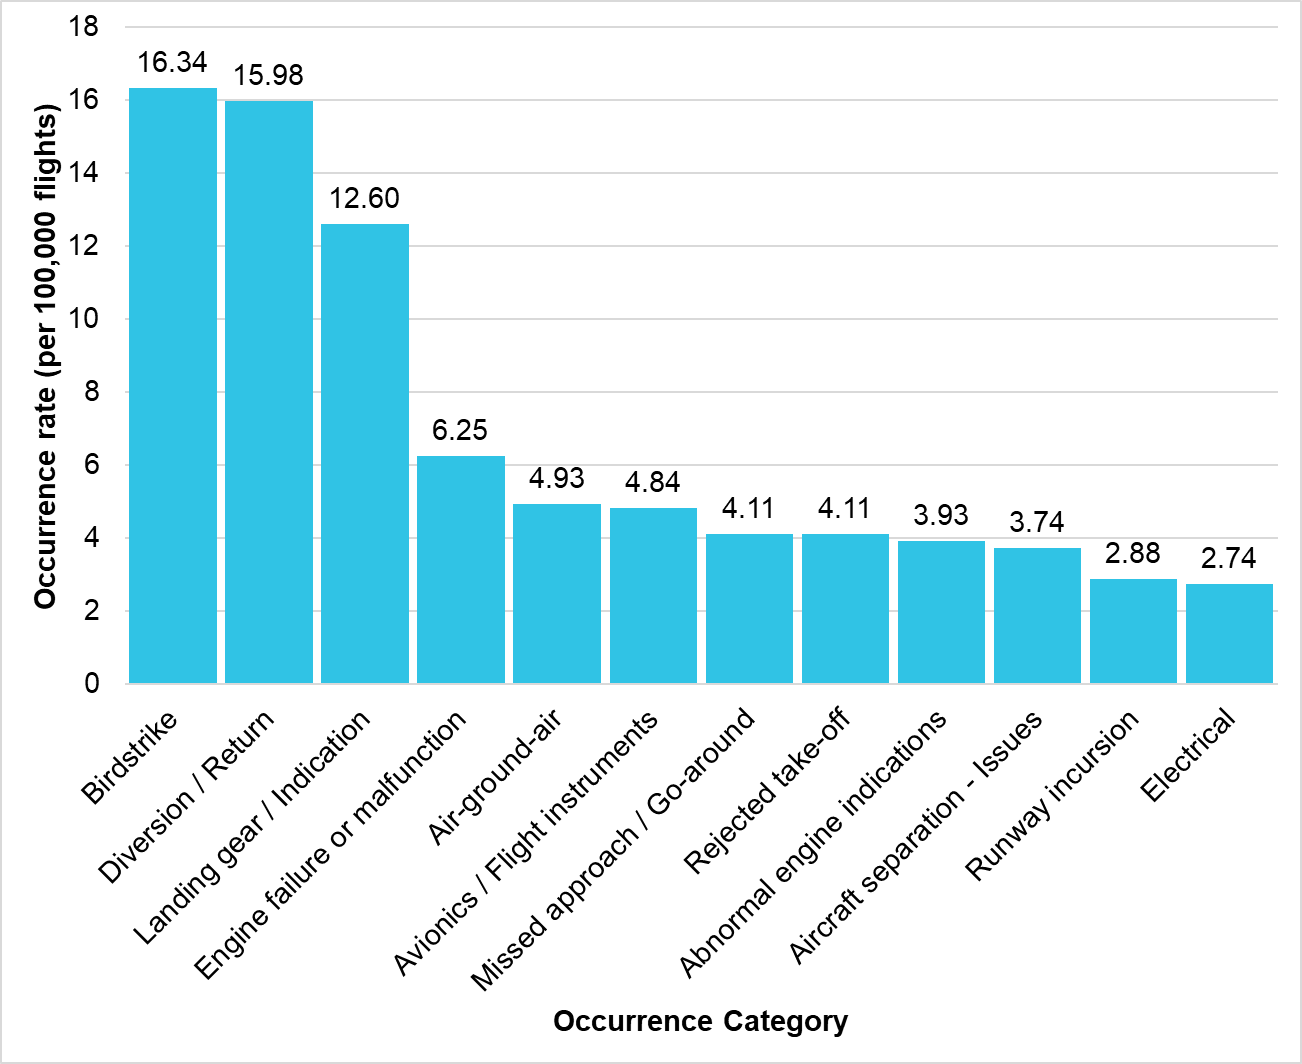
Source: BITRE and ATSB
Figure 19: Helicopter joyflights/sightseeing and passenger transport occurrence rate per most common occurrence categories (2014–2022)
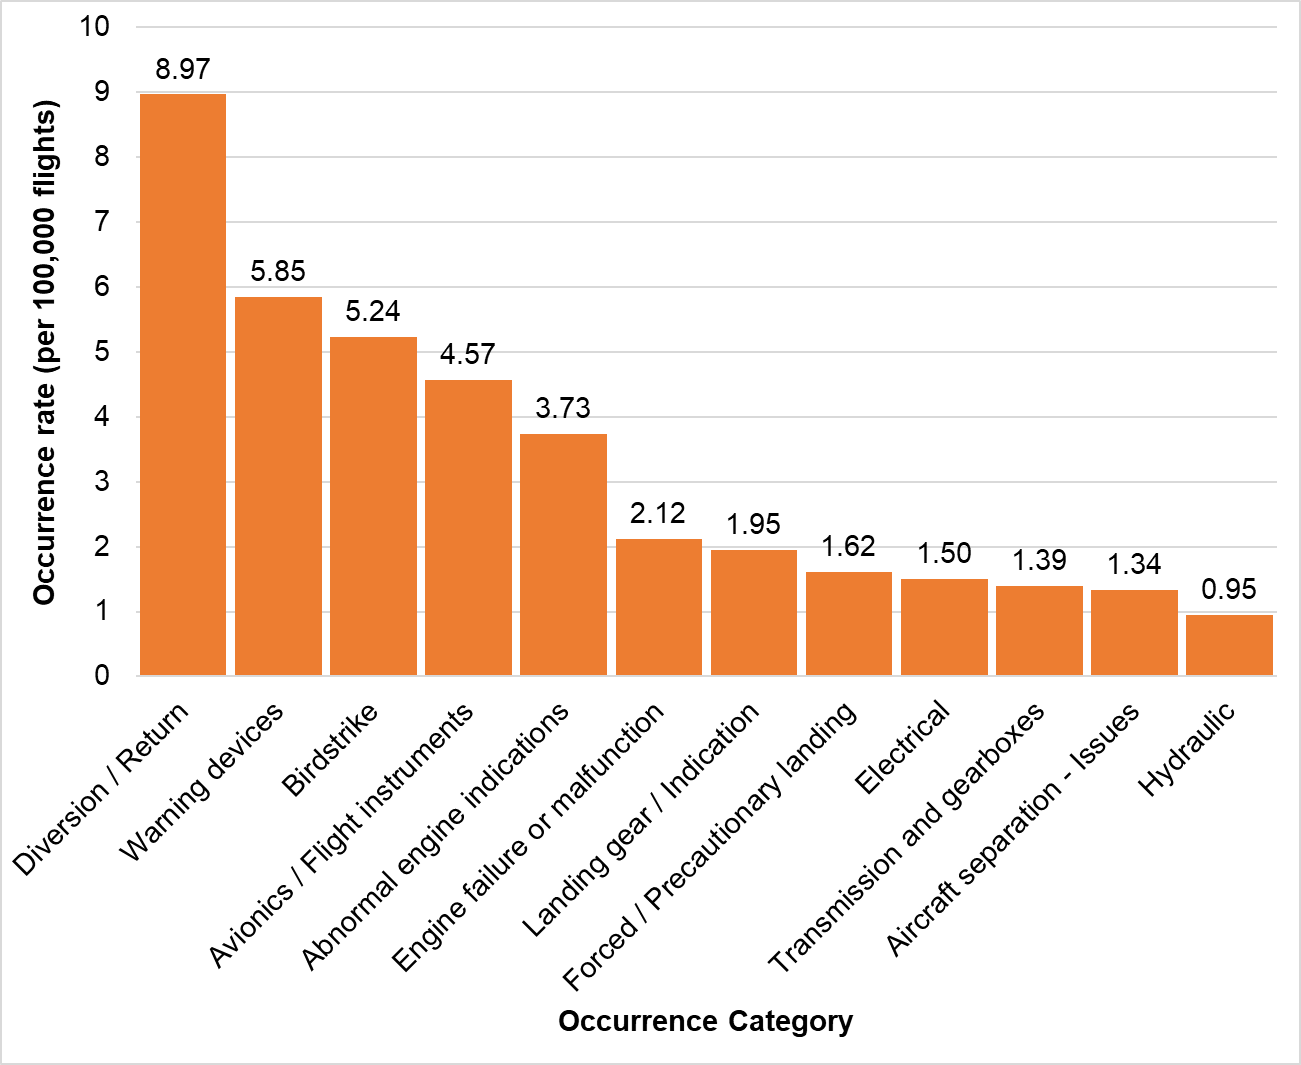
Source: BITRE and ATSB
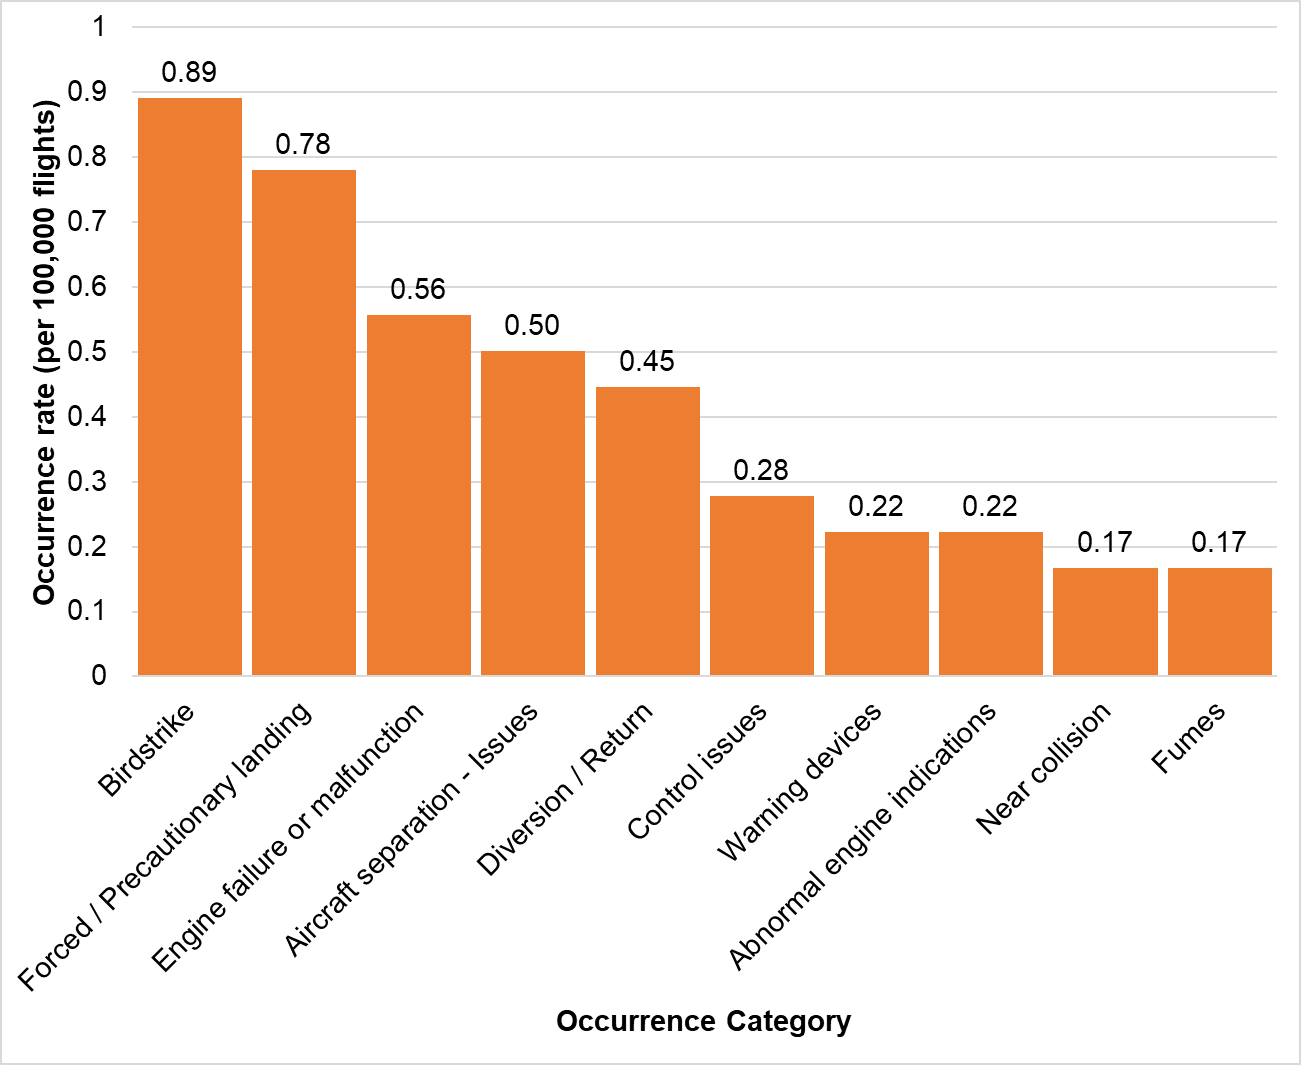
Figure 20 and Figure 21 display the most common aeroplane and helicopter occurrence categorisations for joyflights/sightseeing only. Aircraft separation was the most common category with 0.7 per 100,000 flights, followed by engine failure or malfunction (0.6) and air-ground-air (communications) at 0.6. Helicopters’ most common occurrence category was a birdstrike at 0.9 per 100,000 flights, followed by forced/precautionary landing (0.8) and engine failure or malfunction (0.6).
Figure 20: Aeroplane joyflights/sightseeing occurrence rate per most common occurrence categories (2014–2022)
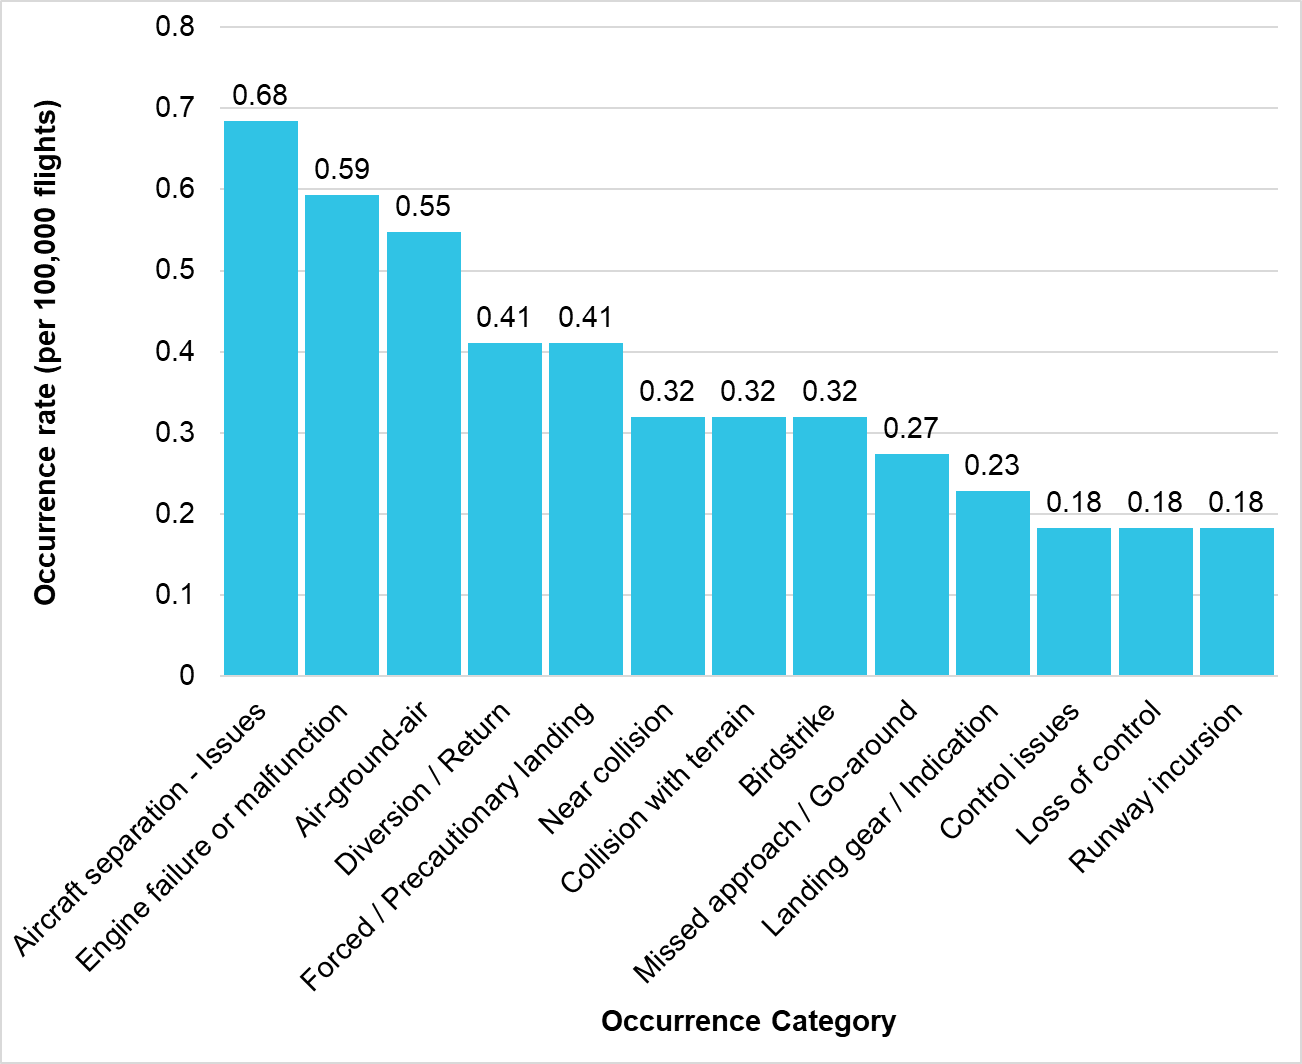
Source: BITRE and ATSB
Figure 21: Helicopter joyflights/sightseeing occurrence rate per most common occurrence categories (2014–2022)
Source: BITRE and ATSB
Commercial ballooning occurrences
Flight phase analysis
The following analysis of the 79 balloon occurrences identified the phases of flight in which:
- the occurrences happened
- the serious incidents and accidents occurred
- people sustained injuries.
Additionally, the occurrence categories and the key safety factors that contributed to, or increased the risk of, an occurrence were extracted from the ATSB occurrence database and analysed.
Occurrence phases of flight
For the period 2014–2022, Figure 22 shows the number of occurrences per phase of flight for the 79 commercial ballooning occurrences reported to the ATSB. The majority (43 of 79, or 54%) occurred in the landing phase and a further 19% occurred during the approach phase, equalling a combined 73%.
Figure 22: Commercial ballooning occurrences per phase of flight (2014–2022)
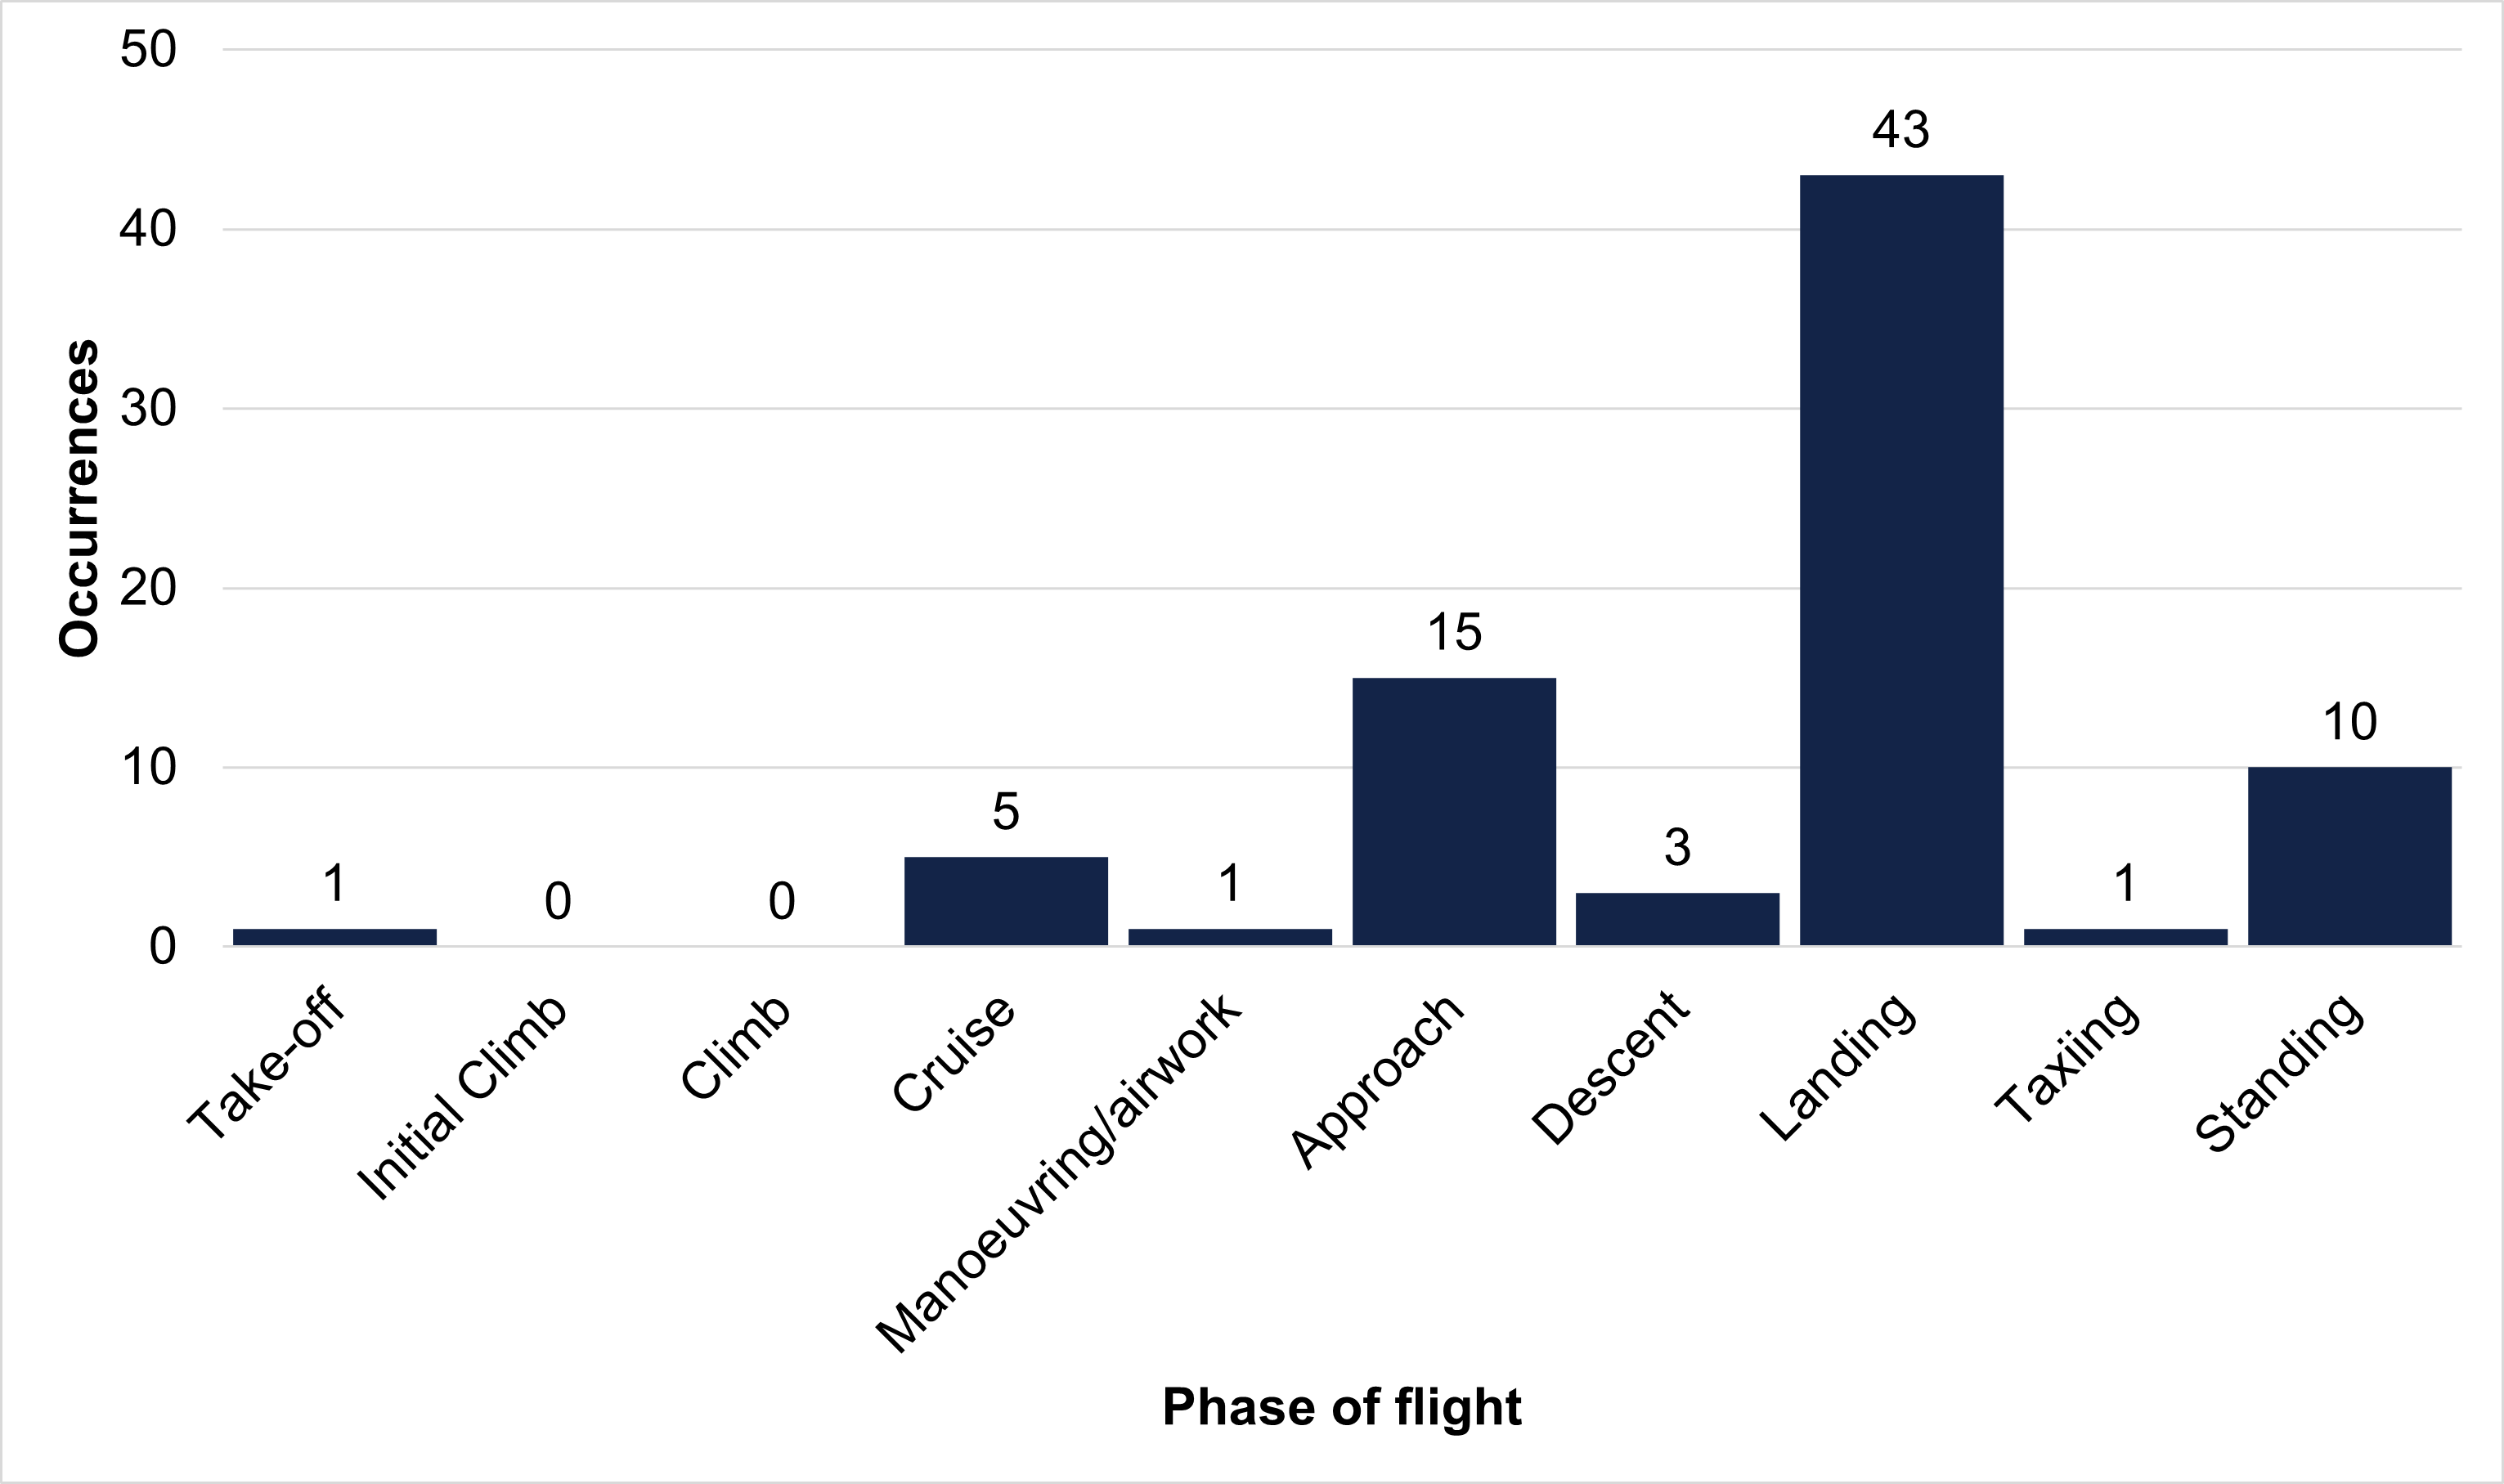
Source: ATSB
ATSB finding A commercial ballooning reported occurrence was more likely to occur during landing than any other flight phase. |
Phases of flight of serious incidents and accidents
The reported occurrence data 2014–2022 inclusive identified 23 serious incidents and 15 accidents involving commercial ballooning. Figure 23 shows a breakdown of these serious incidents and accidents with respect to phase of flight.
Figure 23: Commercial ballooning serious incidents and accidents per phase of flight (2014–2022)
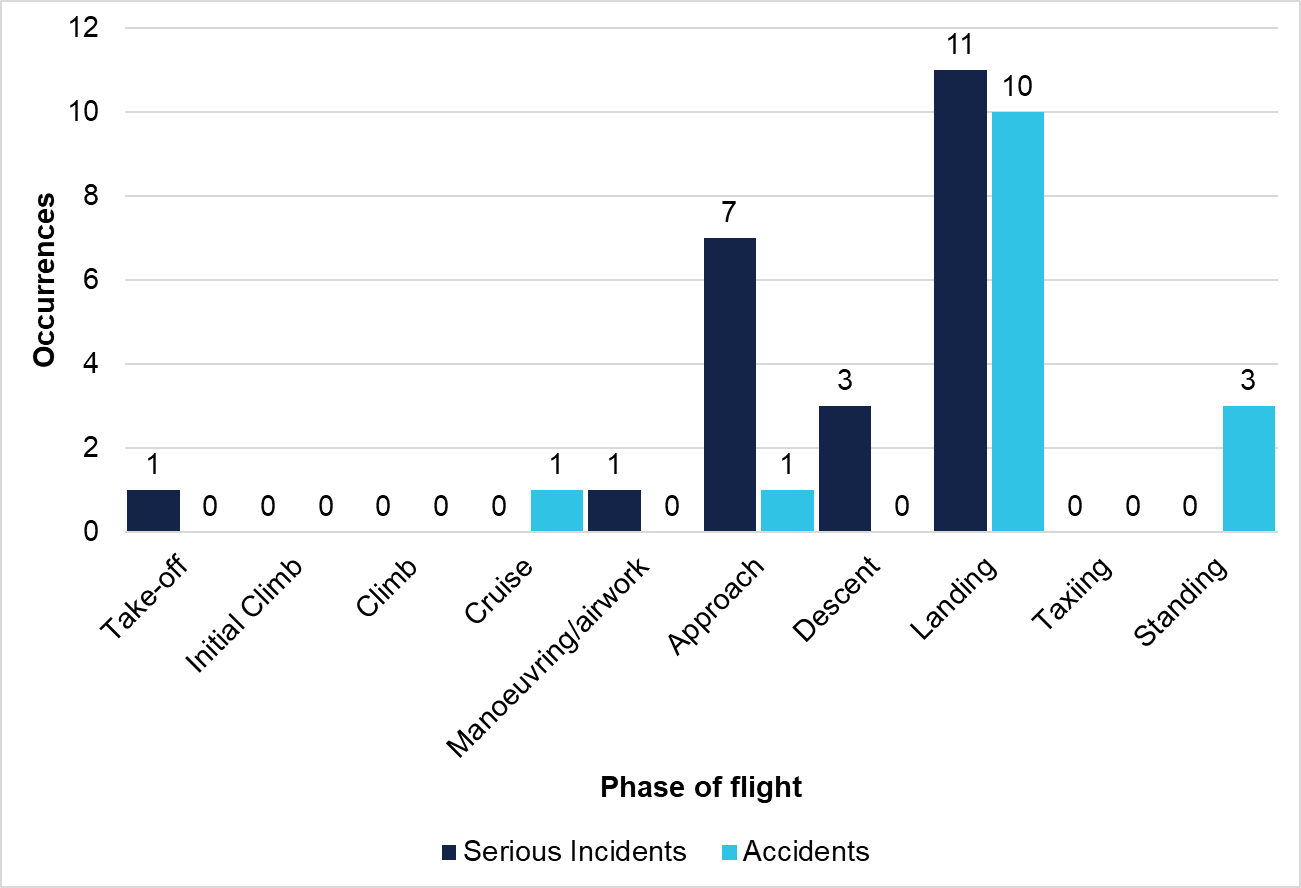
Source: ATSB
Proportionally:
- 11 out of 23 (48%) serious incidents occurred during the landing phase
- 7 out of 23 (30%) serious incidents occurred during the approach phase
- 10 out of 15 (67%) accidents occurred during the landing phase
- 1 out of 15 (7%) accidents occurred during the approach phase.
ATSB finding A commercial ballooning serious incident or accident was more likely to occur during landing than any other flight phase. |
Injuries sustained in each phase of flight
For the period 2014–2022, the ATSB occurrence database recorded 58 minor injuries, and 18 serious injuries sustained in commercial ballooning. Figure 24 shows the number of minor and serious injuries sustained in each phase of flight with phases that recorded no injuries omitted.
Figure 24: Commercial ballooning injuries by phase of flight (2014–2022)
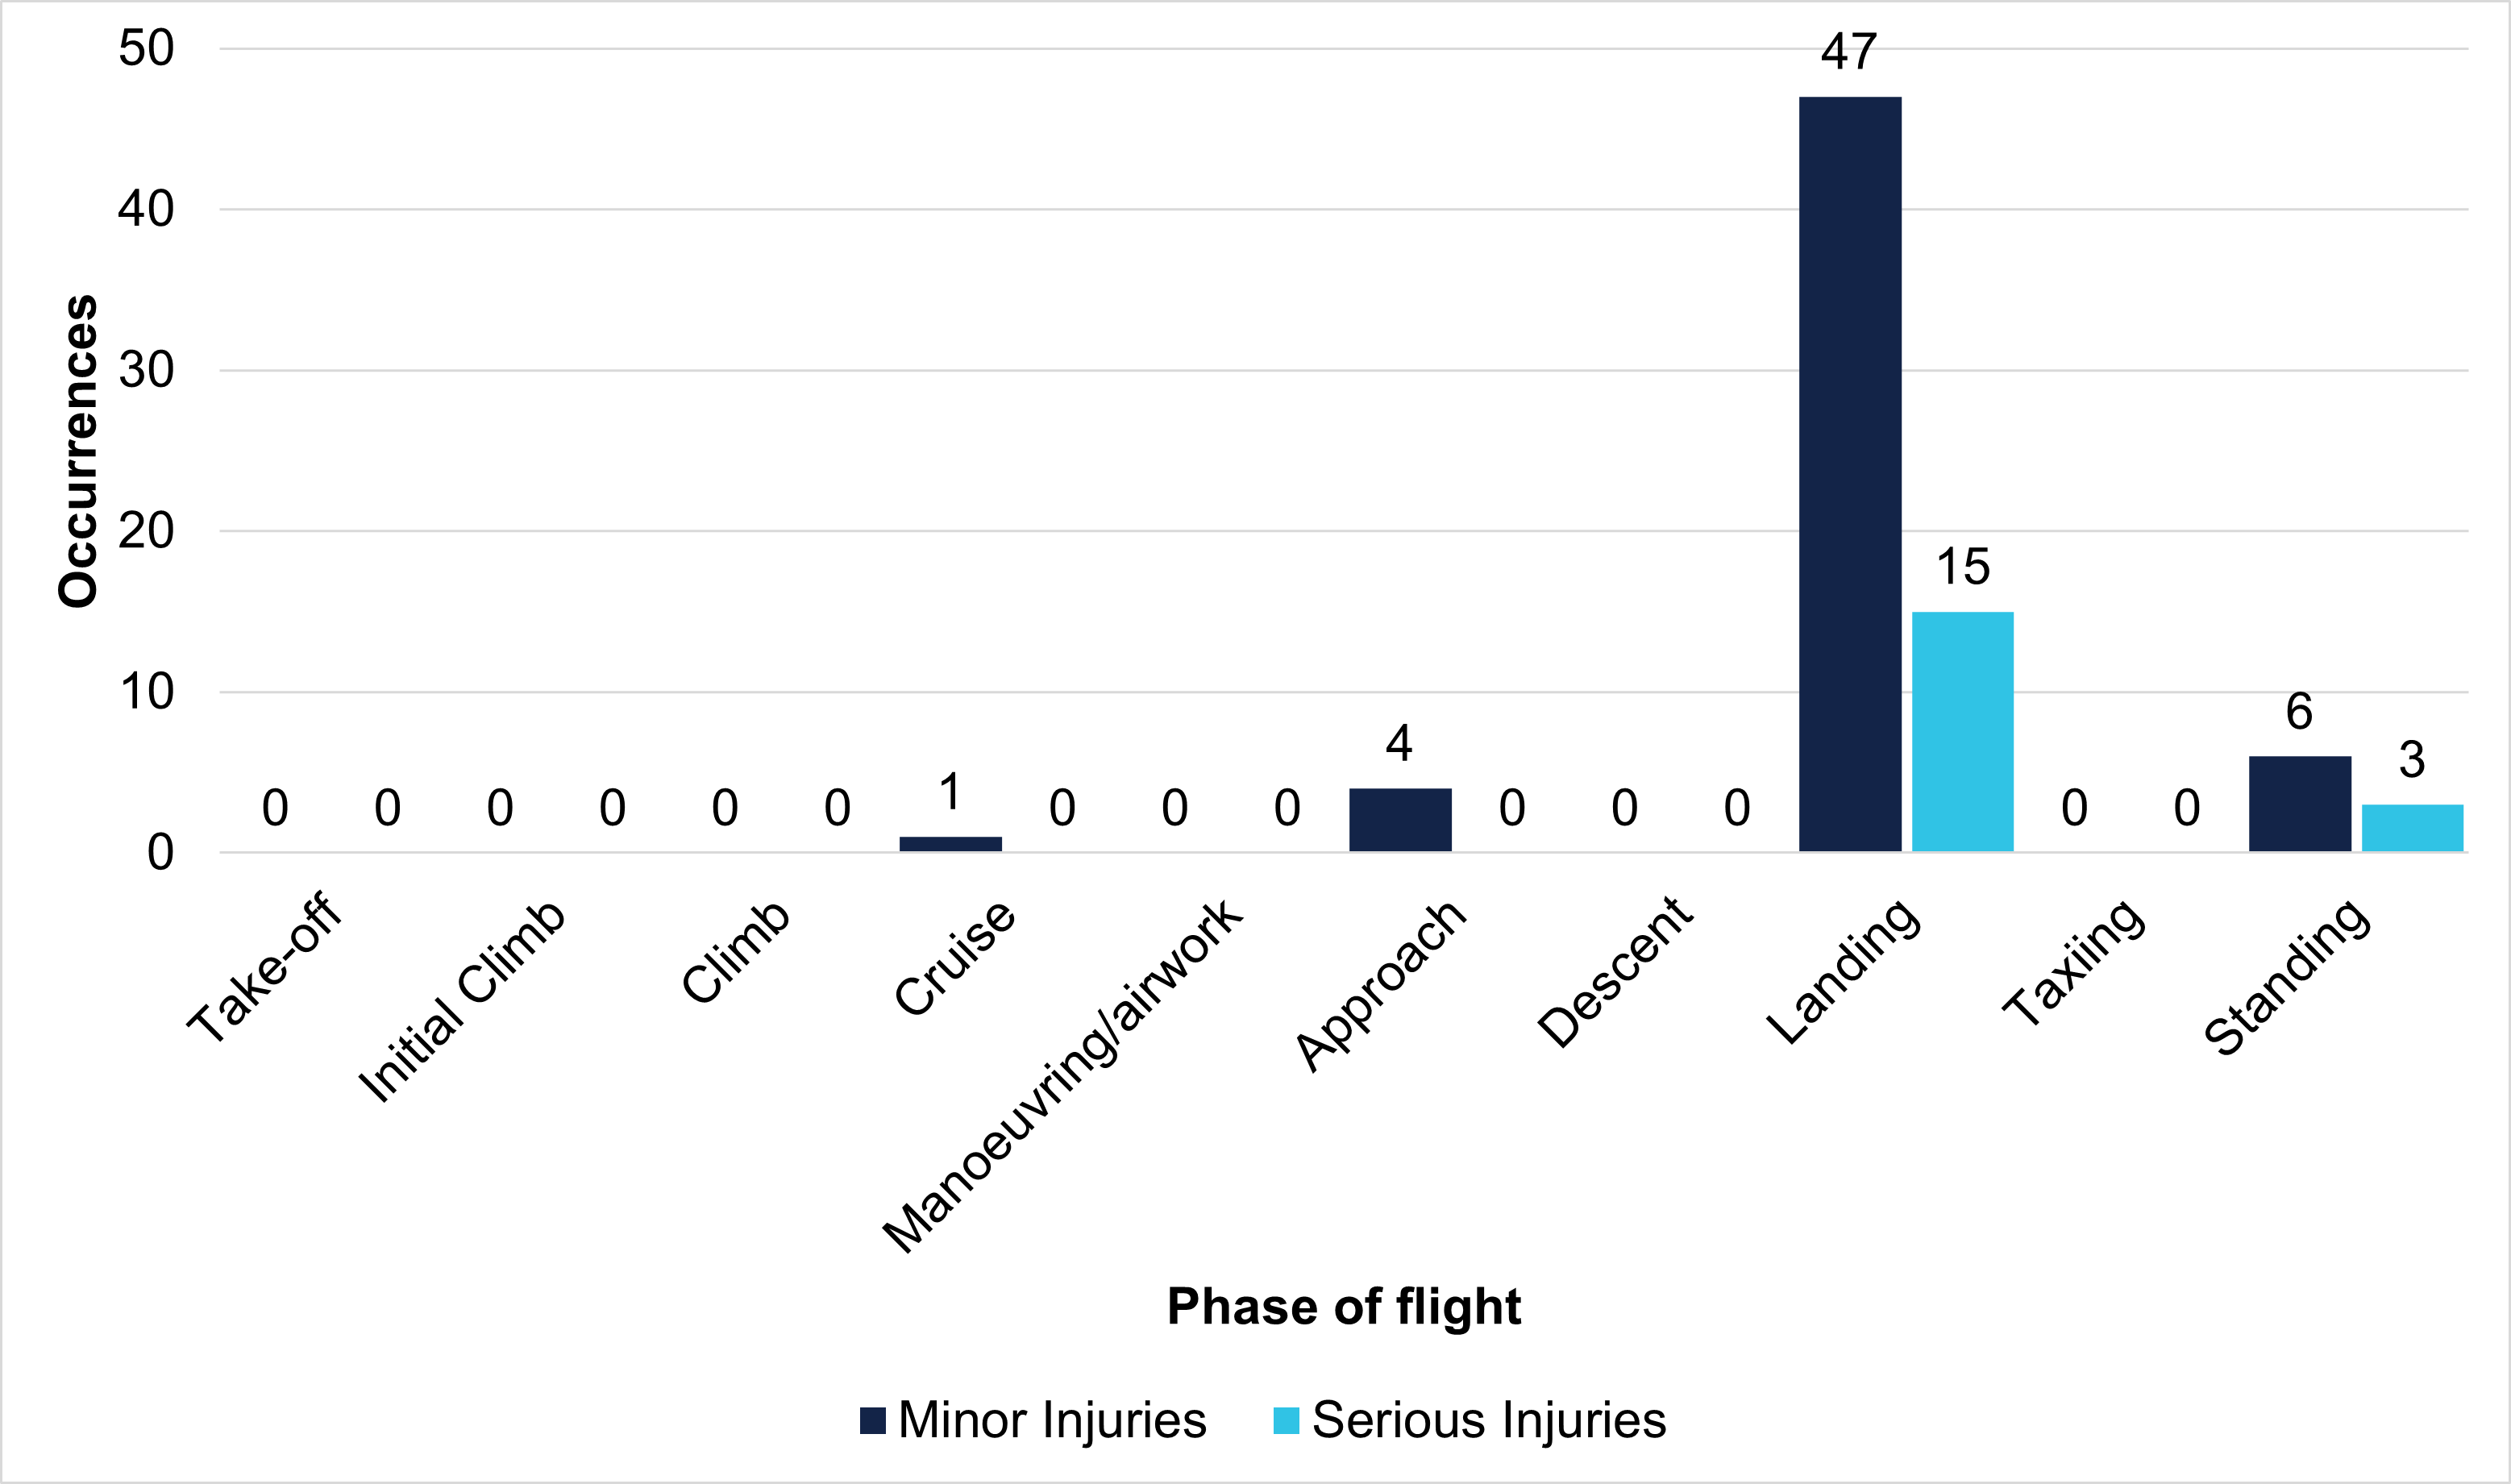
Source: ATSB
The data identified that 47 (81%) of the minor injuries and 15 (83%) of the serious injuries occurred during landing, significantly higher than all other phases of flight.
The percentage of injuries that occurred during landing was higher than the percentages of balloon occurrences (55%), serious incidents (48%) and accidents (67%) that occurred during the landing phase of flight.
This is likely due to the nature of a balloon occurrence where an injury has occurred. For an injury to occur, a collision with an object, such as a tree or powerline, or the ground itself is usually required. This is also reflected with 7% of minor injuries occurring during the approach phase, and 10% of minor injuries and 17% of serious injuries occurring when the balloon is inflated and stationary on the ground (standing phase).
ATSB finding A minor or serious injury on a commercial ballooning flight was most likely to occur during the landing phase of flight. |
Types of injuries in commercial ballooning
Severity of injuries was recorded in the ATSB occurrence database, but details of the injuries sustained were limited, especially if the related occurrence was not investigated by the ATSB. Additionally, details of the type of basket fitted to the balloons was not captured in the occurrence database. As a result, no correlation could be made between injuries and basket type. From the available information, there were some minor injuries due to collisions with trees. Layover and hard landings contributed to the largest number of serious injuries. These resulted from balloon passengers being unrestrained within the basket and, in some occurrences, adopting an incorrect landing position. These injuries were mainly flail-type, due to collisions with other passengers, and lower limb and spinal injuries from deceleration. No fatalities occurred during ballooning operations conducted between 2014–2022.
Common reported occurrence safety factors
The safety factors recorded for the 79 commercial balloon occurrences reported to the ATSB in the period 2014–2022, were extracted from the database. The 4 leading safety factors are listed in Table 1, along with the associated injury count. 75 of the 79 occurrences identified at least 1 of these 4 leading safety factors. The most common safety factor was ‘wind’, a safety factor in 44.3% of all occurrences. Injuries were also most prevalent when wind was identified as a safety factor. The second most common was ‘assessing and planning’, which was a safety factor in 19% of occurrences, and aircraft handling also at 19% and monitoring and checking in 12.7% of all occurrences. Most occurrences had multiple safety factors. For example, wind and planning coexisted where pilots had not obtained accurate wind information during pre-flight preparation.
Aviation safety factor types that were identified were:
- Wind: Situations where the direction or magnitude of wind had influenced aircraft performance, or the ability of the pilot to control the aircraft. May have also included situations where wind influenced performance of ground personnel.
- Assessing and planning: Problems associated with assessment and planning activities, including briefings conducted as part of planning for a particular task. For example, pre-take-off briefings, landing position briefings.
- Aircraft handling: Direct manipulation of aircraft flight path and configuration. Direct manipulation referred to actions having a relatively immediate change of flight parameters or configuration.
- Monitoring and checking: Flight crew actions associated with maintaining awareness of system states (e.g. fuel, engine temperature), environmental states (e.g. weather), traffic disposition and other relevant variables.
Table 1: Commercial ballooning occurrence safety factors
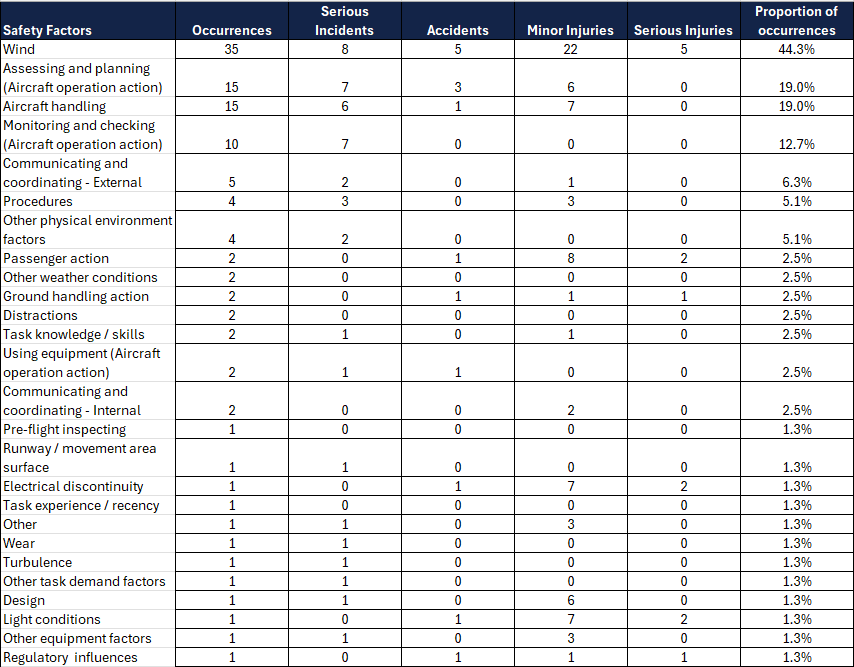
Source: ATSB
ATSB finding Of the 79 balloon occurrences reported to the ATSB between 2014 and 2022, 35 (44%) attributed wind as a safety factor, and 15 (19%) attributed assessing and planning as a safety factor resulting in 8 serious incidents and 5 accidents associated with wind, and 7 serious incidents and 3 accidents associated with assessing and planning. |
Occurrence review
A review of the occurrences (Appendix B – Balloon occurrences 2014–2022) identified that 44% had a wind contribution and 33% were categorised as a collision with terrain with 14% categorised as a hard landing. It was found that wind contributed in different ways. Strong winds on the ground necessitate a ‘layover’ landing, in which the basket is dragged on its side until the balloon deflates, with little directional control. These resulted in collisions with trees or other obstacles within the landing area.
In addition to impact with obstacles, occupants sustained injuries in layover landings when they did not adopt the required brace position, were unable to hold on/brace effectively and were ejected from the basket or were injured by impact with other occupants. In one occurrence, AO-2018-016, the pre-flight safety briefing was ineffective in ensuring that all passengers understood the briefing and as a result the passengers did not adopt the required landing position during a hard landing, resulting in 4 serious injuries and 7 minor injuries.
Strong winds also increased the approach distance and resulted in collisions with powerlines or trees when the pilot did not allow sufficient distance in which to manoeuvre the balloon. This was also influenced by balloon size, as larger balloons were less manoeuvrable and therefore required more obstacle clearance margin.
Pre-flight planning includes a review of the winds at different altitudes to determine approach launch and expected landing sites. When this was not done adequately, or the wind differed from expected or changed during the flight, this resulted in occurrences due to landing in unplanned locations, where the pilot did not have adequate information about the hazards.
Managing vertical descent rate relies on pilots using winds and temperatures at different heights. In one occurrence, climbing into a temperature inversion resulted in unexpected sink. In others, hard landings resulted from mismanagement of the balloon vents, delayed application of heat, or attempting to land in a confined area. Gusty conditions also resulted in hard impacts and associated injuries due to the limited cushioning of the basket.
In one occurrence, the wind was stronger than expected and the balloon overflew all suitable landing sites. This resulted in the balloon drifting over water, where the pilot elected to offload the passengers onto a boat while there was sufficient gas remaining to control the descent and passenger transfer.
In several occurrences, launching in the early morning resulted in the rising sun affecting the pilot’s visibility and subsequent impact with obstacles. Fog was another factor that reduced a pilot’s visibility and resulted in impact with obstacles during approach.
Occurrence locations
As the ATSB occurrence data included location, geographical data for Australian balloon occurrences between 2014–2022 was extracted from the database and plotted using Google Earth (Figure 25).
Balloon weather packages
CASR Part 131 requires balloon operators to obtain a weather forecast from an authorised source, such as the Bureau of Meteorology, valid for a period extending 2 hours beyond their landing time. Since October 2020, the Bureau of Meteorology provided balloon weather packages, available through the Bureau of Meteorology website, containing a compilation of relevant information for balloon flight planning. The weather packages replaced a previous recorded phone service for balloon pilots and a text-based product for Alice Springs. The packages have standardised and automated weather information for 21 locations around Australia that are frequently used by balloonists (Figure 25).
Most of the information provided in the product can be found in other aviation weather products, including area and aerodrome forecasts and observations. The unique components of the package are model meteograms (which give time series of wind and humidity at different levels in the atmosphere), ‘F160 forecasts’ (which show the vertical distribution of wind and temperature) and a wind profiler time series. These products assist the pilot in determining cloud and wind at different heights throughout the period of the forecast.
Figure 25: Reported commercial ballooning occurrences 2014–2022 (red triangle) and weather package locations (yellow circle)
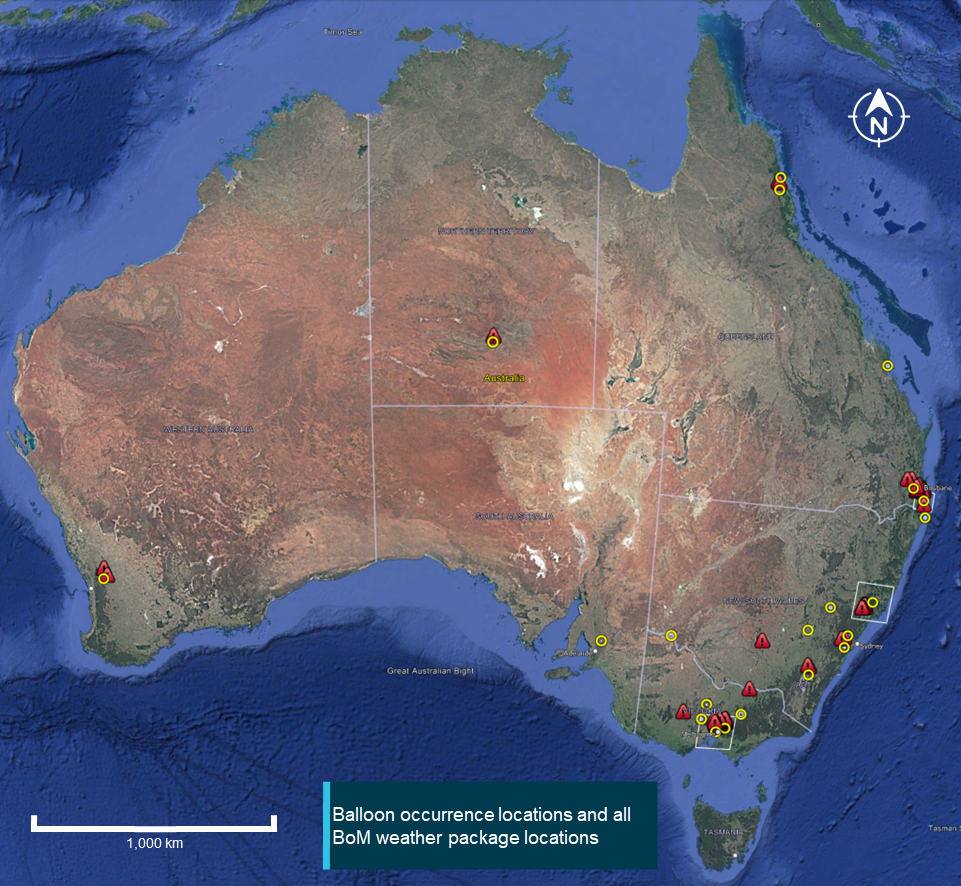
Source: Google Earth and Bureau of Meteorology, annotated by the ATSB
Occurrences by weather package location
Comparison of the occurrence and weather package locations identified that 77 of the 79 occurrences were geographically located within a 40 km radius of the nearest central point of a balloon weather package location. The remaining 2 occurrences were located about 75 km and 200 km from the nearest respective weather package areas.
The availability of a weather package did not relate to the number of occurrences or their contributing factors.
Injuries by factor and by weather package location
Table 2 shows the number of occurrences by weather package location where wind was identified as a safety factor and the number of those that resulted in serious and/or minor injuries (regardless of how many people were injured). Canberra, Sydney, and Alice Springs had zero injuries in all occurrences. The locations with the highest percentage of injuries per occurrence with wind as a safety factor, were Avon Valley (67%) and the Hunter Valley (50%).
Table 2: Wind occurrences with an injury by location
Nearest weather package location | Wind occurrence | Wind occurrence with injury | Serious injury occurrence | Minor injury occurrence | Occurrences with injuries |
Melbourne (Vic) | 13 | 3 | 2 | 2 | 23% |
Yarra Valley (Vic) | 5 | 2 | 0 | 2 | 40% |
Hunter Valley (NSW) | 2 | 1 | 0 | 1 | 50% |
Gold Coast/Ipswich (Qld) | 6 | 2 | 1 | 2 | 33% |
Avon Valley (WA) | 3 | 2 | 1 | 2 | 67% |
Balloon envelope size
The Civil Aviation Safety Authority (CASA) maintains a register of all VH-registered aircraft. This register includes the type of aircraft, manufacturer, model, and the registration holder of all VH-registered aircraft. However, the database does not include the type of basket that is used nor the number of passengers that the balloon can carry. The ATSB collected end of calendar year registers from 2014 to 2022 and extracted VH‑registered balloon data. The total number of VH-registered balloons by year is shown in Figure 26. This data includes private balloons.
Figure 26: Total number of VH-registered balloons per year (2014–2022)
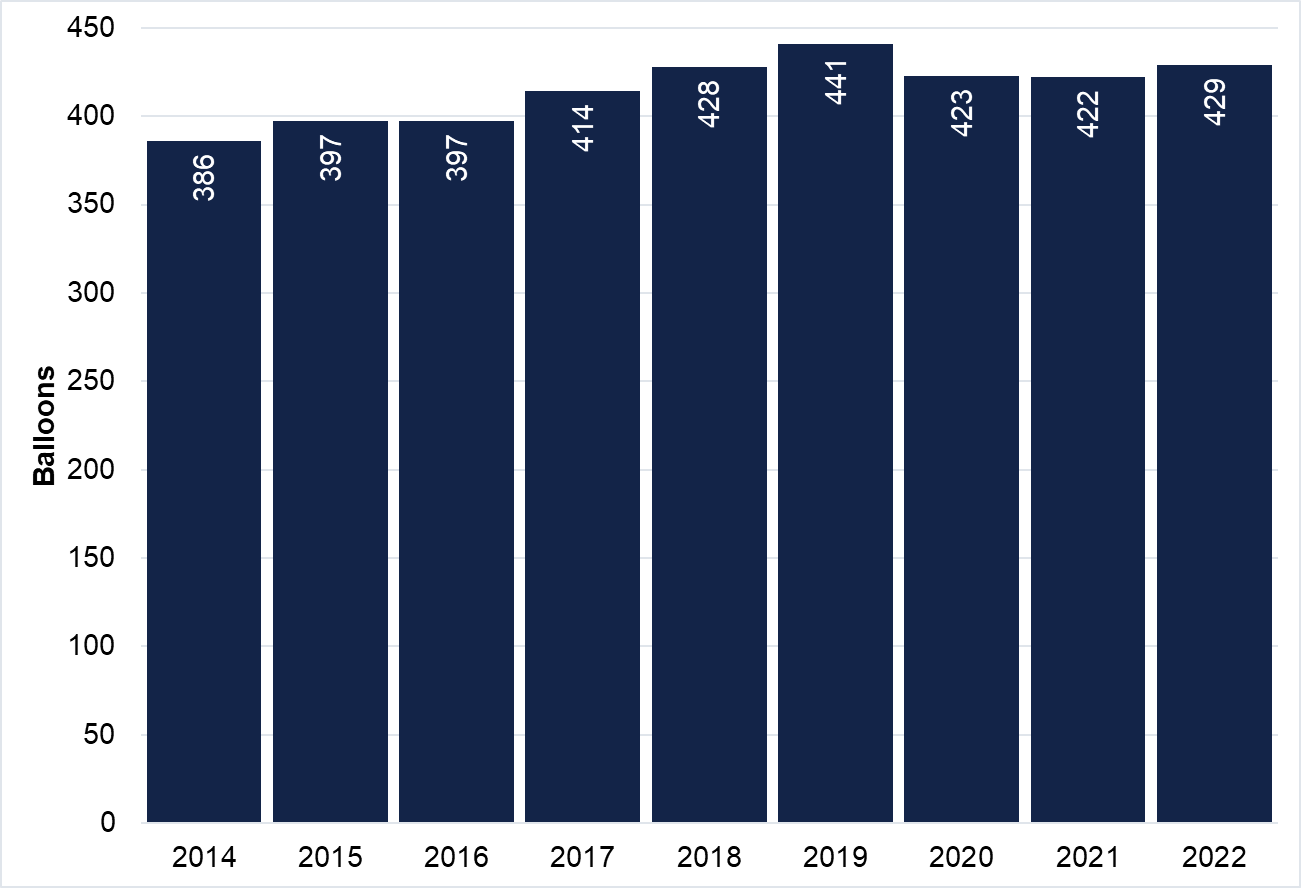
Source: CASA, annotated by the ATSB
Due to the aircraft register not recording envelope size, the designated model of each balloon was extracted from the database and cross-referenced with manufacturer data to determine the envelope size. Between 2014 and 2022, the total number of VH-registered balloons on the Australian civil aircraft register increased from 386 to 429, an 11% increase. The increase in the number of VH-registered balloons over 400,000 cubic ft is shown in Figure 27.
Figure 27: Number of VH-registered balloons over 400,000 cubic ft per year (2014–2022)
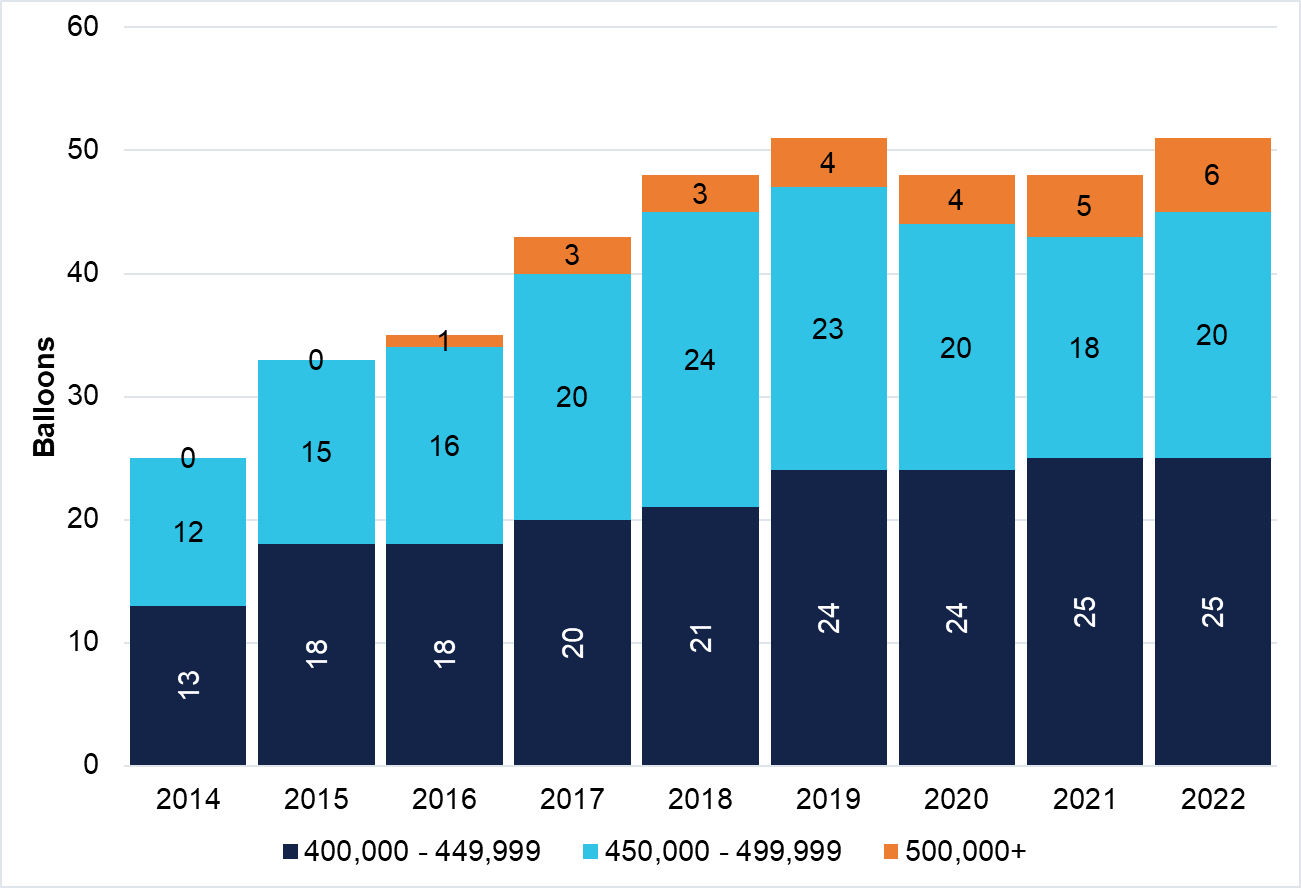
Source: CASA, annotated by the ATSB
At the end of calendar year 2014 there were 25 balloons over 400,000 cubic ft. By the end of 2022 this number had increased to 51, an increase of 104%, with a breakdown as shown in Table 3:
Table 3: VH‑registered balloons over 400,000 cubic ft
Envelope size (cubic ft) | 2014 | 2022 | Increase |
400,000 to 449,999 | 13 | 25 | 92% |
450,000 to 499,999 | 12 | 20 | 67% |
>= 500,000 (2016 onwards) | 0 | 6 | 500% from 2016 |
Over the safety study period, there was an 11% increase in total VH-registered balloons. This increase included a 92% increase in balloons between 400,000 and 449,000 cubic ft, and a 67% increase in balloons between 450,000 and 499,000 cubic ft. One balloon above 500,000 cubic ft was first registered in 2016, increasing to a total of 6 by the end of 2022.
CASR Part 131 Manual of Standards, Chapter 25.03, specified that the maximum number of passengers permitted per flight was 24. To carry this number, a balloon must have a minimum volume of 450,000 cubic feet (Cameron Balloons Ltd, 2025). During the safety study period, there was a 116% increase in balloon envelopes exceeding 450,000 cubic feet. This growth indicates a rise in the number of balloons capable of carrying the maximum passenger load on a single flight.
ATSB finding Over the safety study period, from 2014–2022, there was a significant increase in balloons with an envelope size above 400,000 cubic ft on the CASA aircraft register, and as a result, an increase in the number of balloons capable of carrying the maximum number of passengers per flight. |
Occurrences by balloon envelope size
Using the same methodology to determine envelope size as above, the balloon sizes of all occurrences was extracted from the occurrence data. This data was then compared against occurrences and injuries and displayed in Table 4, identifying that:
- balloons with an envelope size of 240,000 cubic ft had the highest number of occurrences with a total of 34, these occurrences resulted in 8 minor injuries and 2 serious injuries
- balloons with an envelope size of 350,000 cubic ft had the highest number of serious injuries, with a total of 6 with an associated 12 minor injuries over 6 occurrences
- there were 2 occurrences involving balloons with an envelope size of 525,000 cubic ft, with 2 serious injuries and 13 minor injuries
- balloons above 400,000 cubic ft had a combined total of 23 occurrences out of 79 (29%), 34 out of 58 minor injuries (59%), and 9 out of 18 serious injuries (50%).
Table 4: Occurrences and injuries by balloon size 2014–2022
Envelope size (1,000 ft3) | Occurrences | Minor injuries | Serious injuries |
unknown | 1 | 0 | 0 |
90 | 1 | 0 | 0 |
105 | 1 | 0 | 0 |
120 | 2 | 0 | 0 |
210 | 1 | 0 | 0 |
240 | 34 | 8 | 2 |
275 | 1 | 3 | 0 |
300 | 4 | 1 | 1 |
340 | 1 | 0 | 0 |
350 | 6 | 12 | 6 |
400 | 6 | 11 | 4 |
425 | 8 | 4 | 2 |
450 | 11 | 6 | 0 |
525 | 2 | 13 | 3 |
Total | 79 | 58 | 18 |
Figure 28: Average injuries per occurrence by balloon envelope size (2014–2022)
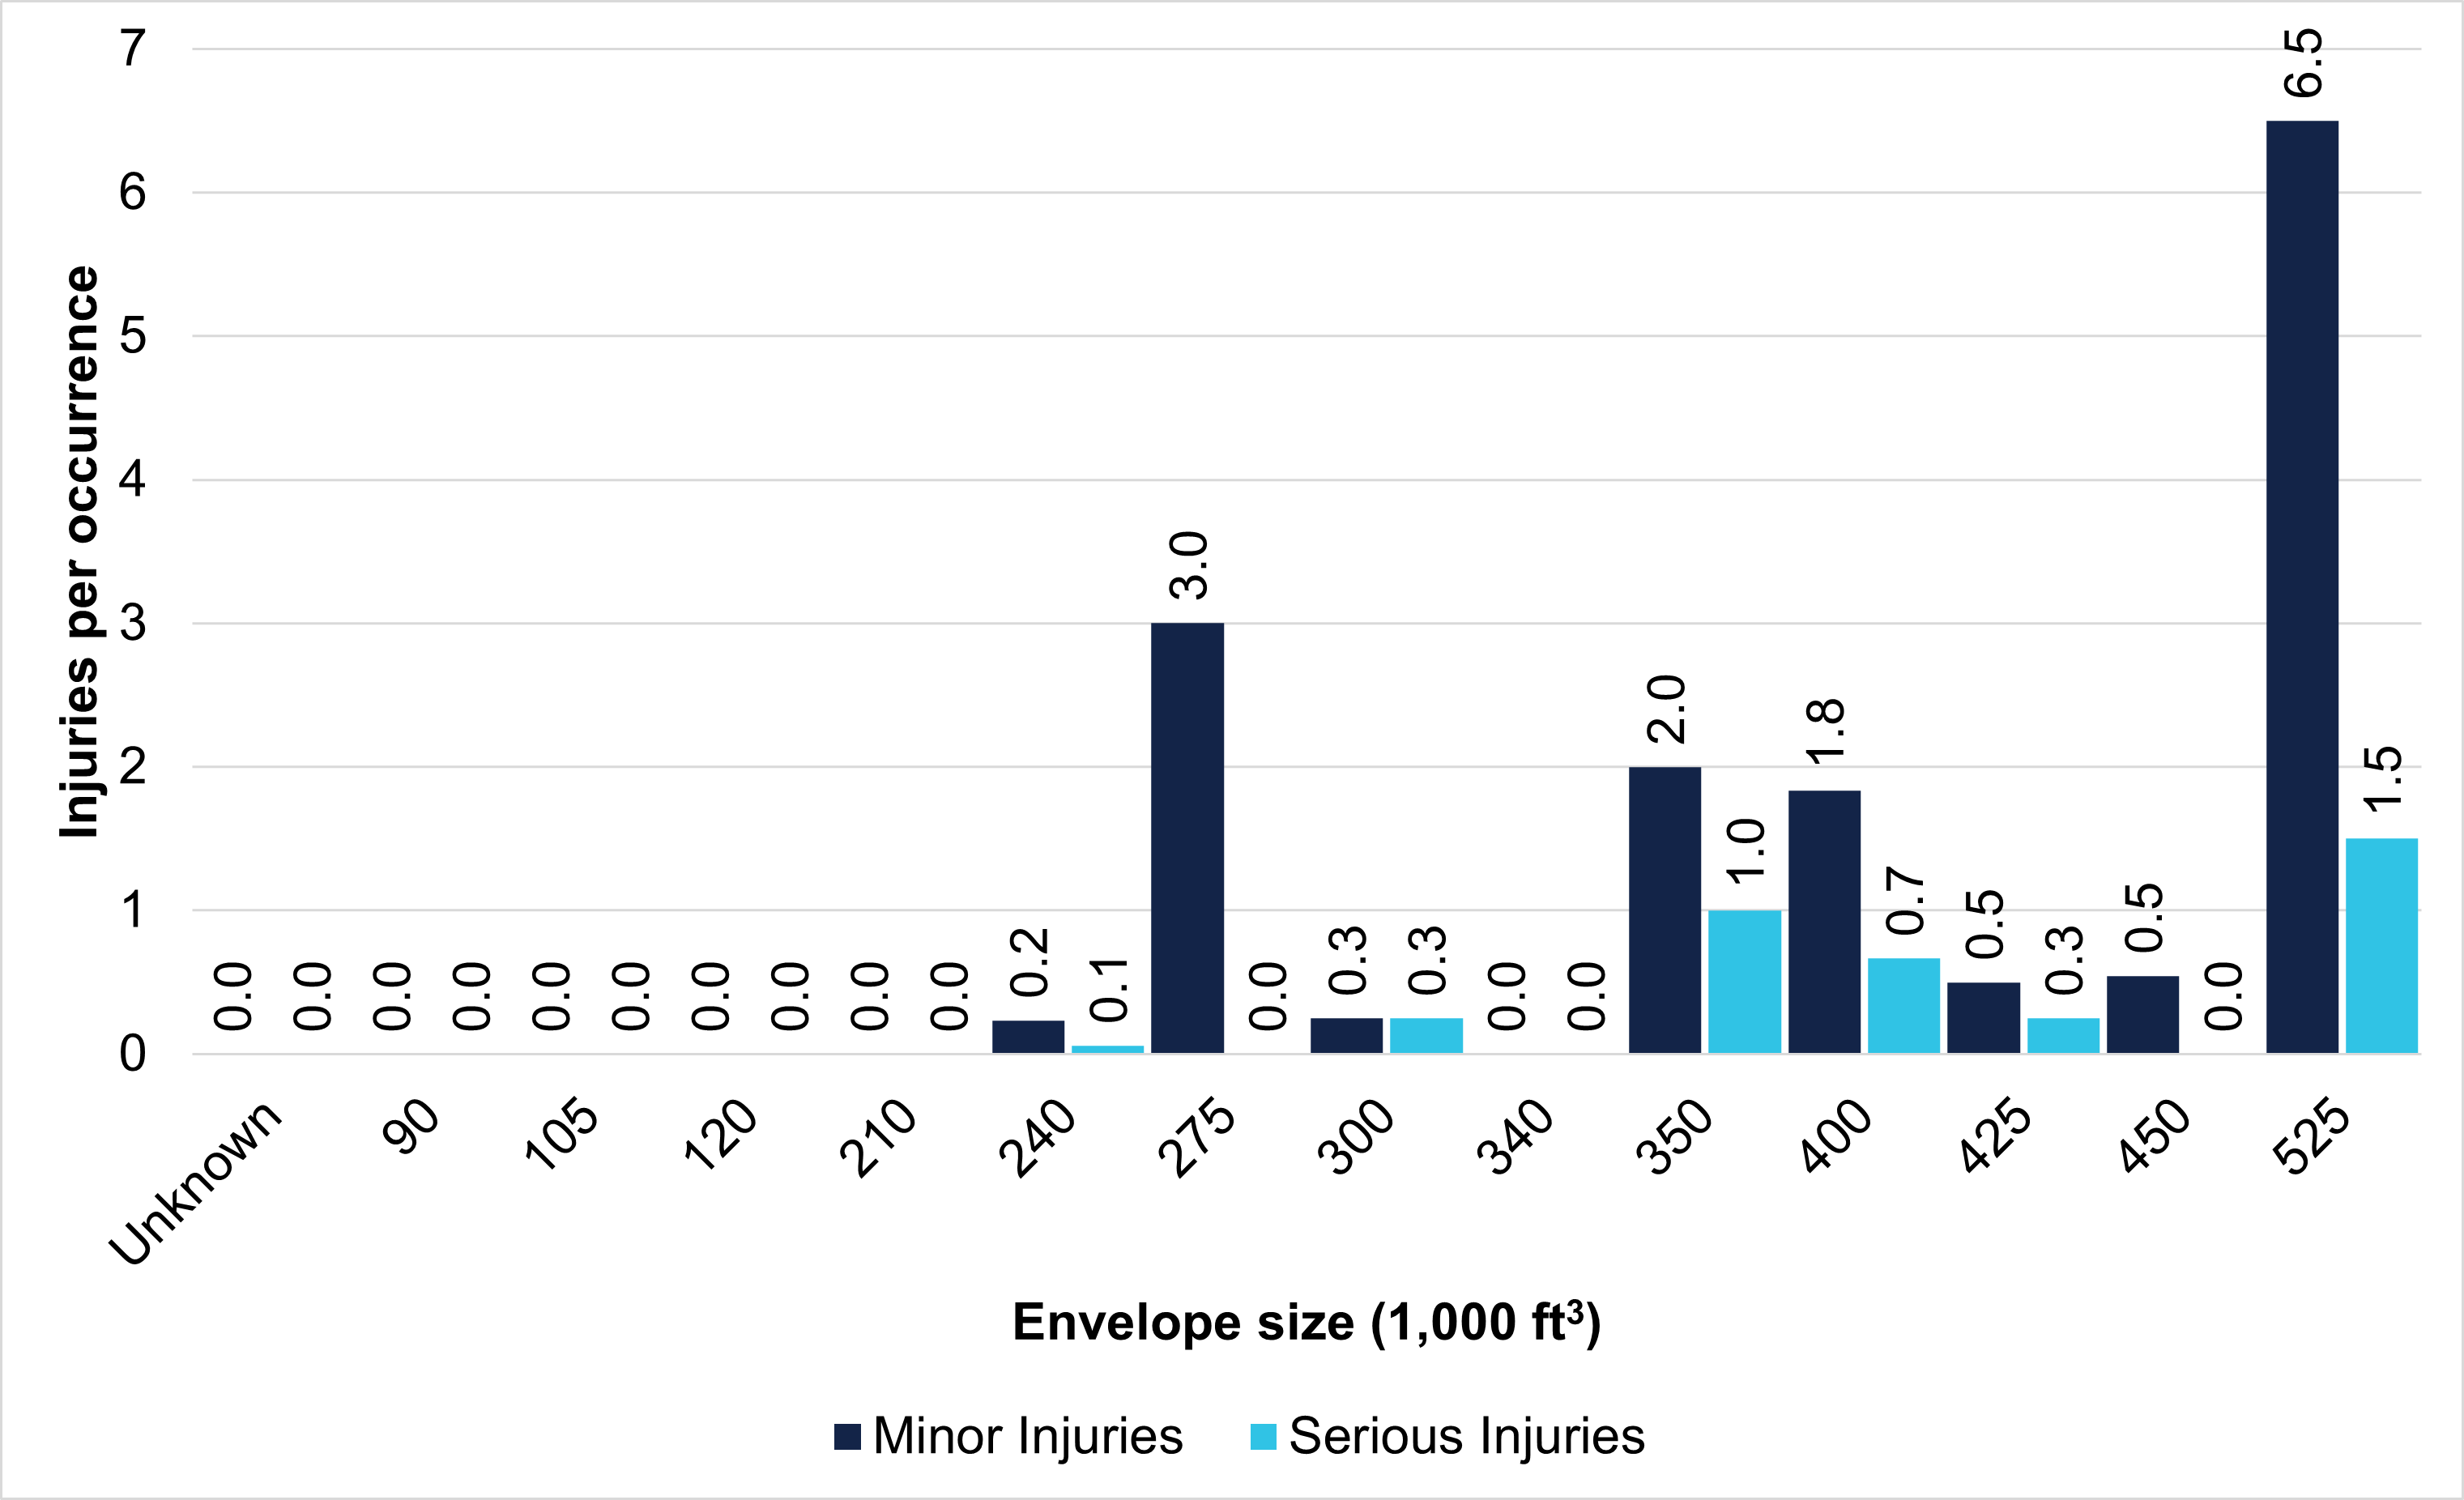
Source: ATSB
The following was identified with wind as a safety factor (Figure 29):
- the 240,000 cubic ft balloons had the highest number of occurrences with 6 minor injuries and 2 serious injuries from 19 wind-related occurrences
- the 350,000 cubic ft balloons had the highest number of serious injuries with 4 serious injuries from 4 wind-related occurrences
- the 350,000, 400,000 and 425,000 cubic ft balloons had 7 serious injuries, 23 minor injuries out of 9 occurrences combined.
Figure 29: Safety factor of wind by balloon size
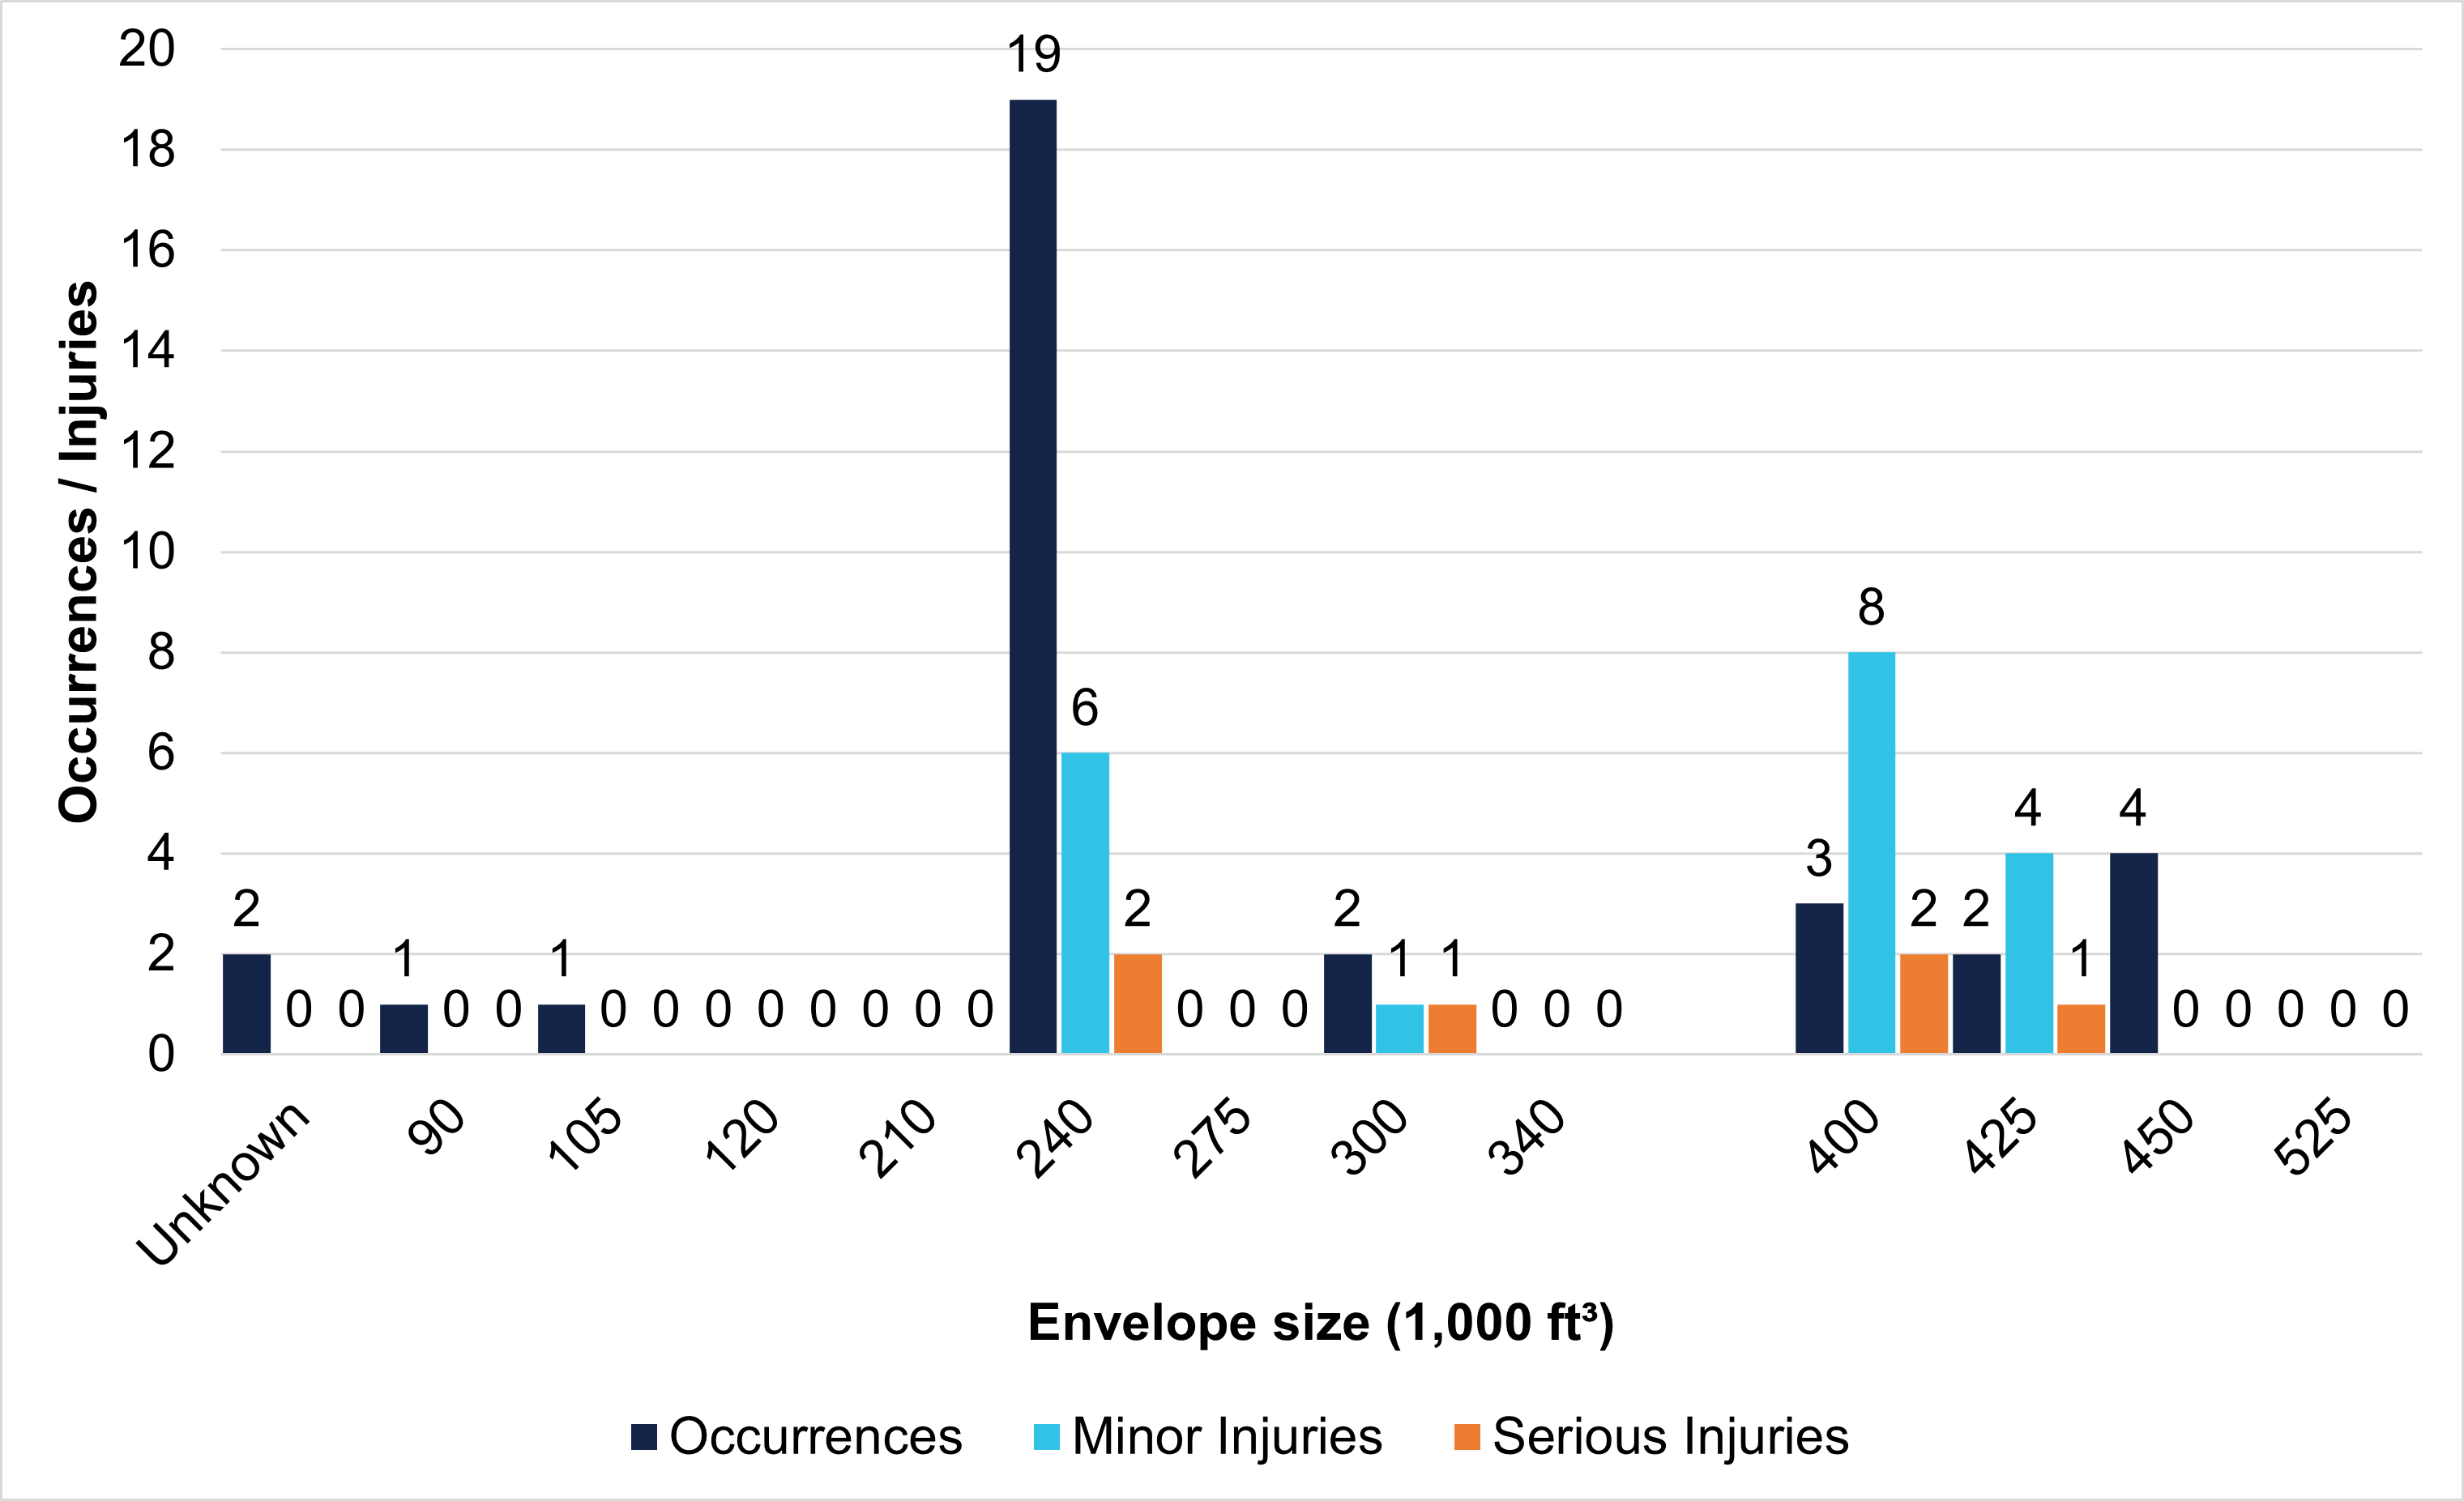
Source: ATSB
Civil Aviation Safety Regulations Part 131 exposition requirements
In December 2021 a regulatory change came into effect for ballooning, with the introduction of CASR Part 131 Balloons and hot air airships. These changes were not fully implemented until November 2024, when the Part 131 Manual of Standards commenced.
There are 21 CASR Part 131 AOC holders in Australia. A requirement for the issue of a Part 131 Air Operator’s Certificate (AOC), is for balloon transport operators to produce a CASA‑approved company exposition. Included within the exposition is the following requirement as per CASR Part 131:
131.195 Content of exposition
(h) details of each plan, process, procedure, program and system implemented by the operator to safely conduct and manage the operator’s balloon transport operations in compliance with the civil aviation legislation.
Note: The plans, processes, procedures, programs and systems mentioned in paragraph (h) may be set out in one or more operator manuals.
Australian air transport aeroplane and helicopter AOC holders are also required to maintain a CASA-approved exposition and require a separate safety management system as per CASR Part 119. There is no current requirement for a Part 131 AOC holder to maintain a separate safety management system.
CASA advised the ATSB that it reserved the requirement for Balloon AOC holders to have an SMS in the drafting of Part 131. CASA also assessed that the transition to CASR Parts 91 and 131 was sufficient regulatory change for operators to manage at that time. Since the commencement of Part 131, CASA reported concentrating on implementing the Part 131 MOS and giving operators time to produce a compliant exposition. CASA also advised that the next tranche of work will be the transitioning of balloon pilot licensing to CASRs, followed by the transition of continuing airworthiness and maintenance requirements into Part 131. Inclusion of an SMS for balloon transport operators has not been scheduled at this time.
Summary
The data showed that a commercial balloon flight was 1.5 to 4 times more likely to have a reported occurrence than a comparable joyflights/sightseeing and passenger transport activity in an aeroplane, and about 3 to 9 times more likely than in a helicopter. These occurrences were coded as incidents, serious incidents or accidents, depending on the severity of injuries and aircraft damage. The data showed that a serious incident or accident was about 6 to 9 times more likely to occur during a commercial balloon flight than a comparable aeroplane flight and 21 to 25 times more likely than during a helicopter flight.
The data also showed a difference between the most common occurrence categories for balloons, compared with aeroplanes and helicopters. Commercial balloons were more likely to have a collision with terrain, hard landing, cabin injury or wirestrike. Aeroplanes and helicopters were more likely to have a birdstrike, diversion, forced/precautionary landing or engine failure/malfunction.
The balloon occurrences and associated injuries usually happened during approach and landing. The effect of wind was identified as a contributing safety factor to most occurrences. However, as the number of flights per region was not collected from operators, a correlation between the availability of detailed weather information and wind‑related occurrences could not be determined. Assessing and planning, aircraft handling, and monitoring and checking were also identified as common safety factors. The combination of wind-related pilot planning and decision-making, and aircraft handling in those conditions, resulted in most of the occurrences and injuries.
There were no fatalities in commercial ballooning during the 2014–2022 period, while aeroplane and helicopter joyflights/sightseeing activities resulted in 7 fatalities, and a further 24 fatalities occurred in aeroplane and helicopter passenger transport activities. However, passengers in commercial balloon flights were 14 to 35 times more likely to sustain an injury than in an aeroplane and 60 to 70 times more likely than in a helicopter.
Overall, a passenger in a commercial balloon flight was at significantly greater risk of minor or serious injury than in a similar aeroplane or helicopter flight, but unlikely to be fatally injured. Additionally, the number of passengers exposed to the risk in a single occurrence has increased with the increase in balloon size being used for commercial passenger flights. However, there was no apparent link between larger balloons and the number of ballooning-related injuries.
Injury data showed the magnitude of passenger injury risk in balloon flights compared with aeroplane and helicopter flights. While 99.7% of aeroplane and 99.8% of helicopter joyflights/sightseeing and passenger transport incidents, and 100% of both aeroplane and helicopter incidents in joyflights/sightseeing activities resulted in no injuries, only 71% of balloon incidents were injury-free.
Similarly, 95% of aeroplane and 100% of helicopter joyflights/sightseeing and passenger transport serious incidents had no injuries, and 100% of both aeroplane and helicopter joyflights/sightseeing serious incidents reported no injuries, only 83% of balloon serious incidents were injury‑free.
Furthermore, 62% of aeroplane and 38% of helicopter joyflights/sightseeing and passenger transport flight accidents had no injuries, and 25% of aeroplane and 50% of helicopter joyflights/sightseeing accidents had no injuries. 27% of balloon accidents reported no injuries. This shows that joyflights/sightseeing passengers in a balloon were slightly less likely to be injured in an accident than in an aeroplane, but more likely to be injured than in a helicopter. Furthermore, balloon passengers were more likely to be injured in an accident than aeroplane or helicopter passengers in a passenger transport accident.
The increased injury risk for balloon passengers is likely due to balloon passengers being unrestrained in an open basket. Fewer injuries per accident for aeroplanes and helicopters shows that these aircraft sustain greater damage with fewer injuries to occupants than balloons. From the available injury information, the majority of the balloon accident injuries consisted of lower limb injuries from terrain collisions, and flail type injuries from passengers colliding with each other.
A collection of more detailed injury data would allow further analysis of the mechanism of injuries, with the aim of identifying possible ways to improve passenger safety in commercial balloon flights. Passengers are therefore encouraged to provide detailed injury information in ATSB occurrence notifications. Prior to a balloon flight, passengers should be informed of the injury risks, as balloons do not have the restraint systems or impact reduction engineering afforded to passengers in aeroplanes or helicopters.
Although not a legislative requirement, an SMS can assist balloon operators to employ a structured approach to managing risk. This study identified several hazards applicable to balloon operations in Australia, such as wind, pre-flight planning, and passenger position during landings. However, there will be additional hazards applicable to specific locations or types of operation that individual operators will be aware of. Structured identification and treatment of these hazards should result in a reduction of occurrences and injuries in commercial ballooning operations.
Previously identified passenger injury risk mitigators include:
- detailed passenger safety briefings and visual cards
- ensuring passengers can adopt the appropriate brace or landing position
- clear instructions to passengers in an emergency
- positioning of passengers to reduce injuries resulting from contact between them.
Findings
| ATSB investigation report findings focus on safety factors (that is, events and conditions that increase risk). Safety factors include ‘contributing factors’ and ‘other factors that increased risk’ (that is, factors that did not meet the definition of a contributing factor for this occurrence but were still considered important to include in the report for the purpose of increasing awareness and enhancing safety). In addition ‘other findings’ may be included to provide important information about topics other than safety factors. |
From the evidence available, the following findings are made with respect to the Australian balloon transport operation occurrences between 2014–2022:
ATSB findings
- A commercial balloon flight was 1.5 times more likely to have a reported occurrence than a comparable joyflights/sightseeing and passenger transport activity in an aeroplane and 3.4 times more likely than a helicopter.
- A commercial balloon flight was 4.2 times more likely to have a reported occurrence than a comparable joyflights/sightseeing activity in an aeroplane and 9.2 times more likely than a helicopter.
- A serious incident or accident was 8.9 times more likely to occur on a commercial balloon flight than a joyflights/sightseeing or passenger transport activity in an aeroplane and 25.6 times more likely than in a helicopter.
- A serious incident or accident was 5.4 times more likely to occur on a commercial balloon flight than a joyflights/sightseeing activity in an aeroplane and 21.2 times more likely than a helicopter.
- A person was 34.7 times more likely to sustain an injury on a commercial balloon flight than in an aeroplane on a joyflights/sightseeing and passenger transport charter activity and 58.5 times more likely than in a helicopter.
- A person was 13.7 times more likely to sustain an injury on a commercial balloon flight than a joyflights/sightseeing activity in an aeroplane and 69.4 times more likely than in a helicopter.
- A person was 57.2 times more likely to sustain a serious injury on a commercial balloon flight than a joyflights/sightseeing and passenger transport charter activity in an aeroplane and 52.6 times more likely than in a helicopter.
- A person was 34.2 times more likely to sustain a serious injury on a commercial balloon flight than a joyflights/sightseeing activity in an aeroplane and 26.0 times more likely than in a helicopter.
- A commercial ballooning reported occurrence was more likely to occur during landing than any other flight phase.
- A commercial ballooning serious incident or accident was more likely to occur during landing than any other flight phase.
- A minor or serious injury on a commercial ballooning flight was most likely to occur during the landing phase of flight.
- Of the 79 balloon occurrences reported to the ATSB between 2014 and 2022, 35 (44%) attributed wind as a safety factor, and 15 (19%) attributed assessing and planning as a safety factor resulting in 8 serious incidents and 5 accidents associated with wind, and 7 serious incidents and 3 accidents associated with assessing and planning.
- Over the safety study period, from 2014–2022, there was a significant increase in balloons with an envelope size above 400,000 cubic ft on the CASA aircraft register, and as a result, an increase in the number of balloons capable of carrying the maximum number of passengers per flight.
Glossary
| CASA | Civil Aviation Safety Authority |
| CASR | Civil Aviation Safety Regulations |
| BITRE | Bureau of Infrastructure, Transport and Research Economics |
| BOM | Bureau of Meteorology |
ICAO MOS SMS | International Civil Aviation Organization Manual of Standards Safety management system. A systematic approach to organisational safety encompassing safety policy and objectives, risk management, safety assurance, safety promotion, third party interfaces, internal investigation and SMS implementation. |
Sources and submissions
Sources of information
The sources of information during the investigation included the:
- Civil Aviation Safety Authority
- Bureau of Infrastructure, Transport and Research Economics
- Bureau of Meteorology
- Australian Balloon Federation.
References
Cameron Balloons Ltd. (2025). Cameron Balloons a-type. Retrieved from Cameron Balloons: https://www.cameronballoons.co.uk/a-type
Submissions
Under section 26 of the Transport Safety Investigation Act 2003, the ATSB may provide a draft report, on a confidential basis, to any person whom the ATSB considers appropriate. That section allows a person receiving a draft report to make submissions to the ATSB about the draft report.
A draft of this report was provided to the following directly involved parties:
- Civil Aviation Safety Authority
- Bureau of Infrastructure, Transport and Research Economics.
Submissions were received from:
- Civil Aviation Safety Authority
- Bureau of Infrastructure, Transport and Research Economics.
The submissions were reviewed and, where considered appropriate, the text of the report was amended accordingly.
Appendices
Please refer to the linked Appendices PDF:
.
Occurrence summary
| Investigation number | AS-2023-002 |
|---|---|
| Occurrence date | 28/07/2023 |
| Report release date | 26/11/2025 |
| Report status | Final |
| Investigation level | Defined |
| Investigation type | Safety study |
| Investigation status | Completed |
| Mode of transport | Aviation |