

Final report
Report release date: 21/10/2026
Investigation summary
Why the ATSB conducted this study
Submissions from operators engaged in aerial firefighting operations to the 2020 Royal Commission into National Natural Disaster Arrangements (RCNNDA) highlighted several issues potentially affecting safety. Further, the ATSB’s statistical report AR-2020-022 found the number of aerial firefighting occurrences per financial year had increased steadily since 2016–17. Since 2016, the ATSB has commenced 17 investigations involving aerial firefighting aircraft, with 10 of those investigations occurring in the last 5 years (at the time of publication).
The ATSB is conducting a safety study, AS-2021-015 Review of aviation safety aspects of aerial firefighting in Australia, to identify any systemic safety issues and other learning opportunities that could enhance the safety of aerial firefighting operations. As part of this safety study, the ATSB surveyed 149 National Aerial Firefighting Centre (NAFC)‑registered pilots. The survey aimed to better understand the hazards pilots face, and the opportunities they can see to improve the safety of aerial firefighting operations. The survey focused on 4 key areas of tasking, communication, reporting culture and safety culture. This report presents the results of that survey, which will be used to inform the findings of AS-2021-015.
What the ATSB found
Survey respondents were most positive about tasking aspects and communication, and least positive about reporting culture and safety culture. Overall, tasking aspects and communication each had more positive responses than negative and neutral responses combined, whereas safety culture and reporting culture had less.
Further, out of the 4 topics the survey explored, reporting culture was the topic that was perceived the most negatively by respondents. It received the lowest proportion of positive responses and the highest proportion of negative responses.
Respondents were largely positive about tasking aspects. The exception was whether respondents considered that decision‑makers directing aircraft had sufficient aviation training and experience, with just over half of respondents disagreeing that this was the case.
Respondents were also largely positive about communication, with a minimum of around half of respondents agreeing that aspects such as the overall quality of interactions between pilots and tasking agencies and the communication of safety information worked well.
Respondents were more negative than positive about reporting culture. The aspect of reporting that respondents were most critical about was what happens after an incident is reported to a tasking agency, with only 25% agreeing that they received feedback from tasking agencies and had seen a quick resolution and/or the implementation of positive change. An exception was that 82% of respondents had not been dissuaded from reporting an incident.
There was a statistically significant gap between respondents who had experienced an incident and those who had reported one, with 91 respondents (61%) having experienced an incident between 2017 and 2022, but only 52 (35%) having reported one.
Respondents were also less positive about safety culture than tasking and communication, but there was a lot more variation among respondents regarding safety culture, compared to the other 3 topics. Respondents were most positive about whether tasking agencies were genuinely interested in safety concerns raised by pilots, with just over half agreeing or strongly agreeing that this was the case.
Respondents perceived that the change that had most improved safety between 2017 and 2022 was the adoption of traffic management technology, while the change that had most worsened safety was fire agency personnel aviation knowledge and experience. Fire agency personnel aviation knowledge and experience was also what respondents most considered needed to be changed to improve safety.
Respondents considered the top 5 biggest threats to aerial firefighting safety to be adverse weather conditions/environment, midair collision, poor communication, pilot inexperience/lack of airmanship/poor training/lack of currency and fire agency safety culture.
Respondents’ main rate of pay as either dependent or independent of their hours flown explained some variation in their responses to one question regarding reporting culture and one regarding communication. However, respondents’ primary location of operation was the most important factor in explaining the variation in many of the responses for all the survey topics: tasking aspects, communication, reporting culture and safety culture.
Compared to respondents from all other locations, NSW and Vic respondents were both statistically more likely to disagree with 7 of the survey statements, of which 4 related to communication and 3 to tasking aspects.
NSW respondents were also statistically more likely to disagree with a further 9 survey statements than respondents from the remaining locations (including Vic on some occasions). These statements were spread relatively evenly across the 4 topics.
What has been done as result
While the safety study is ongoing, the NSW Rural Fire Service has reported that since the time of the survey, it has undertaken a number of initiatives to address issues raised by survey participants. These include:
- developing and implementing the RFS Aviation Safety Management System
- creating formal aviation safety committees and assurance mechanisms
- introducing strengthened hazard, occurrence and safety reporting systems supported by just culture principles
- appointing dedicated aviation safety personnel
- expanding aviation training, briefing and competency frameworks
- improving operator engagement and contractor oversight arrangements
- introducing safety performance indicators and continuous improvement mechanisms
- undertaking its own Aviation Safety Survey in late 2025 to assess awareness and effectiveness of these reforms.
Further, the National Aerial Firefighting Centre (NAFC) has a Strategic Committee that has committed to facilitating several safety actions for the aerial firefighting industry, such as assisting in the development of nationally consistent standards (including in relation to the education and training of agency personnel engaged in aerial operations) and strategies that identify and manage risk in aerial firefighting.
Additionally, in 2023 following a review of groups such as the Fire Emergency Aviation Technical (FEAT) group, the NAFC established the national fire and emergency Aviation Safety Group (ASG) to reflect a stronger focus on aviation safety.
This report presents survey respondents’ perceptions of safety in Australian aerial firefighting operations. Survey respondents’ beliefs about potential safety concerns do not demonstrate that they are safety concerns and may not represent the views of other aerial firefighting pilots, or fire agency representatives and aerial firefighting operators. Additionally, these survey results represent a snapshot of respondents’ views at the time of the survey. Respondents’ views, and the circumstances within aerial firefighting upon which they are commenting, may have changed since the time of the survey. Further, since the survey was conducted, fire agencies are at varying stages of reviewing or developing various aviation safety and risk management policies or practices that may address issues raised by survey respondents. This report does not contain findings and is part of the safety analysis for AS‑2021‑015 Review of aviation safety aspects of aerial firefighting in Australia. This report supports conclusions and findings for that safety study. |
Introduction
Background
Aerial firefighting activity has increased over recent bushfire seasons (ATSB, 2020) and this increase is likely to continue. The Bureau of Meteorology (BoM) and CSIRO’s 2024 Annual State of the Climate report continues to highlight the warming of Australia’s climate and an associated increase in extreme fire weather and length of the fire season (BoM and CSIRO, 2024). These changes not only mean the potential for increased firefighting activity and a greater need for personnel to support those operations. They also introduce new challenges and potential risks to Australian aerial firefighting.
Following the 2019–20 fire season, a Royal Commission into National Natural Disaster Arrangements (RCNNDA) was held. Submissions from aerial firefighting operators highlighted several potential safety concerns. These included personnel capabilities and training, a lack of standardisation and collaboration, a lack of a clear system for managing aviation risk, and communication problems. Additionally, the operators cited commercial pressure, high accountability for safety with low control, safety culture, and fire agency reporting and feedback processes.
The ATSB’s statistical report AR-2020-022: A safety analysis of aerial firefighting occurrences in Australia, July 2000 to March 2020 found the number of occurrences per financial year had increased steadily from 2016–17 until March 2020. There were also more occurrences involving aerial firefighting aircraft in Australia between July 2019 and March 2020 than any financial year in the study period (July 2000 to March 2020). The National Aerial Firefighting Centre (NAFC) estimated that the 2019–2020 fire season had around 4 times more aviation activity than the previous season, with 328 individual aircraft flying 79,705 hours (ATSB, 2020). The rapid increase of firefighting activity means increased density of aircraft over the fireground, putting a significantly higher demand on tasking, coordination and communication processes.
Since 2016, the ATSB has commenced 17 investigations involving aerial firefighting aircraft, with 10 of those investigations occurring in the last 5 years (at the time of publication).
It is within the context of the aforementioned factors that the ATSB commenced safety study AS-2021-015 Review of aviation safety aspects of aerial firefighting in Australia to conduct a detailed examination of Australian aerial firefighting activities. As part of this safety study, the ATSB surveyed 149 NAFC-registered pilots to better understand the hazards they face, and the opportunities they can see to improve the safety of aerial firefighting operations.
Safety study goal
The goal of safety study AS-2021-015 Review of aviation safety aspects of aerial firefighting in Australia is to identify any systemic safety issues and other learning opportunities that could enhance the safety of aerial firefighting operations. The safety study is divided into 4 parts:
- Part A, AS-2021-015a, published 13 May 2026, presents the key safety themes reported by interviewees.
- Part B (this report), AS-2021-015b, presents the results from a survey of NAFC‑registered aerial firefighting pilots. It does not contain findings. The goal of the survey was to examine pilots’ perceptions of the hazards they face conducting aerial firefighting operations and any opportunities they see to improve the safety of the industry.
- Part C, AS-2025-015c, will expand upon the ATSB statistical report AR‑2020-022 and identify key trends in Australian aerial firefighting occurrences.
- The final report, AS-2025-015, will present a synthesis of the conclusions in Parts A to C to identify any systemic safety issues and other learning opportunities that could enhance the safety of aerial firefighting operations.
Australian aerial firefighting
National Aerial Firefighting Centre
The NAFC is a business unit of the National Council for fire and emergency services in Australia and New Zealand (AFAC). It is a member‑based, non-profit organisation with membership drawn from the fire and emergency services agencies of the Australian states and territories. The NAFC procures aerial firefighting aircraft, along with their maintenance, fuelling, crew and insurance (Binskin, 2020). It also coordinates the sharing of its fleet of contracted aircraft between fire agencies throughout Australia, together with the AFAC National Resource Sharing Centre (NRSC). Additionally, some state and territory agencies use a register of operators contracted by NAFC on a call‑when‑needed (CWN) basis.
The NAFC has a Strategic Committee that has committed to facilitating several safety actions for the aerial firefighting industry, such as assisting in the development of nationally consistent standards (including in relation to the education and training of agency personnel engaged in aerial operations) and strategies that identify and manage risk in aerial firefighting (NAFC, 2023a). Additionally, in 2023 following a review of groups such as the Fire Emergency Aviation Technical (FEAT) group, the NAFC established the national fire and emergency Aviation Safety Group (ASG) to reflect a stronger focus on aviation safety.
Fire agencies
In Australia, state and territory governments are primarily responsible for the management of fires within their borders. Each state or territory can have multiple agencies, all established by a separate Act of Parliament, with potentially overlapping responsibilities. For those states and territories with multiple fire agencies, separate agencies have primary responsibility for fires in metropolitan areas as opposed to bushfires or fires in state forests and national parks. Some agencies also have a central emergency management body and a state emergency management plan above them. The fire agencies relevant to this safety study are:
- Australian Capital Territory Rural Fire Service (ACT RFS) – ACT
- Bushfires Northern Territory (Bushfires NT) – NT
- Department of Biodiversity, Conservation and Attractions (DBCA) – WA
- Department of Energy, Environment and Climate Action (DEECA)1 – Vic
- Fire Rescue Victoria (FRV) – Vic
- Country Fire Authority (CFA) – Vic
- Department of Fire and Emergency Services (DFES) – WA
- New South Wales Rural Fire Service (NSW RFS) – NSW
- NSW National Parks and Wildlife Service (NPWS) – NSW
- Queensland Fire Department (QFD)2 – Qld
- South Australian Country Fire Service (SA CFS) – SA
- Tasmania Fire Service (TFS) – Tas.
Roles and types of firefighting aircraft
Aviation is an essential component of Australia’s response to bushfires. Although aircraft alone cannot control fires, they nevertheless play a significant role. A wide range of aeroplanes and helicopters are used to support fire operations. They are a mix of helicopters, large air tankers (LAT), single engine air tankers (SEAT), reconnaissance aircraft and special purpose aircraft.
As observed by the RCNNDA, no single aircraft type is considered universally more effective than others in aerial firefighting (Binskin and others, 2020). Their effectiveness depends on matching their capabilities with factors such as task objectives, weather conditions, terrain, distance from a refilling source, and take-off and landing requirements. The aircraft engage in various support roles including fire detection, scanning and mapping, firebombing (where a suppressant is dropped on, or near, the fire to prevent the fire from spreading), aircraft coordination and tactical supervision, and transport and logistics roles.
Aerial firefighting operators and pilots
Overall, approximately 500 aircraft provided by over 150 operators are available for aerial firefighting operations across Australia. During the 2025–26 fire season, over 30 operators were contracted to NAFC on behalf of the states and territories and provided 175 aircraft (NAFC, 2025a).3 The remaining firefighting aircraft fleet are made up from NAFC aircraft contracted as CWN and many aerial firefighting aircraft are also owned or contracted directly by the state or territory fire agencies. Operators engaged in aerial firebombing operations are generally required to have either a Civil Aviation Safety Regulations 1998 (CASR) Part 137 air operator’s certificate (AOC) or a CASR Part 138 aerial work certificate (AWC) (CASA, 2023) and must also meet certain standards for their aircraft and pilots that are contained in the NAFC contract.4
Aerial firefighting pilots are employed by the aircraft operators who either supply aircraft services to the NAFC or directly to state and territory agencies under contract.
NAFC-contracted aerial firefighting aircraft
According to NAFC (2025b), as of 12 December 2025, the NAFC had contracted 175 aircraft on behalf of the states and territories for the 2025–26 fire season. Of these 175 aircraft, approximately half (51%) were helicopters, with aeroplanes making up the remaining 49% of the fleet, of which 4% were LATs (Table 1) (NAFC, 2025b).
Table 1: Type and number of NAFC-contracted aircraft for the 2025–26 season5
| Aeroplanes or helicopters | Aircraft type | Number of aircraft | Proportion |
| Helicopters | Large helicopters | 18 | 10% |
| Small and medium helicopters | 71 | 41% | |
| Aeroplanes | LATs | 7 | 4% |
| Firebombers | 60 | 34% | |
| Reconnaissance | 15 | 9% | |
| Specialist intelligence | 4 | 2% | |
| TOTAL | 175 | 100% | |
The primary role of about 3 quarters (76%) of the 175 aircraft was firebombing, followed by air attack supervision (14%) (see Table 2 for details) (NAFC, 2025a).
Table 2: Primary role of NAFC-contracted aircraft for the 2025–26 fire season6
| Primary role | Number of aircraft | Proportion |
| Firebombing | 133 | 76% |
| Air attack supervision | 25 | 14% |
| Intelligence gathering | 10 | 6% |
| Air observation | 6 | 3% |
| Winching | 1 | 1% |
| TOTAL | 175 | 100% |
Operational environment
Aerial firefighting operations occur in an inherently hazardous environment. The NAFC issues a contract that aircraft operators must accept to provide aerial firefighting services. The contract describes the ‘operational environment’ and creates a contractual obligation for operators to accept it. The operational environment is characterised by the following features, as outlined in the NAFC specimen contract (2025a):
• meteorological conditions at extremes with weather conditions generating extreme turbulence
• significantly reduced visibility cause by smoke, low cloud, dust or precipitation
• terrain that may be unfamiliar to personnel
• remote locations with limited or no facilities or supplies
• risk of dehydration and fatigue on personnel
• tasks required outside normal business hours
• multiple aircraft operating in close proximity
• implied or express pressure to “get the job done” given the nature of the tasks, fire or emergency operations, particularly when life or property or livelihoods are threatened
• stress associated with large scale fire and emergency operations
• operations occurring at low level with hazards including the terrain, smoke, wires, obstructions, locusts or birds
• requirements to fly over water
• prolonged periods where services are required to be provided.
Method
The ATSB surveyed NAFC-registered aerial firefighting pilots for their perceptions on safety in Australian aerial firefighting operations. The full survey appears at Appendix B.
To develop the survey questions, the ATSB reviewed submissions to the Royal Commission (RCNNDA) for issues in aerial firefighting identified by industry stakeholders. Recent Australian aerial firefighting occurrences, including investigations, were also considered. This produced a list of questions focused on 4 main areas:
- tasking aspects
- communication
- reporting culture
- safety culture.
In addition, there was a section to collect respondents’ demographic information. The survey also provided opportunity for respondents to report their main perceived threats to safety and detail anything else they would like the ATSB to know about the safety of aerial firefighting in Australia.
A pilot survey was reviewed by ATSB flight operations investigators. The investigators were a mix of helicopter, aeroplane, and remotely piloted aircraft system (RPAS) pilots and non-pilots with other operational experience. Feedback on the survey questions was also obtained from the NAFC prior to the survey’s release. Questions were revised based on the feedback received, to aid understanding.
Survey design
The final version of the survey comprised 44 questions:
- 8 for demographic information
- 10 for tasking aspects
- 8 for communication
- 10 for reporting culture
- 8 for safety culture.
Most of the questions required fixed-choice answers primarily recorded on a 5-point Likert rating scale ranging from ‘(1) Strongly disagree’ to ‘(5) Strongly agree’ or from ‘(1) Poor’ to ‘(5) Excellent’. The remaining 11 questions required open-ended answers.
Questions that asked for a response in relation to ‘the previous 5 years’ were referring to the 5 years prior to 2022, that is, the period 2017–2022.
Demographic information on respondents was collected to analyse responses to see if a particular factor explained a proportion of the results or if there were any statistical differences between the groups.
The survey then asked a series of questions on the following 4 topics:
- tasking aspects
- communication
- reporting culture
- safety culture.
The questions relating to each topic are presented in the relevant chapter below.
The survey also provided opportunity for respondents to detail anything else they would like the ATSB to know about the safety of aerial firefighting in Australia.
Survey application
The survey was conducted online using the Qualtrics survey platform. A link to complete the survey was distributed via email on 6 December 2022 to the 763 pilots registered with NAFC who had worked in aerial firefighting within the previous 5-year period. A limitation with this sample is that it did not include any pilots who were not registered with NAFC. The survey was anonymous, allowing respondents to answer the questions freely without fear of negative repercussions.
A follow-up reminder for the survey was also sent. The survey was open until 19 January 2023. The Qualtrics survey platform registered 174 survey respondents out of the original 763 sample size. The data was ‘cleaned’ to remove surveys that were not at least two thirds complete and were also attempted in 5 minutes or less or were duplicate responses. After these surveys were excluded, 149 valid surveys remained, which is 20% of the pilots who were sent the original email.
Data analysis
Descriptive statistics were used to examine the distribution of responses per question. While the mean (M) and standard deviation (SD)7 were reported for some demographic questions, the median (Mdn)8 and the associated median absolute deviation (MAD)9 have been reported for most questions because the Likert scale has been treated as an ordinal variable (refer to Appendix C for details).
Inferential statistics were used to determine if there were any statistical differences between groups based on respondents’ demographic information (total flying hours, aerial firefighting experience, primary role, rate of pay in relation to hours flown, primary location of operation and the type of contract to which they operate). Due to the relatively small sample sizes from some locations, all inferential analyses based on location were done using 3 groups: NSW, Vic and a third group consisting of the remaining locations, namely SA, WA, QLD and NT (no respondents were from ACT).
Analyses are reported only when a significant result was found. Each type of respondents’ demographic information was also analysed by the remaining demographic information collected, to look for any inter-demographic differences.
Tests for statistical significance were conducted with a type 1 error rate10 set at p = .05, which is the standard level for the social sciences.11 This means that any inferential tests that returned a result of p ≤ .05 were considered to be statistically different (meaning the difference can be seen as reflecting the characteristics of the whole population).
Due to the data not being normally distributed, often having unequal variances, and containing some small sample sizes, the non-parametric Kruskal-Wallis test for multiple comparisons was used (Appendix C).12
If a statistical difference (p ≤ .05) was obtained from the Kruskal-Wallis test, an effect size13 was reported to indicate the strength of the association.14 Effect size for the Kruskal-Wallis test was measured using Epsilon-squared (ɛ²), as this does not rely on parametric assumptions of equal variance and normal distribution.
Post hoc comparisons using the Dunn’s test for multiple comparisons were made to determine which particular groups were statistically different. Effect size for the Dunn’s test was measured using the rank-biserial correlation for non-parametric tests (Appendix C).
For comparisons of only 2 independent samples, the non-parametric Mann-Whitney U test was used. To compare 2 sets of responses from the same respondents (that is, the results from 2 different questions), a Wilcoxon signed-rank test (non-parametric paired samples t-test) was used. Effect size for the Mann-Whitney U test and the Wilcoxon signed-rank test was measured using the rank-biserial correlation for non-parametric tests (refer to Appendix C for details of all statistical tests mentioned here).
The total number of responses for each question in the survey is recorded as N. In some cases, N is less than the number of respondents who completed the survey, as not all respondents answered every question. For questions requiring a free text response, the number of responses analysed is greater than the total number of respondents because some respondents provided more than one answer.
For qualitative, free-response questions, the data were coded independently by 2 ATSB researchers using qualitative coding and basic thematic analysis (Appendix C). Any discrepancies were discussed and resolved.
Demographic information
The survey included demographic questions that collected respondents’ information relating to the 5‑year period prior to the survey on the following factors:
- total flying hours
- aerial firefighting experience
- primary type and model of aircraft flown for aerial firefighting
- primary role performed (for example, firebombing or air attack supervisors (AAS))
- primary state or territory of operation
- main type of contract (call-when-needed (CWN) or primary)
- main type of rate of pay (dependent or independent of hours flown).
Total flying hours
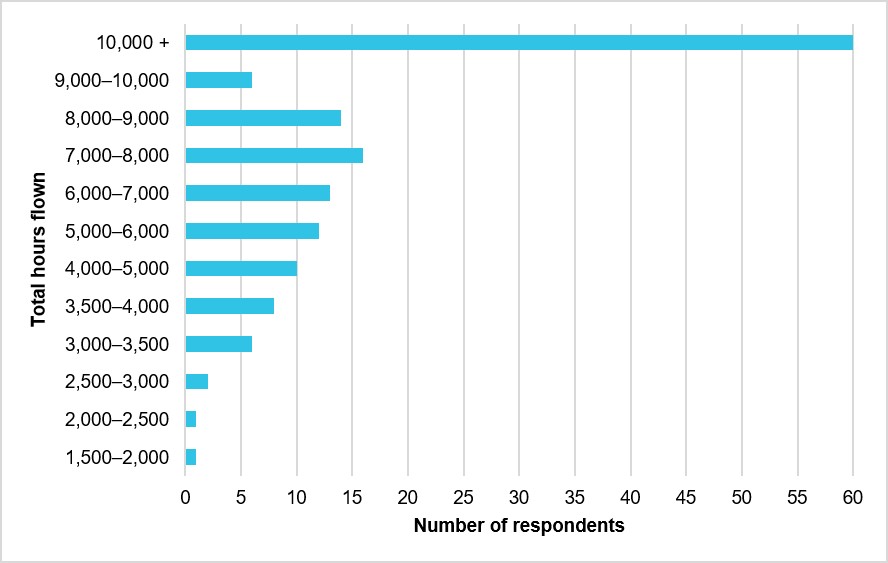
Respondents’ total hours flown on average at the time of the survey are shown in Figure 1. The total hours flown for each pilot ranged from between 1,500–2,000 to over 10,000 hours (M = 7,000–8,000 hours, SD = 2.82). However, at least 80% of pilots surveyed had over 5,000 hours flying experience, while 40% (60) of the 149 respondents had over 10,000 hours flying experience (mode15 = 10,000+ hours).
Figure 1: Total flying hours (N16 = 149)
Total aerial firefighting experience (in hours)
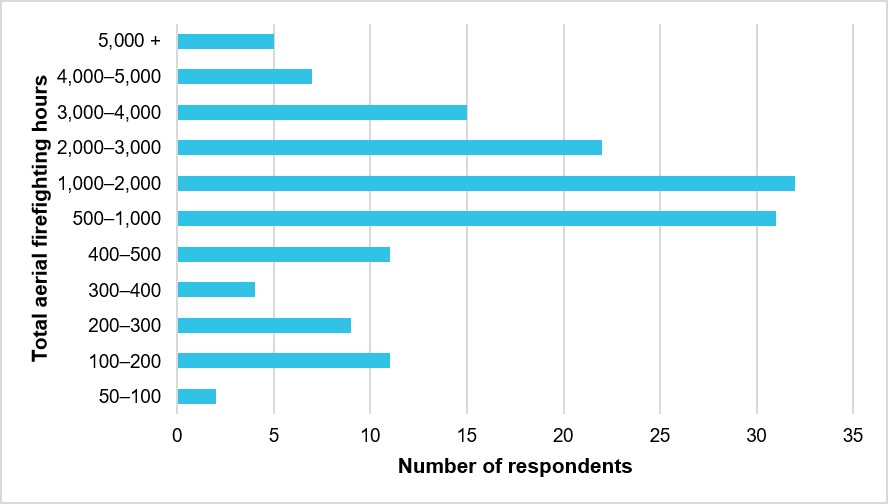
Respondents’ total aerial firefighting experience in hours is shown in Figure 2. Respondents’ total aerial firefighting hours ranged from 50–100 hours to over 5,000 hours (M = 1,000 hours, SD = 2.31). The most frequent responses (mode) were 500–1,000 hours and 1,000–2,000 hours with 31 and 32 respondents respectively, out of 149 total respondents, meaning 42% of all respondents had between 500–2,000 total aerial firefighting hours.
Figure 2: Total aerial firefighting experience (in hours) (N = 149)
Aerial firefighting experience between 2017 and 202217 (in hours)
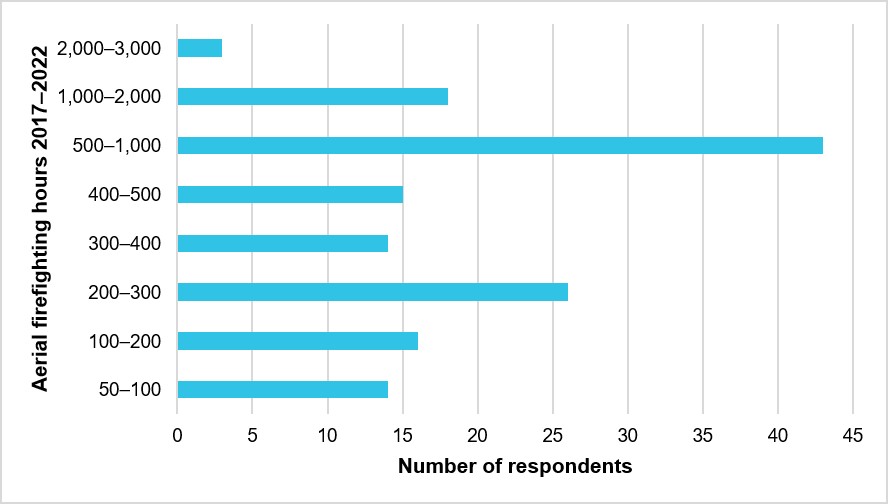
The number of aerial firefighting hours respondents had flown between 2017 and 2022 ranged from 50–100 hours to 2,000–3,000 hours (M = 500 hours, SD = 1.99) (Figure 3). The most frequent response (mode) was 500–1,000 hours, with just under a third (29%) of respondents reporting this amount of aerial firefighting hours between 2017 and 2022.
Figure 3: Aerial firefighting experience 2017–2022 (in hours) (N = 149)
Primary type and model of aircraft flown
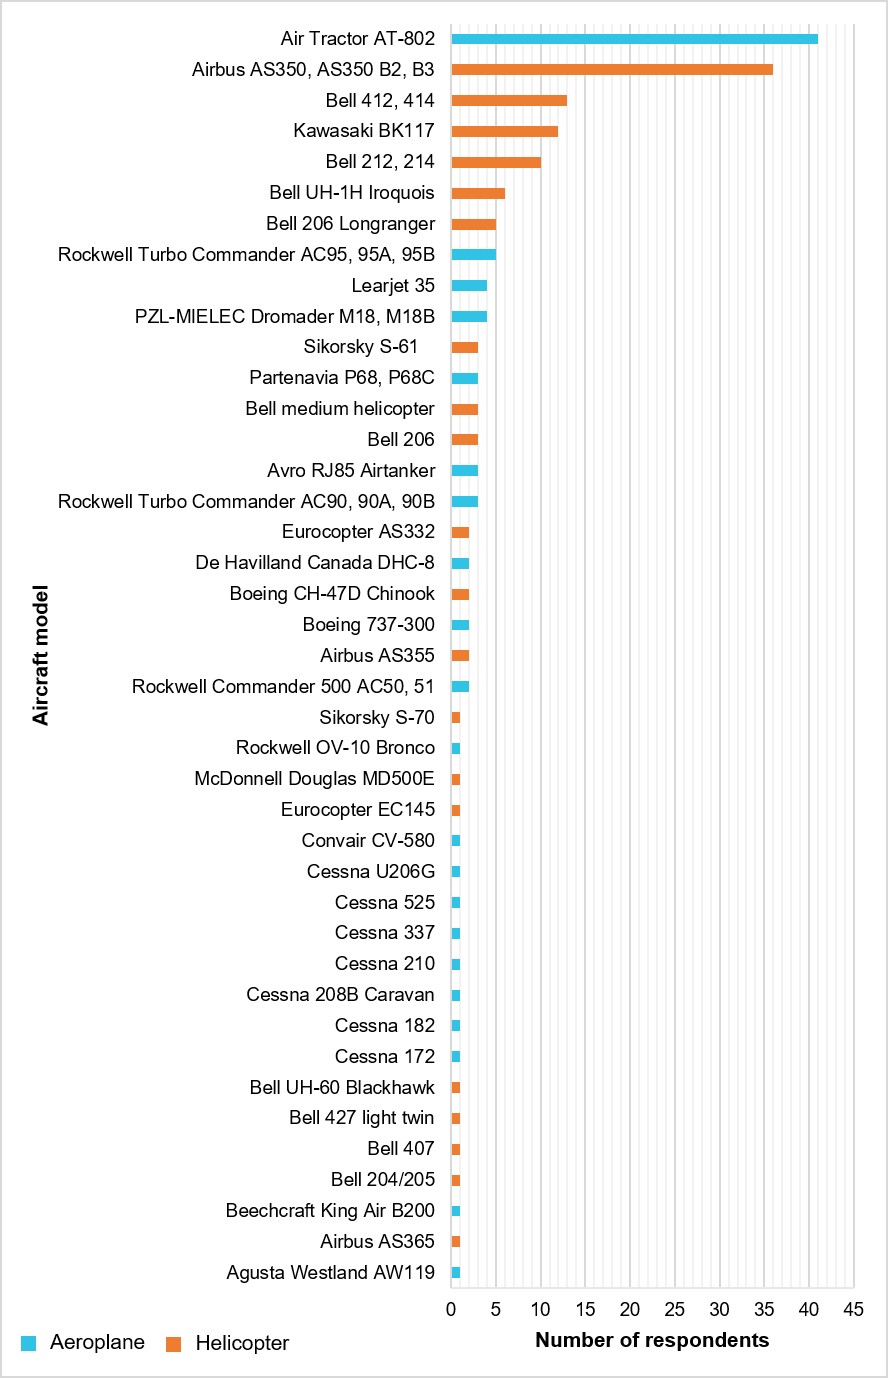
Respondents’ primary type and model of aircraft flown between 2017 and 2022 is shown in Figure 5. One hundred and eighty-five responses were provided by 149 respondents, with some respondents reporting more than one aircraft model. The most common aircraft model was the Air Tractor AT-802 aeroplane with 41 out of 149 respondents, followed by the Airbus AS350 helicopter and its variants with 36 respondents. Together, these aircraft models represented 42% of all respondents. Overall, 43% of respondents reported flying aeroplanes, and 57% reported flying helicopters (Figure 4).
Figure 4: Number of aeroplanes versus helicopters flown by respondents18
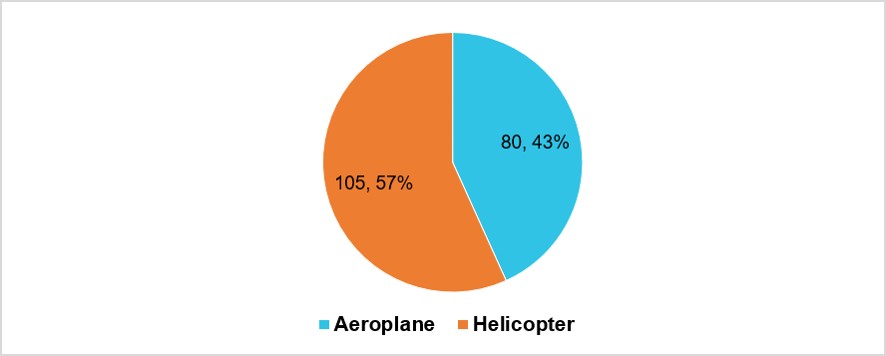
Figure 5: Respondents’ primary aircraft type and model flown (N = 149)
Primary role
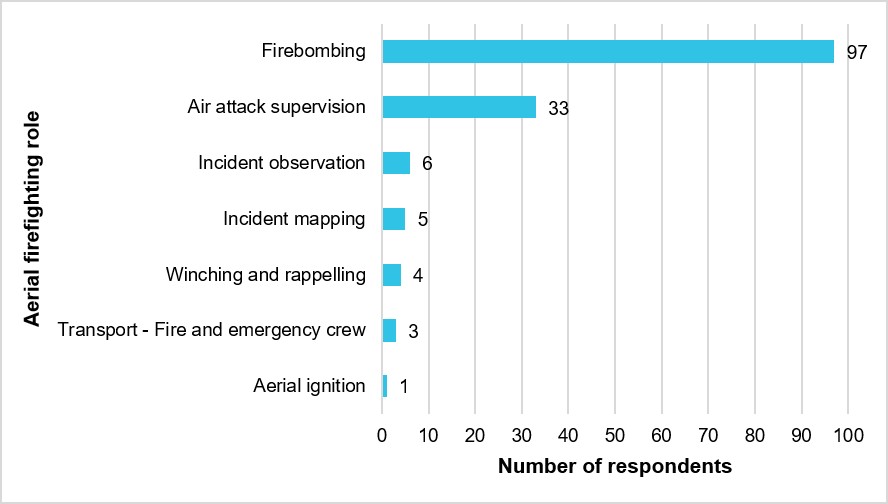
As shown in Figure 6, almost two thirds (65%) of respondents reported that their primary role was firebombing operations, followed by 22% of respondents with air attack supervision. The dominance of firebombing and air attack supervision roles for respondents is consistent with the primary roles of NAFC-contracted aircraft for the 2025–26 fire season (see NAFC-contracted aerial firefighting aircraft).
Figure 6: Respondents’ primary role (N = 149)
Primary state/territory of operation
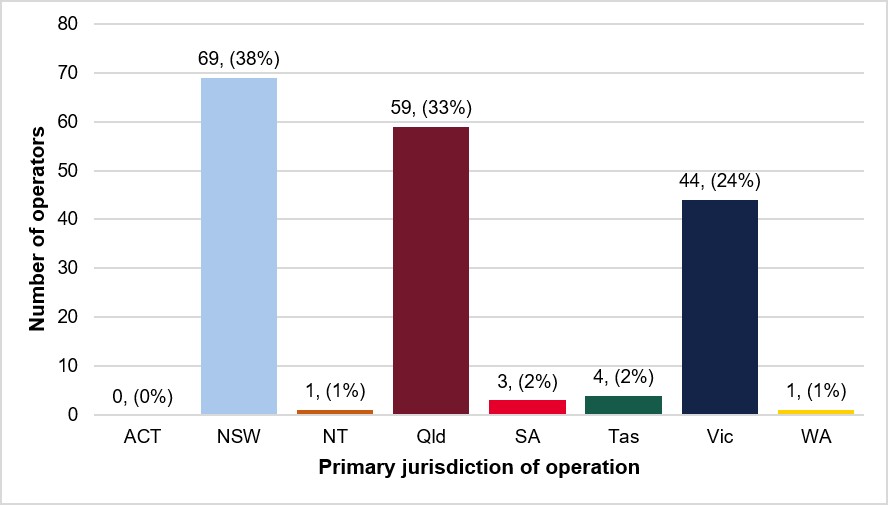
Respondents’ primary jurisdiction of operation within Australia between 2017 and 2022 is shown in Figure 7. Just under half (49%) of all respondents were operating primarily in New South Wales (NSW). A further 23% were operating primarily in Victoria (Vic). There were no responses from pilots operating in the Australian Capital Territory (ACT), and only 1 from the Northern Territory (NT). Although low, these numbers correspond to the number of operators registered in ARENA between 2017 and 2022. It is to be expected that a larger proportion of respondents would be from NSW because NSW had the largest number of aerial firefighting operators (38%) contracted in ARENA19 at the time of the survey (Figure 8). Respondents from Qld, however, made up only 6% of the total survey sample, yet Qld operators constituted 33% of all aerial firefighting operators registered in ARENA between 2017 and 2022. A limitation of this survey, therefore, is that the proportion of pilots who primarily operate in Qld is not representative of the proportion of Qld pilots registered in ARENA at the time. To address this limitation and the relatively small sample sizes of some other locations, inferential statistics were conducted using 3 main groups (refer to Data analysis for more details).
Figure 7: Respondents’ primary location of operation (N = 149)
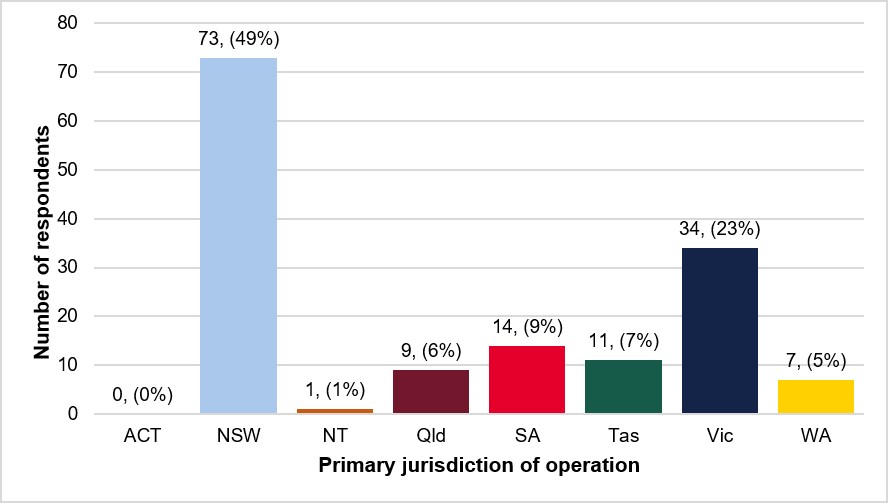
Figure 8: Aerial firefighting operators registered in ARENA by location, 2017–2022
Type of contract
Figure 9 shows the proportion of respondents who operated under a primary contract20 between 2017 and 2022, compared to those who operated under a call-when-needed (CWN) contract. Just over two thirds of the respondents operated under a primary contract with NAFC and/or a fire agency (69%), compared to just under a third of respondents (32%) who operated under a CWN contract (Figure 9).
Figure 9: Respondents’ type of contract21
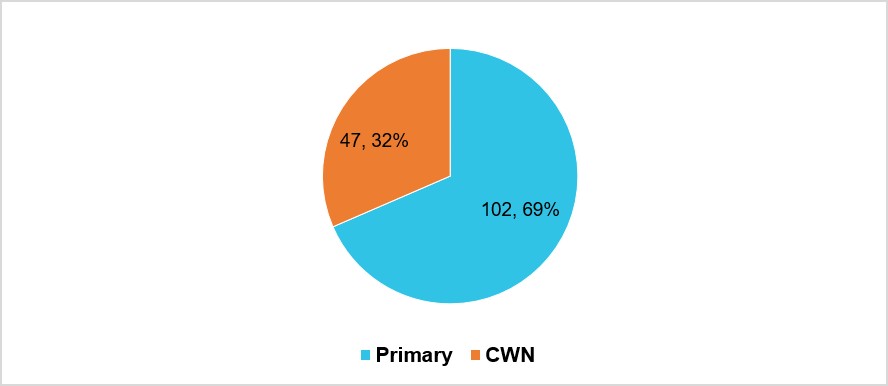
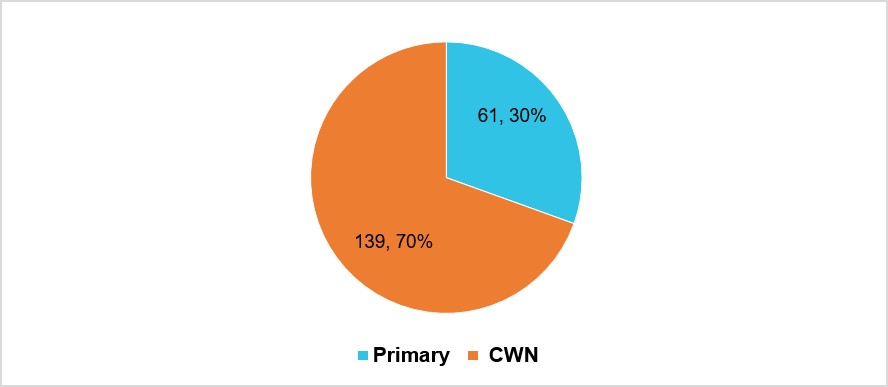
This distribution between the 2 contract types for the respondent pilots is almost exactly inverse to the distribution of operators’ contracts within ARENA at the time of the survey (Figure 10). This means that the proportion of respondents operating to a primary versus CWN contract in this survey sample is not representative of the proportions of these contracts within the population from which this sample is drawn. It is possible that this difference reflects that a greater number of pilots were required for the primary rather than CWN contracts, given that the number of pilots that are hired under each operator contract with NAFC is unknown and may vary depending on the number of aircraft provided per contract. A more likely explanation, however, is that pilots operating under primary contracts were more likely to complete the survey and were therefore overrepresented in this sample.
Figure 10: Aerial firefighting operators’ type of contract in ARENA, 2017–2022
Type of contract by primary location of operation
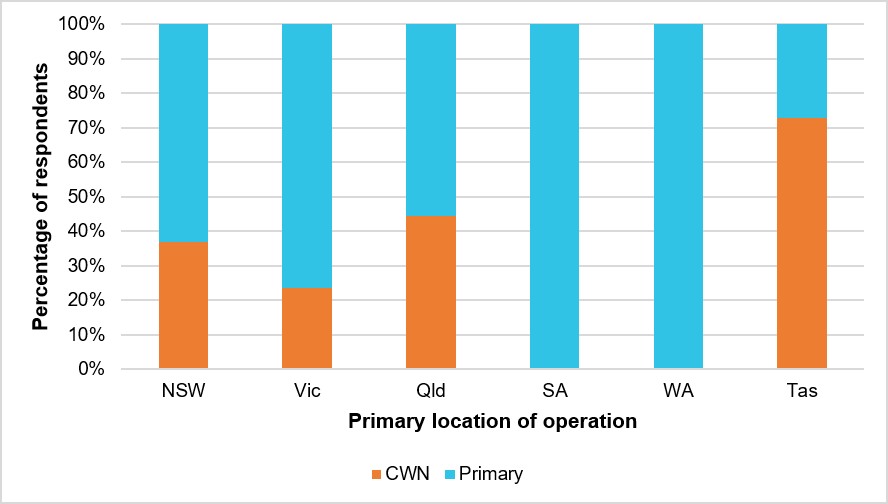
Figure 11 shows the percentage of respondents operating under either a primary or CWN contract within each primary location of operation. Tas had the highest proportion of respondents operating under a CWN contract with 73%, followed by Qld with 44%. In contrast, all respondents (100%) from SA and WA operated under a primary contract.22
Figure 11: Percentage of respondents’ type of contract, by primary location of operation
Type of main rate of pay
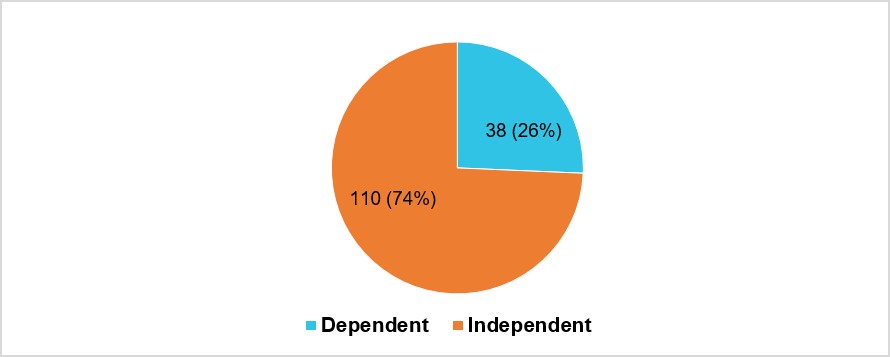
As shown in Figure 12, approximately three quarters of respondents’ main rate of pay is independent of their hours flown, compared to just over a quarter of respondents whose pay is dependent on them.
Figure 12: Respondents’ main rate of pay (N = 149)
Tasking aspects
Background
The tasking and dispatch of aircraft is generally coordinated by the states and territories through a central mechanism such as an air desk. State air desks (SADs) are multi‑agency teams that coordinate aerial firefighting aircraft operations. They manage the requests for aircraft and arrange their dispatch (Binskin and others, 2020). Using the example of the guidelines contained in the ACT and NSW Interagency aviation standard operating procedures, a SAD tasks aircraft based on considerations such as:
• Mission objective in accordance with Incident Strategy
• Threats (life, property, assets and/or forests)
• Terrain and fuel types (forest/grassland/urban interface)
• Prevailing and/or forecast weather and flying conditions
• Effectiveness of alternate capacity aircraft and/or ground units
• Elapsed time for aircraft to arrive ‘on site’; including turbulence
• Time of day (last light)
• Suppressant / Retardant quantity required (if applicable).
Some SADs also utilise a series of questions when considering the allocation of aircraft to fires, for example those that are outlined in an internal Emergency Management Victoria guidance note for the allocation of firefighting aircraft, including:
• Are there clear objectives for the deployment?
• Are aircraft able to be used safely?
• Are the aircraft missions and tasking priorities consistent with the State control priorities?
• Can aircraft do productive work and is it integrated with a ground attack?
• Is this the most productive and efficient tasking for the aircraft?
• Is this the most suitable aircraft for the proposed mission?
• Is the aircraft doing work that cannot be done by ground crews (or is more effective than ground crews alone)?
The tasking and dispatch of aircraft by SADs and others has the potential to introduce unacceptable operational risks to flight operations. Two recent ATSB investigations into aerial firefighting occurrences highlighted factors that increased risk relating to tasking by fire agencies, such as:
- LAT tasking procedures, incomplete tasking information and the application of tasking rejection procedures (AO-2023-054)
- the absence of tasking rejection procedures and an overreliance on the pilot to assess risk and determine the suitability of a task (AO-2020-007).
As a result, some tasking agencies have developed procedures to address these issues.
The survey also explored several other areas of potential risk that could be introduced by tasking. To allocate aircraft and other resources effectively and safely, SADs and other fire agency personnel are required to maintain situation awareness of a dynamic situation while managing complex information flows. For larger scale operations, these types of decisions are often made under conditions of high pressure and workload, and long hours.
The little research examining the tasking and dispatch of aircraft for aerial firefighting operations focuses on issues of firefighting efficiency and effectiveness, rather than the potential to introduce safety risks. However, research examining the coordination of responses to bushfires in Australia found that errors in decision-making arise from factors such as information uncertainty, fatigue, coordination complexities and procedural violations (Brooks and others, 2018).
Further, as outlined in Part A of this safety study(AS-2021-015a), the tasking of aircraft to assist in firefighting is at times subject to pressure arising from public or political expectation and the inherent need to save lives and homes. A number of studies of aviation tasking for US wildfires have indicated that ‘proximity to people and property is a strong driver of aerial-suppression’, such that aircraft are preferentially used over ground crew when fires threaten homes or infrastructure (Magstadt and others, 2026). A reliance on aircraft in these high-pressure situations increases the risk of aircraft being tasked in unsuitable or unsafe conditions. An implicit or explicit pressure to fly and ‘save lives’, together with factors that often characterise firefighting such as long duty hours, high workload and demanding physical and environmental conditions also increases the risk of tasking that results in pilots flying when fatigued.
The survey questions related to tasking asked respondents about:
- the suitability of tasking demands for the capabilities of the pilot, aircraft and equipment
- fatigue
- the prioritisation of safety over task completion
- the aviation training and experience of fire agency personnel tasking aircraft
- pressure to complete a task in adverse conditions and mechanisms to reduce that pressure
- task refusal.
Realism of task demands
Three quarters of respondents (75%) either agreed or strongly agreed that task demands were realistic in terms of meeting the capabilities of the pilot, aircraft and equipment (Mdn = 4).23 Only 15% of respondents thought that task demands were unrealistic, with the remaining 10% neither agreeing nor disagreeing (Figure 13).
Figure 13: Respondents’ degree of agreement that task demands were realistic (N = 149)
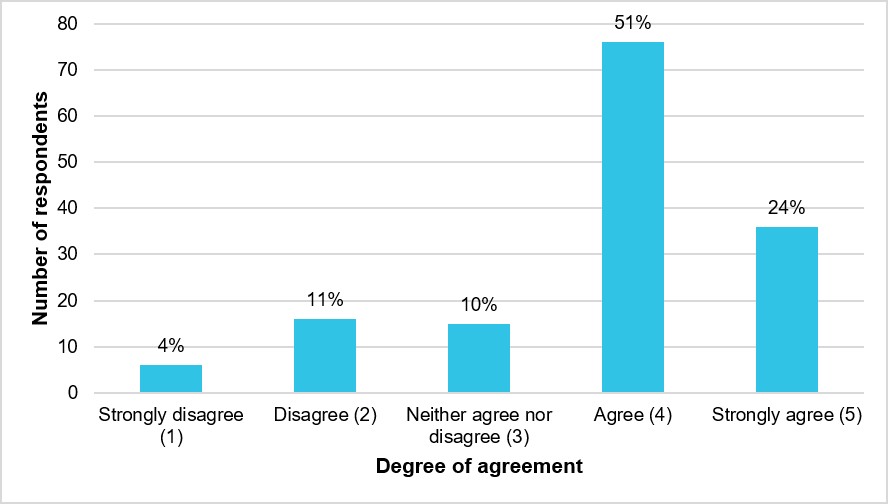
Respondents’ degree of agreement that task demands were realistic was analysed by their demographics. No statistical differences based on these characteristics were found, except for by respondents’ location.
Realism of task demands by respondents’ location
Compared to respondents from all other locations, respondents from NSW and Vic were statistically more likely to disagree that task demands were realistic. Additionally, overall NSW and Tas respondents were the most likely to strongly disagree or disagree with this statement, and NSW and Vic respondents were the least likely to agree or strongly agree. Respondents from WA, SA and Qld were the most likely to agree that task demands were realistic (Appendix D, Realism of task demands, by location).
Fatigue affecting ability to operate safely
Three quarters (75%) of respondents disagreed or strongly disagreed that they had felt a level of fatigue that affected their ability to complete assigned tasks operating or positioning the aircraft (Mdn = 2). Only 14% out of 149 respondents agreed or strongly agreed with this statement (Figure 14). Most respondents, therefore, reported that fatigue had not affected their ability to operate safely.
Figure 14: Respondents’ degree of agreement that they had felt a level of fatigue that affected their ability to operate safely (N = 149)
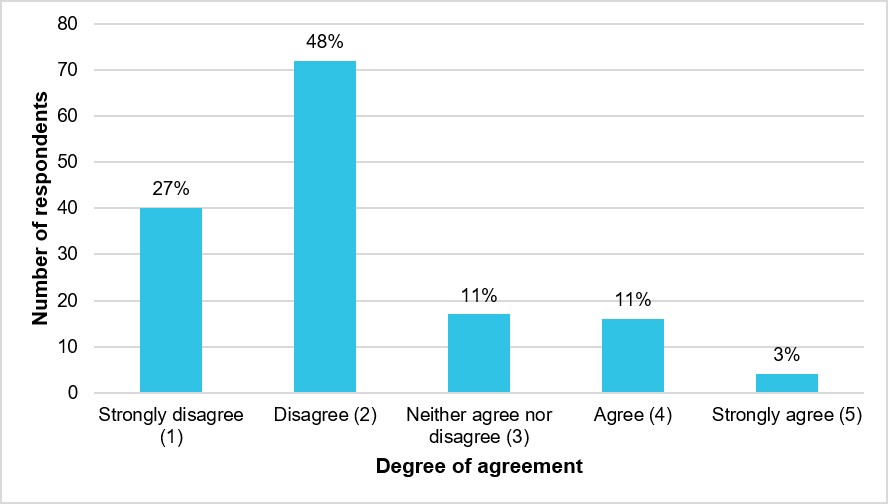
Tasking outside duty period limits
Responses about being tasked outside duty periods were also largely positive, with almost three quarters (72%) of respondents strongly disagreeing or disagreeing that they had been asked to complete safety sensitive tasks outside a duty period (Mdn = 2), while only 17% agreed or strongly agreed with the statement (Figure 15).
Figure 15: Respondents degree of agreement that they had been asked to complete safety sensitive tasks outside of a duty period (N = 149)
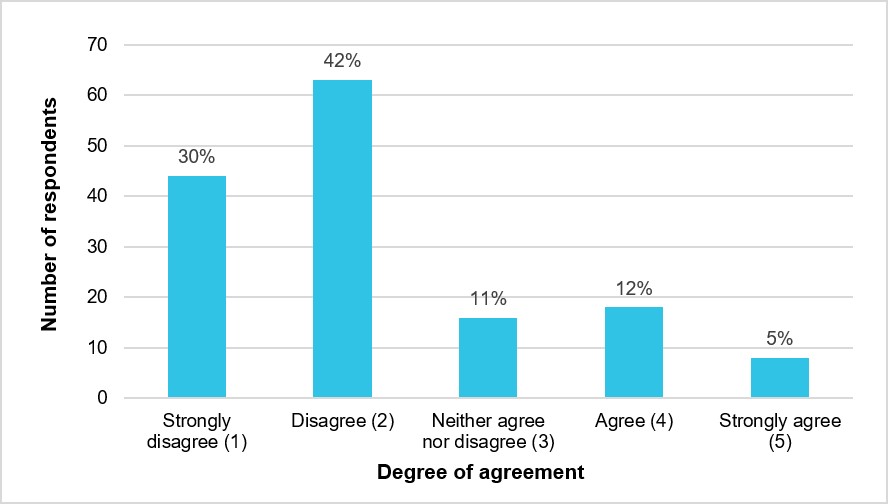
Level of fatigue by tasking outside duty period limits
To determine if respondents’ reported fatigue was due to normal operating conditions or coincided with being tasked by the fire agency to operate outside of their duty period, respondents who agreed or strongly agreed that they had felt a level of fatigue that affected their ability to operate safely were compared with those who agreed or strongly agreed that they had been asked to complete safety sensitive tasks outside of their duty period.
Examining the number of respondents who either agreed or strongly agreed with both statements shows that of the 26 respondents who either agreed or strongly agreed that they had been asked to complete safety sensitive tasks outside their duty period, only 4 agreed or strongly agreed that they had felt a level of fatigue that affected their ability to operate safely (Table 3).
Table 3: Respondents’ degree of agreement with feeling a level of fatigue by being tasked outside a duty period
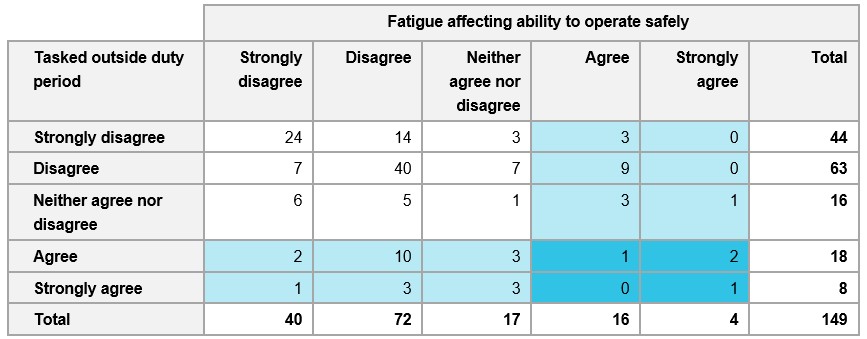
It is reasonable to conclude, therefore, that most respondents who reported feeling a level of fatigue that affected their ability to operate safely were not doing so because they had been asked to complete safety sensitive tasks outside of their duty period.
Safety prioritised over task completion
Just under 60% of respondents agreed or strongly agreed that between 2017 and 2022, pilots were encouraged to prioritise safety over task completion by external tasking agencies (Figure 16). However, there was over a quarter of respondents (29%) who either disagreed or strongly disagreed (Mdn = 4).
Figure 16: Respondents’ degree of agreement that pilots were encouraged to prioritise safety over task completion by external tasking agencies (N = 149)
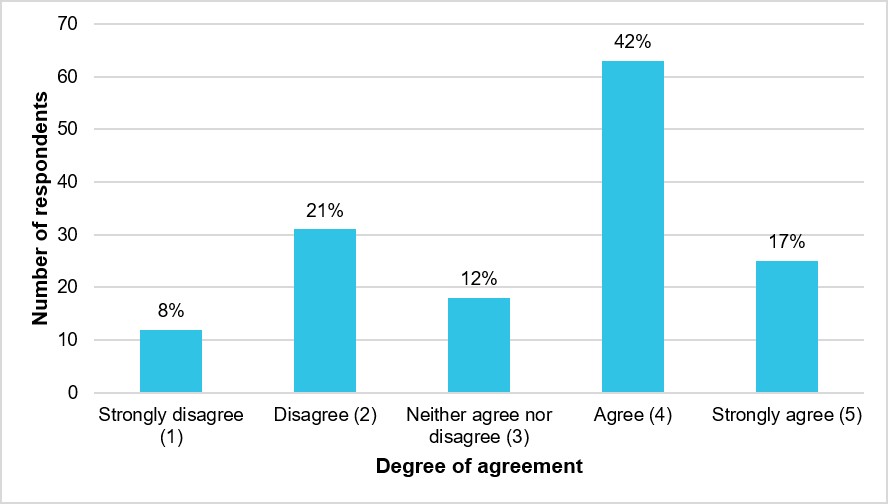
The responses were analysed by the respondents’ demographic information and no statistical differences were found, except for by respondents’ location.
Safety prioritised over task completion, by location
NSW respondents were statistically less likely to agree that pilots were encouraged to prioritise safety over task completion by external tasking agencies than respondents from all other locations. Respondents from SA and Qld had the highest amount of agreement that pilots were encouraged to prioritise safety over task completion by external tasking agencies (Appendix D, Safety prioritised over task completion, by location).
Aviation training and experience of decision‑makers
Overall, out of all the questions on tasking, respondents were the least positive about the aviation training and experience of decision‑makers. Just over half (51%) of respondents disagreed or strongly disagreed that decision‑makers directing aircraft had sufficient aviation training and experience, while just under a quarter of respondents (24%) agreed or strongly agreed with this statement (Mdn = 2.5) (Figure 17).
When respondents’ degree of agreement that decision‑makers directing aircraft had sufficient aviation training and experience was analysed by their demographics, no statistical differences were found, except for by location.
Figure 17: Respondents’ degree of agreement that decision‑makers directing aircraft had sufficient aviation training and experience (N = 149)24
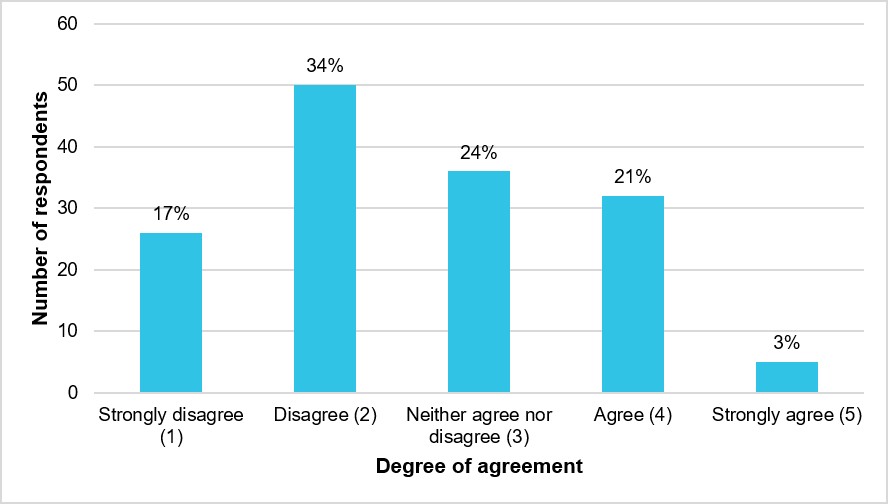
Aviation training and experience of decision‑makers, by location
NSW and Vic respondents were statistically more likely to think that decision‑makers directing aircraft did not have sufficient aviation training and experience than respondents from the remaining locations. NSW respondents were also statistically more likely to think this than respondents from Vic. Respondents from Qld were the most likely to agree or strongly agree that decision‑makers had sufficient training and experience (Appendix D, Aviation training and experience of decision‑makers, by location).
External pressure to complete task
Just over half of respondents (51%) either disagreed or strongly disagreed that they had felt external pressure to accept or complete a task in adverse operating conditions (Figure 18). However, just over a third of respondents (35%) agreed or strongly agreed with the statement (Mdn = 2).
Figure 18: Respondents’ degree of agreement that they had felt external pressure to accept or complete a task in adverse operating conditions (N = 149)
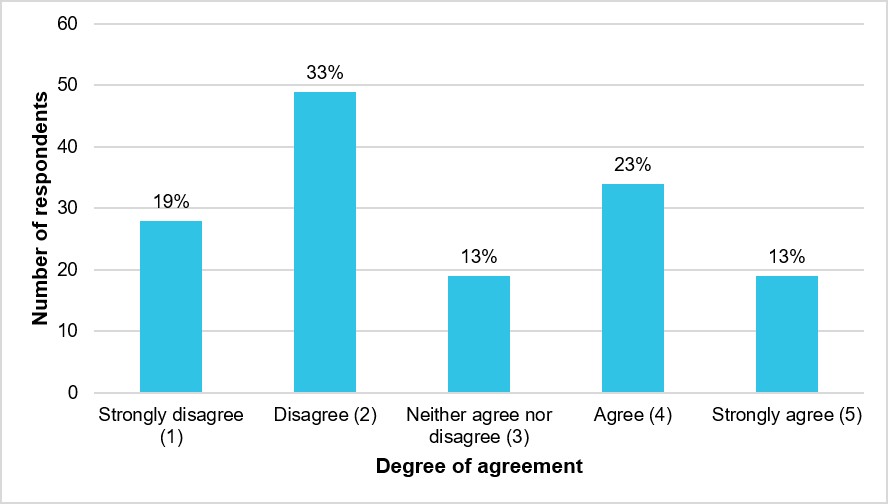
When respondents’ degree of agreement that they had felt external pressure to accept or complete a task in adverse operating conditions was analysed by their demographics, no statistical differences were found, except for by location.
External pressure to complete task by location
Compared to respondents from all other locations, respondents from NSW and Vic were statistically more likely to agree that they had felt external pressure to accept or complete a task in adverse operating conditions. NSW respondents were also statistically more likely to agree than Vic respondents. Qld respondents were the most likely to disagree or strongly disagree that they had felt external pressure to accept or complete a task in adverse operating conditions (Appendix D, External pressure to complete task by location).
Adequate mechanisms to reduce pressure
Almost half of respondents (45%) either agreed or strongly agreed that there were adequate mechanisms in place to reduce the pressure experienced, with 28% either disagreeing or strongly disagreeing, and the remaining 27% providing a neutral response (Mdn = 3) (Figure 19).
Figure 19: Respondents’ degree of agreement that there were adequate mechanisms in place to reduce the pressure experienced (N = 149)
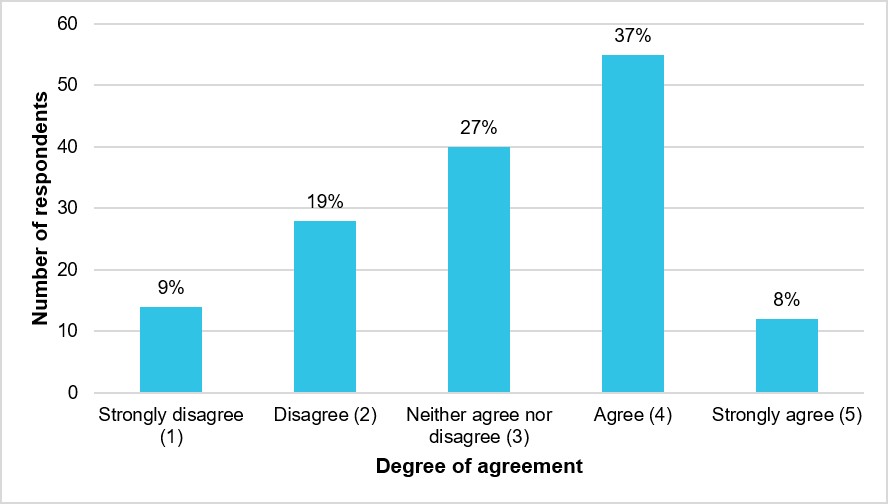
When respondents’ agreement there were adequate mechanisms in place to reduce the pressure experienced was analysed by their demographics, no statistical differences were found, except for by location.
Adequate mechanisms to reduce pressure, by location
Compared to respondents from all other locations except Vic, respondents from NSW were statistically more likely to disagree or strongly disagree that adequate mechanisms were in place to reduce the pressure experienced. In contrast, no SA respondents disagreed or strongly disagreed with this statement, and respondents from WA were the most likely to agree or strongly agree that there were adequate mechanisms in place to reduce the pressure experienced (Appendix D, Adequate mechanisms to reduce pressure, by location).
Task refusal due to safety concerns
Over two thirds of respondents (69%) had refused to conduct an assigned task due to safety concerns between 2017 and 2022, while 31% had not (Mdn = 2).
Frequency of task refusal due to safety concerns
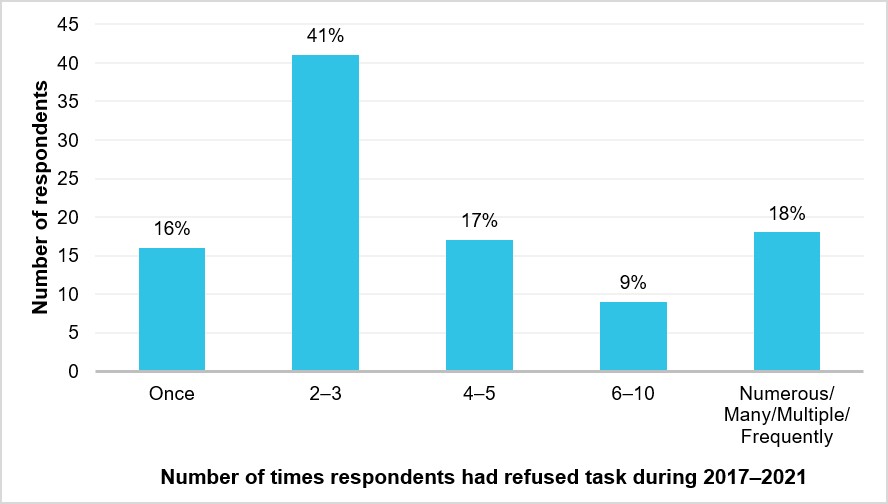
Respondents were asked how many times they had refused a task due to safety concerns between 2017 and 2022. This was an open response question, with 101 of the 103 respondents who answered yes to having refused a task due to safety concerns answering this question. As seen in Figure 20, over half of respondents (57%) had refused to do a task because of safety concerns between 2017 and 2022 either once (16%) or 2–3 times (41%). Just over a quarter of respondents (26%) had refused a task between 4–10 times in the 5-year period, with a further 18% having refused a task for safety concerns at least ‘numerous’/‘many’/‘multiple’ times, including some who had refused a task for safety reasons ‘frequently’/‘regularly’/‘dozens’ of times.
Figure 20: Number of times respondents had refused a task due to safety concerns between 2017 and 2022 (N = 101)
Reasons for refusals and what happened afterwards
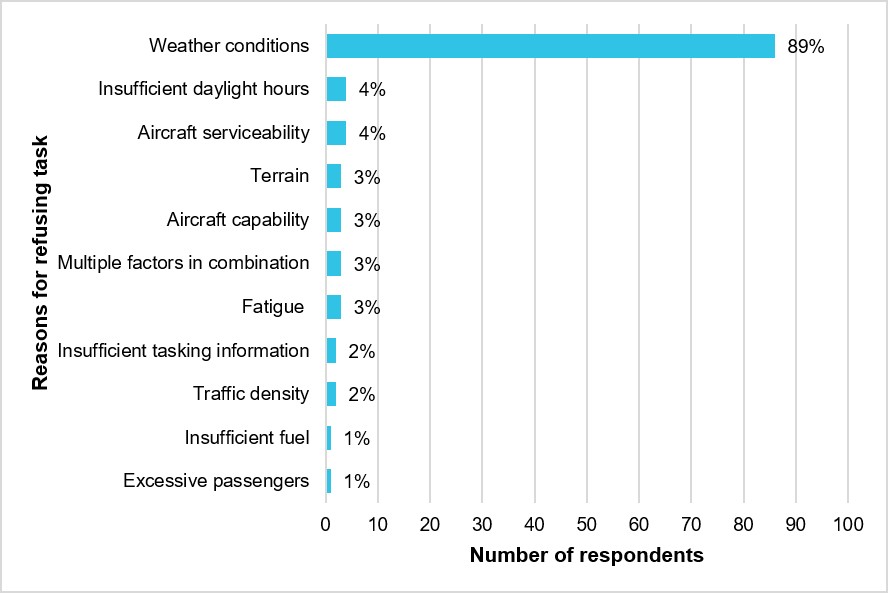
Of the 101 respondents who answered the question on the number of times they had refused a task due to safety concerns, 97 provided reasons for their refusals, resulting in 124 total responses. The majority (79%) of the reasons provided for refusing a task due to safety concerns related to weather conditions (high winds/turbulence/poor visibility). The other reasons for refusing a task, as well as the number and percentage of respondents who listed each reason, can be seen in Figure 21.
Figure 21: Reasons for refusing a task due to safety concerns and percentage of respondents who listed each reason (N = 97)25
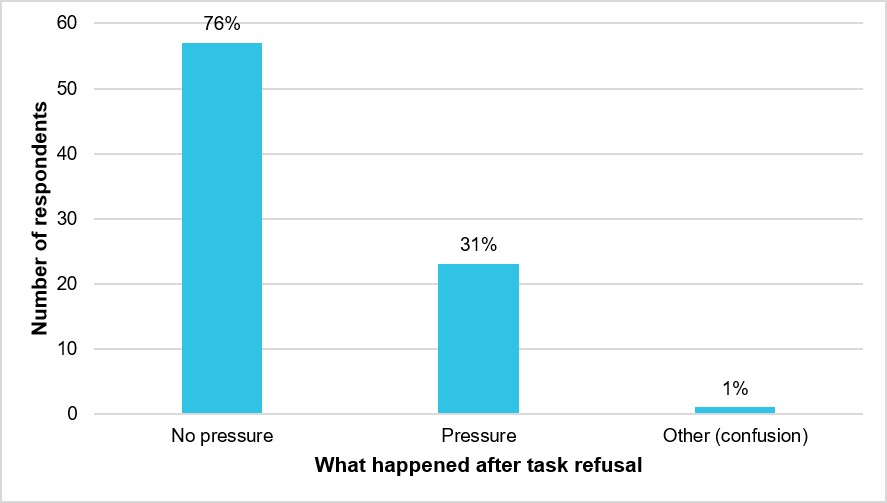
Respondents were also asked what happened after they refused a task due to safety concerns (Figure 22). Seventy-five respondents provided 98 responses to this question.26 Some respondents reported incidences of both pressure and no pressure following task refusals. Just over three quarters (76%) of respondents stated that no pressure was applied after refusing a task for safety reasons, from either the tasking agency or the operator. Just under a third (31%) of respondents reported pressure being applied by the tasking fire agency to fly.27 An additional respondent reported ‘confusion’ following their task refusal.
Figure 22: What happened after respondents refused a task due to safety concerns? (N = 75)28
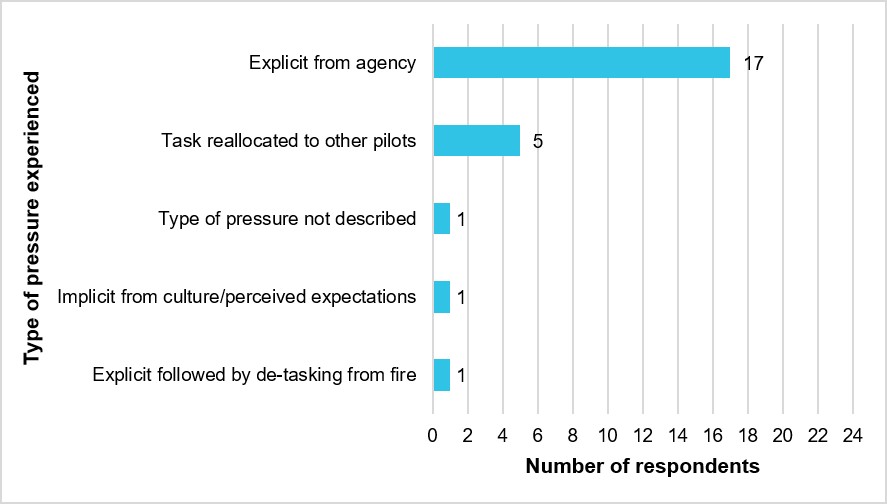
As shown in Figure 23, of the 23 respondents (31%) who reported experiencing pressure from their tasking agency, most (17 respondents, 74%) described explicit pressure being applied by tasking agency personnel in the form of:
- repeated/multiple requests to fly or reconsider the decision not to fly
- being ordered to carry out the task
- verbal abuse and threats of repercussions for not flying.
An additional respondent described experiencing not only explicit pressure but also retribution for refusing a task in the form of being de-tasked from the fire. The remaining descriptions of the type of pressure experienced involved implicit pressure in the form of the task being allocated to more willing pilots or feeling ‘looked down on’ for not flying when others did. Finally, one respondent did not provide details of the type of pressure experienced.
Figure 23: Type of pressure experienced by respondents after task refusal (n29 = 22)
Communication
Background
Radio communications
To perform their duties, aircrew in aerial firefighting aircraft are required to communicate with other pilots and air attack supervisors (AASs),30 and tasking personnel. Aircraft operating on a state or territory border may need to communicate with fire agencies and aircraft from both sides. Further, aerial firefighting often involves multiple aircraft operating in a relatively small airspace in challenging conditions. These factors mean effective radio communication between aircrew is essential for maintaining situation awareness and managing the risk of collision. Aircrew at times must also be able to communicate directly with groundcrew when tasked in direct support of their operations. Radio communication is also used to task aircraft and coordinate the order of aircraft entering the fireground or approaching a water site. The AAS relies on radio communication to direct operations and provides critical situation awareness to the overall operation.
Communication around the fireground for aerial firefighters primarily uses aircraft band (airband) very high frequency (VHF) radio,31 with existing airspace frequencies and/or discrete frequencies allocated by the tasking agencies. It may also occur over discrete agency-allocated ultra high frequency (UHF) frequencies for communication with groundcrew, or via mobile phone. As well as managing different types of communication devices, pilots reportedly monitor up to 5 frequencies at a time (CASA, 2023). Verone (2012) highlights some of the challenges of radio communication on the fireground, including monitoring multiple channels, excessive or unnecessary radio transmissions, and the use of different radio systems between organisations. Such issues, Verone (2012) argues, largely go unnoticed for smaller incidents, but become a problem for larger-scale incidents when the system is under pressure. Communication processes were highlighted as a factor increasing risk in ATSB investigation AO-2023-054 regarding cross-border coordination procedures and ensuring that fire common traffic advisory frequencies (CTAFs) were reliably known by all relevant personnel. CASA has also identified communication equipment and procedures as one of 5 ‘significant issues’ facing aerial firefighting.
Communication processes underpinning safety culture
Employee engagement and the degree of collaboration between management and employees in managing safety have been identified as a key factor in developing and maintaining a positive safety culture (Cooper, 2018; Biggs and others, 2005). Within a positive safety culture, employees work in partnership with management. They are involved in safety decisions and have the leverage to initiate and achieve safety improvements (Cooper, 2018; Weigmann and others, 2004). Overall, as Cooper (2018) observes, ‘the underlying principle is to do safety with people, not at them.’
Accordingly, the survey also addresses the quality of interactions between tasking agencies and pilots relating to safety matters. This includes the extent to which there is collaboration between pilots and fire agencies on safety matters, debriefing on incidents or close calls and whether pilots’ suggestions for improving safety are encouraged and facilitated. These are some of the communication processes that underpin a positive safety culture, and specifically the elements of an informed and learning culture (refer to AS-2021-015a for further details).
Survey questions related to communication asked respondents about:
- radio communication around the fireground
- the communication of task-related safety information
- the quality of interactions between pilots and tasking agencies
- the timeliness of flight following32
- the briefing/debriefing of incidents or close calls with tasking agencies
- pilot and fire agency personnel collaboration on safety issues
- tasking agencies’ encouragement of pilots’ suggestions for improving safety.
Radio communication around the fireground
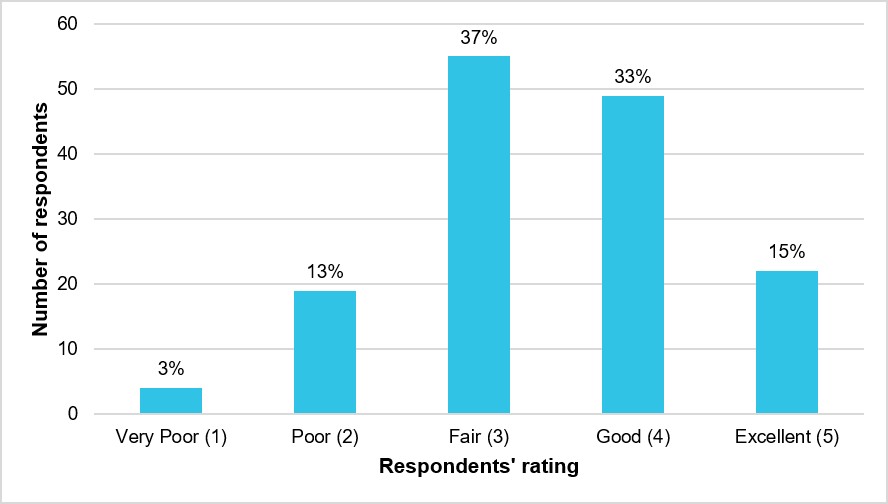
Respondents were asked how well radio communication around the fireground was managed. Overall, respondents rated radio communication around the fireground as ‘fair’ (Mdn = 3). As can be seen in Figure 24, almost half of respondents (48%) rated radio communication on the fireground as either good or excellent, with 37% rating it fair, and only 16% rating it poor or very poor.
Figure 24: How well radio communication around the fireground was managed (N = 149)33
Communication of safety information
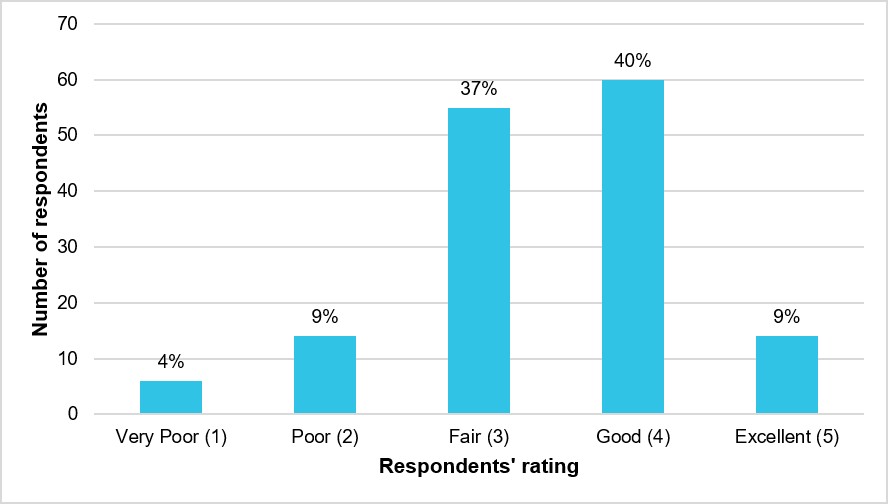
On average, respondents rated the communication of safety information about the task and fireground to pilots as ‘fair’ to ‘good’ (Mdn = 3, mode = 4). As can be seen in Figure 25, about half (49%) of respondents rated the communication of safety information about the task and fireground as either good or excellent. Only 13% of respondents rated it as very poor or poor, with 37% rating it as fair.
Figure 25: How well safety information about the task and fireground was communicated to pilots (N = 149)
When respondents’ rating of the communication of safety information about the task and fireground was analysed by their demographics, no statistical differences were found, except for by location.
Communication of safety information, by location
Respondents from NSW and Vic were statistically more likely to give a lower rating of the communication of safety information with pilots, compared to respondents from the remaining locations. Additionally, NSW and Vic respondents were least likely to rate the communication of safety information as good or excellent, while Tas and NSW were the most likely to rate it as poor or very poor, compared to respondents from all other locations. SA respondents were the most likely to rate the communication of safety information as good or excellent, and no respondents from SA, WA or Qld rated it as either poor or very poor (Appendix E, Communication of safety information, by location).
Preferred topics of safety information
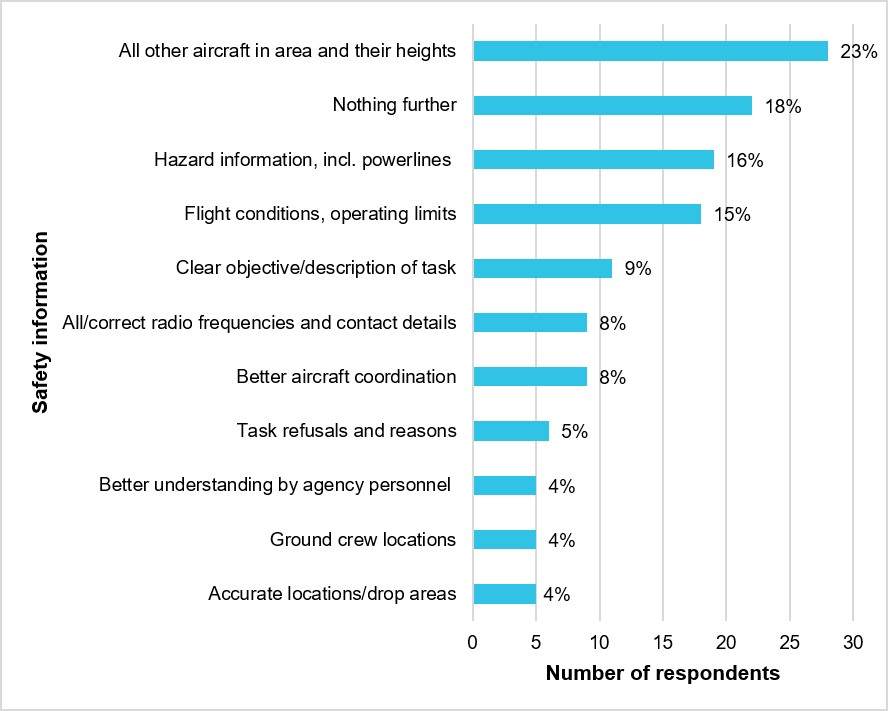
One hundred and twenty respondents provided 175 responses to the question of ‘in the previous 5 years, what safety information would you have liked to see communicated about a task and fireground?’ This question was qualitative, so the responses were first coded and then counted. Figure 26 shows the top 10 most frequent responses, in addition to the response of ‘nothing further’.
The most frequently cited information that respondents would have liked to see was details of all other aircraft operating in the area and their heights (28 respondents, 23%).
Almost a fifth of respondents (22 respondents, 18%) responded ‘nothing further’, more likely than not meaning that they were happy with the safety information currently provided and would not have liked to have seen anything further. This was evident when those who responded ‘nothing further’ were compared with those who rated the communication of safety information as good or excellent. All but 1 of the respondents who replied ‘nothing further’ rated the communication of safety information as fair to excellent.
As seen in Figure 26, the next most frequent responses were better hazard information, including powerline mapping (19 respondents, 16%) and weather and flight conditions and the associated operating limits on the fireground (18 respondents, 15%). Details of respondents’ preferred topics by location are shown in Appendix E, Preferred topics of safety information, by location.
Figure 26: The top 10 most frequent responses (in addition to ‘nothing further’) for type of information about the task and fireground that respondents would have liked to see (N = 120)34
Quality of pilot and tasking agency interactions
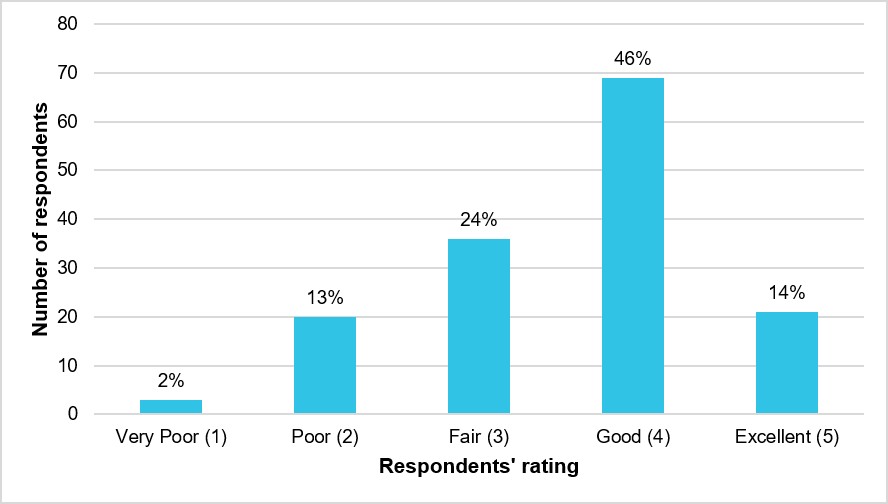
Over half of respondents perceived the overall quality of interactions between pilots and tasking agencies between 2017 and 2022 as either good or excellent (60%), with only 15% perceiving it as poor or very poor (Mdn = 4) (Figure 27).
When respondents’ perceptions of the quality of interactions between pilots and tasking agencies were analysed by their demographics, no statistical differences were found, except for by location.
Figure 27: Respondents’ ratings of the overall quality of interactions between pilots and tasking agencies (N = 149)
Quality of pilot and tasking agency interactions, by location
NSW and Vic respondents’ ratings of the quality of interactions between pilots and tasking agencies were statistically lower than those from the remaining locations. NSW respondents were also statistically more likely to have lower ratings than respondents from Vic. Additionally, while no respondents from WA, SA or Qld rated the quality of interactions between pilots and tasking agencies as poor or very poor, all respondents from WA rated the quality of interactions between pilots and tasking agencies as good or excellent (Appendix E, Quality of pilot and tasking agency interactions, by location).
Flight following and responses to missed ops‑normal calls
Almost two thirds of respondents (64%) either agreed or strongly agreed that flight following was timely and responses to missed ‘ops-normal’ calls were prompt, with only 12% of respondents disagreeing or strongly disagreeing (Mdn = 4) (Figure 28).
Figure 28: Respondents’ degree of agreement that flight following was timely and responses to missed ops-normal calls were prompt (N = 149)
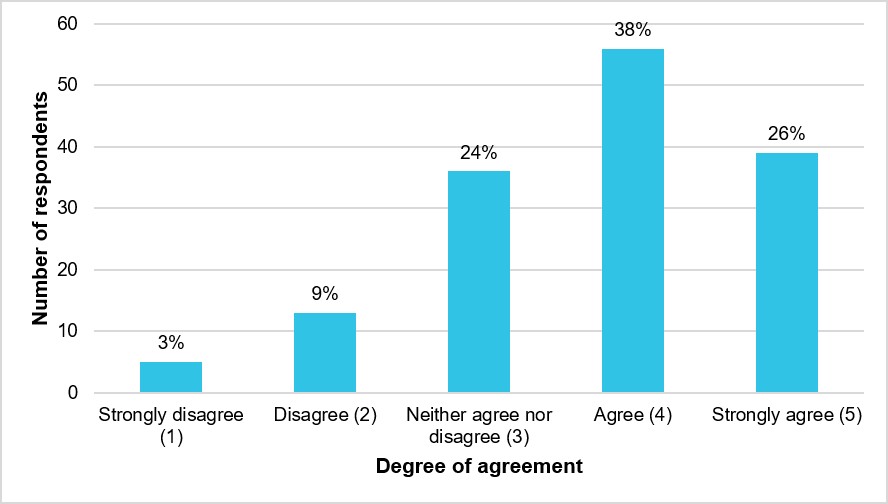
When the respondents’ degree of agreement that flight following was timely and responses to missed ops-normal calls were prompt was analysed by their demographics, no statistical differences were found, except for by location.
Flight following and responses to missed ops-normal calls, by location
Compared to respondents from all other locations except Vic, respondents from NSW were statistically more likely to disagree that flight following was timely and responses to missed ops-normal calls were prompt. Additionally, while no respondents from Qld, SA or WA strongly disagreed or disagreed with this statement, all respondents from SA strongly agreed or agreed that flight following was timely and responses to missed ops‑normal calls were prompt (Appendix E, Flight following and responses to missed ops-normal calls, by location).
Briefing/debriefing of incidents or close calls with tasking agencies
Just under half of respondents (48%) either agreed or strongly agreed that there were opportunities to brief/debrief incidents or close calls with tasking agencies (Mdn = 3) (Figure 29). However, there was just over a quarter of respondents (26%) who either disagreed or strongly disagreed with this statement.
Figure 29: Respondents’ degree of agreement that there were opportunities to brief/debrief incidents or close calls with tasking agencies (N = 149)
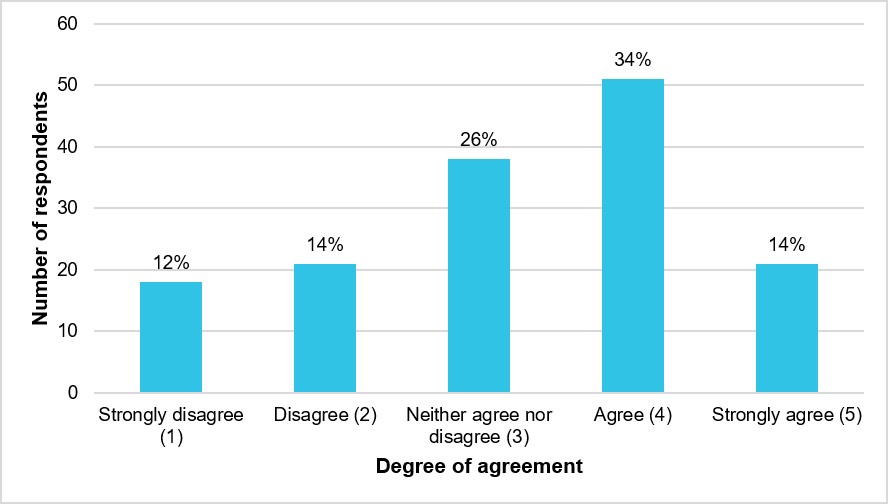
When respondents’ degree of agreement that there were opportunities to brief/debrief incidents or close calls with tasking agencies was analysed by their demographics, no statistical differences were found, except for by location.
Briefing/debriefing of incidents or close calls with tasking agencies, by location
Respondents from Vic and NSW were statistically less likely to agree that there were opportunities to brief/debrief incidents or close calls with tasking agencies than respondents from the remaining locations. NSW respondents were also statistically less likely to agree than Vic respondents. All WA respondents agreed or strongly agreed that there were opportunities to brief/debrief incidents or close calls with tasking agencies (Appendix E, Briefing/debriefing of incidents or close calls with tasking agencies, by location).
Pilots and agency personnel working together to resolve safety issues
Over half of respondents (55%) agreed or strongly agreed that pilots and agency personnel worked together to resolve safety issues on the fireground (Mdn = 4) (Figure 30). Almost one third of respondents (30%) were neutral on the issue, with only 15% either disagreeing or strongly disagreeing that pilots and agency personnel worked together to resolve safety issues on the fireground.
Figure 30: Respondents’ degree of agreement that pilots and agency personnel worked together to resolve safety issues on the fireground (N = 149)
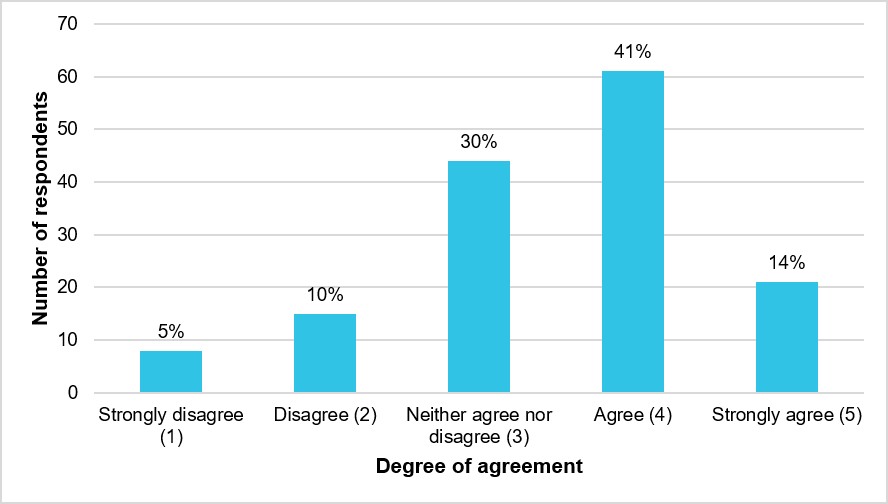
When respondents’ degree of agreement that pilots and agency personnel worked together to resolve safety issues on the fireground was analysed by their demographics, no statistical differences were found, except for by location and main rate of pay.
Pilots and agency personnel working together to resolve safety issues, by location
Respondents from Vic and NSW were statistically less likely to agree that pilots and agency personnel worked together to resolve safety issues on the fireground than respondents from the remaining locations. Additionally, Qld and Tas, together with SA, had no respondents who disagreed or strongly disagreed that pilots and agency personnel worked together to resolve safety issues on the fireground (Appendix E, Pilots and agency personnel working together to resolve safety issues, by location).
Pilots and agency personnel working together to resolve safety issues, by main rate of pay
Figure 31 shows respondents’ degree of agreement that pilots and agency personnel worked together to resolve safety issues on the fireground, by whether their main rate of pay was dependent or independent of their hours flown. Overall, respondents whose pay was independent of their hours flown reported a higher degree of agreement than respondents whose pay was dependent on their hours flown. Almost two thirds (60%) of respondents in the independent group agreed or strongly agreed that pilots and agency personnel worked together to resolve safety issues, compared to only 42% in the dependent group. Similarly, 24% of respondents in the dependent group strongly disagreed or disagreed that pilots and agency personnel worked together to resolve safety issues, compared to only 13% of respondents in the independent group.
Figure 31: Respondents’ degree of agreement that pilots and agency personnel worked together to resolve safety issues on the fireground, by main rate of pay
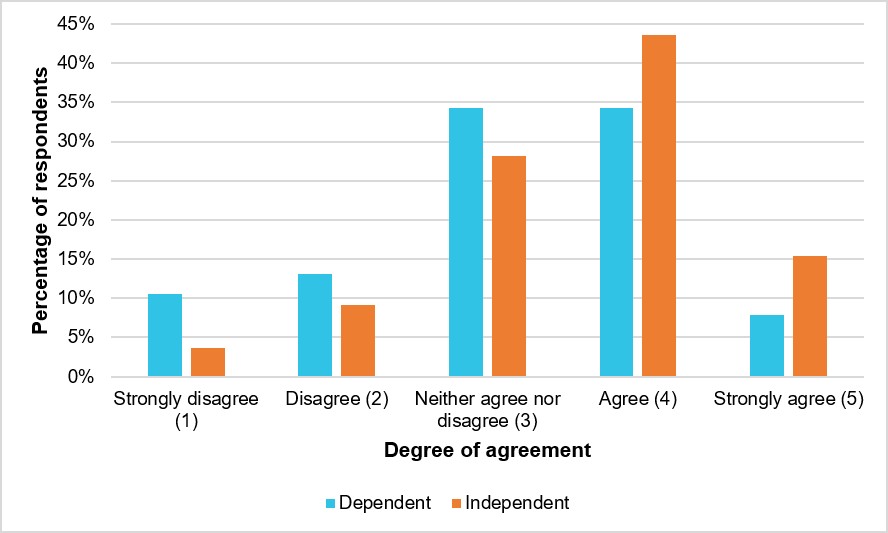
Respondents whose pay was independent of their hours flown were statistically more likely to agree that pilots and agency personnel worked together to resolve safety issues (Mdn = 4) than those whose pay was dependent on their hours flown (Mdn = 3). The effect size, however, was small, suggesting that while main rate of pay in part explains respondents’ degree of agreement that pilots and agency personnel worked together to resolve safety issues, it has minimal explanatory power compared to respondents’ location (Appendix E, Pilots and agency personnel working together to resolve safety issues, by main rate of pay).
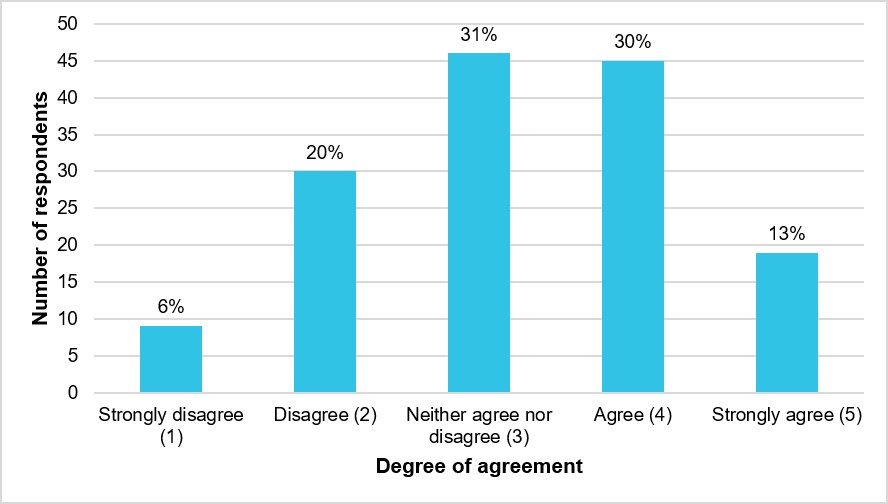
Pilots’ suggestions for improving safety encouraged by tasking agencies
Figure 32 shows respondents’ degree of agreement that pilots’ suggestions for improving safety were encouraged by tasking agencies. Forty-three per cent of respondents either agreed or strongly agreed that this was the case, with approximately one third (31%) neither agreeing nor disagreeing (Mdn = 3). Just over a quarter of respondents (26%) either disagreed or strongly disagreed that pilots’ suggestions were encouraged by tasking agencies.
Figure 32: Respondents’ degree of agreement that pilots’ suggestions for improving safety were encouraged by tasking agencies (N = 149)
When respondents’ degree of agreement that pilots’ suggestions for improving safety were encouraged by tasking agencies was analysed by their demographics, no statistical differences were found, except for by location.
Pilots’ suggestions for improving safety encouraged by tasking agencies, by location
Respondents from NSW were statistically less likely to agree that pilots’ suggestions for improving safety were encouraged by tasking agencies, than respondents from all other locations. Additionally, respondents from SA and WA had the highest degree of agreement with this statement, and Qld notably had no respondents who either disagreed or strongly disagreed that pilots’ suggestions for improving safety were encouraged by tasking agencies (Appendix E, Pilots’ suggestions for improving safety encouraged by tasking agencies, by location).
Reporting culture
Background
As outlined in Part A of this safety study (AS-2021-015a), a reporting culture is one in which personnel are willing to report hazards, errors, near misses35 and concerns, as well as suggest improvements (Reason, 1997). Within a reporting culture, management regard employees as a vital source of information to manage risk (Patankar and others, 2012). It is underpinned by accessible reporting procedures and enabled by a just culture. A just culture includes an atmosphere of trust where employees are encouraged and even rewarded to share safety information, but where a clear distinction is also made between acceptable and unacceptable behaviour (Dekker, 2018).
Further, a reporting culture and associated reporting practices are considered central to a positive safety culture and managing safety. According to Reason (1998), ‘a safe culture is an informed culture and this, in turn, depends upon creating an effective reporting culture…’. Similarly, learning, another key element of a positive safety culture, can only occur if an organisation has an effective reporting system for incidents and safety concerns. The effectiveness of an incident reporting system is also seen as an indicator of employees’ perceptions of management commitment to safety (Parker and others, 2006).
The voluntary sharing of information is therefore essential in any safety-critical organisations such as firefighting agencies. It enables them to detect emerging risks, investigate and explain serious incidents, and understand and improve their practices and systems (McCrae, 2016). The absence of trust and the punishing of employees for reported errors lead not only to underreporting, but also to a lack of cooperation in incident investigations and a missed opportunity to improve safety (McMurtrie and Molesworth, 2018).
Although research into the reporting of occurrences in aerial firefighting is limited, several studies have demonstrated a tendency for under‑reporting in aviation (see for example, Haslebeck and others, 2015; Kioulepoglou and others, 2025).
Factors affecting under‑reporting in aviation include precarious employment conditions (Hutter and Lloyd-Bostock, 2015), a fear of retribution (McMurtrie and Molesworth, 2018) and potential effects on career progression (Kioulepoglou and others, 2025). Melin and others (2018) found differences in reporting between permanently employed and atypically employed pilots. Pilots whose employment was less secure were statistically more likely to avoid expressing critical viewpoints or speak up at work for fear of retribution and were more likely to feel that they were not listened to when they did.
The survey questions relating to reporting culture asked respondents about:
- incidents experienced during the Australian firefighting season
- how comfortable they are reporting incidents
- how quickly the tasking agency resolved the report and whether feedback was provided
- the implementation of change following a report
- whether they had ever been dissuaded from reporting.
Number of incidents experienced during 2017–2022 fire seasons
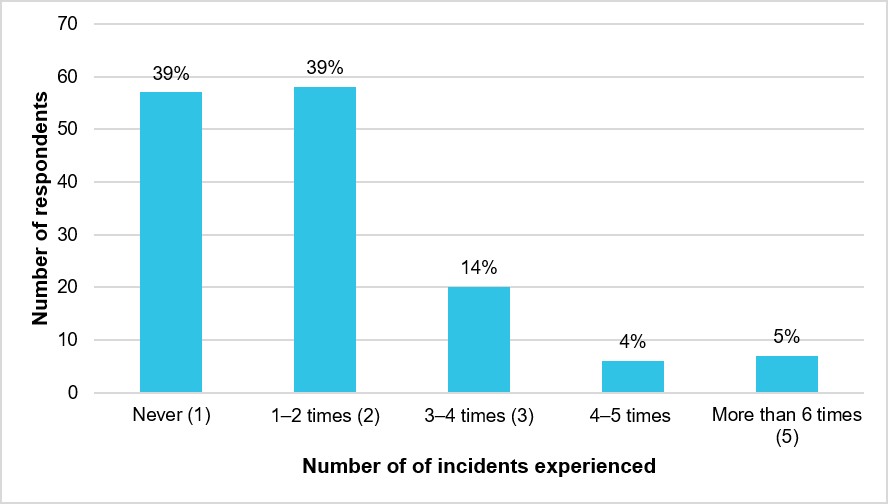
Overall, 39% of respondents had never experienced an aerial firefighting incident between 2017 and 2022 (Mdn = 2). Regarding the 61% of respondents who had experienced an incident during this time, 39% had experienced an incident 1–2 times, 14% had experienced an incident 3–4 times, and 9% had experienced an incident 4 or more times (Figure 33).
Figure 33: Respondents’ number of incidents experienced between 2017 and 2022 (N = 148)36
Number of incidents reported during 2017–2022 fire seasons
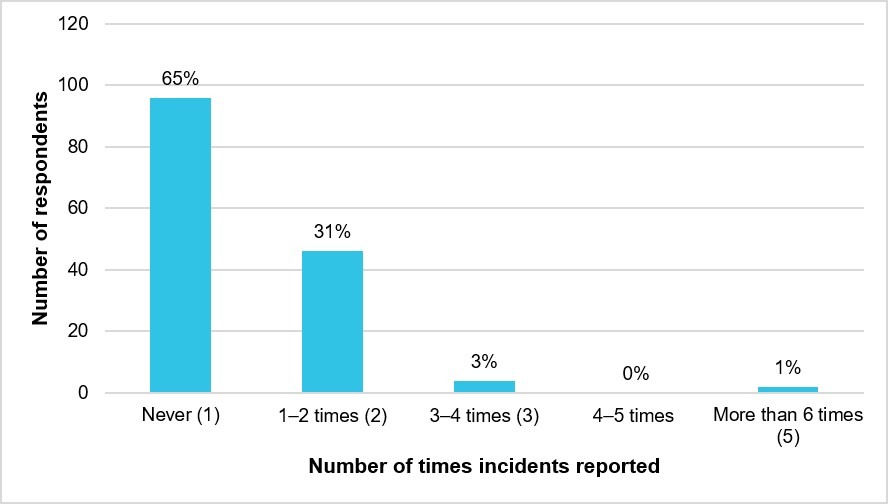
As shown in Figure 34, approximately two thirds of respondents (65%) did not report an incident through formal channels during the 2017 to 2022 Australian firefighting seasons (Mdn = 1). Just over a third (35%) of respondents had reported an incident between 2017 and 2022, with just under a third (31%) having reported an incident 1–2 times and a further 4% having reported an incident 3 or more times.
Figure 34: Respondents’ number of incidents reported between 2017 and 2022 (N = 148)
Number of incidents experienced by number of incidents reported
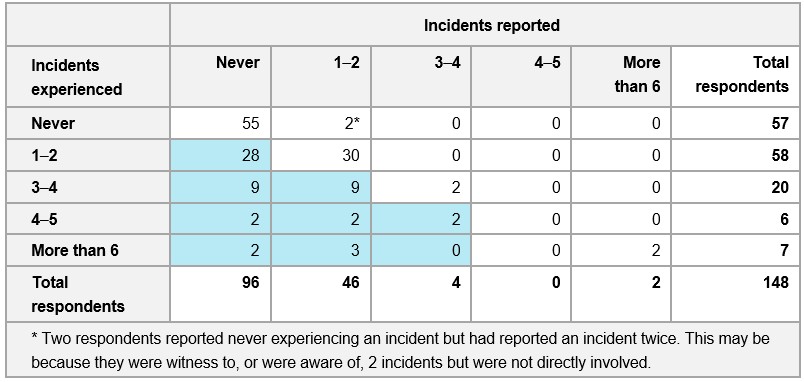
Figure 35 shows the number of incidents that respondents experienced and the number of incidents that respondents reported. Of the 148 respondents, 91 respondents (61%) had experienced an incident between 2017 and 2022, but only 52 (35%) had reported one.
The number of incidents experienced (Mdn = 2) was statistically higher than the number of incidents reported (Mdn = 1) (Appendix F, Number of incidents experienced by number of incidents reported).
Figure 35: Number of incidents experienced compared to the number reported
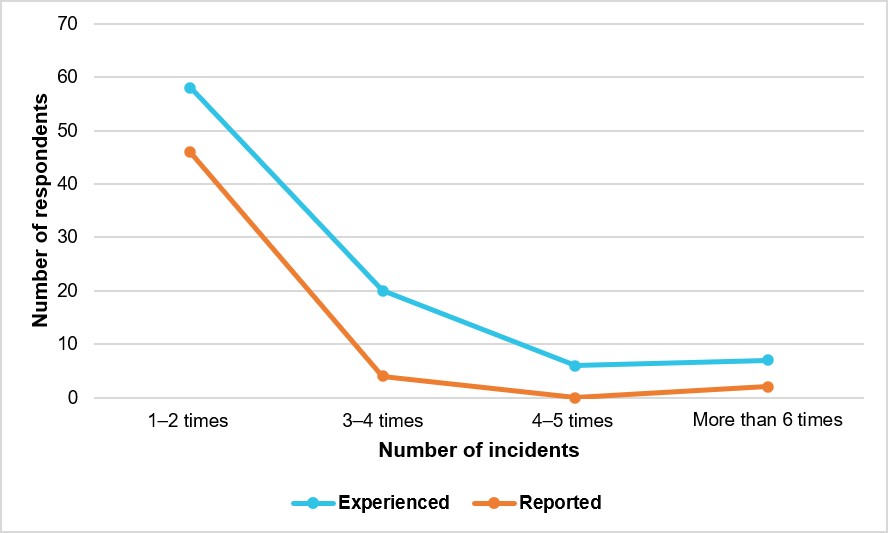
This statistical difference between the number of incidents experienced and the number of incidents reported is evident in Table 4. For example, when the 96 respondents who had never reported an incident are examined, 28 had experienced an incident 1–2 times, 9 had experienced an incident 3–4 times, and 4 had experienced an incident 4 or more times and not reported them.
Table 4 demonstrates that under half of all incidents experienced by respondents were reported.
Table 4: Number of respondents who experienced incidents by the number of respondents who reported incidents, with instances of under-reporting shaded
Most serious incidents/close calls experienced
Respondents were asked about the most serious incidents/close calls they had experienced between 2017 and 2022. This was a qualitative question requiring free text as a response and respondents were able to list up to 5 incidents. Eighty-six respondents provided details of the most serious incidents/close calls they had experienced between 2017 and 2022, for a total of 199 incidents. An additional 6 respondents reported not having experienced a serious incident or close call. The remaining 57 respondents who did not answer this question were the same respondents who answered that they had ‘never’ had an incident between 2017 and 2022 (Table 4). The 6 respondents who did answer this question but answered ‘none’, therefore, are likely those who had an incident but not a ‘serious incident/close call’ between 2017 and 2022.37
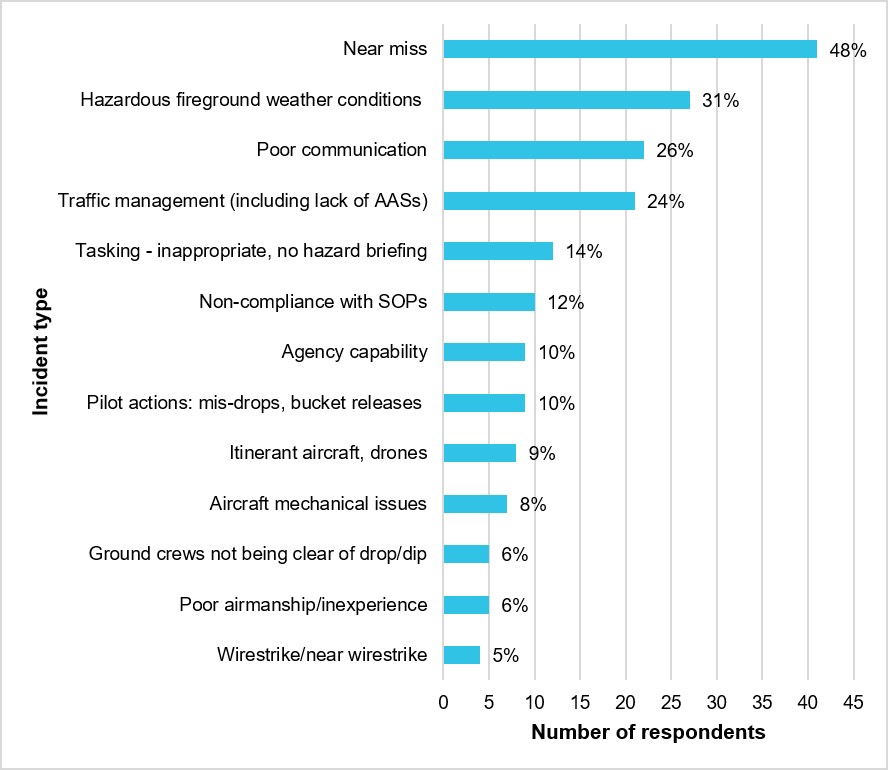
Figure 36 shows the most frequent types of serious incidents/close calls reported by respondents. Note a single incident may have involved multiple incident types, for example a ‘near miss’ that resulted from ‘poor communication’. Almost half of respondents (48%) listed a near miss, followed by almost a third (31%) who listed hazardous fireground weather conditions, and about a quarter of respondents listed poor communication (26%) and traffic management, including a lack of air attack supervisors (AASs) (24%).
Figure 36: The most serious incidents/close calls experienced between 2017 and 2022 listed by at least 4 respondents, in addition to the ‘none’ category (N = 86)38
Most serious incidents/close calls experienced, by location
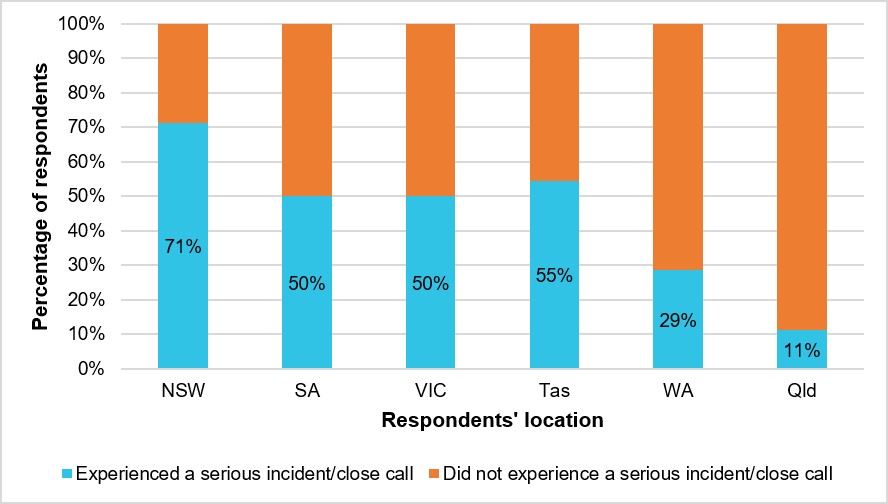
The proportion (percentage) of respondents who had experienced a serious incident/close call from each location is shown in Figure 37. Qld had the lowest proportion of respondents (11%) who had experienced a serious incident/close call, even compared to the locations with relatively similar smaller sample sizes (Table 5). Qld also represented 6% of the total survey sample, but only 1% of the 199 incidents listed by respondents. NSW had the highest proportion of respondents (71%) who had experienced a serious incident/close call between 2017 and 2022. Further, NSW respondents represented 49% of the total survey sample, but 67% of the total number of serious incident/close calls experienced by respondents between 2017 and 2022 (Table 5). The amount of serious incidents/close calls for all other locations was roughly proportionate to the total survey sample for each location. Details of the main types of serious/incidents/close calls experienced for each location are found at Appendix F, Most serious incidents/close calls experienced, by location.
Figure 37: The number and proportion of respondents from each location who had experienced a serious incident/close call between 2017 and 2022 (N = 148)39
The number of respondents from each location who experienced between 1–5 serious incidents/close calls between 2017 and 2022 are shown in Table 5. Eighty-six out of the total 149 survey respondents (58%) had experienced 1–2 serious incidents/close calls, while 10 out of the 86 respondents (12%) listed up to 5 serious incidents/close calls experienced between 2017 and 2022 (Table 5).
Table 5: Number of serious incidents/close calls experienced by respondents between 2017 and 2022, by location (N = 86)
| Location | Survey sample size | 1st | 2nd | 3rd | 4th | 5th | Total incidents | ||
No. | Prop. | No. | Prop. | ||||||
| NSW | 73 | 49% | 52 | 36 | 23 | 14 | 9 | 134 | 67% |
| Vic | 34 | 23% | 17 | 12 | 5 | 3 | 1 | 38 | 19% |
| Tas | 11 | 7% | 6 | 5 | 2 | 0 | 0 | 13 | 7% |
| SA | 14 | 9% | 7 | 1 | 0 | 0 | 0 | 8 | 4% |
| WA | 7 | 5% | 2 | 1 | 0 | 0 | 0 | 3 | 2% |
| NT | 1 | 1% | 1 | 1 | 0 | 0 | 0 | 2 | 1% |
| Qld | 9 | 6% | 1 | 0 | 0 | 0 | 0 | 1 | 1% |
| Total resp. | 149 | 100% | 86 | 56 | 30 | 17 | 10 | 199 | 100% |
Respondents’ comfort reporting incidents
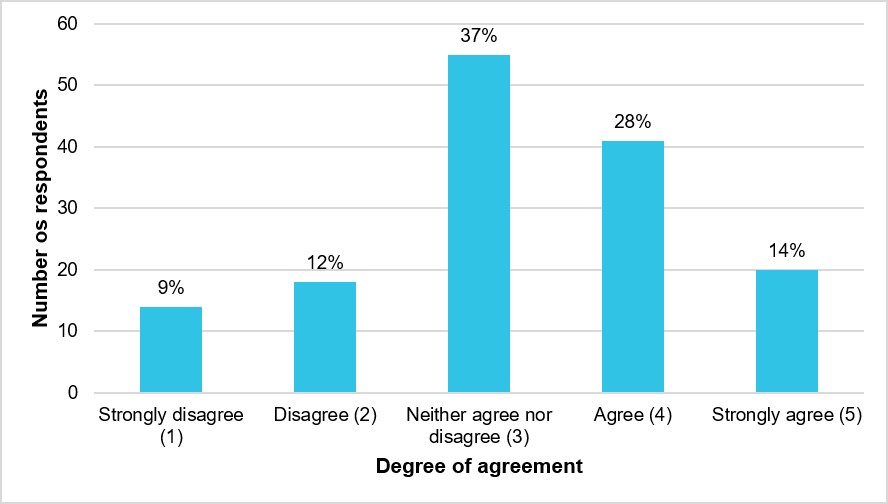
Figure 38 shows respondents’ degree of agreement that they were comfortable reporting incidents through formal channels. Overall, most respondents (78%) were either neutral or positive about how comfortable they were reporting incidents (Mdn = 3). Forty-two per cent of respondents either agreed or strongly agreed that they were comfortable reporting incidents through the formal channels, with 37% neutral about the issue. However, there was still just over a fifth (21%) of respondents who were not comfortable reporting incidents through formal channels, of which 9% strongly disagreed that they were comfortable doing so.
Figure 38: Respondents’ degree of agreement that they were comfortable reporting incidents through formal channels (N = 148)40
When respondents’ comfort level with reporting incidents through formal channels was analysed by their demographics, statistical differences were found for respondents’ main rate of pay, as well as for location.
Respondents’ comfort reporting incidents, by location
Respondents from NSW were statistically less likely to feel comfortable reporting incidents through formal channels, than respondents from the remaining locations, except Vic. Additionally, Qld had the highest percentage of respondents who agreed or strongly agreed with this statement, and no respondents who disagreed or strongly disagreed that they were comfortable reporting incidents through formal channels (Appendix F, Respondents’ comfort reporting incidents, by location).
Respondents’ comfort reporting incidents, by main rate of pay
Figure 39 shows respondents’ degree of agreement that they were comfortable reporting incidents through formal channels, by whether their main rate of pay was dependent or independent of their hours flown. Overall, respondents whose pay was independent of their hours flown reported feeling more comfortable reporting incidents through formal channels than respondents whose pay was dependent on their hours flown. Almost half (45%) of respondents in the independent group agreed or strongly agreed that they were comfortable, compared to only 30% in the dependent group. Similarly, 35% of respondents in the dependent group strongly disagreed or disagreed that they were comfortable reporting incidents through formal channels, compared to only 17% of respondents in the independent group (Figure 39).
Figure 39: Percentage of respondents’ degree of agreement that they were comfortable reporting incidents, by their rate of pay being dependent or independent of hours flown (N = 147)
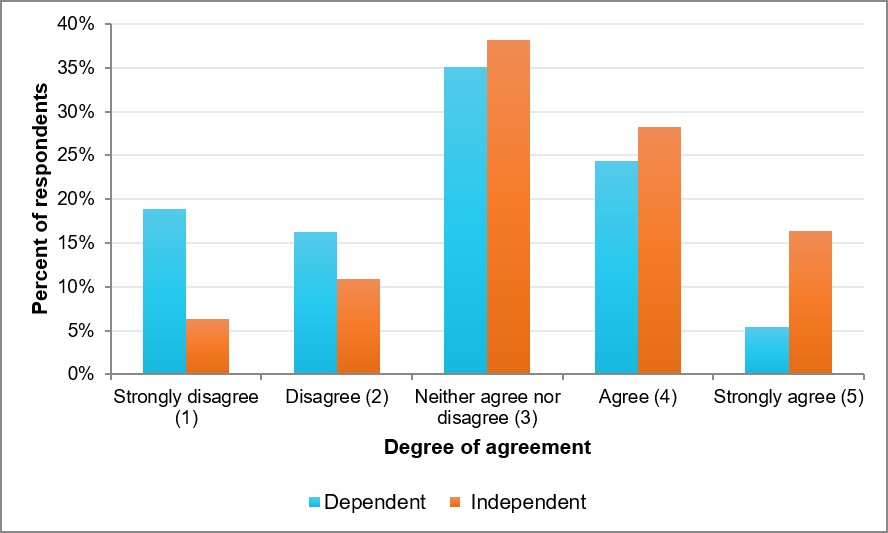
Respondents whose pay was independent of their hours flown were statistically more likely to agree that they felt comfortable reporting incidents (Mdn = 3) than those whose pay was dependent on their hours flown (Mdn = 3) (Appendix F, Respondents’ comfort reporting incidents, by main rate of pay). This finding supports the research by Melin and others (2018) and Hutter and Lloyd-Bostock (2015) that pilots in less secure employment conditions are less likely to report incidents or speak up about safety concerns.
The effect size of the statistical difference between the groups, however, was small to medium (Appendix F, Respondents’ comfort reporting incidents, by main rate of pay), suggesting that while respondents’ rate of pay explains some of the variation in their responses to whether they were comfortable reporting incidents through formal channels, it has less explanatory power compared to respondents’ location. This is consistent with the finding that respondents’ location was also found to be significant in accounting for the variation in responses regarding how comfortable respondents were reporting incidents through formal channels, but with a larger effect size.
Reporting without fear of negative repercussions
Figure 40 shows respondents’ degree of agreement that they could report incidents without fear of repercussions. Overall, respondents were more likely to be neutral or in agreement that they could report incidents to tasking agencies without fear of negative repercussions, with 40% agreeing or strongly agreeing that this was the case, and 26% neither agreeing nor disagreeing (Mdn = 3). However, there was still just over a third of respondents (34%) who disagreed or strongly disagreed that they could report incidents without fear of repercussions.
Figure 40: Respondents’ degree of agreement that they could report incidents without fear of repercussions (N = 148)41
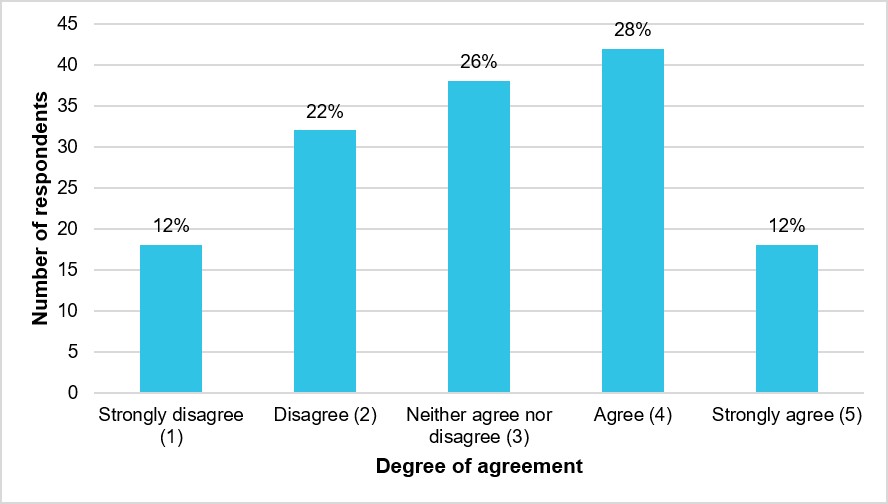
When respondents’ degree of agreement that they could report incidents to tasking agencies without fear of negative repercussions was analysed by their demographics, no statistical differences were found, except for by location.
Reporting without fear of negative repercussions, by location
Respondents from NSW were statistically less likely than respondents from all other locations to feel they could report incidents without fear of repercussion from the tasking agency. Further, just over half of NSW respondents disagreed or strongly disagreed that they could report incidents without fear of negative repercussions from the tasking agency. In contrast, respondents from WA were the most likely to agree that they could report incidents without fear of repercussions, while Qld was the only location where no respondents disagreed or strongly disagreed with the statement (Appendix F, Reporting without fear of negative repercussions, by location).
Resolution of incident reports by tasking agency
Figure 41 shows respondents’ degree of agreement that there was a quick resolution of incident reports by the tasking agencies, with those who had never reported an incident removed. Out of a total of 148 respondents who answered this question, 52 respondents had reported an incident between 2017 and 2022. Overall, almost half (46%) of the 52 respondents disagreed or strongly disagreed that there was a quick resolution of incident reports by the tasking agency (Mdn = 2). Almost a third respondents (31%) neither agreed nor disagreed, with just under a quarter (23%) agreeing or strongly agreeing that there was a quick resolution of incident reports by the tasking agencies.
Figure 41: Respondents’ degree of agreement that there was a quick resolution of incident reports (N = 52)
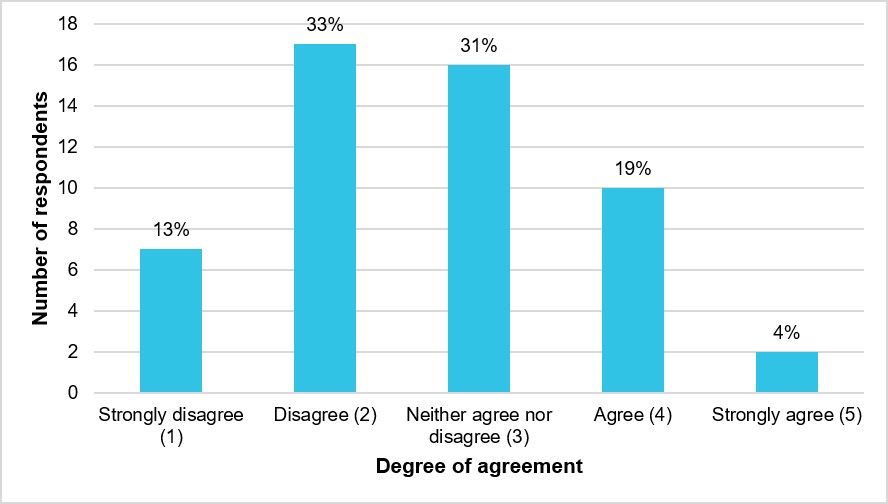
When respondents’ degree of agreement that there was a quick resolution of incident reports by tasking agencies was analysed by their demographics, no statistical differences were found, except for by location.
Resolution of incident reports by tasking agency, by location
Of the 4 locations (NSW, Vic, SA and Tas) where respondents had reported an incident between 2017 and 2022, NSW respondents were statistically less likely than respondents from other locations to agree that there was a quick resolution of incident reports by tasking agencies (Appendix F, Resolution of incident reports by tasking agency, by location).
Feedback after incident reporting
Figure 42 shows respondents’ degree of agreement that they received feedback from tasking agencies after reporting an incident, with those who had never reported an incident removed. Out of a total of 148 respondents who answered this question, 52 respondents had reported an incident between 2017 and 2022. Overall, over half (52%) of the 52 respondents disagreed or strongly disagreed that they received feedback from tasking agencies after reporting an incident (Mdn = 2). A quarter of respondents (25%) neither agreed nor disagreed, with just under a quarter (23%) agreeing or strongly agreeing that they received feedback from tasking agencies after reporting an incident.
Figure 42: Respondents’ degree of agreement that they had received feedback after reporting an incident (N = 52)
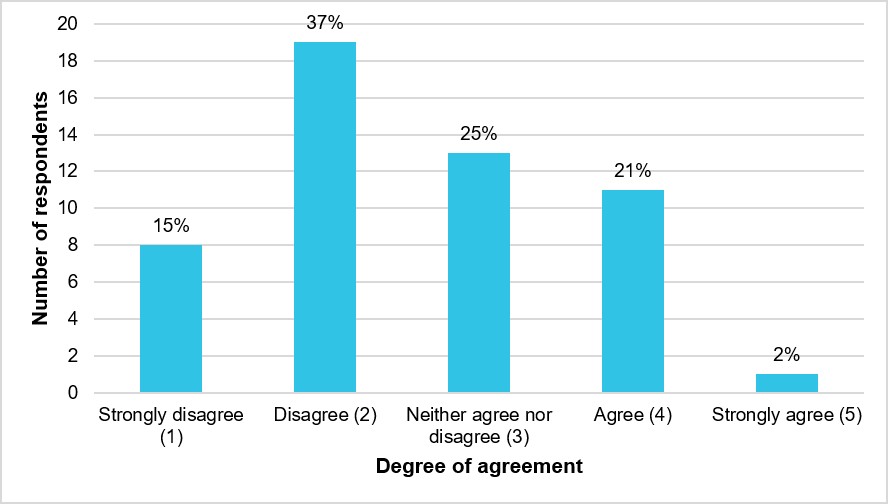
When respondents’ degree of agreement that they had received feedback about incident reports from tasking agencies was analysed by their demographics, no statistical differences were found, except for by location.
Feedback after incident reporting, by location
Of the 4 locations (NSW, Vic, SA and Tas) where respondents had reported an incident between 2017 and 2022, NSW respondents were statistically less likely than respondents from other locations to agree that they had received feedback about incident reports from tasking agencies (Appendix F, Feedback after incident reporting, by location).
Positive change after reporting an incident
Figure 43 shows respondents’ degree of agreement that they had they had seen the implementation of positive change after reporting an incident to the tasking agency, with those who had never reported an incident removed. Out of a total of 148 respondents who answered this question, 52 respondents had reported an incident between 2017 and 2022. The most frequent response was neither agree nor disagree, with 42% of respondents neither agreeing nor disagreeing that they had seen the implementation of positive change after reporting an incident to the tasking agency (Mdn = 3). Of the remaining respondents, just under a third (32%) disagreed or strongly disagreed that they had seen the implementation of positive change, while a quarter (25%) agreed or strongly agreed.
Figure 43: Respondents’ degree of agreement that they had they had seen the implementation of positive change after reporting an incident to the tasking agency (N = 52)42
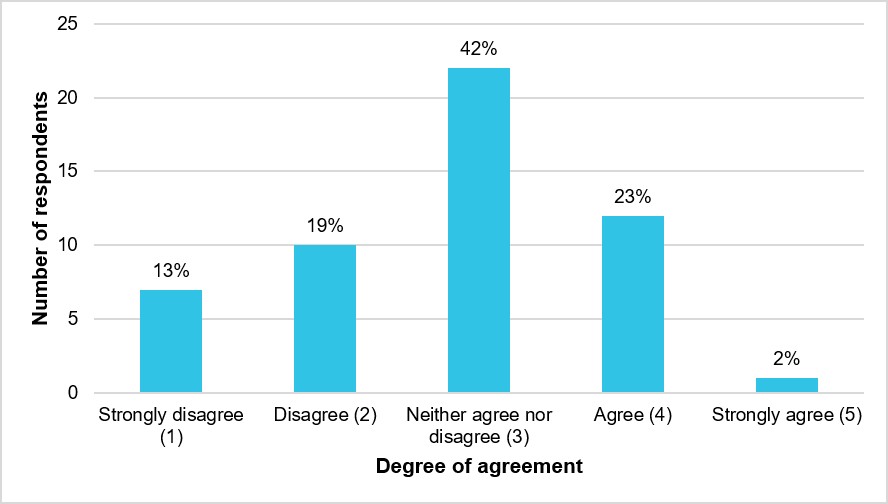
Have pilots been dissuaded from reporting an incident?
Fifty-six respondents (38%) had not needed to report an incident, leaving 93 respondents (62%) who had.43 When just the 93 respondents who had needed to report an incident were considered, 82% of these respondents had not been dissuaded from reporting (Mdn = 2).
If yes to being dissuaded, what happened?
A total of 17 respondents (18%) answered that that they had been dissuaded from reporting an incident. Of these 17 respondents, 15 described what happened. All responses demonstrated a lack of a reporting culture, with the main reason being a fear of retribution (n = 9), followed by the perception that they were not listened to/nothing was done anyway (n = 3) (Figure 44). Additionally, of the 15 respondents who had been dissuaded from reporting an incident and described what happened, 13 were from NSW, with 1 each from WA and Vic.
Figure 44: Responses to ‘If yes to being dissuaded, please describe what happened’ (N = 15)
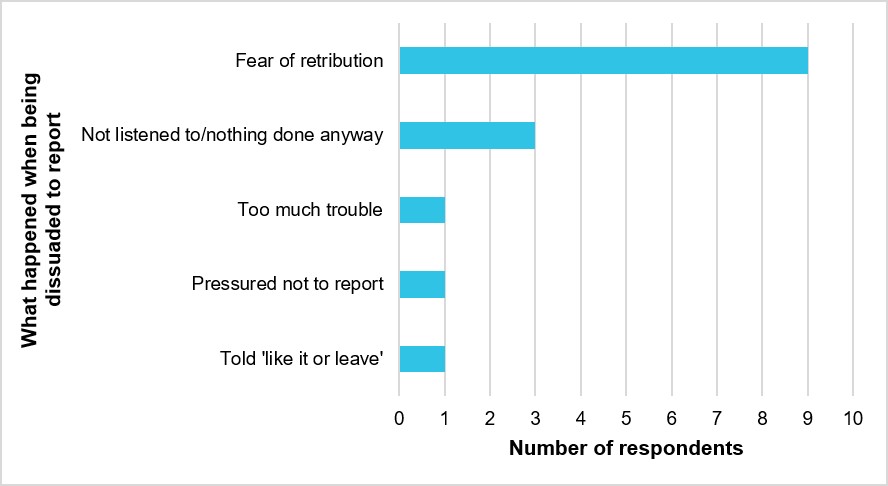
Safety culture
Background
As outlined in Part A (AS-2021-015a), ‘safety culture is arguably the single most important influence on the management of safety’ (ICAO, 2018). It is the way safety is perceived, valued and prioritised in an organisation (Skybrary, 2026). In simplest and most useful terms, safety culture is ‘the way we do things around here’ concerning safety (Hopkins, 2018). The safety culture of an organisation is a characteristic of a group or organisation, not an individual (Hopkins, 2018). It is, however, the context within which individual safety-related attitudes and behaviours develop and persist. It is considered a subset of organisational culture (Kirwan and others 2018) because it concerns the way things are normally done in an organisation specifically in relation to managing safety.
Further, a safety culture is closely interlinked with a safety management system (SMS). It is ‘both a product and a driver of risk-related practices’ (Tear and others, 2020). A well‑functioning SMS, therefore, will help develop a positive safety culture, and an organisation’s safety culture will determine the effectiveness of an organisation’s safety management processes.
Safety culture is a multi-dimensional concept, and while there is general agreement in the literature about the inclusion of Reason’s (1997) core elements of informed, learning, reporting, just and flexible, the remaining elements vary somewhat between authors.44 Nevertheless, a widely recognised element of an organisation’s safety culture is safety leadership, often referred to as management commitment. Safety leadership refers to the extent to which management:
- prioritises safety in decision-making
- actively and visibly promotes and participates in safety management activities
- is open and responsive to feedback on safety matters
- collaborates with employees to manage and improve safety (Parker and others, 2006; Weigmann and others, 2004).
Management’s role in developing a safety culture often begins with implementing formal safety policies, but employees’ understanding of how the organisation prioritises safety is shaped by their communications and interactions with management on a day-to-day basis (O’Connor and others, 2011). Further, a positive safety culture requires that employees’ frontline knowledge of hazards, work processes and situational demands is acknowledged and utilised in managing safety (Antonsen, 2018).
Additionally, ‘at the heart of a safety culture is the way in which organisational intelligence and collective imagination regarding safety issues are deployed’ (Pidgeon and O’Leary, 1994). This concerns the informed and learning elements of Reason’s (1997) description of safety culture, and what an organisation and, more specifically, senior management, does with the safety information it receives. Organisations with a learning culture are willing to implement change and adapt operations as required to improve safety (Weigmann and others, 2002).
The questions in the survey on safety culture asked respondents about:
- changes to safety in aerial firefighting
- the tasking agencies’ understanding of operational issues impacting flight safety
- similarity of tasking agencies’ and operators’ perspectives on the management of operational issues impacting flight safety
- whether tasking agencies were genuinely interested in safety concerns raised by pilots
- perceived threats to safety.
Changes that have improved aviation safety in aerial firefighting
Respondents were asked about the changes they had observed that have improved aviation safety in aerial firefighting. This was a qualitative question requiring free text as a response. There were 115 respondents to this question who provided 135 responses (some respondents answered more than once). The most frequent response to this question was that there were no changes that had improved safety between 2017 and 2022, listed by over a third of respondents (37%). Of this 37%, 9 respondents (8%) added that they believed that any changes had worsened safety.
Figure 45 shows the most frequently reported changes perceived to have improved aviation safety. Due to a large amount of variation in the responses, Figure 45 has been limited to responses reported by at least 2 respondents. The change most frequently reported to have improved safety was ‘adapting OzRunways45 and/or ADS‑B46 for traffic awareness’, with 13 respondents (11%). This was followed by ‘communication’ (10%), and then ‘flight following’ and ‘fatigue management’, both with around 6%.
Figure 45: The changes that were perceived to have improved safety by at least 2 or more respondents (N = 115)
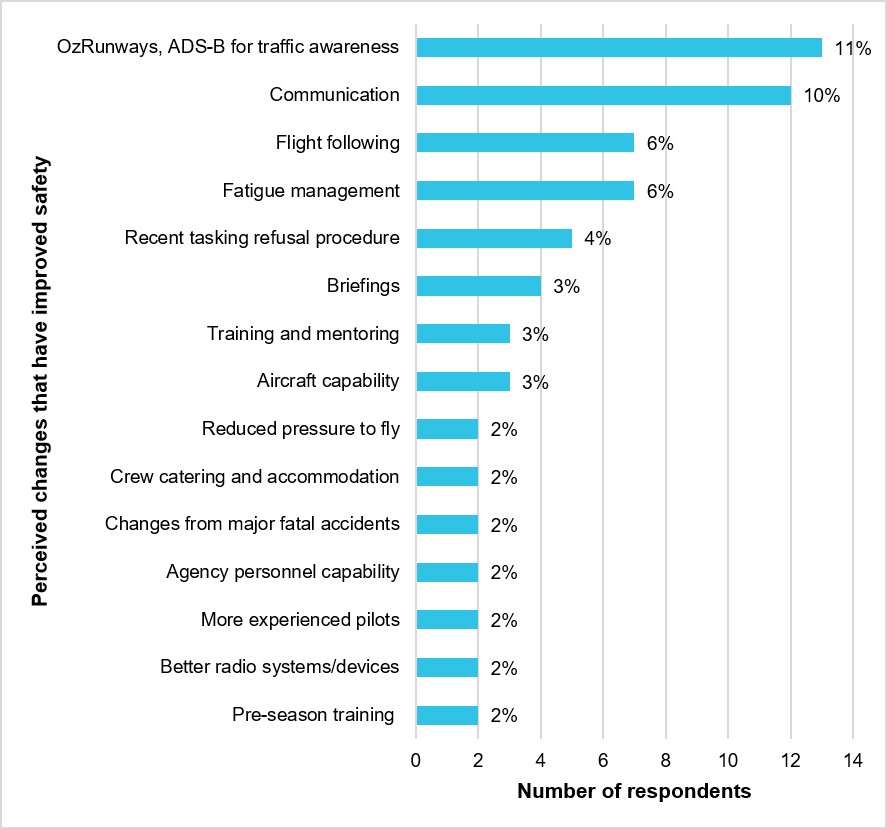
Changes that have worsened aviation safety in aerial firefighting
Respondents were asked about the changes they had observed that have worsened aviation safety in aerial firefighting. This was another qualitative question requiring free text as a response. There were 115 respondents to this question who provided 149 responses (some respondents answered more than once). A total of 38 different changes were identified by the 115 respondents, showing a fair amount of variation in the responses. Figure 46 has therefore been limited to responses reported by at least 3 respondents. Almost a quarter of respondents (27, 23%) stated that there were no changes that they perceived to have worsened aviation safety (Figure 46). This was the most frequent response, followed by 'fire agency personnel aviation knowledge/experience' with 21 respondents (18%), increased regulation and bureaucracy with 9 respondents (8%) and pilot inexperience (6%). All other responses were provided by 5% or less of the total number of respondents.
Figure 46: The changes perceived to have worsened aviation safety, listed by at least 3 respondents (N = 115)47
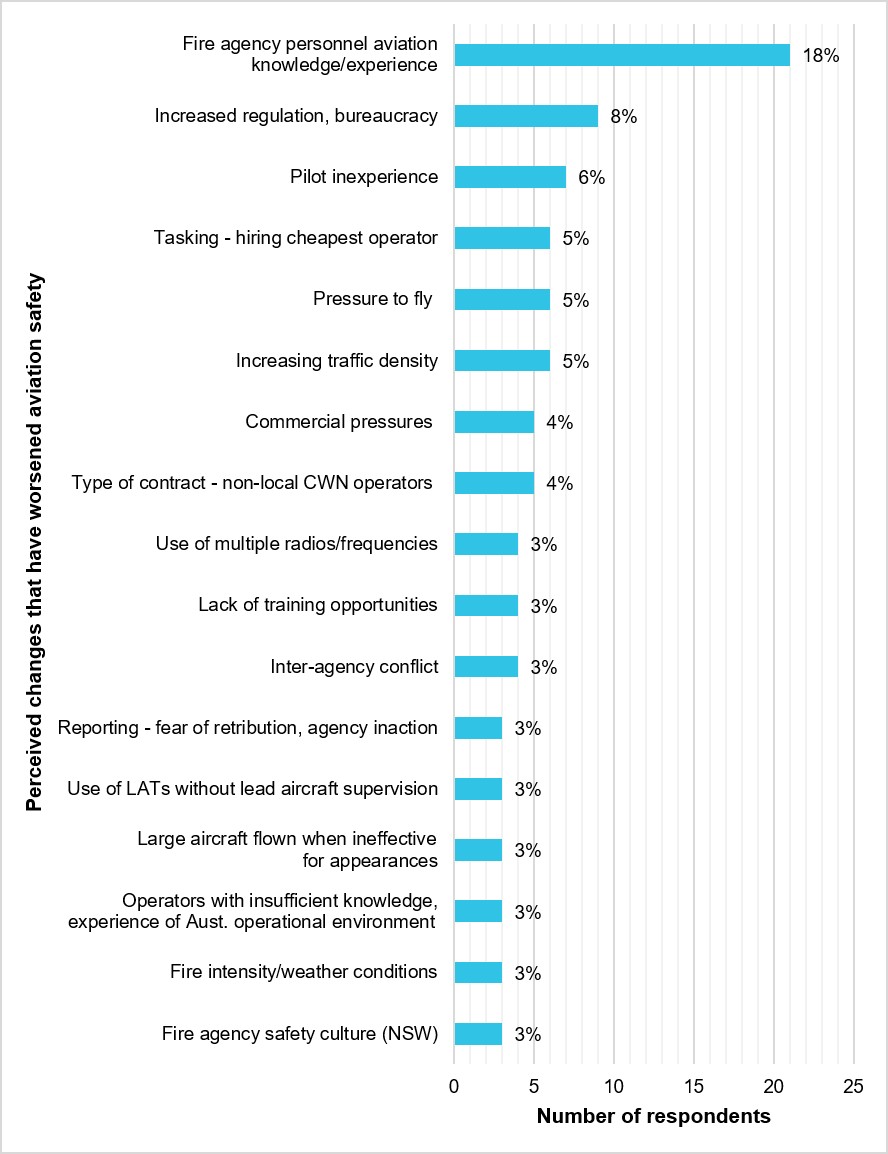
Changes needed to improving safety
Respondents were asked what they would like to see changed with reference to improving safety. This was a qualitative survey question requiring a free text response. There were 116 respondents that answered the question who provided 168 responses (some respondents provided more than one response).
Overall, there was a fair amount of variation among the respondents about the changes needed to improve safety in aerial firefighting operations. Figure 47 shows the most frequently listed changes required to improve safety, listed by 3 or more respondents. There were 23 remaining changes listed by only 1–2 respondents each. The most frequently listed change needed to improve safety was ‘fire agency personnel aviation knowledge/experience’, reported by 23 out of 116 respondents (20%) (Figure 47). This was followed by ‘improved aircrew training, mentorship and currency’ and ‘national standards’ (9%), ‘type of contract – hourly pay for pilots, less reliance on call‑when‑needed (CWN) and longer duration of contracts’, ‘fire agency safety culture’ (8%) and ‘improved communication’ (7%). All other changes were listed by 6% or less of respondents each.
Figure 47: Most frequently listed changes required to improve safety, listed by 3 or more respondents (N = 116)48
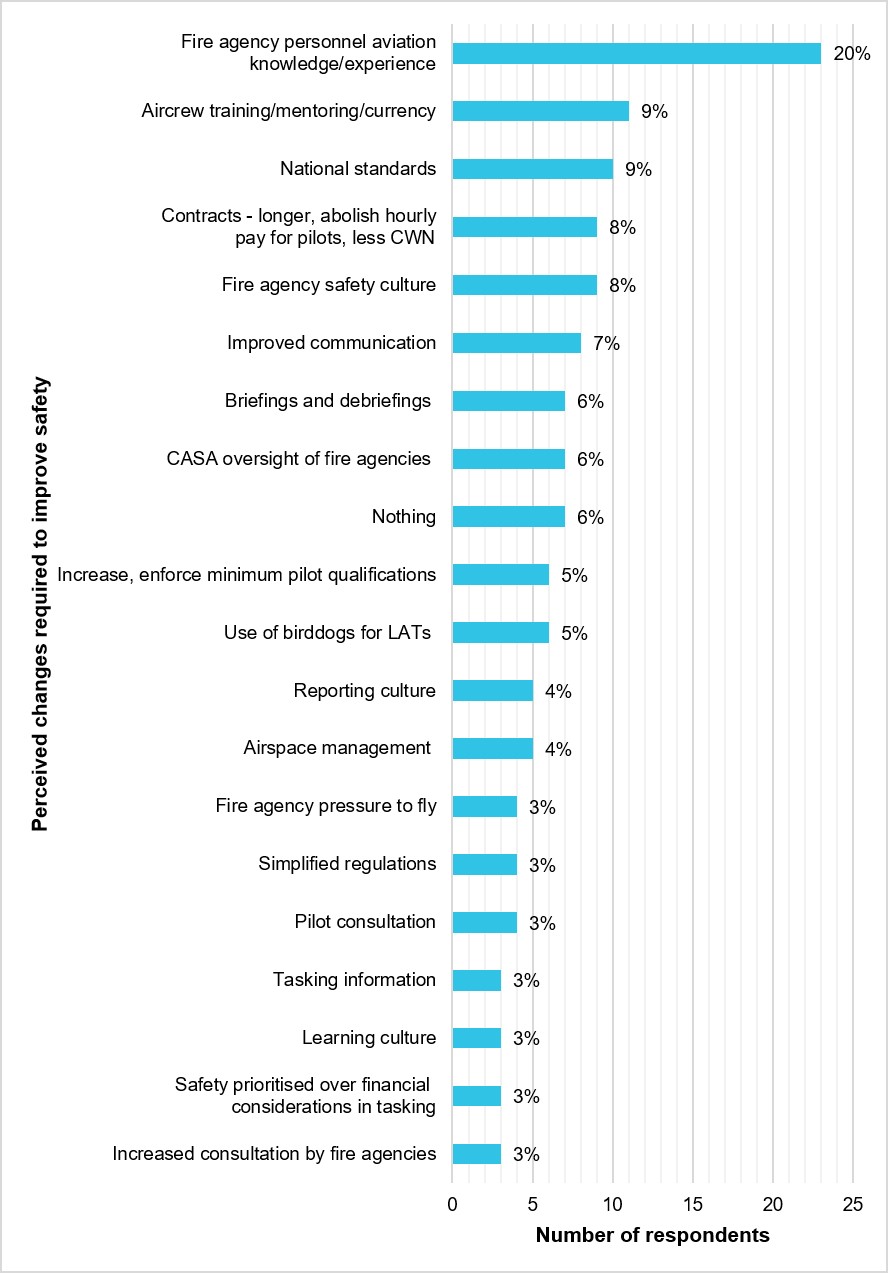
Tasking agencies’ understanding of operational safety issues
As shown in Figure 48, while 37% of respondents agreed that tasking agencies had a good understanding of operational issues, slightly more (40%) disagreed or strongly disagreed that this was the case (Mdn = 3).
Figure 48: Respondents’ degree of agreement that tasking agencies had a good understanding of operational issues (N = 144)49
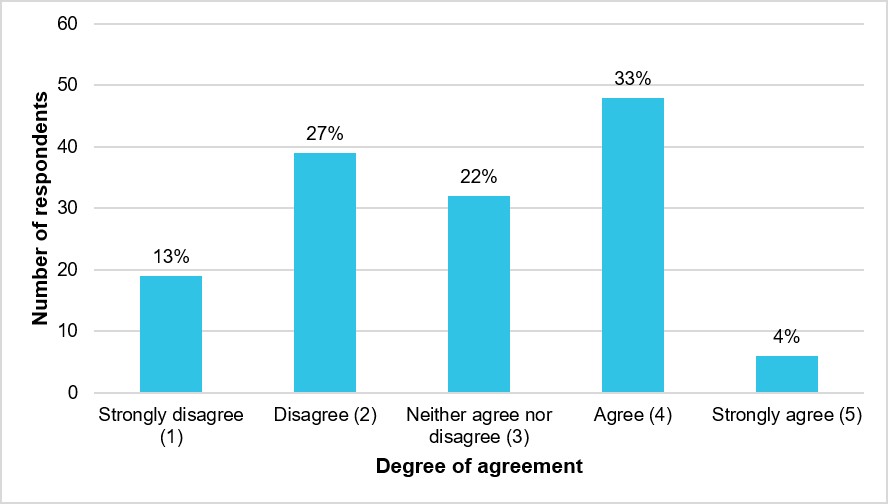
When respondents’ degree of agreement that tasking agencies had a good understanding of operational issues was analysed by their demographics, no statistical differences were found, except for by location.
Tasking agencies’ understanding of operational safety issues, by location
Respondents from NSW were statistically less likely than respondents from all other locations to agree that tasking agencies had a good understanding of operational issues. Qld respondents were the most likely to agree or strongly agree that tasking agencies had a good understanding of operational issues.
Perspectives on the management of operational issues
As shown in Figure 49, respondents were split almost equally between those who agreed or strongly agreed (34%), disagreed or strongly disagreed (32%) or were neutral (34%) about whether tasking agencies and operators had similar perspectives on the management of operational issues that impact safety (Mdn = 3). However, it is notable that there was still almost a third of those surveyed who did not think that agencies and operators had similar perspectives on the management of operational issues that impact safety.
Figure 49: Respondents’ degree of agreement that tasking agencies and operators had similar perspectives on the management of operational issues that impact safety (N = 144)
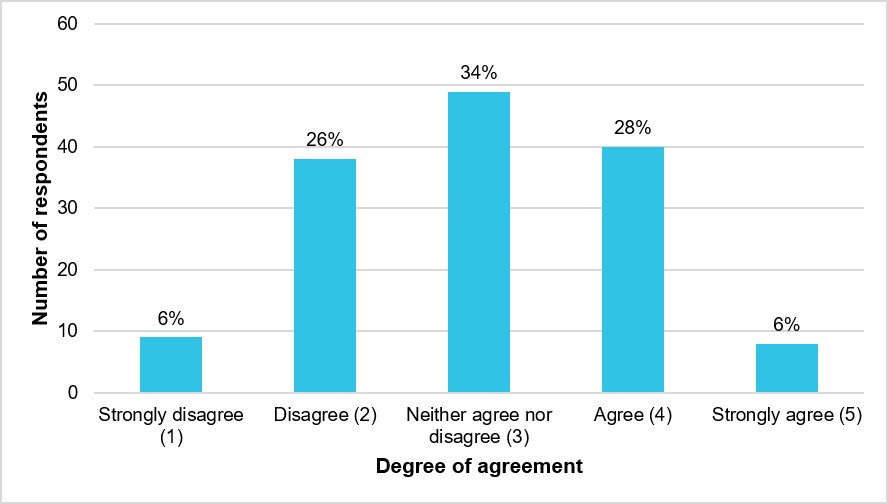
When respondents’ degree of agreement that tasking agencies and operators had similar perspectives on managing operational safety issues was analysed by their demographics, no statistical differences were found, except for by location.
Perspectives on the management of operational issues, by location
Respondents from NSW were statistically less likely than respondents from all other locations except Vic to agree that tasking agencies and operators had similar perspectives on managing operational safety issues. SA had the highest percentage of respondents who agreed or strongly agreed with this statement (Appendix G, Perspectives on the management of operational issues, by location).
Tasking agencies’ interest in pilots’ safety concerns
Figure 50 shows respondents’ degree of agreement that tasking agencies were genuinely interested in safety concerns raised by pilots. Overall, respondents provided a relatively positive response to this question, with about half (51%) agreeing or strongly agreeing that tasking agencies were genuinely interested in safety concerns raised by pilots and almost a third (29%) providing a neutral response (Mdn = 4). However, there was still one fifth of respondents (20%) who disagreed or strongly disagreed that tasking agencies were genuinely interested in safety concerns raised by pilots.
Figure 50: Respondents’ degree of agreement that tasking agencies were genuinely interested in safety concerns raised by pilots (N = 143)50
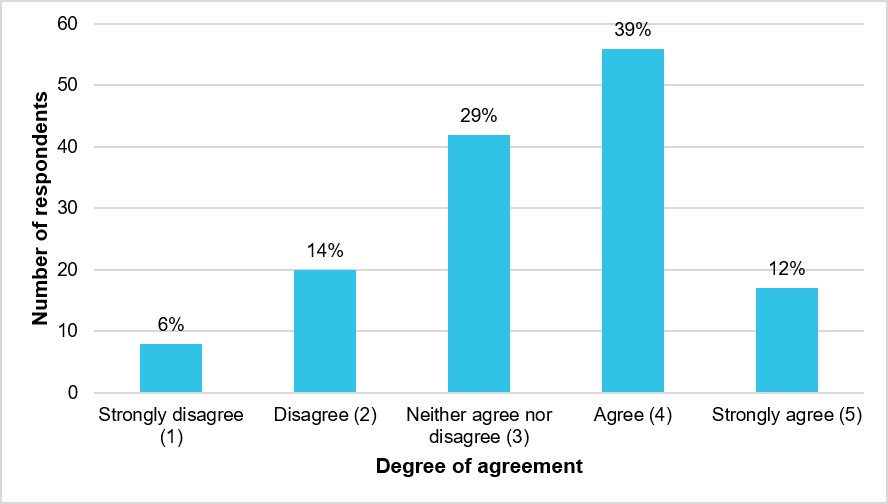
When respondents’ degree of agreement that tasking agencies were genuinely interested in safety concerns raised by pilots was analysed by their demographics, no statistical differences were found, except for by location.
Tasking agencies’ interest in pilots’ safety concerns, by location
Respondents from NSW were statistically less likely than those from all other locations to agree that tasking agencies were genuinely interested in safety concerns raised by pilots. Qld respondents were the most likely to agree or strongly agree that this was the case (Appendix G, Tasking agencies’ interest in pilots’ safety concerns, by location).
Biggest threats to safety during aerial firefighting
Respondents were asked what they saw as the 3 biggest threats to safety during aerial firefighting. One hundred and thirty-two respondents listed at least 1 threat, with 124 respondents listing a second threat and 103 listing a third, for a total of 359 threats.
Figure 51 shows the most frequently listed threats to aerial firefighting safety by at least 5 respondents. Respondents considered adverse weather conditions/environment as the biggest threat to safety during aerial firefighting, with just under half (48%) of the 132 respondents listing this as a threat to safety. This included 7 respondents who specified continuing to fly into deteriorating weather conditions.
The second most frequently listed perceived threat to aerial firefighting safety was a midair collision, listed by 30% of respondents. Respondents listed the threat of a midair collision as arising from the density of traffic, poor traffic management and a lack of situation awareness among pilots.
The third perceived biggest threat to aerial firefighting safety was communication, listed by just under a quarter of respondents (23%). Communication was closely followed by pilot inexperience/lack of airmanship/poor training/lack of currency (21%) and fire agency safety culture (21%), with just over a fifth of respondents listing these factors as a threat to aerial firefighting safety. The respondents who listed pilot inexperience included 4 respondents who specified a perceived loss of pilot experience as representing a threat to aerial firefighting safety. Agency pressure to fly in poor weather/poor conditions/against standard operating procedures (SOPs) was listed by a fifth of respondents (20%). The remaining perceived biggest threats to aerial firefighting safety listed by at least 5 respondents are shown in Figure 51.
Figure 51: The top threats to aerial firefighting safety by number and percentage of respondents, reported by at least 5 respondents (N = 132)51,52
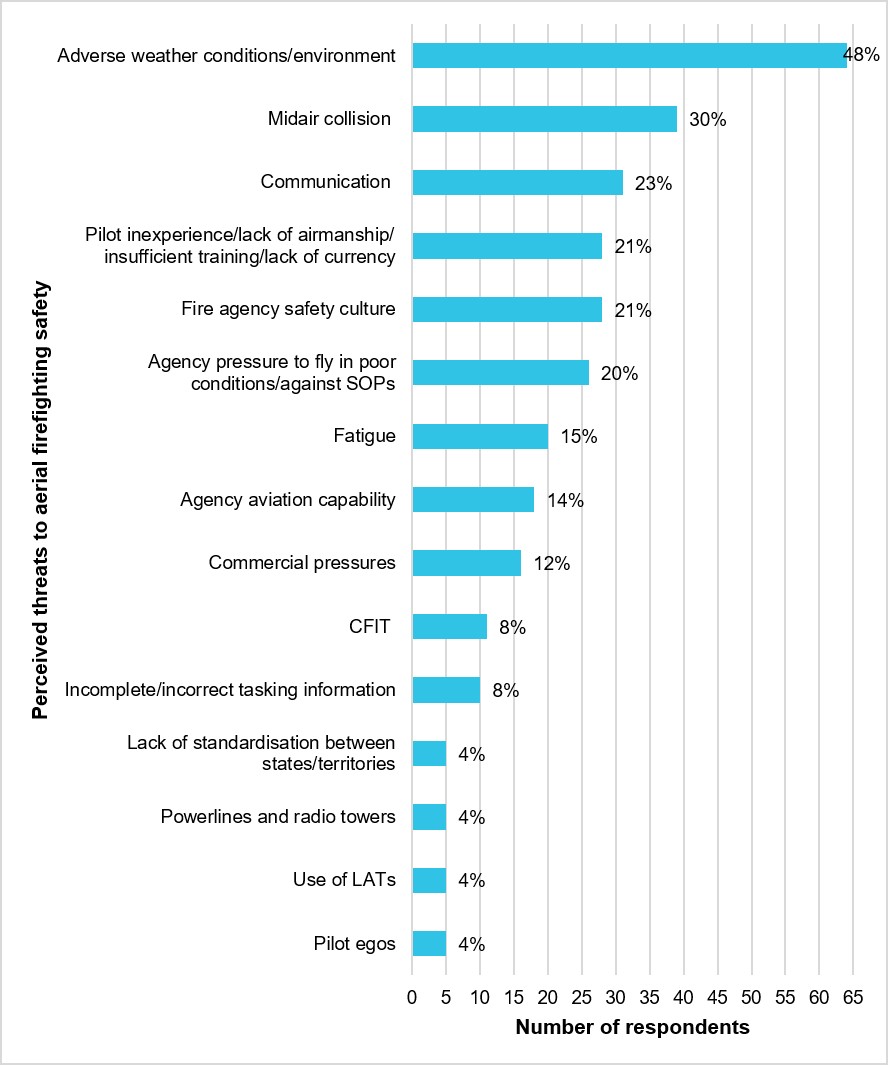
Anything else the ATSB should know about aerial firefighting safety?
Excluding the 31 respondents with ‘nothing further to add’, there were 58 respondents to the question concerning whether there was anything else the ATSB should know about the safety of aerial firefighting in Australia. These respondents raised 89 safety issues (some respondents listed more than one issue). The most frequent response was ‘fire agency culture and practices’, listed by over half of the respondents (52%) (Figure 52). This was followed by a general comment about Australia being one of the safest countries (16%), ‘fatigue and flight and duty time limits regulatory breaches’ and the need for improved SOPs that are nationalised, more comprehensive and risk‑focused (10% each) and ‘fire agency personnel capability’ (9%). Figure 52 shows the remaining responses listed by at least 2 respondents.
Figure 52: Responses to ‘Anything else ATSB should know about the safety of aerial firefighting in Australia?’ listed by at least 2 respondents, with ‘nothing further’ removed (N = 58)
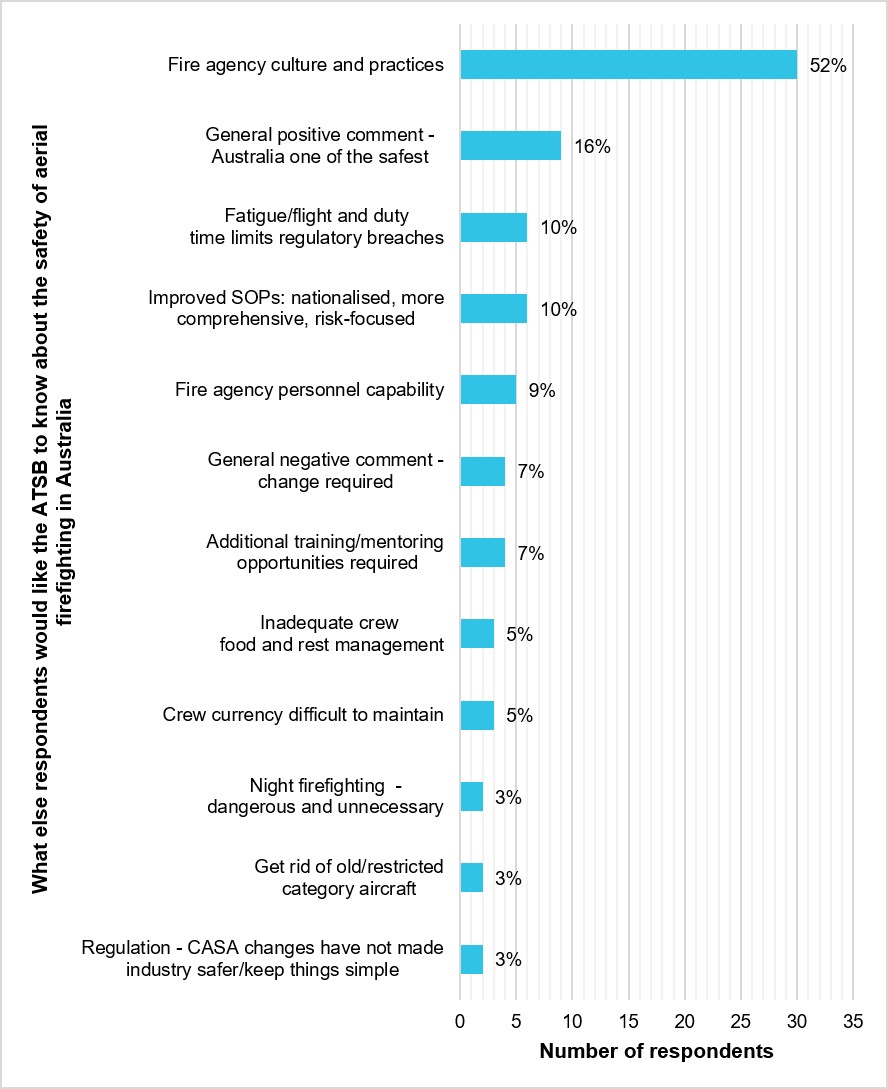
Conclusion
This report has presented the results from a survey of 149 NAFC-registered aerial firefighting pilots. The survey examined pilots’ perceptions of the hazards they faced conducting aerial firefighting operations and any opportunities they saw to improve the safety of the industry. It focused on the 4 main areas of tasking aspects, communication, reporting culture and safety culture.
Survey respondents were most positive about tasking aspects and communication, and least positive about reporting culture and safety culture. Overall, out of all the quantitative, Likert-scale questions, tasking aspects and communication each had more positive responses than negative and neutral responses combined, whereas safety culture and reporting culture had less.
Further, out of the 4 topics the survey explored, reporting culture was the topic that was perceived the most negatively by respondents. It received the lowest proportion of positive responses and the highest proportion of negative responses.
Tasking aspects
Respondents were largely positive about tasking aspects, with the majority of respondents reporting that:
- task demands were realistic
- they had not felt a level of fatigue that affected their ability to complete assigned tasks
- they had not been asked to complete safety sensitive tasks outside a duty period
- pilots were encouraged to prioritise safety over task completion by tasking agencies.
Respondents were least positive about whether decision‑makers directing aircraft had sufficient aviation training and experience, with just over half of respondents disagreeing that this was the case.
Over two thirds of respondents had refused to conduct an assigned task due to safety concerns between 2017 and 2022, primarily related to weather conditions. Approximately three quarters of respondents stated that no pressure was applied when they refused a task due to safety concerns, while almost a third of respondents reported pressure to fly from the tasking fire agency.
Communication
Respondents were also largely positive about communication. At least 60% of respondents agreed that:
- the overall quality of interactions between pilots and tasking agencies was either good or excellent
- flight following was timely and responses to missed ops-normal calls were prompt.
Further, approximately half of respondents agreed that:
- radio communication around the fireground was managed well
- safety information about the task and fireground was communicated well to pilots
- there were opportunities to brief/debrief incidents or close calls with tasking agencies
- pilots and agency personnel worked together to resolve safety issues on the fireground.
The most preferred information that respondents would have liked to see communicated about a task and fireground was:
- details of all other aircraft operating in the area and their heights
- better hazard information, including powerline mapping
- weather conditions and the associated operating limits on the fireground.
Reporting culture
Respondents were less positive about reporting culture compared to tasking aspects and communication. An exception was whether respondents had been dissuaded from reporting an incident between 2017 and 2022. Of the respondents who had needed to report an incident, 82% had not been dissuaded from doing so.
Approximately 40% of respondents agreed that:
- they were comfortable reporting incidents through formal channels
- they could report incidents without fear of repercussions.
However, there was still 21% who disagreed that they were comfortable reporting incidents through formal channels, and just over a third of respondents who disagreed that they could report incidents without fear of repercussions.
Respondents were less positive about what happened after an incident was reported. Of those who had reported an incident, a maximum of a quarter of respondents agreed that:
- they received feedback from tasking agencies after reporting an incident
- there was a quick resolution of incident reports by the tasking agencies
- they had seen the implementation of positive change after reporting an incident to the tasking agency.
Additionally, there was a statistically greater number of respondents (91,61%) who had experienced an incident between 2017 and 2022, than the 52 respondents (35%) who had reported one.
The most frequently listed serious incidents/close calls that respondents had experienced between 2017 and 2022 involved:
- a near miss
- hazardous fireground weather conditions
- poor communication.
Safety culture
There was a lot more variation among respondents regarding safety culture, compared to the other 3 topics. Respondents were most positive about whether tasking agencies were genuinely interested in pilots’ safety concerns, with just over half agreeing that this was the case, and only 20% disagreeing.
Respondents were split relatively evenly between those who agreed or disagreed that:
- tasking agencies had a good understanding of operational issues
- tasking agencies and operators had similar perspectives on the management of operational issues that impact safety.
Over a third of respondents stated that there were no changes that had improved safety between 2017 and 2022, followed by the adoption of traffic management technology.
Almost a quarter of respondents stated that there were no changes that had worsened aviation safety, followed by fire agency personnel aviation knowledge and experience.
The 3 most frequently listed changes needed to improve safety were:
- fire agency personnel aviation knowledge and experience
- improved aircrew training, mentorship and currency
- national standards.
Just under half of respondents considered the biggest threat to aerial firefighting safety to be adverse weather conditions/environment, followed by:
- midair collision
- poor communication
- pilot inexperience/lack of airmanship/poor training/lack of currency
- fire agency safety culture.
When asked if there was anything else the ATSB should know about the safety of aerial firefighting in Australia, over half of the 58 respondents to this question answered fire agency culture and associated practices.
Significance of location
Respondents’ primary location of operation was the most important factor in explaining the variation in many of the responses for all the survey topics: tasking aspects, communication, reporting culture and safety culture.
Compared to respondents from all other locations, NSW and Vic respondents were statistically more likely to disagree that:
- task demands were realistic
- safety information about the task and fireground was communicated well to pilots
- pilots and agency personnel worked together to resolve safety issues on the fireground.
Additionally, compared to respondents from all other locations, NSW and Vic respondents were statistically more likely to disagree with the following statements, but with NSW respondents also found to be statistically more likely to disagree than Vic:
- decision‑makers directing aircraft had sufficient aviation training and experience
- they had not felt external pressure to accept or complete a task in adverse operating conditions
- the overall quality of interactions between pilots and tasking agencies was good
- there were opportunities to brief/debrief incidents or close calls with tasking agencies.
Of the above 7 statements where NSW and Vic differed statistically from the remaining locations, 4 related to communication and 3 to tasking aspects.
Further, NSW respondents were statistically more likely to disagree with the following statements compared to respondents from all other locations, including Vic:
- pilots were encouraged to prioritise safety over task completion by tasking agencies
- pilots' suggestions for improving safety were encouraged by tasking agencies
- pilots could report incidents to tasking agencies without the fear of negative repercussions
- tasking agencies had a good understanding of the operational issues that impacted flight safety
- tasking agencies were genuinely interested in safety concerns raised by pilots.
Finally, NSW respondents were statistically more likely to disagree with the following statements compared to respondents from all other locations, except Vic (but Vic was not found to be statistically different from the remaining locations):
- there were adequate mechanisms in place to reduce the pressure experienced
- flight following was timely and responses to missed ops-normal calls were prompt
- they were comfortable reporting incidents through the formal channels
- tasking agencies and operators had similar perspectives on the management of operational issues that impact on flight safety.
Of the above 9 statements where NSW differed statistically from the remaining locations (including Vic on some occasions), the statements were spread relatively evenly across all 4 survey topics.
The location of respondents who were most likely to agree with the statements where location was found to be significant, varied between SA, Qld and WA.
Significance of type of main rate of pay
Respondents’ main rate of pay as either dependent or independent of their hours flown was statistically significant in explaining some variation in their agreement that:
- pilots and agency personnel worked together to resolve safety issues
- they were comfortable reporting incidents through formal channels.
However, the effect of rate of pay was weak compared to that of location. Additionally, no significant differences were found with inter-demographic comparisons, meaning the effect of location overall was not being determined by differences in rate of pay.
Safety action
New South Wales Rural Fire Service
Since the time of the survey in December 2022–January 2023, the NSW Rural Fire Service has reported that it has undertaken several initiatives to address issues raised by survey participants. These include:
- developing and implementing the RFS Aviation Safety Management System
- creating formal aviation safety committees and assurance mechanisms
- introducing strengthened hazard, occurrence and safety reporting systems supported by just culture principles
- appointing dedicated aviation safety personnel
- expanding aviation training, briefing and competency frameworks
- improving operator engagement and contractor oversight arrangements
- introducing safety performance indicators and continuous improvement mechanisms
- undertaking its own Aviation Safety Survey in late 2025 to assess awareness and effectiveness of these reforms.
National Aerial Firefighting Centre
The National Aerial Firefighting Centre (NAFC) has a Strategic Committee that has committed to facilitating several safety actions for the aerial firefighting industry, such as assisting in the development of nationally consistent standards (including in relation to the education and training of agency personnel engaged in aerial operations) and strategies that identify and manage risk in aerial firefighting.
Additionally, in 2023 following a review of groups such as the Fire Emergency Aviation Technical (FEAT) group, the NAFC established the national fire and emergency Aviation Safety Group (ASG) to reflect a stronger focus on aviation safety.
Glossary
| AAS | Air attack supervisor |
| ACT | Australian Capital Territory |
| ACT RFS | Australian Capital Territory Rural Fire Service |
| ADS-B | Automatic dependent surveillance-broadcast |
| AFAC | Australian and New Zealand Council for fire and emergency services |
| AOC | Air operator certificate |
| APA | American Psychological Association |
| AWC | Aerial work certificate |
| BoM | Bureau of Meteorology |
| Bushfires NT | Bushfires Northern Territory |
| CASA | Civil Aviation Safety Authority |
| CASR | Civil Aviation Safety Regulation |
| CBW | Calculated basic weight |
| CFA | Country Fire Authority |
| CFIT | Controlled flight into terrain |
| CTAF | Common traffic advisory frequency |
| CWN | Call-when-needed |
| DBCA | Department of Biodiversity, Conservation and Attractions |
| DEECA | Department of Energy, Environment and Climate Action |
| DELWP | Department of Environment, Land, Water and Planning |
| DFES | Department of Fire and Emergency Services |
| FEAT | Fire Emergency Aviation Technical group |
| FRV | Fire Rescue Victoria |
| FW | Fixed wing |
| FWER | Family wise error rate |
| ICAO | International Civil Aviation Organisation |
| LAT | Large air tanker |
| MEAT | Multi Engine Air Tanker |
| MTOW | Maximum take‑off weight |
| NAFC | National Aerial Firefighting Centre |
| NT | Northern Territory |
| NOTAM | Notice to airmen |
| NPWS | NSW National Parks and Wildlife Service |
| NRSC | National Resource Sharing Centre |
| NSW | New South Wales |
| NSW RFS | New South Wales Rural Fire Service |
| Qld | Queensland |
| QFD | Queensland Fire Department |
| QFES | Queensland Fire and Emergency Services |
| RCNNDA | Royal Commission into National Natural Disaster Arrangements |
| RW | Rotary wing |
| RPAS | Remotely piloted aircraft system |
| SA | South Australia |
| SA CFS | South Australia Country Fire Service |
| SAD | State air desk |
| SEAT | Single engine air tanker |
| SOP | Standard operating procedure |
| Tas | Tasmania |
| TFS | Tasmania Fire Service |
| UHF | Ultra high frequency |
| VHF | Very high frequency |
| Vic | Victoria |
| WA | Western Australia |
| WA DFES | Western Australia Department of Fire and Emergency Services |
| WHS | Work health and safety |
Sources and submissions
Sources of information
149 NAFC-registered Australian aerial firefighting pilots.
References
Abdi, H. (2007). Bonferroni and Šidák corrections for multiple comparisons. In Neil Salkind (Ed.) Encyclopedia of measurement and statistics, 3(01). Sage.
Altman, D. G., & Bland, J. M. (2009). Parametric v non-parametric methods for data analysis. BMJ, 338.
American Psychological Association (APA). (2010). Publication manual of the American Psychological Association (6th ed.). American Psychological Association.
Antonsen, S. (2018). Key issues in understanding and improving safety culture. In Safety cultures, safety models: Taking stock and moving forward (pp. 127-136). Springer International Publishing.
Armstrong, R. A. (2014). When to use the Bonferroni correction. Ophthalmic and Physiological Optics, 34(5), 502–508.
Australasian Fire and Emergency Services Authorities Council. (2021). Professional standard: Registered Air Attack Supervisor, Emergency Management Professionalisation Scheme, AFAC. https://www.emps.org.au/wp-content/uploads/2021/12/EMPSProfStandard_Registered_Air_Attack_Supervisor_web.pdf
Australian Transport Safety Bureau. (2020). A safety analysis of aerial firefighting occurrences in Australia, July 2000 to March 2020. (AR-2020-022). https://www.atsb.gov.au/sites/default/files/media/5777923/ar-2020-022_final.pdf
Australian Transport Safety Bureau. (2026). Analysis of Australian aerial firefighting agency and operator interviews regarding aviation safety. (AS-2021-015a). https://www.atsb.gov.au/sites/default/files/documents/2026-05/AS-2021-015a%20Final.pdf
Biggs, H., Dingsdag, D., Sheahan, V., & Stenson, N. (2005). The role of collaboration in defining and maintaining a safety culture: Australian perspectives in the construction sector. In ARCOM (Association of Researchers in Construction Management) Proceedings of the Twenty First Annual Conference 2005, Volume 1, 137–146. ARCOM (Association of Researchers in Construction Management).
Binskin, M., Bennett, A. & Macintosh, A. (2020). Report of the royal commission into national natural disaster arrangements (RCNNDA). Commonwealth of Australia. https://www.royalcommission.gov.au/natural-disasters
Braun, V., & Clarke, V. (2006). Using thematic analysis in psychology. Qualitative Research in Psychology, 3(2), 77–101.
Brooks, B., Curnin, S., Bearman, C., & Owen, C. (2018). Human error during the multilevel responses to three Australian bushfire disasters. Journal of Contingencies and Crisis Management, 26(4), 440–452.
Bureau of Meteorology (BOM) and CSIRO. (2024). State of the climate 2024. Retrieved from http://www.bom.gov.au/state-of-the-climate/
Civil Aviation Safety Authority. (2025). Advisory Circular AC 138-01 v3.1, Part 138 core concepts. https://www.casa.gov.au/resources-and-education/publications/guidance-material/advisory-circulars
Civil Aviation Safety Authority. (2023). Aerial firefighting sector safety risk profile. https://www.casa.gov.au/operations-safety-and-travel/safety-management-systems/sector-safety-risk-profiles/aerial-firefighting-sector-safety-risk-profile#undefined
Cohen, J. (1988). Statistical power analysis for the behavioural sciences (2nd ed.). Lawrence Erlbaum Associates, Publishers.
Cooper, M. D. (2018). The safety culture construct: theory and practice. In C. Gilbert, B. Journe, H. Laroche and C. Bieder (Eds.), Safety cultures, safety models: Taking stock and moving forward (pp. 47–61). Springer International Publishing.
Dekker, S. (2018). Just culture: Restoring trust and accountability in your organization. CRC Press.
Dinno, A. (2015). Nonparametric pairwise multiple comparisons in independent groups using Dunn's test. The Stata Journal, 15(1), 292–300.
Elliott, V. (2018). Thinking about the coding process in qualitative data analysis. Qualitative Report, 23(11).
Ellis, P. D. (2010). The essential guide to effect sizes: Statistical power, meta-analysis, and the interpretation of research results. Cambridge University Press.
Funder, D. C., & Ozer, D. J. (2019). Evaluating effect size in psychological research: Sense and nonsense. Advances in Methods and Practices in Psychological Science, 2(2), 156–168.
Haslbeck, A., Schmidt-Moll, C., & Schubert, E. (2015). Pilots’ willingness to report aviation incidents. In 18th International Symposium on Aviation Psychology (pp. 596).
Hopkins, A. (2018). The use and abuse of “culture”. In Gilbert, C., Journé, B., Laroche, H., & Bieder, C. (Eds.) Safety cultures, safety models: Taking stock and moving forward (pp. 35–45). Springer International Publishing.
Hutter, B & Lloyd-Bostock, S. (2015). Investigating reporting culture amongst pilots: A briefing study (pp. 1–30). LSE Enterprise. https://www.lse.ac.uk/business/consulting/reports/investigating-reporting-culture-amongst-pilots
International Civil Aviation Organisation (ICAO). (2018). Safety management manual, Doc 9859, AN/460, (4th ed.).
Kerby, D. S. (2014). The simple difference formula: an approach to teaching nonparametric correlation. Comprehensive Psychology,3(1).
Kioulepoglou, P., Nikolaidis, V., David, K. M., & Makris, I. (2025). Investigating incident under-reporting in aviation: Qualitative insights among Greek pilots. Research in Transportation Business & Management, 59, 101309.
Kirwan, B., Reader, T. & Parand, A. (2018). The safety culture stack – the next evolution of safety culture? Safety and Reliability, 38(3), 200–217.
Lochmiller, C. R. (2021). Conducting Thematic Analysis with Qualitative Data. The Qualitative Report, 26(6), 2029–2044.
Macrae, C. (2016). The problem with incident reporting. BMJ Quality & Safety, 25(2), 71–75.
Magstadt, S., Belval, E. J., Pietruszka, B., Wei, Y., & O'Connor, C. D. (2026). An assessment of aerial firefighting response times between agencies during the 2020 fire season in California. International Journal of Disaster Risk Reduction, 137, 106105.
McMurtrie, K. J., & Molesworth, B. R. (2018). Australian flight crews’ trust in voluntary reporting systems and just culture policies. Aviation Psychology and Applied Human Factors, 8(1), 11–21.
Melin, M., Lager, E., & Lindfors, P. (2018). High-flying risks: Variations in working conditions, health, and safety behaviours among commercial airline pilots in relation to safety climate perceptions. In Book of Proceedings 13th Conference of the European Academy of Occupational Health Psychology: Adapting to Rapid Changes in Today’s Workplace, 243–244.
National Aerial Firefighting Centre. (2025a). Fleet. https://www.nafc.org.au/fleet/
National Aerial Firefighting Centre. (2025b). Strategic Approach 2025–2030. NAFC-Strategic-Approach_2025-2030-1.pdf
National Aerial Firefighting Centre. (2025c). Specimen contract for services. https://www.nafc.org.au/wp-content/uploads/2019/01/NAFC-AFAC-Specimen-Contract.pdf
National Aerial Firefighting Centre. (2023a). NAFC commitment to aviation safety. https://www.nafc.org.au/aerial-firefighting-safety/
National Aerial Firefighting Centre. (2023b). PR-001 Firebombing Aircraft Types. Standard Version 2023.1.01. https://www.nafc.org.au/wp-content/uploads/2023/07/NAFC-Standard-PR-001-Firebombing-Aircraft-Types.pdf
New South Wales Rural Fire Service. (2022). Interagency Aviation Standard Operating Procedures, Version 4.2. https://www.rfs.nsw.gov.au/__data/assets/pdf_file/0004/290848/Interagency-Aviation-SOP.pdf
O’Connor, P., O’Dea, A., Kennedy, Q., & Buttrey, S. E. (2011). Measuring safety climate in aviation: A review and recommendations for the future. Safety Science, 49(2), 128–138.
Okoye, K., Hosseini, S. (2024). Wilcoxon Statistics in R: Signed-Rank Test and Rank-Sum Test. In: R Programming: Statistical data analysis in research (pp 279–303). Springer.
Parker, D., Lawrie, M., & Hudson, P. (2006). A framework for understanding the development of organisational safety culture. Safety Science, 44(6), 551–562.
Patankar, M. S. (2012). Safety culture: Building and sustaining a cultural change in aviation and healthcare. Ashgate Publishing, Ltd.
Pidgeon, N. F., & O'Leary, M. (1994). Organizational safety culture: Implications for aviation practice. In N. Johnston, N. McDonald, & R. Fuller (Eds.), Aviation Psychology in Practice (pp. 21–43). Avebury Technical Press.
Peres, F. F. (2026). Effect sizes for nonparametric tests. Biochemia Medica, 36(1), 5–16.
Rea, L. M., & Parker, R. A. (2014). Designing and conducting survey research: A comprehensive guide. John Wiley & Sons.
Reason, J. (1998). Achieving a safe culture: Theory and practice. Work & Stress, 12(3), 293–306.
Reason, J. (1997). Managing the risks of organizational accidents. Ashgate.
Rubin, M. (2024). Inconsistent multiple testing corrections: The fallacy of using family-based error rates to make inferences about individual hypotheses. Methods in Psychology, 10, 100140.
Schmidt, S. (2010). Kruskal–Wallis test. In Encyclopedia of research design, Vol. 0 (pp. 674–676). Sage Publications, Inc.
Schäfer, T., & Schwarz, M. A. (2019). The meaningfulness of effect sizes in psychological research: Differences between sub-disciplines and the impact of potential biases. Frontiers in Psychology, 10, 813.
Shaffer, J. P. (1995). Multiple hypothesis testing. Annual Review of Psychology, 46(1), 561–584.
Siegel, S., & Castellan Jr, N. J. (1988). Nonparametric statistics for the behavioral sciences, (2nd ed.). McGraw-Hill Book Company.
Skjott Linneberg, M., & Korsgaard, S. (2019). Coding qualitative data: A synthesis guiding the novice. Qualitative Research Journal, 19(3), 259–270.
Skybrary. (2026). Safety culture. https://skybrary.aero/articles/safety-culture
Sullivan, G. M. and Artino Jr, A. R. (2013). Analysing and interpreting data from Likert-type scales. Journal of Graduate Medical Education, 5(4), 541–542.
Tear, M. J., Reader, T. W., Shorrock, S., & Kirwan, B. (2020). Safety culture and power: interactions between perceptions of safety culture, organisational hierarchy, and national culture. Safety Science, 121, 550–561.
Varone, C. (2003). Firefighter safety and radio communication. Fire Engineering, 156(3), 141–164.
Wiegmann, D. A., Zhang, H., Von Thaden, T. L., Sharma, G., & Gibbons, A. M. (2004). Safety culture: An integrative review. The International Journal of Aviation Psychology, 14(2), 117–134.
Wiegmann, D. A., Zhang, H., Von Thaden, T., Sharma, G., & Mitchell, S. (2002). A synthesis of safety culture and safety climate research (Technical Report No. ARL-02-3/FAA-02-2). Federal Aviation Administration.
Submissions
Under section 26 of the Transport Safety Investigation Act 2003, the ATSB may provide a draft report, on a confidential basis, to any person whom the ATSB considers appropriate. That section allows a person receiving a draft report to make submissions to the ATSB about the draft report.
A draft of this report was provided to the following directly involved parties:
- National Aerial Firefighting Centre
- Civil Aviation Safety Authority
- Australian Capital Territory Rural Fire Service
- Bushfires Northern Territory
- Department of Biodiversity, Conservation and Attractions, Western Australia
- Department of Fire and Emergency Services, Western Australia
- Department of Energy, Environment and Climate Action, Victoria
- New South Wales Rural Fire Service
- New South Wales National Parks and Wildlife Service
- Queensland Fire Department
- South Australian Country Fire Service
- Tasmania Fire Service.
Submissions were received from:
- National Aerial Firefighting Centre
- Civil Aviation Safety Authority
- New South Wales Rural Fire Service
- Department of Fire and Emergency Services, Western Australia
- Department of Energy, Environment and Climate Action, Victoria.
The submissions were reviewed and, where considered appropriate, the text of the report was amended accordingly.
Appendices
Appendix A – Australian firebombing aircraft types
Rotary wing (helicopter) firebombing aircraft types
Rotary wing (RW) aircraft capable of firebombing have a type based on internal payload and water carrying capacity (Table A1).
Table A1: Rotary wing aircraft types
| Type | Internal payload | Water carrying capacity |
| RW 1 | 2,268 kg or greater | 2,650 litres or greater |
| RW 2 | Between 1,134 kg and 2,267 kg inclusive | Between 1,135 litres and 2,649 litres inclusive |
| RW 3 | Between 544 kg and 1,133 kg inclusive | Between 380 litres and 1,134 litres inclusive |
| RW 4 | Less than 544 kg | Less than 380 litres |
Internal payload = Maximum take‑off weight (MTOW) – Calculated Basic Weight (CBW). MTOW is as specified in the aircraft flight manual for internal loads at International Standard Atmosphere (ISA) conditions.
CBW is the basic weight (empty weight) for the aircraft in the aircraft flight manual, adjusted to include factors such as fuel reserves, communication and navigation equipment and equipment for firebombing operations. It may exclude factors including flight crew, suppressant and retardant, and sling load equipment.
RW water carrying capacity is the maximum volume of water that can be carried by the aircraft in the tendered delivery system.
Fixed wing (aeroplane) firebombing aircraft types
Fixed wing (FW) aircraft used for firebombing are assigned a type based on water carrying capacity (Table A2). FW water carrying capacity is the maximum volume of water that can be carried in the attached tank(s), excluding concentrate tanks.
Table A2: Fixed wing aircraft types
| Type | Engines | Descriptor | Water carrying capacity |
| FW 1 | Multi engine | Large Air Tanker (LAT) | Greater than 11,356 litres |
| FW 2 | Multi engine | Medium Multi Engine Air Tanker (MEAT) | Between 6,813 and 11,356 litres inclusive |
| FW 3 | Multi engine | Small MEAT | Less than 6,813 litres |
| FW 4 | Single engine | Medium Single Engine Air Tanker (SEAT) | Greater than 2,270 litres |
| FW 5 | Single engine | Small SEAT | Less than or equal to 2,270 litres |
Appendix B – Survey introduction and questions
Survey introduction
The Australian Transport Safety Bureau is seeking your assistance with this safety study into aerial firefighting in Australia. Your observations and experiences will help the ATSB team better understand the hazards you face, and the opportunities you can see, to improve the safety of aerial firefighting operations in the future.
The ATSB recognises a requirement for anonymity, so this is an anonymous survey and by design, no response is linked to any identity. The survey will take approximately 10 minutes to complete. Please select the most appropriate response and/or type written responses in each box. Text fields can be typed in and generally have unlimited text length. There is an option to provide your details at the end of the survey if you want one of the safety study team to contact you. Any personal details provided will be managed as per the ATSB’s Privacy Policy.
Demographics
Q1) Please input your total flying hours.
(1,500–2,000; 2,000–2,500; 2,500–3,000; 3,000–3,500; 3,500–4,000; 4,000–5,000; 5,000–6,000; 6,000–7,000; 7,000–8,000; 8,000–9,000; 9,000–10,000; 10,000+).
Q2) Please input your total aerial firefighting experience (in hours).
(50–100; 100–200; 200–300; 300–400; 400–500; 500–1,000; 1,000–2,000; 2,000–3,000; 3,000–4,000; 4,000–5,000; 5,000+).
Q3) What is your aerial firefighting experience in the last 5 years? (in hours).
(50–100; 100–200; 200–300; 300–400; 400–500; 500–1,000; 1,000–2,000; 2,000−3,000).
Q4) What is the primary type and model of aircraft you have flown for aerial firefighting over the last 5 years? (Open response).
Q5) What was your primary role over the last 5 years?
(Air attack supervision, Firebombing, Aerial ignition, Incident mapping, Winching and rappelling, Transport – fire and emergency crew, Transport – passenger, Incident observation).
Q6) What was your primary state/territory of operation over the last 5 years?
Q7) What was the main type of contract you worked on over the last 5 years?
(Call when needed, Primary).
Q8) Was your main rate of pay over the last 5 years dependent or independent of hours flown?
(Dependent, Independent).
Tasking aspects
In the previous 5 years:
Q9) I thought task demands were realistic in terms of meeting the capabilities of the pilot, aircraft and equipment.
(1 = Strongly disagree, 2 = Disagree, 3 = Neither agree nor disagree, 4 = Agree, 5 = Strongly agree).
Q10) I felt a level of fatigue that affected my ability to complete my assigned tasks operating or positioning aircraft.
(1 = Strongly disagree, 2 = Disagree, 3 = Neither agree nor disagree, 4 = Agree, 5 = Strongly agree).
Q11) I have been asked to complete safety sensitive tasks outside of my duty period
(1 = Strongly disagree, 2 = Disagree, 3 = Neither agree nor disagree, 4 = Agree, 5 = Strongly agree).
Q12) I thought in general pilots were encouraged to prioritise safety over task completion by external tasking agencies.
(1 = Strongly disagree, 2 = Disagree, 3 = Neither agree nor disagree, 4 = Agree, 5 = Strongly agree).
Q13) I thought decision makers directing aircraft had sufficient aviation training and experience.
(1 = Strongly disagree, 2 = Disagree, 3 = Neither agree nor disagree, 4 = Agree, 5 = Strongly agree).
Q14) I have felt external pressure to accept or complete a task in adverse operating conditions.
(1 = Strongly disagree, 2 = Disagree, 3 = Neither agree nor disagree, 4 = Agree, 5 = Strongly agree).
Q15) I thought there were adequate mechanisms in place to reduce the pressure experienced.
(1 = Strongly disagree, 2 = Disagree, 3 = Neither agree nor disagree, 4 = Agree, 5 = Strongly agree).
Q16) I have refused to conduct an assigned task due to safety concerns.
(Yes, No).
Q17) If yes to Q17, how many times has this occurred? (Open response).
Q18) If yes to Q17, please describe the reasons for refusals and what happened afterwards. (Open response).
Communication
In the previous 5 years:
Q19) How well was radio communication around the fire ground managed?
(1 = Very poor, 2 = Poor, 3 = Fair, 4 = Good, 5 = Excellent).
Q20) How well was safety information about the task and fire ground communicated to pilots?
(1 = Very poor, 2 = Poor, 3 = Fair, 4 = Good, 5 = Excellent).
Q21) What safety information would you have liked to see communicated about a task and fire ground? (Open response).
Q22) What was the overall quality of interactions between pilots and tasking agencies?
(1 = Very poor, 2 = Poor, 3 = Fair, 4 = Good, 5 = Excellent).
Q23) Flight following was timely and responses to missed ops-normal calls were prompt.
(1 = Strongly disagree, 2 = Disagree, 3 = Neither agree nor disagree, 4 = Agree, 5 = Strongly agree).
Q24) There were opportunities to brief/debrief incidents or close calls with tasking agencies.
(1 = Strongly disagree, 2 = Disagree, 3 = Neither agree nor disagree, 4 = Agree, 5 = Strongly agree).
Q25) Pilots and agency personnel worked together to resolve safety issues on the fire ground.
(1 = Strongly disagree, 2 = Disagree, 3 = Neither agree nor disagree, 4 = Agree, 5 = Strongly agree).
Q26) Pilots’ suggestions for improving safety were encouraged by tasking agencies.
(1 = Strongly disagree, 2 = Disagree, 3 = Neither agree nor disagree, 4 = Agree, 5 = Strongly agree).
Reporting culture
In the previous 5 years:
Q27) How often had you experienced an incident during the Australian firefighting season?
(Never, 1–2 times, 3–4 times, 4–5 times, more than 6 times).
Q28) How often have you reported an incident through formal channels during the Australian firefighting season?
(Never, 1–2 times, 3–4 times, 4–5 times, more than 6 times).
Q29) What were the most serious incidents/close calls you have experienced? (list up to 5). (Open response).
Q30) I was comfortable reporting incidents through the formal channels.
(1 = Strongly disagree, 2 = Disagree, 3 = Neither agree nor disagree, 4 = Agree, 5 = Strongly agree).
Q31) I could report incidents to tasking agencies without the fear of negative repercussions.
(1 = Strongly disagree, 2 = Disagree, 3 = Neither agree nor disagree, 4 = Agree, 5 = Strongly agree).
Q32) When an incident is reported, I thought there was quick resolution by the tasking agency.
(1 = Strongly disagree, 2 = Disagree, 3 = Neither agree nor disagree, 4 = Agree, 5 = Strongly agree).
Q33) I have received feedback from the tasking agency after reporting an incident.
(1 = Strongly disagree, 2 = Disagree, 3 = Neither agree nor disagree, 4 = Agree, 5 = Strongly agree).
Q34) I have seen the implementation of positive change after reporting an incident to the tasking agency.
(1 = Strongly disagree, 2 = Disagree, 3 = Neither agree nor disagree, 4 = Agree, 5 = Strongly agree).
Q35) Have you ever been dissuaded from reporting an incident?
(Yes, No, N/A-didn’t need to report an incident).
Q36) Please describe what happened. (Open response).
Safety culture
In the previous 5 years:
Q37) What changes have you observed that have improved aviation safety in aerial firefighting? (Open response).
Q38) What changes have you observed that have worsened aviation safety in aerial firefighting? (Open response).
Q39) What would you like to see changed with reference to improving safety? (Open response).
Q40) The tasking agencies had a good understanding of the operational issues that impacted flight safety.
(1 = Strongly disagree, 2 = Disagree, 3 = Neither agree nor disagree, 4 = Agree, 5 = Strongly agree).
Q41) Tasking agencies and operators had similar perspectives on the management of the operational issues that impact on flight safety.
(1 = Strongly disagree, 2 = Disagree, 3 = Neither agree nor disagree, 4 = Agree, 5 = Strongly agree).
Q42) Tasking agencies were genuinely interested in safety concerns raised by pilots.
(1 = Strongly disagree, 2 = Disagree, 3 = Neither agree nor disagree, 4 = Agree, 5 = Strongly agree).
Q43) What do you see as the 3 biggest threats to safety during aerial firefighting [in order of priority]? (Open response).
Q44) Is there anything else you would like the ATSB to know about the safety of aerial firefighting in Australia at present? (Open response).
Appendix C – Statistical tests and assumptions
The Likert scale
The Likert scale is a 5-, 7- or 9-point ordinal scale used by respondents to rate the degree to which they agree or disagree with a statement. The Likert scale is sometimes treated as being continuous within the social sciences for the purposes of analysis. This occurs particularly when 7- or 9-point scales are used, because the additional points on the scale arguably make it more continuous. This study took a more conservative approach and treated the Likert scale as an ordinal variable. In an ordinal scale, although we assign a number to the points on a scale, responses can be rated or ranked, but the distance between responses is not measurable. Thus, the differences between ‘always’, ‘often’, and ‘sometimes’ on a Likert scale are not necessarily equal. In other words, one cannot assume that the difference between responses is equidistant even though the numbers assigned to those responses are (Solomon and Artino Jr, 2013). Descriptive statistics such as means and standard deviations therefore have unclear meanings when applied to Likert scale responses. For example, what is the average of ‘neither agree nor disagree’ and ‘disagree’? Means and standard deviations are therefore considered to be less meaningful with Likert scales and are not usually reported, only medians and modes.
Parametric versus nonparametric
Statistical methods of data analysis that are based on assumptions about the distribution of the data are called parametric methods, because we estimate the parameters of the distribution assumed for the data, such as the mean and standard deviation. Parametric methods assume that the data follow a normal distribution and that the spread of the data (variance) is uniform either between groups or across the range being studied. In contrast, non-parametric methods such as the Kruskal-Wallis or the Wilcoxon signed‑rank test do not require the data to follow a particular distribution. They work by using the rank order of observations rather than the measurements themselves (Altman and Bland, 2009).
Kruskal-Wallis H test
The Kruskal-Wallis test (also known as the Kruskal-Wallis one-way analysis of variance) is a non-parametric (distribution free) test when there are 3 or more independent groups to compare. It is a non-parametric alternative to a one-way analysis of variance (ANOVA). It is calculated by ranking all the data points from low to high, then computing the average (mean) for the ranks for each group, to assess if a significant difference exists between the mean ranked values of the different groups. This is an abstract method of analysing the data, rather than directly analysing the data itself. It makes the Kruskal-Wallis less powerful than parametric tests, especially with a smaller sample size, but it allows the analysis of ordinal data in a way that is not as sensitive to non-normality or outliers. The Kruskal-Wallis test calculates a test statistic (H) that follows a chi-square distribution with (k-1) degrees of freedom, where (k) represents the number of groups (Schmidt, 2010).
The Dunn test
After a Kruskal-Wallis test has been performed to determine if there are significant differences between 3 or more independent groups for the variables studied, post hoc comparison procedures are used to determine which groups in particular differ from one another. This study used the Dunn post hoc test for multiple comparisons, because it is the non-parametric alternative to post hoc tests commonly used when the data is normally distributed, such as the Tukey test. The Dunn’s test performs pairwise comparisons between each independent group using the mean rankings of each group from the preceding Kruskal-Wallis test (Dinno, 2015). Thus, it uses the same data as the Kruskal-Wallis to test differences between any 2 groups, which is why it is the most appropriate post hoc test following the Kruskal-Wallis.
The Bonferroni Correction
When undertaking multiple comparisons, however, the more comparisons you make, the easier it is to find rare events and therefore the easier it is to make the mistake of thinking that there is an effect when there is none (a type I error, or ‘false positive’). The probability that you will get at least one type I error in the set (‘family’) or tests is called the Family Wise Error Rate (FWER) (Shaffer, 1995). To protect against the FWER, the alpha level can be corrected using methods such as the Bonferroni correction or similar alternatives such as the Holm correction, which is considered slightly less conservative (Abdi, 2007).
There is widespread and often automatic use of the Bonferroni correction following the Dunn post hoc test for multiple comparisons, despite controversy surrounding if, or under what circumstances, a correction should be used (Armstrong, 2014). One of the main reasons against correcting for the FWER is that making the alpha level more stringent (that is, smaller) will decrease the probability of type I errors, but it also increases the probability of a type II error, such that real differences between groups may not be detected. The Bonferroni correction is therefore a relatively conservative method, and its use depends on whether the researcher is prepared to accept a higher risk of either type I or type II error.
Armstrong (2014), Rubin (2024) and others have argued that researchers should choose to use the Bonferroni correction (or similar alternatives) based on the circumstances of the study and consideration of the relative risks of either a type I or type II error within the specific context. The decision to use a method of correction should also be based on whether the study is using the comparisons to draw conclusions about the ‘family’ or just certain groups.
With this in mind, the Bonferroni correction was not used to control the FWER in this study because of the purpose of ATSB investigations to enhance safety (refer to AR‑2007-053 for further details). Within the context of enhancing safety, there is more to be gained by highlighting where areas of safety improvement may exist, than in underestimating the significance of a result and failing to do so.
Wilcoxon signed-rank test
The Wilcoxon signed-rank test is a nonparametric alternative to the t-test for dependent or ‘paired’ samples. The Wilcoxon is particularly recommended in a situation where the data is ordinal or is not normally distributed. It assigns ranks to the absolute difference between each of the paired samples’ scores and then tests whether the summed rank values of the negative and positive signed rank groups differ statistically from each other. More weight is given to a pair which shows a large difference between the 2 conditions than to a pair which shows a small difference (Seigel and Castellan, 1988). The Wilcoxon signed-rank test thus considers both the signs of the differences and the magnitudes of the observed differences (Okoye and Hosseini, 2024).
The Mann-Whitney U test
The Mann-Whitney U test (also known as the Wilcoxon rank sum test) is a nonparametric alternative to an independent samples t-test. It is used to compare differences between 2 independent groups when the dependent variable is either ordinal or continuous, but not normally distributed. It is also considered appropriate for smaller sample sizes (Siegel and Castellan, 1988). As with the Wilcoxon signed-rank test, the Kruskal-Wallis and most other nonparametric tests, the Mann-Whitney U test is based on ranks rather than the original observations. It ranks all observations from both groups together and then sums the ranks for each group. The test indicates whether one population tends to produce higher values than the other population.
Effect size
Effect size is an estimate of how much variance in the response variables is accounted for by the explanatory variables. While a p‑value indicates if a result is likely due to chance, effect size indicates the magnitude of the difference between 2 groups.
The type of test used for effect size depends on the type of variables being studied and whether the data is parametric. Most effect sizes fall into one of 2 ‘families’ of effects: differences between groups (known as the d family) and measures of association (known as the r family) (Ellis, 2010). But there are other groups of effect sizes, such as eta squared (η2) and its alternative epsilon-squared (ɛ²) used in this study after the Kruskal‑Wallis. Following Cohen (1988), approaches to interpreting effect size tend to translate the coefficient into descriptors such as ‘small‑medium‑large’ or ‘weak‑moderate‑strong’. When interpreting effect size, effect sizes in the different ‘families’ each have different thresholds for ‘small‑medium‑large’, so care must be taken not to conflate the different sets of values (Table C1).
Table C1: Cohen’s recommended approach to interpreting effect size (Cohen, 1988, cited in Ellis, 2010)
d | r | η2 (eta squared) and its alternatives incl. ɛ² (epsilon-squared) | |
| Small | 0.2 | 0.1 | 0.01 |
| Medium | 0.5 | 0.3 | 0.06 |
| Large | 0.8 | 0.5 | 0.14 |
Additionally, the value that is given to each coefficient even for a particular ‘family’ of effect sizes can differ slightly between authors and disciplines (Schafer and Schwartz, 2019). This means that the thresholds for describing when, for example, a ‘small’ effect becomes a ‘medium’ one for d, can vary from 0.4–0.5. While effect sizes provide a useful indication of the magnitude of a significant effect, therefore, there are no absolute rules for the interpretation of their strength.
Interpretations of effect size should be considered as a guide only, alongside considerations of other factors such as context and sample size. Further, as Cohen (1988) and Funder and Ozer (2019) argue, effect sizes would ideally be benchmarked against similar studies in similar areas of research. It is when this is not possible that the values for ‘small’, medium’ or ‘large’ can be used as a guide (Ellis, 2010).
Epsilon-squared (ɛ²)
Epsilon squared is a nonparametric effect size measure paired with the Kruskal-Wallis test. It estimates the proportion of variance in the ranked dependent variable (in this study for example, the results from a particular question) that is explained by group membership (in this study, location).
Epsilon-squared effect size interpretation (Cohen, 1988; see also Rea and Parker, 2014; Perez, 2026):
< 0.01 = negligible
0.01 = small
0.06 = medium
0.14 = large.
Rank-biserial correlation (rrb)
The rank-biserial correlation (also known as the Glass rank biserial correlation) is a nonparametric effect size for the Mann‑Whitney U test (2 independent samples) and the Wilcoxon signed‑rank test (paired samples). The rank‑biserial correlation quantifies the degree to which one group tends to have larger values than the other on a standardised scale from −1 to +1. In both instances, the correlation represents the difference between the proportion of favourable and unfavourable pairs/signed ranks (Kerby, 2014). Values range from −1; that is, all values of the second sample are larger than all the values of the first sample, to +1; that is, all values of the second sample are smaller than all the values of the first sample. Zero represents no difference between the samples.
Rank biserial correlation effect size interpretation (Cohen, 1988):
0.10 = small
0.30 = medium
≥ 0.50 = large.
Qualitative coding and thematic analysis
Qualitative coding involves systematically categorising responses in qualitative data in order to find themes and patterns. The first level of coding qualitative data involves assigning codes that are akin to labels, but which accurately summarise and represent what is being said. Following this, the codes begin to be grouped into categories. These categories can be organized in a variety of ways. Within this study, codes that were similar to each other, or relate to the same topics or general concept, were grouped together (Elliot, 2018). It is at this stage that the assigned codes start to be transformed into themes, using thematic analysis.
Thematic analysis is defined as ‘a method for identifying, analysing and reporting patterns (themes) within data’ (Braun and Clarke, 2006). The analyst produces an understanding of coded data based on the recurring application of codes and the patterns associated with those codes. The more frequently codes appear in the data set, the more likely it is that the analyst will state that code as the basis of a theme (Lochmiller, 2021).
The ultimate aim of thematic analysis is to produce themes based on the coding applied to the data by considering the broader salience and meaning of each response (Lochmillar, 2021). However, for the purpose of analysing the qualitative responses to this survey, it was unnecessary to go beyond the initial stages of categorising the data and then grouping and organising those categories for each qualitative question. This was sufficient to enable the categories to be quantified to determine their relative frequency and possible significance.
Appendix D – Statistical analyses: Tasking aspects
Realism of task demands, by location
A Kruskal-Wallis test showed a statistical relationship between respondents’ primary state or territory of operation (location) and their degree of agreement about the realism of tasking demands ((H(2)54 = 21.96, p < .001, ɛ² = 0.15 [large effect]).55
Table D1: Respondents’ degree of agreement that task demands were realistic, by location (N = 148)56
| Location57 | Sample size | Median | Mode | MAD | Min | Max |
| NSW | 73 | 4.0 | 4.0 | 1.0 | 1.0 | 5.0 |
| Qld | 9 | 5.0 | 5.0 | 0.0 | 1.0 | 5.0 |
| SA | 14 | 4.5 | 5.0 | 0.0 | 3.0 | 5.0 |
| Tas | 11 | 4.0 | 4.0 | 1.0 | 2.0 | 5.0 |
| Vic | 34 | 4.0 | 4.0 | 0.0 | 1.0 | 5.0 |
| WA | 7 | 5.0 | 5.0 | 0.0 | 4.0 | 5.0 |
Despite responses from all locations generating a median and mode of at least 4 (Table D1), Table D2 shows that compared to other states/territories, NSW had the least percentage of respondents (64%) who either agreed or strongly agreed that task demands were realistic. NSW also had the highest percentage of respondents (22%) who disagreed or strongly disagreed with the statement, followed by Tas with 18%. In contrast, SA (Mdn = 4.5) and WA (Mdn = 5) did not have any respondents who disagreed or strongly disagreed that task demands were realistic (min. = 3 and min. = 4, respectively). Further, all WA respondents agreed or strongly agreed with the statement, followed by SA with 93%.
Table D2: Percentage of respondents’ degree of agreement that task demands were realistic, by location

Post hoc comparisons using the Dunn’s test were done to examine which state or territory groups were statistically different, using the following 3 location groups: NSW, Vic and the remaining locations (consisting of all remaining locations: NT, Qld, SA, Tas and WA).58 They revealed a statistical difference in respondents’ degree of agreement that task demands were realistic, between NSW and the remaining locations (p < .001) and Vic and the remaining locations (p = .004). Effect sizes for these comparisons, as measured by a rank biserial correlation, indicated a large effect for NSW and the remaining locations (rrb = 0.60) and a medium effect for Vic and the remaining locations (rrb = 0.44).59
Safety prioritised over task completion, by location
A Kruskal-Wallis test showed a statistical relationship between respondents’ primary location of operation and their degree of agreement that pilots were encouraged to prioritise safety (H(2) = 15.62, p <.001, ɛ² = 0.11 [medium effect]).
Table D3: Respondents’ degree of agreement that pilots were encouraged to prioritise safety over task completion, by location (N = 148)
| Group | Sample size | Median | Mode | MAD | Min | Max |
| NSW | 73 | 3 | 2 | 1 | 1 | 5 |
| Qld | 9 | 4 | 4 | 0 | 3 | 5 |
| SA | 14 | 4 | 4 | 1 | 2 | 5 |
| Tas | 11 | 4 | 4 | 0 | 2 | 5 |
| Vic | 34 | 4 | 4 | 0 | 1 | 5 |
| WA | 7 | 4 | 4 | 1 | 1 | 5 |
Forty-four per cent of NSW respondents either disagreed or strongly disagreed that pilots were encouraged to prioritise safety over task completion by external tasking agencies, compared to 43% who agreed or strongly agreed (Table D4). NSW respondents, therefore, were split almost equally between agreement and disagreement (Mdn = 3) (Table D3). The responses from NSW contrasted with the remaining locations, which all had at least 69% of respondents who agreed or strongly agreed that pilots were encouraged to prioritise safety over task completion by external tasking agencies (Mdn = 4). In particular, 89% of respondents from Qld and 79% of respondents from SA agreed or strongly agreed with the statement (Table D4). Additionally, as shown in Table D3, Qld had no respondents who disagreed or strongly disagreed that pilots were encouraged to prioritise safety over task completion (min. = 3).
Table D4: Percentage of respondents’ degree of agreement that pilots were encouraged to prioritise safety over task completion by external tasking agencies, by location60

Post-hoc comparisons using the Dunn’s test were conducted between the 3 location groups of NSW, Vic and the remaining locations. They revealed a statistical difference in respondents’ degree of agreement that pilots were encouraged to prioritise safety over task completion by external tasking agencies, between NSW and Vic (p = .012) and NSW and the remaining locations (p < .001). Effect size, as measured by a rank biserial correlation, suggested a medium effect for both the NSW and remaining locations (rrb = 0.40) and NSW and Vic (rrb = 0.29) comparisons.
Aviation training and experience of decision‑makers, by location
A Kruskal-Wallis test indicated a statistical relationship between respondents’ location and their degree of agreement that decision‑makers had sufficient aviation training and experience (H(2) = 27.70, p < .001, ɛ² = 0.19 [large effect]).
Table D5: Respondents’ degree of agreement that decision‑makers had sufficient aviation training and experience, by location (N = 148)
| Location | Sample size | Median | Mode | MAD | Min | Max |
| NSW | 73 | 2 | 2 | 1 | 1 | 5 |
| Qld | 9 | 4 | 4 | 0 | 2 | 4 |
| SA | 14 | 4 | 4 | 0 | 2 | 5 |
| Tas | 11 | 3 | 3 | 0 | 2 | 4 |
| Vic | 34 | 2 | 2 | 1 | 1 | 5 |
| WA | 7 | 3 | 2 | 1 | 1 | 4 |
More respondents from NSW than from any other state or territory did not think decision‑makers had sufficient aviation training and experience. Over two thirds of NSW respondents (67%) disagreed or strongly disagreed that decision‑makers had sufficient aviation training and experience (Mdn = 2), followed by 53% from Vic (Mdn = 2) and 43% from WA (Mdn = 3) (Table D5 and Table D6). This is in contrast with 78% of respondents from Qld and 64% from SA (both with Mdn = 4) who either agreed or strongly agreed that decision‑makers had sufficient aviation training and experience. Further, of the 26 out of a total of 148 respondents who strongly disagreed with this statement, 21 (81%) were from NSW, despite respondents from NSW making up only 50% of the sample. Additionally, over half of the 50 respondents who disagreed with the statement (56%) were from NSW.
Table D6: Percentage of respondents’ degree of agreement that decision‑makers had sufficient aviation training and experience, by location

Post hoc comparisons using the Dunn’s test were conducted between the 3 location groups of NSW, Vic and the remaining locations. They showed a statistical difference in the degree of agreement that decision‑makers had sufficient aviation training and experience between NSW and the remaining locations (p < .001) and Vic and the remaining locations (p = .016). Effect size, as measured by a rank biserial correlation, was large for the comparison between NSW and the remaining locations (rrb = 0.57) and medium for Vic and the remaining locations (rrb = 0.31). NSW was also statistically different from Vic (p = .026), but with a small effect size (rrb = 0.26).
External pressure to complete task, by location
A Kruskal-Wallis test indicated a statistical relationship between respondents’ primary location of operation and their degree of agreement about feeling external pressure to complete a task, between at least 2 groups (H(2) = 24.56, p < .001, ɛ² = 0.17 [large effect]). As shown in Table D7, respondents from NSW were most likely to agree that they had felt external pressure to accept or complete a task in adverse operating conditions (Mdn = 4). All other locations had a median of 2.
Table D7: Respondents’ degree of agreement that they had felt external pressure to accept or complete a task in adverse operating conditions, by location (N = 148)
| Location | Sample size | Median | Mode | MAD | Min | Max |
| NSW | 73 | 4 | 4 | 1 | 1 | 5 |
| Qld | 9 | 2 | 1 | 1 | 1 | 4 |
| SA | 14 | 2 | 1 | 1 | 1 | 4 |
| Tas | 11 | 2 | 2 | 1 | 1 | 4 |
| Vic | 34 | 2 | 2 | 1 | 1 | 5 |
| WA | 7 | 2 | 1 | 1 | 1 | 5 |
Just over half of NSW respondents (52%) either agreed or strongly agreed that they had felt external pressure to accept or complete a task in adverse operating conditions. Although 59% of respondents from Vic either strongly disagreed or disagreed that they felt external pressure, there were still just under a third of respondents (32%) that strongly agreed or agreed with the statement. In contrast, it can be seen in Table D8 that most respondents (at least 71%) from Qld, Tas, and WA disagreed or strongly disagreed that they had felt external pressure, with SA having the least percentage of respondents who strongly agreed or agreed with the statement.
Table D8: Percentage of respondents’ degree of agreement that they had felt external pressure to accept or complete a task in adverse operating conditions, by location

Post hoc comparisons using the Dunn’s test were conducted between the 3 location groups of NSW, Vic and the remaining locations. They showed a statistical difference in the degree of agreement that respondents had felt external pressure to accept or complete a task in adverse operating conditions, between NSW and the remaining locations (p < .001) and between Vic and the remaining locations (p = .024). Effect sizes for these comparisons indicated a large (rrb = 0.53) and medium (rrb = 0.24) effect, respectively. There was also a statistical difference between NSW and Vic (p = .036), but with a small effect size (rrb = 0.26).
Adequate mechanisms to reduce pressure, by location
A Kruskal-Wallis test indicated a statistical relationship between respondents’ location and their degree of agreement that there were adequate mechanisms in place to reduce the pressure experienced (H(2) = 18.35, p < .001, ɛ² = 0.12 [medium effect]).
As shown in Table D9 respondents from NSW were less likely than those from other locations to agree that there were adequate mechanisms to reduce the pressure experienced (Mdn = 3, mode = 2).
Table D9: Respondents’ degree of agreement that there were adequate mechanisms in place to reduce the pressure experienced, by location (N = 148)
| Location | Sample size | Median | Mode | MAD | Min | Max |
| NSW | 73 | 3 | 2 | 1 | 1 | 5 |
| Qld | 9 | 4 | 4 | 0 | 2 | 5 |
| SA | 14 | 4 | 4 | 0 | 3 | 5 |
| Tas | 11 | 4 | 4 | 1 | 2 | 5 |
| Vic | 34 | 3 | 3 | 1 | 1 | 5 |
| WA | 7 | 4 | 4 | 1 | 1 | 5 |
Almost half of respondents from NSW either strongly disagreed or disagreed that adequate mechanisms were in place to reduce the pressure experienced. In contrast, at least 64% of respondents from Qld, SA, and WA agreed or strongly agreed with this statement (Table D10). Notably, no respondents from SA (Mdn = 4) disagreed or strongly disagreed with the statement (min. = 3) (Table D9).
Table D10: Percentage of respondents’ degree of agreement that there were adequate mechanisms in place to reduce the pressure experienced, by location

Post-hoc comparisons using the Dunn’s test were conducted between the 3 location groups of NSW, Vic and the remaining locations. They showed a statistical difference in respondents’ degree of agreement that there were adequate mechanisms in place to reduce the pressure experienced between NSW and all other locations (p < .001, rrb = 0.44 [medium effect]), but not with Vic.
Appendix E – Statistical analyses: Communication
Communication of safety information, by location
A Kruskal-Wallis test indicated a statistical relationship between respondents’ location and their rating of the communication of safety information, between at least 2 groups (H(2) = 18.41, p < .001, ɛ² = 0.12 [medium effect]).
Although the medians and modes of all locations were either 3 or 4 (Table E1), it is notable that no respondents from Qld, SA or WA rated the communication of safety information to pilots as poor or very poor (min. = 3).
Table E1: Respondents’ perceptions of how well safety information about the task and fireground are communicated to pilots, by location (N = 148)
| Location | Sample size | Median | Mode | MAD | Min | Max |
| NSW | 73 | 3 | 3 | 1 | 1 | 5 |
| Qld | 9 | 4 | 4 | 0 | 3 | 5 |
| SA | 14 | 4 | 4 | 0 | 3 | 5 |
| Tas | 11 | 4 | 4 | 0 | 1 | 5 |
| Vic | 34 | 3 | 3 | 0 | 1 | 5 |
| WA | 7 | 4 | 4 | 0 | 3 | 5 |
Table E2 shows that all locations had at least 64% of respondents who rated the communication of safety information with pilots as either good or excellent, apart from respondents from NSW and Vic with 37% and 38% respectively. In contrast, Tas respondents were the most likely to rate the communication of safety information with pilots as poor or very poor, followed by NSW respondents.
Table E2: Percentage of respondents’ ratings of how well safety information about the task and fireground are communicated to pilots, by location

Post hoc comparisons using the Dunn’s test were conducted between the 3 location groups of NSW, Vic and the remaining locations. They showed a statistical difference in respondents’ ratings of the communication of safety information to pilots, between NSW and the remaining locations (p < .001) and between Vic and the remaining locations (p = .007). Effect sizes for both comparisons indicated a medium effect (rrb = 0.44) and (rrb = 0.36), respectively.
Preferred topics of safety information, by location
Examining the location of respondents who listed the top 10 preferred types of information about the task and fireground enables some useful insights about the type of additional information preferred in the different locations. As shown in Figure E1, in response to the type of safety information about the task and fireground respondents would have liked to see communicated:
- only NSW respondents listed ‘better understanding of agency personnel’ respondents from all locations except SA listed ‘all other aircraft in the area and their heights’
- ‘task refusals and reasons’ was listed by NSW and Qld respondents only
- ‘accurate locations/drop areas’ was listed by Vic and NSW respondents only
- no respondents from Qld or WA listed ‘better hazard information’.
Figure E1: The location and number of respondents who listed the top 10 preferred types of safety information about task and fireground, plus ‘nothing further’
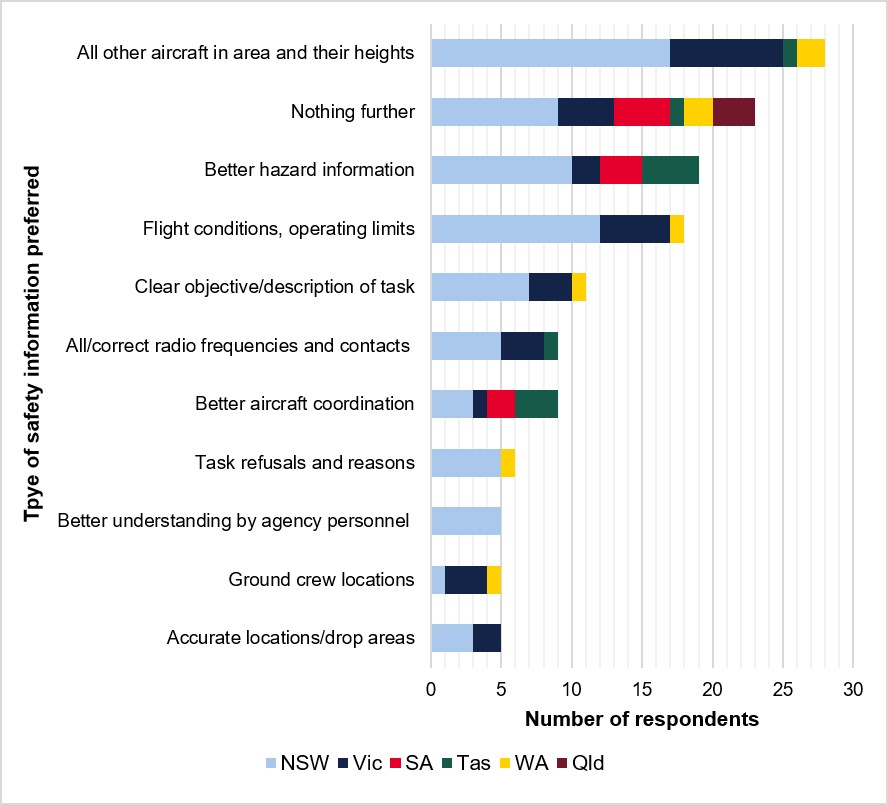
Additionally, as shown in Figure E2:
- Three quarters of Qld respondents listed ‘nothing further’, and the remaining 25% did not list any of the top 10 topics preferred by respondents from other locations.
- SA had the next highest percentage of respondents (40%) who listed ‘nothing further’, followed by 30% who listed ‘better hazard information, including powerline mapping’.
- NSW and Vic had the greatest amount of variability in responses, likely due to these locations having the highest number of respondents to this question.
- The most frequently listed topic for NSW and Vic respondents was ‘all other aircraft in the area and their heights’.
- The most frequently listed topic for WA respondents was ‘all other aircraft in the area and their heights’, together with ‘nothing further’, both with 33%.
- The most frequently listed topic for Tas respondents was ‘better hazard information, including powerline mapping’ with 44%, followed by a third of Tas respondents who listed ‘better aircraft coordination and more use of technology for aircraft separation’.
Figure E2: The preferred types of safety information about task and fireground listed by respondents, for each location
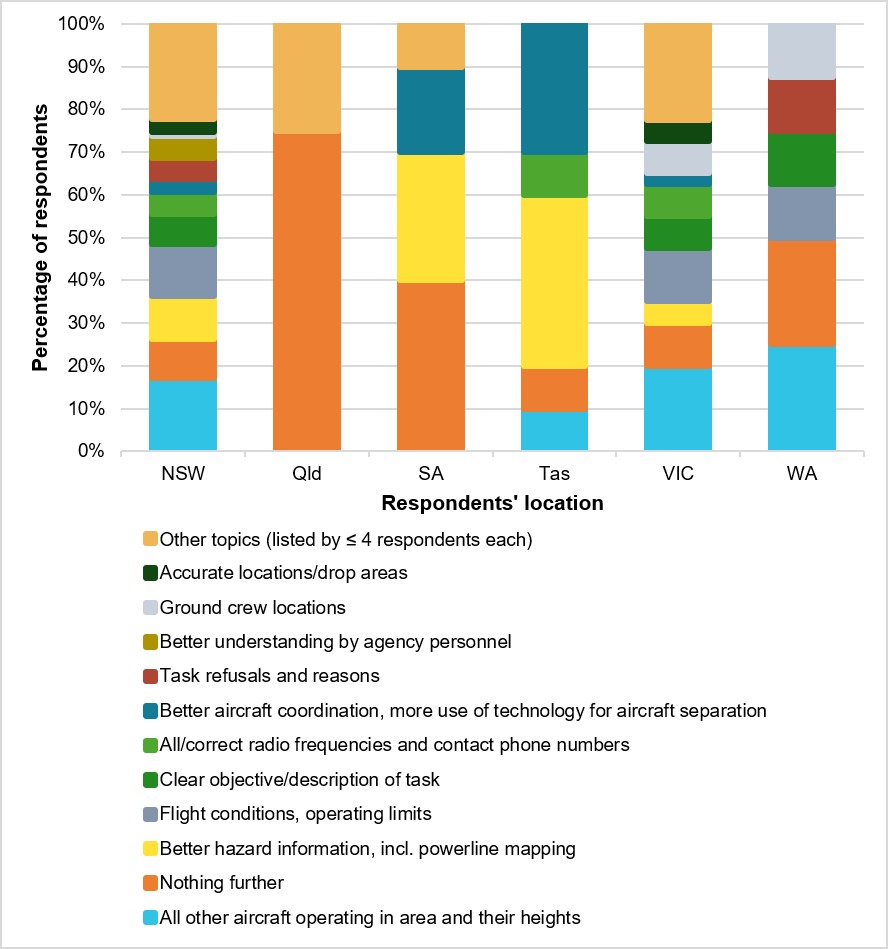
Quality of pilot and tasking agency interactions, by location
A Kruskal-Wallis test indicated a statistical relationship between respondents’ location and their rating of the quality of interactions (H(2) = 38.47, p < .001, ɛ² = 0.26 [large effect]).
As shown in Table E3, NSW respondents had the lowest average rating of the quality of interactions between pilots and tasking agencies (Mdn = 3), with respondents from WA and Qld having the highest (Mdn = 5). Further, as evidenced by the minimum scores listed in Table E3, only NSW, Vic and Tas had responses in the poor or very poor categories.
Table E3: Respondents’ perceptions of the overall quality of interactions between pilots and tasking agencies, by location (N = 148)
| Location | Sample size | Median | Mode | MAD | Min | Max |
| NSW | 73 | 3 | 3 | 1 | 1 | 5 |
| Qld | 9 | 5 | 5 | 0 | 3 | 5 |
| SA | 14 | 4 | 4 | 0 | 3 | 5 |
| Tas | 11 | 4 | 4 | 0 | 2 | 5 |
| Vic | 34 | 4 | 4 | 0 | 1 | 5 |
| WA | 7 | 5 | 5 | 0 | 4 | 5 |
All locations except NSW had at least 73% of respondents rate the quality of interactions between pilots and tasking agencies as good or excellent (Table E4). The locations which had the highest rated perception were WA (100%), SA (93%) and Qld (89%). By contrast, only 37% of NSW respondents rated the quality of interactions as good or excellent. Almost one third of respondents from NSW (27%) rated the quality of interactions as poor or very poor, compared to a maximum of 9% for the remaining states, with no respondents from Qld, SA or WA rating interactions as poor or very poor.
Table E4: Percentage of respondents’ ratings of the quality of interactions between pilots and tasking agencies, by location

Post hoc comparisons using the Dunn’s test were conducted between the 3 location groups of NSW, Vic and the remaining locations. They showed a statistical difference in respondents’ ratings of the quality of interactions of pilots and tasking agencies, between NSW and the remaining locations (p < .001) and between Vic and the remaining locations (p = .026). Effect sizes for these comparisons indicated a large (rrb = 0.61) and medium (rrb = 0.34) effect, respectively. There was also a statistical difference between NSW and Vic (p = .001), with a medium effect size (rrb = 0.40).
Flight following and responses to missed ops-normal calls, by location
A Kruskal-Wallis test indicated a statistical relationship between respondents’ location and their degree of agreement that flight following was timely and responses to missed ops-normal calls were prompt, between at least 2 groups (H(2) = 9.30, p = .010, ɛ² = 0.06 [medium effect]).
As shown in Table E5, although most respondents overall agreed or strongly agreed that flight following was timely, respondents from SA had the highest overall rating (Mdn = 5).
Table E5: Respondents’ degree of agreement that flight following was timely and responses to missed ops-normal calls were prompt, by location (N = 148)
| Location | Sample size | Median | Mode | MAD | Min | Max |
| NSW | 73 | 4 | 4 | 1 | 1 | 5 |
| Qld | 9 | 4 | 3 | 1 | 3 | 5 |
| SA | 14 | 5 | 5 | 0 | 4 | 5 |
| Tas | 11 | 4 | 4 | 0 | 2 | 5 |
| Vic | 34 | 4 | 4 | 1 | 2 | 5 |
| WA | 7 | 4 | 5 | 1 | 3 | 5 |
All respondents from SA agreed or strongly agreed that flight following was timely and responses to missed ops-normal calls were prompt, compared to just over half of respondents from NSW (55%) and Qld (56%) (Table E6). NSW also had the highest percentage of respondents in the strongly disagree or disagree category with 21% and was the only location to register a response of strongly disagree (Mdn = 4). Only NSW, Vic and Tas had responses in either the disagree or strongly disagree categories.
Table E6: Percentage of respondents’ degree of agreement that flight following was timely and responses to missed ops-normal calls were prompt, by location

SA respondents’ degree of agreement that flight following was timely and responses to missed ops-normal calls were prompt was higher than for respondents from all other locations, except WA.
Post hoc comparisons using the Dunn’s test were conducted between the 3 location groups of NSW, Vic and the remaining locations. They showed a statistical difference in respondents’ degree of agreement that flight following was timely and responses to missed ops-normal calls were prompt, between NSW and all other locations (p = .003, rrb = 0.32 [medium effect]), but not with Vic. No other group comparisons were statistically different.
Briefing/debriefing of incidents or close calls with tasking agencies, by location
A Kruskal-Wallis test indicated a statistical relationship between respondents’ location and their degree of agreement that there were opportunities to brief/debrief incidents or close calls with tasking agencies, between at least 2 locations (H(2) = 28.77, p < .001). The effect size, epsilon squared (ɛ²), was 0.19, indicating a strong effect.
All respondents from WA (Mdn = 5) either agreed or strongly agreed that there were opportunities to brief/debrief incidents or close calls with tasking agencies (Table E7). SA had the next highest percentage of agree or strongly agree responses, with 79% (Table E8). In contrast, NSW had the lowest degree of agreement (Mdn = 3), with only 30% of respondents from NSW agreeing or strongly agreeing with this statement (Table E8). NSW also had the highest percentage of respondents (43%) who disagreed or strongly disagreed with the statement, compared to 18% or less for all other states or territories.
Table E7: Respondents’ degree of agreement that there were opportunities to brief/debrief incidents or close calls with tasking agencies, by location (N = 148)
| Location | Sample size | Median | Mode | MAD | Min | Max |
| NSW | 73 | 3 | 3 | 1 | 1 | 5 |
| Qld | 9 | 4 | 4 | 1 | 3 | 5 |
| SA | 14 | 4 | 4 | 0 | 2 | 5 |
| Tas | 11 | 4 | 4 | 1 | 1 | 5 |
| Vic | 34 | 4 | 4 | 1 | 1 | 5 |
| WA | 7 | 5 | 5 | 0 | 4 | 5 |
Table E8: Percentage of respondents’ degree of agreement that there were opportunities to brief/debrief incidents or close calls with tasking agencies, by location

Post hoc comparisons using the Dunn’s test were conducted between the 3 location groups of NSW, Vic and the remaining locations. They showed a statistical difference in respondents’ degree of agreement that there were opportunities to brief/debrief incidents or close calls with tasking agencies, between NSW and the remaining locations (p < .001) and between Vic and the remaining locations (p = .047). Effect sizes for these comparisons indicated a large (rrb = 0.56) and medium (rrb = 0.30) effect, respectively. There was also a statistical difference between NSW and Vic (p = .007), with a medium effect size (rrb = 0.34).
Pilots and agency personnel working together to resolve safety issues, by location
A Kruskal-Wallis test indicated a statistical relationship between respondents’ location and their degree of agreement that pilots and agency personnel worked together to resolve safety issues on the fireground, between at least 2 locations (H(2) = 27.65, p < .001, ɛ² = 0.19 [large effect]).
Table E9: Respondents’ degree of agreement that pilots and agency personnel worked together to resolve safety issues on the fireground, by location (N = 148)
| Location | Sample size | Median | Mode | MAD | Min | Max |
| NSW | 73 | 3.0 | 3.0 | 1.0 | 1.0 | 5.0 |
| Qld | 9 | 4.0 | 4.0 | 0.0 | 3.0 | 5.0 |
| SA | 14 | 4.0 | 5.0 | 0.5 | 3.0 | 5.0 |
| Tas | 11 | 4.0 | 3.0 | 1.0 | 3.0 | 5.0 |
| Vic | 34 | 4.0 | 4.0 | 0.5 | 1.0 | 5.0 |
| WA | 7 | 4.0 | 4.0 | 0.5 | 1.0 | 5.0 |
All locations except NSW (Mdn = 3) had at least 59% of respondents either agree or strongly agree that pilots and agency personnel worked together to resolve safety issues on the fireground (Table E9 and Table E10). In particular, 86% of SA respondents (Mdn = 5) and WA respondents (Mdn = 4) either agreed or strongly agreed with this statement, compared to only 40% of respondents from NSW. Further, no respondents from Qld, SA and Tas strongly disagreed or disagreed that pilots and agency personnel worked together to resolve safety issues (min. = 3). In contrast, NSW had the most respondents out of all locations who either disagreed or strongly disagreed that pilots and agency personnel worked together, with almost a quarter (23%) of NSW respondents disagreeing with the statement.
Table E10: Percentage of respondents’ degree of agreement that pilots and agency personnel worked together to resolve safety issues on the fireground, by location

Post hoc comparisons using the Dunn’s test were conducted between the 3 location groups of NSW, Vic and the remaining locations. They showed a statistical difference in respondents’ degree of agreement that that pilots and agency personnel worked together to resolve safety issues, between NSW and the remaining locations (p < .001) and between Vic and the remaining locations (p = .006). Effect sizes for these comparisons indicated a large (rrb = 0.55) and medium (rrb = 0.37) effect, respectively.
Pilots and agency personnel working together to resolve safety issues, by main rate of pay
A Mann-Whitney U test was performed to evaluate whether a respondents’ degree of agreement that pilots and agency personnel worked together to resolve safety issues on the fireground differed depending on whether their main rate of pay was dependent or independent of their hours flown. The results indicated that respondents whose pay was independent of their hours flown were statistically more likely to agree that pilots and agency personnel worked together to resolve safety issues (Mdn = 4) than those whose pay was dependent on their hours flown (Mdn = 3), U = 2542, p = .037. The effect size, however, was small (rrb = 0.22), suggesting that while main rate of pay in part explains respondents’ degree of agreement that pilots and agency personnel worked together to resolve safety issues, it has minimal explanatory power compared to respondents’ location.
Pilots’ suggestions for improving safety encouraged by tasking agencies, by location
A Kruskal-Wallis test indicated a statistical relationship between respondents’ location and their degree of agreement that pilots’ suggestions for improving safety were encouraged by tasking agencies, between at least 2 groups (H(2) = 11.71, p = .003, ɛ² = 0.09 [medium effect]).
As shown in Table E11, respondents from WA (Mdn = 5) were most likely to agree that pilots’ suggestions were encouraged by tasking agencies, followed by Qld (Mdn = 4) and SA (Mdn = 4) respondents. Additionally, no respondents from Qld either strongly disagreed or disagreed that pilots’ suggestions were encouraged by tasking agencies (Mdn = 4, min = 3). In contrast, respondents from NSW were least likely to agree that pilots’ suggestions for improving safety were encouraged by tasking agencies (Mdn 3).
Table E11: Respondents’ degree of agreement that pilots’ suggestions for improving safety were encouraged by tasking agencies, by location (N = 148)
| Location | Sample size | Median | Mode | MAD | Min | Max |
| NSW | 73 | 3.0 | 3.0 | 1.0 | 1.0 | 5.0 |
| Qld | 9 | 4.0 | 4.0 | 1.0 | 3.0 | 5.0 |
| SA | 14 | 4.0 | 4.0 | 1.0 | 2.0 | 5.0 |
| Tas | 11 | 4.0 | 3.0 | 1.0 | 2.0 | 5.0 |
| Vic | 34 | 3.5 | 4.0 | 0.5 | 1.0 | 5.0 |
| WA | 7 | 5.0 | 5.0 | 0.0 | 1.0 | 5.0 |
At least half of respondents from Vic, SA, WA, Qld and Tas agreed or strongly agreed that pilots’ suggestions for improving safety were encouraged by tasking agencies (Table E12). The highest ratings were from SA and WA, with 71% of respondents agreeing or strongly agreeing with this statement. By contrast, only 26% of respondents from NSW agreed or strongly agreed that pilots’ suggestions for improving safety were encouraged by tasking agencies. NSW also had the highest percentage of respondents who strongly disagreed or disagreed that pilots’ suggestions for improving safety were encouraged by tasking agencies (40%), followed by Vic with 21%.
Table E12: Percentage of respondents’ degree of agreement that pilots’ suggestions for improving safety were encouraged by tasking agencies, by location

Post hoc comparisons using the Dunn’s test were conducted between the 3 location groups of NSW, Vic and the remaining locations. They revealed a statistical difference in respondents’ degree of agreement that pilots’ suggestions for improving safety were encouraged by tasking agencies, between NSW and the remaining locations (p = .003) and NSW and Vic (p = .014). Effect size (rrb) for the comparison of NSW with the remaining locations indicated a medium effect (rrb = 0.38) and a small effect with Vic (rrb = 0.28).
Appendix F – Statistical analyses: Reporting culture
Number of incidents experienced by number of incidents reported
A Wilcoxon signed-rank test (non-parametric equivalent to the paired samples t-test) was conducted to compare the number of incidents experienced with the number of incidents reported. The test showed that the number of incidents experienced (Mdn = 2) was statistically higher than the number of incidents reported (Mdn = 1), (W = 1,728, p < .001). The effect size, as measured by a rank-biserial correlation, was rrb = 0.95, which suggests a very large effect size (considering values for effect size are between 0 and 1).
Most serious incidents/close calls experienced, by location
Figure F1 shows the most serious incidents/close calls experienced, by the number and location of respondents. Examining the location of respondents who listed the types of serious incidents/close calls experienced enables some useful insights about the type of serious incidents/close calls occurring in the different locations. As shown in Figure F1:
- Near misses were among the most serious incidents/close calls experienced for all locations except WA and NT.
- ‘Wirestrike/near wirestrike’ was listed by NSW respondents only.
- Although ‘hazardous fireground weather conditions’ was the second most frequently listed serious incident/close call, it was listed by Vic and NSW respondents only.
- The serious incidents/close calls experienced by WA respondents related to traffic management (including lack of AASs) only.
- The single serious incident/close call by a Qld respondent related to a near miss.
- The serious incidents/close calls experienced by an NT respondent related to itinerant aircraft and drones.
Figure F1: Number of respondents who experienced the most serious incidents/close calls listed by at least 4 respondents, by location
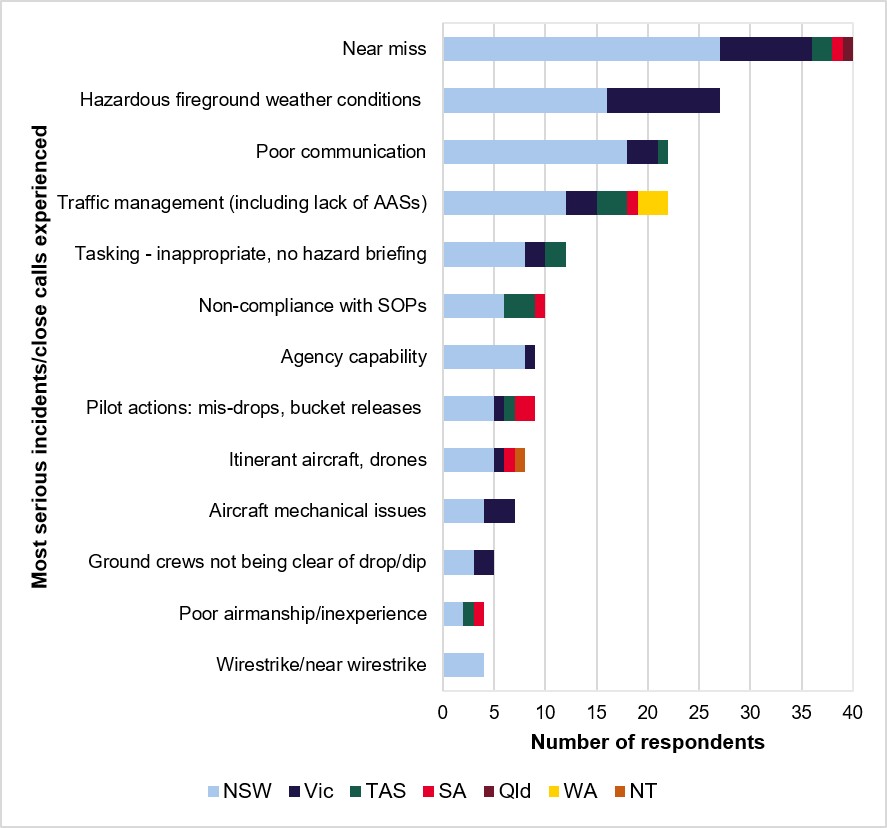
Figure F2: Proportion of respondents within the most frequently listed categories of the most serious incidents/close calls, by location
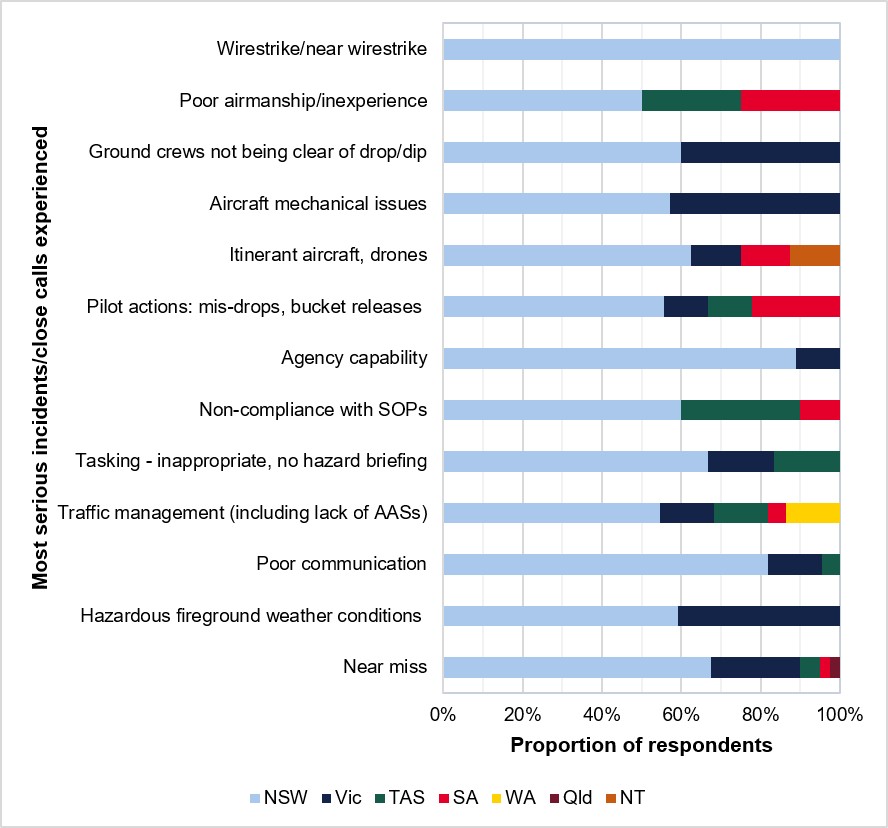
As shown in Figure F2, NSW respondents represented 67% of the most serious incidents/close calls, and listed:
- 68% per cent of near misses, which is proportionate to their total number of serious incidents/close calls
- 89% of agency capability
- 82% of poor communication.
Vic respondents represented 19% of the most serious incidents/close calls, and listed:
- 43% of aircraft mechanical issues
- 41% of hazardous fireground weather conditions
- 40% of ground crews not being clear of drop/dip.
Tas respondents represented 7% of the most serious incidents/close calls, and listed:
- 25% of poor airmanship/inexperience
- 30% of non-compliance with SOPs.
SA respondents represented 4% of the most serious incidents/close calls, and listed:
- 25% of poor airmanship/inexperience
- 22% of pilot actions: mis-drops, bucket releases.
Respondents’ comfort reporting incidents, by location
A Kruskal-Wallis test for significance showed a statistical relationship between respondents’ location and their degree of agreement about feeling comfortable to report incidents through formal channels, between at least 2 groups (H(2) = 15.57, p < .001, ɛ² = .11 [medium effect]).
Table F1: Respondents’ degree of agreement that they are comfortable reporting incidents, by location (N = 148)
| Location | Sample size | Median | Mode | MAD | Min | Max |
| NSW | 73 | 3.0 | 3.0 | 1.0 | 1.0 | 5.0 |
| Qld | 9 | 5.0 | 5.0 | 1.0 | 3.0 | 5.0 |
| SA | 14 | 3.0 | 3.0 | 0.5 | 2.0 | 5.0 |
| Tas | 11 | 4.0 | 4.0 | 1.0 | 1.0 | 5.0 |
| Vic | 34 | 3.0 | 3.0 | 1.0 | 1.0 | 5.0 |
| WA | 7 | 5.0 | 5.0 | 1.0 | 1.0 | 5.0 |
Respondents from Qld (Mdn = 5) and WA (Mdn = 5) were most likely to agree that they felt comfortable reporting incidents through formal channels (Table F1). Qld also had no respondents who strongly disagreed or disagreed with the statement (min. = 3). NSW respondents (Mdn = 3) were the least likely to agree that they felt comfortable reporting incidents though formal channels, with only 29% agreeing or strongly agreeing with this statement, followed by SA (Mdn = 3) with 43% and Vic (Mdn = 3) with 44% (Table F2). NSW also had the greatest percentage of respondents who strongly disagreed or disagreed that they felt comfortable reporting incidents, with 32%, followed by Tas with 27%.
Table F2: Percentage of respondents’ that were comfortable reporting incidents through formal channels, by location

Post hoc comparisons using the Dunn’s test were conducted between the 3 location groups of NSW, Vic and the remaining locations. They revealed a statistical difference in respondents’ degree of agreement that they felt comfortable reporting incidents through formal channels, between NSW and the remaining locations (p < .001). The effect size was rrb = 0.41, indicating a medium effect. No other group comparisons were statistically different.
Respondents’ comfort reporting incidents, by main rate of pay
A Mann-Whitney U test was performed to evaluate whether a respondents’ degree of agreement that they were comfortable reporting incidents through formal channels differed depending on whether their main rate of pay was dependent or independent of their hours flown. The results indicated that respondents whose pay was independent of their hours flown were statistically more likely to agree that they felt comfortable reporting incidents (Mdn = 3) than those whose pay was dependent on their hours flown (Mdn = 3), U = 2557, p = .015, rrb = 0.26.
Reporting without fear of negative repercussions, by location
A Kruskal-Wallis test showed a statistical relationship between respondents’ primary location of operation and their degree of agreement that they can report incidents to the tasking agency without fear of negative repercussions, between at least 2 groups (H(2) = 26.43, p < .001; ɛ² = 0.18 [large effect]).
Table F3: Respondents’ degree of agreement that they are comfortable reporting incidents, by location (N = 147)61
| Location | Sample size | Median | Mode | MAD | Min | Max |
| NSW | 72 | 2.0 | 2.0 | 1.0 | 1.0 | 5.0 |
| Qld | 9 | 4.0 | 3.0 | 1.0 | 3.0 | 5.0 |
| SA | 14 | 4.0 | 4.0 | 0.0 | 2.0 | 5.0 |
| Tas | 11 | 3.0 | 3.0 | 1.0 | 1.0 | 5.0 |
| Vic | 34 | 3.5 | 4.0 | 0.5 | 1.0 | 5.0 |
| WA | 7 | 5.0 | 5.0 | 0.0 | 1.0 | 5.0 |
Respondents from WA were the most likely to agree that they could report incidents without fear of repercussions (Mdn = 5), with NSW respondents the least likely to agree (Mdn = 2). Qld (Mdn = 4) was the only location where respondents did not disagree or strongly disagree with the statement (min. = 3) (Table F3).
Table F4: Percentage of respondents’ that could report incidents without fear of negative repercussions, by location

As shown in Table F4, all locations had at least 50% of respondents agree or strongly agree that they could report incidents without fear of negative repercussions from the tasking agency, except for NSW with 24% and Tas with 45%. WA and Qld had the highest percentage for respondents who agreed or strongly agreed with this statement, with 71% and 67% respectively. In contrast, NSW had the highest percentage of respondents who strongly disagreed or disagreed with the statement, with just over half of NSW respondents (51%) reporting that they could not report incidents without fear of negative repercussions.
Post hoc comparisons using the Dunn’s test were conducted between the 3 location groups of NSW, Vic and the remaining locations. They revealed a statistical difference in respondents’ degree of agreement that they could report incidents without fear of negative repercussions from the tasking agency, between NSW and the remaining locations (p < .001) and NSW and Vic (p = .002). Effect sizes (rrb) for the comparisons indicated a large (rrb = 0.52) and a medium (rrb = 0.38) effect, respectively.
Resolution of incident reports by tasking agency, by location
Out of the respondents who had reported an incident, almost two thirds of NSW respondents (62%) disagreed or strongly disagreed that there was a quick resolution of incident reports by tasking agencies (Mdn = 2) (Table F5 and Table F6). Vic respondents were spread relatively evenly across the categories, with 27% disagreeing or strongly disagreeing, and slightly more (36%) agreeing or strongly agreeing that there was a quick resolution of incident reports by tasking agencies (Mdn = 3). No respondents from SA or Tas disagreed or strongly disagreed (min. = 3, Mdn = 4), and two thirds of respondents (67%) from SA and Tas agreed or strongly agreed that there was a quick resolution of incident reports by tasking agencies (although sample sizes for SA and Tas were small).
Table F5: Respondents’ degree of agreement that there was a quick resolution of incident reports by tasking agencies, by location (N = 51)62
| Location | Sample size | Median | Mode | MAD | Min | Max |
| NSW | 34 | 2 | 2 | 1 | 1 | 5 |
| SA | 3 | 4 | 4 | 0 | 3 | 4 |
| Tas | 3 | 4 | 4 | 1 | 3 | 5 |
| Vic | 11 | 3 | 3 | 1 | 2 | 4 |
Table F6: Percentage of respondents’ that agreed there was a quick resolution of incident reports by tasking agencies, by location

Statistical comparisons were not meaningful with SA and Tas on their own, given their small sample sizes (n = 3) after respondents who had never reported an incident were removed (Table F5). For the purpose of statistical analysis, therefore, SA and Tas were combined into one group of ‘remaining locations’. A Kruskal‑Wallis test showed a statistical relationship between respondents’ primary location of operation and their degree of agreement that there was a quick resolution of incident reports by tasking agencies, between at least 2 groups (H(2) = 13.59, p = .001; ɛ² = 0.27 [large effect]).
Post hoc comparisons using the Dunn’s test were conducted between the 3 location groups of NSW, Vic and the remaining locations (SA and Tas). They revealed a statistical difference in respondents’ degree of agreement that there was a quick resolution of incident reports by tasking agencies, between NSW and the remaining locations (p = .001) and NSW and Vic (p = .02). Effect sizes (rrb) for the comparisons indicated a large (rrb = 0.78) and a medium (rrb = 0.47) effect, respectively.
Feedback after incident reporting, by location
Out of the respondents who had reported an incident, over two thirds of NSW respondents (68%) disagreed or strongly disagreed that they had received feedback about incident reports from tasking agencies (Mdn = 2) (Table F7 and Table F8). Almost half of Vic respondents (45%) agreed or strongly agreed that they had received feedback about incident reports from tasking agencies, with over a third (36%) disagreeing or strongly disagreeing (Mdn = 3). No respondents from SA or Tas disagreed or strongly disagreed (min. = 3, Mdn = 4), and two thirds of respondents (67%) from SA and Tas agreed or strongly agreed that they had received feedback about incident reports from tasking agencies (although sample sizes for SA and Tas were small).
Table F7: Respondents’ degree of agreement that they had received feedback about incident reports from tasking agencies, by location (N = 51)63
| Location | Sample size | Median | Mode | MAD | Min | Max |
| NSW | 34 | 2 | 2 | 1 | 1 | 4 |
| SA | 3 | 4 | 4 | 0 | 3 | 4 |
| Tas | 3 | 4 | 4 | 1 | 3 | 5 |
| Vic | 11 | 3 | 3 | 1 | 2 | 4 |
Table F8: Percentage of respondents’ that agreed they had received feedback about incident reports from tasking agencies, by location

Statistical comparisons were not meaningful with SA and Tas given their small sample sizes (n = 3) after respondents who had never reported an incident were removed (Table F7). For the purpose of statistical analysis, therefore, SA and Tas were combined into one group of ‘remaining locations’. A Kruskal‑Wallis test showed a statistical relationship between respondents’ primary location of operation and their degree of agreement that they had received feedback about incident reports from tasking agencies, between at least 2 groups (H(2) = 15.81, p < .001; ɛ² = 0.32 [large effect]).
Post hoc comparisons using the Dunn’s test were conducted between the 3 location groups of NSW, Vic and the remaining locations (SA and Tas). They revealed a statistical difference in respondents’ degree of agreement that they had received feedback about incident reports from tasking agencies, between NSW and the remaining locations (p < .001) and NSW and Vic (p = .01). Both effect sizes (rrb) for the comparisons indicated a large effect (rrb = 0.78 and rrb = 0.47, respectively).
Appendix G – Statistical analyses: Safety culture
Tasking agencies’ understanding of operational safety issues, by location
A Kruskal-Wallis test showed a statistical relationship between respondents’ location and their degree of agreement that tasking agencies had a good understanding of operational issues, between at least 2 groups (H(2) = 19.82, p < .001, ɛ² = 0.14 [medium effect]).
Table G1: Respondents’ degree of agreement that tasking agencies have a good understanding of operational issues, by location (N = 144)
| Group | Sample size | Median | Mode | MAD | Min | Max |
| NSW | 72 | 2 | 2 | 1 | 1 | 5 |
| Qld | 9 | 4 | 4 | 0 | 1 | 4 |
| SA | 12 | 4 | 4 | 1 | 2 | 5 |
| Tas | 11 | 4 | 4 | 1 | 1 | 5 |
| Vic | 33 | 3 | 4 | 1 | 1 | 4 |
| WA | 7 | 4 | 4 | 0 | 1 | 4 |
Respondents from NSW were the least likely to agree that tasking agencies had a good understanding of operational issues (Mdn = 2), followed by Vic (Mdn = 3) (Table G1). Just under a quarter (22%) of NSW respondents agreed or strongly agreed with this statement, compared to at least 55% of respondents from Qld, SA, WA and Tas (all with Mdn = 4), and 45% of Vic respondents (Mdn = 3) (Table G1 and Table G2). Further, over half of NSW respondents (58%) disagreed or strongly disagreed that tasking agencies had a good understanding of operational issues, followed by approximately one third of Vic respondents (33%) and WA respondents (29%), compared to a maximum of 11% for the remaining locations. SA was also the only location to have no respondents who strongly disagreed that tasking agencies had a good understanding of operational issues (min = 2).
Table G2: Percentage of respondents’ degree of agreement that tasking agencies have a good understanding of operational issues, by location

Post hoc comparisons using the Dunn’s test were conducted between the 3 location groups of NSW, Vic and the remaining locations. They revealed a statistical difference in respondents’ degree of agreement that tasking agencies had a good understanding of operational issues, between NSW and the remaining locations (p < .001, rrb = 0.48) and NSW and Vic (p = .02, rrb = 0.28). Effect sizes (rrb)for the comparisons indicated a medium effect.
Perspectives on the management of operational issues, by location
A Kruskal-Wallis test showed a statistical relationship between respondents’ location and their degree of agreement that tasking agencies and operators had similar perspectives on the management of operational issues that impact safety, between at least 2 groups (H(2) = 14.68, p < .001, ɛ² = 0.10 [medium effect]).
Table G3: Respondents’ degree of agreement that tasking agencies and operators had similar perspectives on the management of operational issues that impact safety, by location (N = 144)
| Location | Sample size | Median | Mode | MAD | Min | Max |
| NSW | 72 | 3 | 2 | 1 | 1 | 5 |
| Qld | 9 | 4 | 4 | 0 | 2 | 4 |
| SA | 12 | 4 | 4 | 0 | 1 | 5 |
| Tas | 11 | 4 | 4 | 1 | 2 | 5 |
| Vic | 33 | 3 | 3 | 1 | 1 | 5 |
| WA | 7 | 3 | 3 | 1 | 1 | 5 |
As shown in Table G3 all locations had a median of either 3 or 4, with NSW also having a mode (most frequent response) of 2, which is equivalent to ‘disagree’. NSW had the highest percentage of respondents who disagreed or strongly disagreed that tasking agencies and operators had similar perspectives on the management of operational issues that impact safety (44%), followed by WA with 28% (Table G4). Three quarters of SA respondents agreed or strongly agreed with the statement, followed by Qld and Tas with 56% and 55% respectively. NSW had the least percentage of respondents who did so (21%), followed by WA with 29%. No respondents from Qld or Tas strongly disagreed that tasking agencies and operators had similar perspectives on the management of operational issues that impact safety (min. = 2) (Table G3).
Table G4: Percentage of respondents’ degree of agreement that tasking agencies and operators had similar perspectives on the management of operational issues that impact safety, by location64

Post hoc comparisons using the Dunn’s test were conducted between the 3 location groups of NSW, Vic and the remaining locations. They revealed a statistical difference in respondents’ degree of agreement that tasking agencies and operators had similar perspectives on the management of operational issues that impact safety, between NSW and the remaining locations (p < .001). The effect size was rrb = 0.41, indicating a medium effect. No other group comparisons were statistically different.
Tasking agencies’ interest in pilots’ safety concerns, by location
A Kruskal-Wallis test showed a statistical relationship between respondents’ primary location of operation and their degree of agreement that tasking agencies were genuinely interested in safety concerns raised by pilots, between at least 2 groups (H(2) = 28.61, p < .001, ɛ² = 0.20 [large effect]).
Table G5: Respondents’ degree of agreement that tasking agencies were genuinely interested in safety concerns raised by pilots, by location (N = 143)
| Location | Sample size | Median | Mode | MAD | Min | Max |
| NSW | 72 | 3 | 3 | 1 | 1 | 5 |
| Qld | 9 | 4 | 4 | 0 | 3 | 5 |
| SA | 12 | 4 | 4 | 1 | 2 | 5 |
| Tas | 11 | 4 | 4 | 1 | 2 | 5 |
| Vic | 32 | 4 | 4 | 1 | 1 | 5 |
| WA | 7 | 4 | 5 | 0 | 1 | 5 |
As shown in Table G5, NSW respondents were more likely to disagree that tasking agencies were genuinely interested in safety concerns raised by pilots (Mdn = 3), compared to respondents from all other locations (Mdn = 4). Just under a third (31%) of NSW respondents agreed or strongly agreed with the statement, compared to at least 66% for all other locations (Table G6). Correspondingly, NSW had the most respondents (29%) who disagreed or strongly disagreed that tasking agencies were genuinely interested in safety concerns raised by pilots, compared to a maximum of 14% for other locations. Qld respondents were most likely to agree or strongly agree with the statement (89%) with no respondents disagreeing or strongly disagreeing (min. = 3), followed by Tas with 82%.
Table G6: Percentage of respondents’ degree of agreement that tasking agencies were genuinely interested in safety concerns raised by pilots, by location

Post hoc comparisons using the Dunn’s test were conducted between the 3 location groups of NSW, Vic and the remaining locations. They revealed a statistical difference in respondents’ degree of agreement that tasking agencies were genuinely interested in safety concerns raised by pilots, between NSW and the remaining locations (p < .001) and NSW and Vic (p < .001). Effect sizes (rrb) for the comparisons indicated a large (rrb = 0.54) and a medium (rrb = 0.41) effect, respectively.
Purpose of safety investigationsThe objective of an ATSB safety investigation is to improve transport safety through:
In accordance with the TSI Act, the ATSB does not investigate for the purpose of taking administrative, regulatory or criminal action, and cannot apportion blame, assist in determining liability, or, as a general rule, assist in court proceedings. About ATSB reportsATSB safety investigation reports are developed in accordance with ATSB procedures and guidelines, and with regard to applicable international standards and instruments. Reports must include factual material of sufficient weight to support the investigation’s analysis and findings. At all times the ATSB endeavours to balance the use of material that could imply adverse comment with the need to properly explain what happened, and why, in a fair and unbiased manner. An explanation of terminology used in ATSB investigation reports is available here. Publishing informationReleased in accordance with section 25 of the Transport Safety Investigation Act 2003 Published by: Australian Transport Safety Bureau © Commonwealth of Australia 2026 Ownership of intellectual property rights in this publication Unless otherwise noted, copyright (and any other intellectual property rights, if any) in this report publication is owned by the Commonwealth of Australia. Creative Commons licence 
With the exception of the Commonwealth Coat of Arms, ATSB logo, and photos and graphics in which a third party holds copyright, this report is licensed under a Creative Commons Attribution 4.0 International licence. The CC BY 4.0 licence enables you to distribute, remix, adapt, and build upon our material in any medium or format, so long as attribution is given to the Australian Transport Safety Bureau. Copyright in material obtained from other agencies, private individuals or organisations, belongs to those agencies, individuals or organisations. Where you wish to use their material, you will need to contact them directly. |
- ^ DEECA was previously known as the Department of Environment, Land, Water and Planning (DELWP) until January 2023.
- ^ QFD was previously known as Queensland Fire and Emergency Services (QFES) until July 2024.
- ^ This information refers specifically to the 2025–26 fire season and is provided for the purposes of general background information about the Australian aerial firefighting industry only. It may not apply to the survey period of December 2022 to January 2023.
- ^ Certain contracted tasks or services associated with aerial firefighting may also be regulated under these CASR Parts or other CASR Parts. For example, a flight carrying passengers for hire or reward from one relevant fireground to a different relevant fireground or carrying media personnel or government personnel for the purpose of observing the extent of the ground fire and affected areas from the air, is not a fireground personnel carriage operation regulated under CASR Part 138. Instead, it may be regulated under either CASR Part 133 for helicopter air transport, or CASR Part 135 for smaller aeroplane air transport (CASA, 2025). Additionally, CASR Part 119 applies to all operators conducting, or intending to conduct, Australian air transport operations. All operators and pilots must also comply with Part 91 of CASR General operating and flight rules.
- ^ The descriptors ‘large helicopters’ and ‘small and medium helicopters’ are used as they appear in the NAFC 2025–2030 strategic approach (NAFC, 2025b). ‘Large’ helicopters equate to Rotary Wing (RW) type 1 helicopters, ‘medium’ to RW type 2 and ‘small’ to RW type 3 and 4 (refer to Appendix A for details of NAFC firebombing aircraft types in Australian aerial firefighting operations). LATs equate to Fixed Wing (FW) type 1 aircraft, while firebombers, reconnaissance and specialist intelligence aeroplanes could equate to the FW3, FW4 and FW5 type aircraft categories, depending on their weight and whether they are multi- or single-engine (Appendix A).
- ^ These are the primary roles performed by NAFC-contracted aircraft in the 2025–26 fire season only. There are other roles that may be fulfilled by these aircraft or non-NAFC-contracted aircraft, such as transport.
- ^ Standard deviation (SD) refers to the spread of data around the mean.
- ^ The median is the middle point in a dataset. When arranged from smallest to largest, half of the data points are smaller than the median and half of the data points are larger.
- ^ Median absolute deviation (MAD), which measures spread around the median instead of using standard deviation around the mean.
- ^ The type 1 error rate is the probability of rejecting the null hypothesis for a particular analysis when in fact it is true (a ‘false positive’). A null hypothesis states that there is no significant difference between groups.
- ^ A significance level of p < .05 therefore acts as a reference point to accept or reject the null hypothesis, and means there is only a 5% chance of incorrectly rejecting the null hypothesis.
- ^ The non-normal distribution and unequal variances were confirmed by a Shapiro-Wilk test (p < .05) and Levene’s test for equality of variances (p < .05) respectively.
- ^ The term effect size describes the strength of the difference or the strength of the association between variables. It refers to the magnitude of a significant effect.
- ^ Effect sizes have been included because as emphasised in the sixth edition of the American Psychological Association (APA) Publication Manual, estimates of effect sizes are considered part of the minimum requirements for reporting research (APA, 2009).
- ^ Mode refers to the most frequent response.
- ^ N refers to the total sample size, whereas a lowercase n refers to a subset of that sample.
- ^ Respondents were asked about ‘the previous 5 years’, which referred to the period 2017–2022. The following demographic factors all refer to this period.
- ^ Some respondents listed more than 1 aircraft type or model.
- ^ ARENA is a web-based national management support system maintained by NAFC for the tracking and tasking of aerial firefighting resources.
- ^ A primary contract is where an operator is contracted to provide aerial firefighting services to a fire agency for a specified period, usually for between 3 to 5 years. The contract can be through NAFC or directly with a fire agency. This contrasts with a CWN contract where the contracted operator is not committed to provide aerial firefighting services until after they are called for a ‘service period’ and may decline to provide the service. Under a CWN contract, service periods within a fire season are not guaranteed to occur.
- ^ Percentages do not sum to 100 due to rounding.
- ^ Although differences between the percentages of respondents’ main type of contract by location can be seen in Figure 11, once the groups’ small samples sizes were accounted for, the difference between groups was not statistically significant.
- ^ Mdn is the shortened version of median. The median scores provided are based on the Likert scale used, where 1 = Strongly disagree, 2 = Disagree, 3 = Neither agree nor disagree, 4 = Agree, 5 = Strongly agree.
- ^ The percentages in the graphs in this report may be slightly less than or greater than 100% due to rounding up or down.
- ^ Multiple factors in combination included: weather, traffic density, last light pressure, inadequate hazard assessment, fuel requirements and fatigue. Percentages sum to greater than 100% because some respondents provided more than one reason for refusing a flight.
- ^ Twenty-two of the 97 respondents (26%) did not provide details of what happened afterwards.
- ^ These percentages sum to greater than 100 because some respondents listed more than response.
- ^ Percentages sum to greater than 100% because some respondents provided more than one instance of refusing a flight.
- ^ The lowercase n is used for sample size to represent a sub-sample.
- ^ An AAS is a fire agency employee responsible for ‘supervising aerial fire suppression activities and other tactical missions from the air’ (AFAC, 2021), which includes ‘…directing other aircraft and any other resources assigned to the fire’ (NAFC, 2025c).
- ^ Airband radio refers to a specific selection of frequencies within the VHF radio spectrum expressly set aside for civil aviation. Airband radios typically use VHF frequencies in the 108 MHz – 137 MHz range. VHF airband channels are different to those used for land-based radios.
- ^ Flight following is a monitoring procedure whereby a responsible person keeps track of the progress of a flight through contact at regular pre-determined time intervals, and initiates Search and Rescue (SAR) procedures if contact is not maintained or there is some doubt as to the safety of the aircraft. Contact from the pilot in command (PIC) to maintain flight following normally occurs at 30-minute intervals.
- ^ Percentages sum to 101% due to rounding.
- ^ The given percentages of the 120 respondents will sum to more than 100% because some respondents listed multiple topics. For example, hypothetically, 90% of the total respondents could list one topic, while 40% (including some of the 90%) list another, and a further 25% list something else, and so on. Although this sums to more than 100%, it is still correct to say that ‘90%’ of respondents listed a certain topic, while ‘40%’ of the respondents listed another.
- ^ The term ‘near miss’ is used in the safety culture and systems safety literature to be synonymous with ‘close call’. For example, Reason (1997) defines near miss as ‘any event that could have had bad consequences, but did not’. The term near miss is also used in this way in relation to work health and safety (WHS). For example, near miss is defined in ISO 45001:2018, Occupational health and safety management systems, as ‘an incident where no injury and ill health occurs, but has the potential to do so’ and notes that it also may be referred to as a ‘near-hit’ or ‘close call’ (ISO, 2018). This is in contrast with the use of the term by survey respondents and other aviation industry members, who use near miss as synonymous with the ATSB term of ‘near collision’, which is defined in the ATSB Occurrence Category Taxonomy as ‘an aircraft that is airborne, taking off or landing comes into such close proximity with another aircraft, terrain, person or object where immediate evasive action was required or should have been taken’ (ATSB, 2026). The ATSB does not have an equivalent term for the more generalised understanding of near miss in the systems safety and WHS literatures, because the ATSB uses the ICAO definition of an incident as ‘an occurrence, other than an accident, associated with the operation of an aircraft which affects or could affect the safety of operation’ (emphasis added, ATSB, 2026).
- ^ N = 148 because there was one missing response to the questions on incidents experienced and reported. Percentages sum to more than 100 due to rounding.
- ^ These 6 respondents also include the one missing (unanswered) response from the previous 2 questions that consequently had N = 148.
- ^ The percentages of respondents who listed each incident type add up to more than 100 because respondents could list up to 5 incidents, with 86 respondents listing 199 incidents in total.
- ^ NT with n = 1 removed as an outlier from analysis.
- ^ Percentages do not sum to 100% due to rounding.
- ^ N = 148 because there was a missing response.
- ^ Percentages sum to less than 100 due to rounding.
- ^ Fifty-seven respondents reported never experiencing an incident, so there is 1 respondent who had not experienced an incident but believed they had needed to report one (for example, as a witness to an incident).
- ^ Refer to AS-2021-015afor further details of Reason’s (1997) core elements of a safety culture and the other commonly identified elements.
- ^ OzRunways is the name of an electronic application that provides aeronautical data, by OzRunways Pty Ltd, an aeronautical data service provider approved by CASA.
- ^ Automatic dependent surveillance-broadcast (ADS-B) is a surveillance technology that broadcasts the precise location of the aircraft through a digital data link.
- ^ Some percentages that are the same have different number values due to rounding.
- ^ Some percentages that are the same have different number values due to rounding.
- ^ 5 missing (unanswered) responses, including NT. Percentages sum to less than 100 due to rounding.
- ^ 6 missing (unanswered) responses, including NT.
- ^ Percentages sum to greater than 100 because respondents could list up to 3 threats.
- ^ CFIT: controlled flight into terrain.
- ^ Reproduced and adapted from NAFC (2023b). PR-001: Firebombing Aircraft Types, pp 1–3.
- ^ The Kruskal-Wallis test produces the H statistic. The degrees of freedom (df) for the Kruskal-Wallis test are the number of groups minus one (k-1) (Schmidt, 2010). In this case, there are 3 location groups (NSW, Vic, remaining locations), so the df = 2.
^ Epsilon-squared effect size interpretation (Cohen, 1988; see also Rea and Parker, 2014; Perez, 2026):
< 0.01 = negligible
0.01 = small
0.06 = medium
0.14 = large.- ^ Median Absolute Deviation (MAD), which measures spread around the median instead of using standard deviation around the mean; all table values are based on the Likert scale where 1 = Strongly disagree, 2 = Disagree, 3 = Neither agree nor disagree, 4 = Agree, 5 = Strongly agree.
- ^ NT was not included in tables presenting descriptive statistics because it had a sample size of n = 1 only, and it is not meaningful to reference descriptive statistics such as medians or percentages with such a small sample size. Further, reporting on the NT respondents’ rating for each question could compromise their anonymity. However, NT was included in inferential statistics as part of the ‘remaining locations’ group.
- ^ All inferential statistics for location were done using 3 groups only, to control for the relatively small sample sizes of all locations except NSW and Vic.
- ^ Rank biserial correlation effect size interpretation (Cohen, 1988): 0.10 = small, 0.30 = medium, ≥ 0.5 = large.
- ^ Some column totals are slightly less than or greater than 100% due to rounding up or down.
- ^ N = 147 because there was a missing (unanswered) response (in addition to NT being removed as an outlier).
- ^ These are the 52 respondents who had reported an incident between 2017 and 2022, minus Qld as an outlier with n = 1, resulting in N = 51. WA and NT did not have any respondents who had reported an incident between 2017 and 2022.
- ^ These are the 52 respondents who had reported an incident between 2017 and 2022, minus Qld as an outlier with n = 1, resulting in N = 51. WA and NT did not have any respondents who had reported an incident between 2017 and 2022.
- ^ Percentages do not sum exactly to 100 due to rounding.
Occurrence summary
| Investigation number | AS-2021-015b |
|---|---|
| Occurrence date | 22/10/2022 |
| Report release date | 21/10/2026 |
| Report status | Final |
| Investigation type | Safety study |
| Mode of transport | Aviation |